BUSINESSES
Impact of individual actors and
cooperative initiatives on global
AUTHORS
NewClimate Institute, Data-Driven Lab, PBL Netherlands Environmental Assessment Agency, German Development Institute/ Deutsches Institut für Entwicklungspolitik (DIE), Blavatnik School of Government, University of Oxford.
SUGGESTED CITATION
NewClimate Institute, Data-Driven Lab, PBL, German Development Institute/Deutsches Institut für Entwicklungspolitik (DIE), Blavatnik School of Government, University of Oxford. Global climate action from cities, regions and businesses: Impact of individual actors and cooperative initiatives on global and national emissions. 2019 edition. Research report prepared by the team of: Takeshi Kuramochi, Swithin Lui, Niklas Höhne, Sybrig Smit, Maria Jose de Villafranca Casas, Frederic Hans, Leonardo Nascimento, Paola Tanguy, Angel Hsu, Amy Weinfurter, Zhi Yi Yeo, Yunsoo Kim, Mia Raghavan, Claire Inciong Krummenacher, Yihao Xie, Mark Roelfsema, Sander Chan, Thomas Hale.
ACKNOWLEDGEMENTS
We thank the organizations and individuals listed below, whose assistance and feedback greatly enhanced this report:
This work draws on data provided by CDP, Global Covenant of Mayors for Climate & Energy, Global Covenant of Mayors (EU Secretariat), States and Regions Annual disclosure to CDP, in partnership with The Climate Group, and ICLEI carbonn® Climate Registry. It also draws on data from the C40 Cities Climate Leadership Group, Under2 Coalition (Secretariat: The Climate Group), the ClimateSouth project, United States Climate Alliance, United States Climate Mayors, and We Are Still In. Xiyao Fu and James Sun helped gather data on Chinese cities‘ climate commitments. We thank Andrew Clapper and Andres Chang (CDP) for their support on data preparation and the pre-analysis of the company-level actions. We also thank Nicklas Forsell (International Institute for Applied Systems Analysis) on the land-use sector data discussions, and Junichi Fujino (Institute for Global Environmental Strategies, Japan) and Yuki Ochi (E-konzal) for subnational actors data in Japan.
This work was funded by ClimateWorks Foundation (grant no. 19-1383). We thank the ClimateWorks Foundation, Mission 2020, and the United Nations Framework Convention on Climate Change (UNFCCC) Secretariat for convening several working groups and workshops to discuss Climate Action Methodology, Data and Analysis (CAMDA) across different efforts to analyse climate action. Similarly, we thank all those who participated in these CAMDA work streams and discussions, for providing feedback and suggestions on the scope and content of this report. Special thanks go to Todd Edwards and Sara Stefanini (Mission 2020), Allison Fajans-Turner and Lauren Wolahan (ClimateNexus) and Nicolas Fux and Victoria Fischdick (NewClimate Institute) for providing valuable feedback and support on the communications and outreach of this report.
Data on output performance and the scope and scale of cooperative climate action was collected by the “Strengthening non-state climate action in the Global South” project (ClimateSouth) which is generously supported by the Europe and Global Challenges Fund, a joint initiative of the Volkswagen Foundation, the Sveriges Riksbank, and the Wellcome Trust. The project received additional support from German Development Institute/Deutsches Institut für Entwicklungspolitik’s “Klimalog” project, generously funded by the German Federal Ministry of Economic Cooperation and Development (BMZ). We thank Malin Gütschow, Sara Posa, Miriam Lia Cangussu Tomaz Garcia, Eugene Tingwey and Benedetta Nimshani Khawe Thanthrige for their support on data gathering.
Many external reviewers also provided critical feedback on this report. Our thanks to: Tom van Ierland, Olivia Gippner and Miles Perry (Directorate General Climate Change, European Commission); Shannon McDaniel (Global Covenant of Mayors for Climate & Energy); Pieter Boot and Michel den Elzen (PBL Netherlands Environmental Assessment Agency); Ken Tanaka (World Wide Fund for Nature Japan); Yann Robiou du Pont (Institute for Sustainable Development and International Relations: IDDRI); Ann Gardiner (SQ Consult); Julie Cerqueira and Kristin Igusky (United States Climate Alliance); Allison Fajans-Turner (Climate Nexus); Felipe Bittencourt (WayCarbon); Lu Sun and Molly Wang (C40 Cities Climate Leadership Network); Meian Chen (innovative Green Development Program); Jean-Charles Seghers, Henry Quintana and Milimer Morgado (The Climate Group); Maryke van Staden and Chang Deng-Beck (ICLEI – Local Governments for Sustainability); Manjyot Ahluwalia and Mariana Panuncio-Feldman (World Wide Fund for Nature U.S.); and Carla Frisch (Rocky Mountain Institute). We also thank Caren Weeks and Nicole Winter for their contributions to the report’s design and layout.
CITIES, REGIONS AND BUSINESS
GIVE CONFIDENCE TO BOOST
CLIMATE ACTION TO NEW HEIGHTS
By Andrew Higham, Chief Executive of Mission 2020 and Visiting Fellow of Practice at the University of Oxford’s Blavatnik School of Government
Climate change is ravaging our planet, and we aren’t doing anywhere near enough to stem it.
The fire is engulfing our home, and we’re spraying droplets. We know full well that all governments need to ramp up their efforts to slash greenhouse gas emissions faster than many think is possible. We need to limit the global temperature rise to 1.5°C if we want to avoid trillions of dollars in damages and millions of deaths and species extinctions, but we’re headed for more than 3°C.
Yet there is a glimmer of hope: countries are closer than they think to meeting and surpassing the goals they set under the Paris Agreement, thanks to commitments by cities, regions and businesses, according to this comprehensive analysis of climate action outside of national governments. Add up the commitments made by local governments and companies — in 10 of the world’s highest-emitting economies and worldwide through partnership initiatives — and the world is on track to a 2°C limit. This means governments are farther ahead in the race to save humanity than we thought, which gives them more room — and confidence — to shoot for 1.5°C maximum.
Of course, this extra boost should not be taken for granted. We’re talking about the potential for cities, regions and businesses to reduce emissions — if commitments are met and scaled up.
It won’t be easy. Most of that contribution to a 2°C limit comes from international climate initiatives, where cities, companies, civil society, national governments and others sign up to joint efforts such as boosting energy efficiency, powering company operations on 100 percent renewables, or ending deforestation by 2030. These networks encourage ambition and innovation, but their goals can be much harder to achieve and their memberships tougher to expand. Still, as governments are asked to jack up their commitments by 2020 under the Paris Agreement, this
study tells us they have untapped potential in their own backyards. It shows there is ambition to do more, especially through international partnerships. Now governments must harness that potential, strengthen it considerably, and help turn it into reality, while cities, regions and businesses must make sure they fulfill their promises.
Just look at how local government and corporate commitments contribute to climate action in the 10 high-emitting economies examined in this report.
In the European Union, they could lower emissions by 48 percent by 2030, from 1990 levels. That’s well beyond the bloc’s Paris goal of at least 40 percent. Suddenly, a new goal of 55 percent by 2030, as many in Brussels are calling for, doesn’t seem like such a big jump.
In India, they would add a 9 percent reduction compared to projections for national policies by 2030. The country is already on track to surpass its Paris goal without this extra contribution.
These commitments are especially important in countries where national leaders are backtracking on climate change, like the United States and Brazil. Local governments and companies could help the US meet its pledge for 2025. International initiatives could help Brazil cut emissions by up to 36 percent below what current national policies would do by 2030.
The United Nations’ Climate Action Summit on September 23, 2019 is a moment of reckoning, in a year that has seen deadly storms tear through southern Africa and the Bahamas, fires wipe out parts of the Amazon rainforest, Arctic sea ice melt to new lows, and millions of people worldwide — many inspired by children — protesting decades of inaction.
Secretary-General António Guterres is calling on countries to respond by immediately ending support for fossil fuels and taxing them. Swift response, like ending new coal plant construction by 2020, may seem extreme. But it’s not, because the space, willingness and ambition to do more is already there. Governments just need to foster this energy, and push it to new heights.
A B B R E V I A T I O N S A N D A C R O N Y M S
°C degrees Celsius
ACA Alliances for Climate Action AREI Africa Renewable Energy Initiative
BAU Business-as-usual C3 Climate Change Council
C40 C40 Cities for Climate Leadership Group CAATW Collaborative Climate Action Across the Air
Transport World Initiative
CCAB Corporate Climate Action Benchmark CCAC Climate & Clean Air Coalition
CICC Mexico’s Inter-secretarial Commission
on Climate Change
CO2e Carbon dioxide equivalent
COP Conference of the Parties
CPS “Current national policies” scenario DIE German Development Institute/Deutsches
Institut für Entwicklungspolitik
ETIP PV European Technology & Innovation Platform
Photovoltaic Initiative
EU European Union FOF Function-Output-Fit G20 Group of Twenty
GCAS Global Climate Action Summit
GCFTF Governors’ Climate and Forests Task Force GCoM Global Covenant of Mayors for Climate & Energy
GDP Gross Domestic Product GFEI Global Fuel Economy Initiative
GGA Global Geothermal Alliance GHG Greenhouse gas
Gt billion tonnes = 109 tonnes
GW Gigawatt = 109 watt
GWP Global warming potential HFC Hydrofluorocarbons
ICI International Cooperative Initiative
IIASA International Institute for Applied Systems Analysis IPCC Intergovernmental Panel on Climate Change
JCI Japan Climate Initiative
ABBREVIATIONS AND ACRONYMS
Mt Million tonnes = 106 tonnes
NAZCA Non-state Actor Zone for Climate Action
(NAZCA) portal; rebranded as the Global Climate Action portal
NDC Nationally Determined Contribution NDRC China’s National Development and
Reform Commission
NYDF New York Declaration on Forests Initiative OECD Organisation for Economic Co-operation
and Development
PACCM Mexico City’s climate action plan
PBL PBL Netherlands Environmental Assessment
Agency
RAD-GRK Indonesia Local Action Plan for Greenhouse
Gas Reduction
RAN-GRK Indonesia National Action Plan for Greenhouse
Gas Reduction
REDD+ United Nations Collaborative Programme on
Reducing Emissions from Deforestation and Forest Degradation in Developing Countries
RoW Rest of the World
SBTi Science-Based Targets Initiative
SCAN-tool
Ambition to Action’s SDG Climate Action Nexus Tool
SDG Sustainable Development Goal
SEAD Super-efficient Equipment and Appliance
Deployment Initiative
SLCP Short-lived climate pollutant
SR1.5 Special report on warming of 1.5°C by the
Intergovernmental Panel on Climate Change
TWh Terawatt-hour = 1012 watt-hour
U4E United for Efficiency Initiative UN United Nations
UNEP United Nations Environment Programme UNFCCC United Nations Framework Convention on
Climate Change
US United States USD United States Dollars
01
Introduction . . . .12
02
Landscape of subnational and non-state climate action . . .15
2.1 Individual cities, regions and businesses . . . .16
2.2 International cooperative initiatives . . . .21
03
Global GHG emission reduction potential of subnational and non-state climate actors . . .28
3.1 Individual actors’ commitments: potential emissions reductions . . . .32
3.2 International cooperative initiatives . . . .36
04
Linkages between non-state climate action and SDGs . . .42
4.1 Explicit linkages between mitigation-focused cooperative initiatives and SDGs . .45
4.2 Potential synergies and trade-offs . . . .45
05
Assessment of subnational and non-state climate action for large-emitting regions . . .49
5.1 Brazil . . . .50 5.3 Canada . . . .54 5.4 China . . . .57 5.5 European Union . . . .60 5.6 India . . . .63 5.7 Indonesia . . . .66 5.8 Japan . . . .69 5.9 Mexico . . . .72 5.10 South Africa . . . .74 5.11 United States . . . .78
06
Conclusion . . .81
6.1 Summary of the key findings . . . .82
6.2 Recommendations . . . .83
References . . . .86
Regions
Companies
Cities
ES
EXECUTIVE
SUMMARY
Cities, regions, and business are vital for achieving national and global climate change goals. Their climate action helps countries deliver and in some cases over-achieve current national pledges under the Paris Agreement. Globally, existing initiatives by these actors, in partnership with national governments, could put the world on track to limit global warming to 2°C, if they deliver their stated goals.
While not yet sufficient to stay below the 1.5°C limit, climate action by cities, regions, and business allows national governments to raise their commitments and helps keep global limits within reach. The Intergovernmental Panel on Climate Change (IPCC) 2018 special report on warming of 1.5 °C (SR1.5) emphasised the need for all actors — state, sub-national, and non-state — to strengthen climate action, and highlighted cooperation between actors as a critical mechanism for halving emissions by 2030 in order to meet the 1.5°C goal.
In addition to helping achieve the goals of the Paris Agreement, climate action by cities, regions and business can support the delivery of other Sustainable Development Goals (SDGs) by 2030. Given the increasing attention to synergies and potentially negative impacts between climate action and other SDGs, cities, regions and business can help ensure that global climate efforts are implemented in a way that supports, rather than hinders, local sustainable development.
This report is the second global analysis of local and regional government and corporate climate contributions, updating “Global Climate Action from Cities, Regions, and Companies” launched at the 2018 Global Climate Action Summit. The 2018 report established the strong potential of subnational and non-state actors to help avoid climate change. This year, we aim to inform the September 2019 UN Climate Action Summit on how mitigation by cities, regions and companies could help national governments
boost their ambition beyond their current targets, to come in line with the Paris Agreement’s goals. This report aggregates the climate mitigation commitments reported to some of the world’s largest voluntary pledging and reporting platforms for city, region, and company climate commitments. The analysis was conducted at a global level as well as for ten major emitting economies: Brazil, Canada, China, the European Union (EU), India, Indonesia, Japan, Mexico, South Africa and the United States (US). In addition, the report features the following new components:
An updated assessment of international cooperative initiatives (ICIs) and whether their outputs are consistent with their main functions;
An updated assessment of synergies and trade-offs between non-state international initiatives and SDGs.
Climate action by cities, regions,
and business represents a significant
portion of the world economy and
population
Cities, regions and companies engaged in climate action (including mitigation, adaptation, and supporting activities) represent a significant portion of the world economy and population. While exact numbers vary across studies, the broad universe of climate action includes over 10,200 cities and regions and over 6,000 businesses recording climate action efforts in 2018.
This report focuses on emissions reductions, and therefore analyses only a subset of this wider universe of climate action. We zoom in on those cities, regions and companies in ten of the world’s major emitting economies that have made quantifiable commitments to reduce greenhouse gas emissions. These include:
E X E C U T I V E S U M M A R Y
Approximately 6,000 cities and regions have made commitments to reduce GHG emissions, and share supporting information that makes it possible to quantify their potential impact. The local and regional governments making these commitments represent populations that rival some of the world’s largest countries: participating cities represent a collective population of 579 million – more than the combined population of the US and Brazil – while participating regions are home to approximately 514 million people, about four times the population of Japan.
Roughly 1,500 companies report quantifiable climate action commitments to CDP, representing a combined revenue of more than 20.5 trillion USD, the size of the US GDP.
More than 300 international cooperative initiatives (ICIs) – joint projects in which cities, regions, and business work together across borders, sometimes with national governments and international organisations – also facilitate climate action. We report on the performance of 190 of these ICIs whether initiatives have been taking appropriate steps to deliver their goals, and how this “output performance” has developed over the last six years. Among those that scored well in the output performance assessment, we selected 17 initiatives that have wide emissions coverage and quantified their GHG emissions reduction potential.
Our report therefore focuses on the subset of sub-national, non-state and cooperative climate action most relevant for emissions reductions. It represents, to the authors’ knowledge, the most comprehensive analysis to date of the mitigation potential of subnational and non-state climate action. However, despite significant advances in data availability and analysis over the past few years, it remains extraordinarily difficult to obtain a comprehensive measure of what all cities, regions, businesses and other actors around the world are doing on climate change. This report uses the best available current data reported through global networks like the Global Covenant of Mayors for Climate & Energy, CDP, the carbonn® Climate Registry, the Climate Initiatives Platform, among others. They by no means, however, capture the full range or diversity of climate actions occurring globally, particularly those actions that are difficult to quantify, occur in underrepresented regions,
Cities, regions, and business can help
close the global emissions gap
This 2019 report reinforces subnational and non-state actors’ significant contributions in reducing emissions to bring the world closer to achieving global climate goals. Subnational and non-state actor emissions reductions are calculated based on the commitments they have made and reported to different international databases, accounting for overlaps between actor groups to ensure we do not “double count” actions.
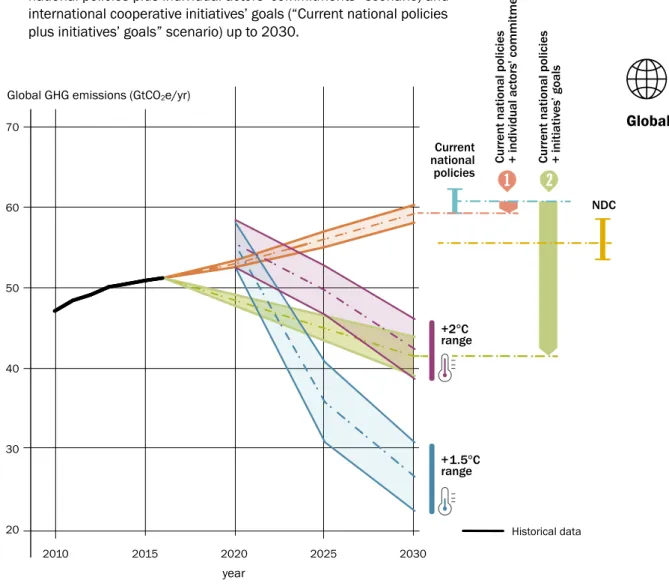
Overall, the report finds that global GHG emissions in 2030 would be 1.2 to 2.0 GtCO2e lower than the current national policies scenario (Figure ES1), if the recorded and quantified commitments by individual cities, regions and companies in the ten major emitting economies are fully implemented, and if such efforts do not change the pace of action elsewhere, (“Current national policies plus individual actors’ commitments” scenario). This range is roughly equivalent to Canada and Japan’s combined emissions in 2016. If nationally determined contributions (NDCs) to the Paris Agreement are fully implemented, these commitments by cities, regions, and businesses in just 10 economies could deliver additional emissions reductions of 0.4 to 0.7 GtCO2e in 2030 (“NDCs plus individual actors’ commitments” scenario).
This analysis takes into account the fact that multiple actors aim to reduce the same emissions. We compared emissions levels in the pledged commitments by cities, regions and businesses with the emissions levels implied by the implementation of current national (and EU) policies. For example, if a city was nested in a region and both had the same level of ambition, only the region’s actions were counted (see technical Annex).
The biggest potential impact on emissions, however, comes from international climate initiatives. The 17 initiatives we analyse in which cities, regions, businesses, and other subnational and non-state actors work together, often partnering with governments or international organizations, have the potential to reduce global GHG emissions significantly beyond the emissions levels expected from current national policies and NDCs. Our analysis shows that ICIs (“current national policies plus initiatives goals” scenario) can reduce global emissions in 2030 by 18 to 21
9
Global
2010 2015
Global GHG emissions (GtCO2e/yr)
2020 2025 2030
20000
32000
44000
56000
68000
80000
20000 32000 44000 56000 68000 80000 20000 32000 44000 56000 68000 80000 year 70 60 50 40 30 20 0 300 600 900 1200 0 300 600 900 1200 0 3000 6000 9000 12000 0 3000 6000 9000 12000 R egions Ener gy Ef ficiency Buildings Transpor t R ene w able Ener gy Business For es tr y N on-C O2 Cities & R egions Cities Ener gy End-use com panies Electr icity -pr o-ducing com panies Total emissions reductions by actors Total emissions reductions by sector and initiatives (see zoom in for details) 0 400 800 0 300 600 900 1,2001
2
1
2
Current national policies +2°C range +1.5°C range NDC Current national policies
+ individual act
or
s' commitments
Historical data
Cur
rent national policies
+ initiativ
es
’ goals
Emissions reduction potential of individual actors beyond current national policies, by actor group
Emissions reduction potential of international cooperative initiatives beyond current national policies, by sector
Figure ES1. Potential global greenhouse gas (GHG) emissions reductions resulting
from full implementation of individual actors’ targets (“current
national policies plus individual actors’ commitments” scenario) and
international cooperative initiatives’ goals (“Current national policies
plus initiatives’ goals” scenario) up to 2030.
Data sources: current national policies scenario (CPS) projections from Climate Action Tracker (2018b) supplemented with land use, land-use change and forestry (LULUCF) emissions projections adapted from Forsell et al. (2016), NDC (unconditional) scenario projections from Climate Action Tracker (2018b), 2°C (in 2100, 66% chance) and 1.5°C (in 2100, 66% chance) pathways from UNEP (2018) adapted to global warming potentials (GWPs) from the IPCC Fourth Assessment Report based on the 2016 historical data from PRIMAP database (Gütschow, Jeffery and Gieseke, 2019), impact of individual actors and initiatives: this study.
projections (60 to 63 GtCO2e/year), assuming all initiatives analysed meet their goals and efforts do not change the course of action elsewhere (Figure ES1).
If delivered, reductions by these 17 ICIs would close the global emissions gap to 2°C of warming in 2030 (in 2100, 66% chance), although a significant gap remains for
reaching 1.5°C (in 2100, 66% chance). If countries also implement the unconditional NDCs submitted under the Paris Agreement (“NDCs plus initiatives’ goals” scenario, 55 to 58 GtCO2e/year in 2030), the initiatives have an additional potential aggregated impact of 15 to 18 GtCO2e/ year globally in 2030.
Cities, regions, and business can help
countries (over)achieve their NDCs,
creating space for greater ambition
Our results show that cities, regions and companies could help countries deliver their NDCs by taking ambitious actions beyond national policies. In particular we find that the aggregate of individual commitments by cities, regions and companies alone could deliver more emissions reductions than the current unconditional NDCs pledged by governments in a number of countries:
For the EU, the full implementation of recorded and quantified individual commitments by cities, regions and businesses could (in addition to current national policies) lead to reductions as low as 48% in 2030 from 1990 levels (lower bound of our range, including land use, land-use change and forestry: LULUCF). These values are beyond the current NDC of “at least 40%”, although the EU’s NDC target does not specify the extent to which LULUCF sinks would be accounted for.
For India, individual commitments would bring down emissions to about 3,800 to 4,200 MtCO2e/year in 2030, 5.5% below the current national policy scenario projections and about 1,100 to 1,900 MtCO2e/year lower compared to the NDC target emission levels.
For Japan, individual commitments would bring down emissions by 8% to 12% below the current policies scenario projections by 2030 and up to 70 MtCO2e/year lower than below the NDC target emission levels. Commitments by individual cities, regions and companies can also help maintain momentum in countries where national governments are rolling back policies:
Importantly, for the US, the aggregate potential impact of recorded and quantified individual commitments would bring the country close to the upper bound (or least ambitious end) of its 2025 NDC target. The full implementation of initiatives’ goals would reduce emissions even beyond the original NDC.
For Brazil, quantified individual commitments by cities, regions and companies would reduce emissions in 2030 by an additional 40 to 80 MtCO2e/year below current national policies scenario projections
These results have a number of important implications. First, sub- and non-state climate action is helping some countries achieve or over-achieve their NDCs. Second, many countries could raise their NDC ambition by incorporating existing commitments by cities, regions and companies in their national climate policy formulation process. Third, strengthened collaboration between national governments and sub-national and non-state actors together can contribute to sectoral transformations needed for a decarbonised society in line with 1.5°C. We find for a few economies such as the European Union and the United States that the emissions trajectories for “current policies plus initiatives’ goals” scenarios are roughly consistent with net zero CO2 or GHG emissions around mid-21st century. While many national governments do not seem to fully acknowledge non-state climate action in their climate policy formulation, the results clearly show that national governments could leverage cooperative initiatives to put the world on track to reach long-term carbon neutrality consistent with the Paris Agreement’s long-term temperature goal. It is therefore crucial that national governments enhance cooperation with these initiatives to accelerate efforts toward long-term carbon neutrality.
Implementing city, region, and
business climate action can help
countries achieve their Sustainable
Development Goals
It is clear that mitigating climate change can contribute to broader sustainable development. But it must be aligned to ensure that climate action benefits development, rather than disadvantaging certain populations. The shift to low-carbon industries, for example, must be done in a way that creates new job opportunities across the economy. By contrast, a lack of reflection on how broader sustainability affects climate change may result in missed opportunities and limit the political sustainability of climate action. Cooperative climate initiatives with high mitigation potential have highlighted explicit linkages between their efforts and other sustainability outcomes. Besides SDG 13 (climate actions), initiatives frequently link to SDG 7 (affordable and clean energy); SDG 9 (industry, innovation and infrastructure); SDG 17 (partnership for the goals), SDG 11 (sustainable cities and communities), and SDG
12 (sustainable consumption and production). Explicit mentions mainly concern synergies, however, initiatives are less likely to directly mention possible negative side effects. We find that SDG 11 (sustainable cities and communities), SDG 8 (decent work and economic growth), SDG 15 (life on land), SDG 2 (zero hunger), and SDG 1 (no poverty) represent areas in which trade-offs are most likely to occur, if not managed well.
There is more potential for positive rather than negative effects of climate action on other sustainable development goals, and vice versa. Still, subnational and non-state initiatives should pay closer attention to the potential problems in order to avoid unintended consequences. Making the possible trade-offs explicit, and devising strategies to avoid them, will be necessary to more closely align and simultaneously deliver on climate and sustainability goals.
01
The role of cities, regions and businesses in global climate action has become more important than ever. The special report on warming of 1.5°C (SR1.5) by the Intergovernmental Panel on Climate Change (IPCC) emphasised the need for strengthened and timely action to reduce greenhouse gas (GHG) emissions by all subnational and non-state actors as well as cooperation and partnerships between countries and subnational and non-state actors to limit global warming to 1.5°C (IPCC, 2018b).
Sub-national and non-state climate action is not an alternative to action by national governments; indeed, the literature suggests that subnational and non-state climate action is largely complementary to national policies (Andonova, Hale and Roger, 2017; Roger, Hale and Andonova, 2017). Understanding the potential of subnational and non-state climate action alongside national governments is critical because the mitigation potential of cities, regions, and business is significant. A first quantification of the mitigation commitments of cities, regions and businesses published by Data-Driven Yale, NewClimate Institute and PBL at the occasion of the Global Climate Action Summit (GCAS) held in September 2018 (Data-Driven Yale, NewClimate Institute and PBL, 2018) showed that the emissions gap between the current policies scenario and 1.5°C scenario pathways could potentially be entirely closed if their ambition fully materialised. Subnational and non-state actors are also increasingly responding to calls for action – the GCAS triggered about 500 commitments to strengthen action from a range of subnational and non-state actors (UNFCCC, 2018), some which are leading climate action in countries where national governments are rolling back policies.
Under the Paris Agreement and its “ratchet” mechanism, countries are requested to update their current nationally determined contributions (NDCs) by 2020 with more ambitious ones. Although subnational and non-state actors could potentially become key drivers of strengthened country-level climate action, national governments overall did not fully leverage the potential subnational and non-state actor contributions to the first NDCs (Hsu et al., 2019). It is therefore important to provide national governments with evidence of subnational and non-state climate action to support the necessary increase in ambition.
Climate action is part of the (SDGs), and there is an increasing attention on synergies and trade-offs between climate action and the other UN SDGs. The role of subnational and non-state actors is crucial in this process. The participants of the first UN Climate Action and SDGs Synergy Conference held in April 2019 underscored the key role of subnational and local governments in simultaneously addressing climate change and sustainable development (UN, 2019). The management of direct trade-offs would be crucial to ensure a just transition and that “no one is left behind”. To date there are a limited number of studies that assessed quantitatively or qualitatively the potential synergies and trade-offs between SDGs and subnational and non-state climate action.
Against the aforementioned backdrop, this report updates the 2018 Data-Driven Yale et al. (Data-Driven Yale, NewClimate Institute and PBL, 2018) report launched at the occasion of the GCAS to provide the latest insights into the potential aggregate impact of climate change mitigation action from cities, regions and companies up to 2030, and aims to inform the September 2019 UN Climate Action Summit, which convenes a range of actors from around the world, on how subnational and non-state
I N T R O D U C T I O N
actor climate change mitigation action could help national governments to boost ambition in line with the long-term goal of the Paris Agreement. As in the 2018 report, we aggregate climate mitigation commitments made by cities, regions, companies and other non-state actors to some of the world’s largest voluntary platforms for pledging and reporting on climate commitments. The analysis was conducted at a global level as well as for ten major emitting economies: Brazil, Canada, China, the European Union (EU), India, Indonesia, Japan, Mexico, South Africa, and the United States (US). In addition, the report also features the following new components:
Up-to-date assessment of synergies and trade-offs between non-state international initiatives and SDGs; Up-to-date assessment of international cooperative initiatives (ICIs) on whether they are producing outputs that are consistent with their main functions.
Despite significant advances in data availability and analysis over the past several years, it remains extraordinarily difficult to obtain a comprehensive measure of what all cities, regions, businesses, and other actors around the world are doing on climate change. The world of climate action is vast and heterogenous and cannot be fully captured by current methods. The present report uses the best available current data, looking at sub- and non-state climate action that is reported to global databases and networks like the Global Covenant of Mayors, CDP, ICLEI’s carbonn® Climate Registry and the Climate Initiatives Platform, plus the authors’ own efforts. Such efforts tend to identify climate action that is explicitly described as “climate” related, and that has greater visibility from linkages to international networks. As such, the present analysis presents a relatively conservative estimate for the scale and scope of climate commitments, and is likely systematically underrepresenting smaller scale actions, those that are not formally institutionalised, or those not described or presented in English or other major languages. To cite just one example, the UN’s Global Climate Action (NAZCA) portal records just three instances of climate action in Kenya, but an independent survey of companies listed on the Nairobi Stock Exchange found nearly 50 companies that had a concrete emissions reduction target (ClimateSouth, 2018). Fortunately, an increasing number of platforms are emerging to catalyse, support, and track
climate action in the global South. ActionLAC provides a leading example in Latin America, surveying existing regional networks and offering online webinars on climate action in which more than 600 regional stakeholders have participated (ActionLAC, 2019). Similarly, Alliances for Climate Action (ACA, 2019) and its member domestic multi-stakeholder coalitions are systematising the climate commitments made by subnational and non-state actor signatories.
This report is structured as follows. The global landscape of individual commitments by cities, regions and companies as well as of ICIs is presented in Section 2. Section 3 then presents our updated assessment on the global potential impact of subnational and non-state actors’ actions on GHG emissions. Section 4 presents the key findings on the analysis of linkages between SDGs and ICIs. Section 5 compiles the key findings from the previous sections for each of the ten major emitting economies. Finally, Section 6 summarises the findings of this study and draws recommendations for policymakers.
02
LANDSCAPE OF
SUBNATIONAL AND
NON-STATE
CLIMATE ACTION
The following section characterises the landscape of subnational and non-state climate change mitigation commitments recorded through some of the world’s largest voluntary climate pledging and reporting platforms. While our analysis is not comprehensive – there are instances of global climate action not captured in the platforms we draw from – it provides a window into trends in participation and non-state and subnational climate action. We also provide a descriptive overview of the various timeframes, ambition, and sectors of these actors’ mitigation targets.
This section first assesses recorded and quantifiable commitments of individual cities, regions, and companies (section 2.1). We then provide an overview of multi-actor “international cooperative initiatives”: multi-stakeholder arrangements through which subnational and non-state actors cooperate across borders to mitigate or adapt to climate change, often in partnership with national governments or international organizations.
2.1
INDIVIDUAL CITIES, REGIONS
AND BUSINESSES
This analysis focuses on a subset of the wider universe of cities,1 regions,2 companies, investors, civil society groups, universities, religious organizations, and investors pledging to reduce emissions, foster resilience, and unlock financing to address climate change. Specifically, we gathered data from climate action networks and international cooperative initiatives that regularly collect and report information on their members (see Box 1). We narrowed this selection further by focusing on cities, regions, and company participants in these networks that have also set quantifiable commitments3 to reduce their GHG emissions.
Over 10,200 subnational actors (cities and regions) participate in various membership networks and cooperative initiatives (see Box 1). Over 6,000 of them or about 58% have made quantifiable commitments to reduce GHG emissions in 10 of the world’s largest emitting economies: Brazil, Canada, China, the EU, India, Indonesia, Japan, Mexico, South Africa, and the US. Including the current membership of the EU, these subnational actors making quantifiable commitments span 37 countries. Similarly, out of the more than 6,000 companies that responded to CDP’s 2018 climate change questionnaire, over 1,500 companies have made quantifiable commitments to reduce GHG emissions in the ten major emitting economies investigated in this study. The sections below explore trends in the cities, regions, and companies making quantifiable commitments to reduce GHG emissions, and in the types of pledges they commit to.
L A N D S C A P E O F S U B N A T I O N A L A N D N O N - S T A T E C L I M A T E A C T I O N
1 “Cities” throughout this report generally refer to administrative units that pledge commitments to a climate action platform, which include municipalities, towns, urban communities, districts, and counties defined by the actors themselves.
2 ”Regions,” including US and Indian states, German Länder, and Chinese provinces, are larger administrative units that are generally broader in geographic scope and population than cities. They usually have separate governing bodies from national and city governments but encompass lower administrative levels of government; often, they are the first administrative level below the national government. Regions can also include councils of subnational governments acting together.
BOX 1:
CLIMATE ACTION NETWORKS INFORMING THIS ANALYSIS
The number of nonstate and subnational actors pledging climate actions through various membership networks and cooperative initiatives has grown steadily over the last few years. For this analysis of actors making individual commitments through these platforms, we draw from:
Alliance of Peak Pioneering Cities
C40 Cities for Climate Leadership Group
ICLEI – Local Governments for Sustainability
carbonn
®Climate Registry
CDP
The Compact of States and Regions
Global Covenant of Mayors for Climate & Energy
Global Covenant of Mayors for Climate & Energy
(EU Secretariat)
Under2 Coalition
United States Climate Alliance
Climate Mayors
We Are Still In
These networks, initiatives and platforms define membership, engagement and commitments to climate action in various ways and require members to report varying levels of information regarding their pledges. Some networks focus primarily on galvanizing participation in climate action, while others ask participants to report data and progress on targets annually. Several networks require members to pledge specific climate actions. Signatories of the Global Covenant of Mayors for Climate & Energy (EU Secretariat), for instance, support the implementation of the EU’s 40% GHG reduction target by 2030 (EU Covenant of Mayors, 2018).
We collected subnational data by working directly with networks and by collecting publicly available data from their platforms. We worked directly with CDP to include their 2018 Climate Investor and Supply Chain Disclosure Surveys results as the primary source of company-level data. We then identified actors making “quantifiable” commitments to reduce GHG emissions – that is, commitments with a clear target year, emissions reduction target, base year, and base year emissions (see Technical Annex I for more details on the definition and selection of quantifiable targets).
The full universe of bottom-up climate action expands far beyond this subset of actors pledging quantifiable commitments through these climate action platforms. Studies have shown the full extent of climate action often goes un-reported, particularly among actors from the Global South (Chan and Hale, 2015; Hsu et al., 2016; Widerberg and Stripple, 2016; UNFCCC, 2018). Awareness of and resources for reporting and recording climate commitments vary across economic, geographic, and national contexts, and many emissions reductions may go unrecorded.
Additionally, many commitments that lack quantifiable information may still lower emissions, either directly or by creating enabling conditions for climate action. For instance, efforts to establish climate councils or working groups can build the knowledge and stakeholder buy-in needed to later set and meet a mitigation goal. Similarly, while we explore trends in mitigation targets’ timelines and goals, this information is meant to be descriptive, rather than evaluative. While all actors will need to shift to a decarbonised society to keep the goals of the Paris Agreement within reach, the most appropriate target and timeline may vary according to actors’ emissions profiles, geography, and resources.
While not comprehensive of all actors and climate actions globally, the data evaluated for this study provides a detailed window into bottom-up mitigation efforts, identifying trends, patterns, and gaps in cities, companies and state and regions’ responses to climate change.
L A N D S C A P E O F S U B N A T I O N A L A N D N O N - S T A T E C L I M A T E A C T I O N
2.1.1
CITIES AND REGIONS
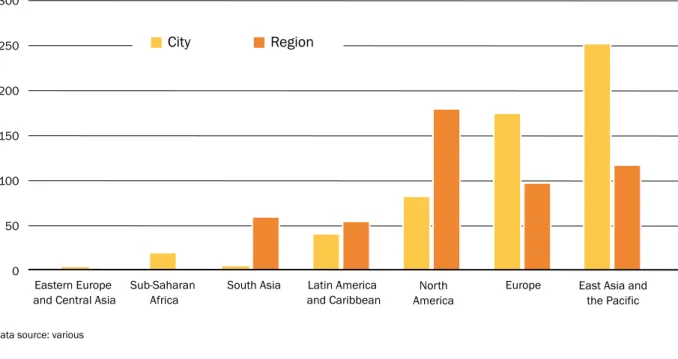
This section focuses on the more than 6,000 cities and regions making quantifiable commitments to reduce GHG emissions in the 10 major emitting economies included in this study. These cities represent a population of 579 million, while participating regions hold nearly 514 million people. In other words, they represent a combined population that rivals those of large countries; only China and India have larger populations. Cities taking climate action hold more people than the US and Brazil combined, while regions taking climate action represent a population about four times the size of Japan’s (World Bank, 2019).4 Europe and North America host the greatest number of cities and regions making quantifiable commitments to reduce GHG emissions. Subnational governments in East Asia and the Pacific, however, represent the largest collective population (See Figure 1). Many of the participating actors in this region are megacities – urban areas home to more than 10 million people – that exercise
huge influence over their countries and region’s emissions. While relatively few actors are making quantifiable commitments in South Asia and Latin America these cities and regions also represent large populations, giving their efforts substantial influence within their countries. Cities making quantifiable climate commitments in Latin America and the Caribbean collectively hold 41 million people, roughly 4 million more than Canada’s 2018 population (World Bank, 2019).
A few common threads emerge from the quantifiable emission reduction commitments included in this analysis. Most of the emission reduction commitments analysed in this report set targets to reduce GHG emissions relative to a prior year (or “base year”), by a “target year.” For instance, a city might pledge to reduce its GHG emissions by 25% from 2000 levels by 2020.
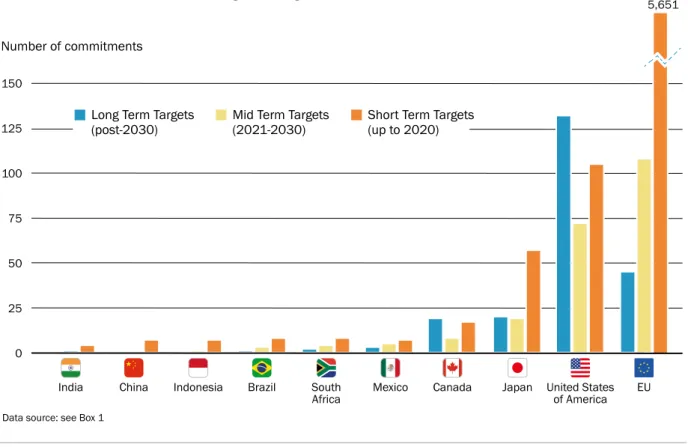
The vast majority (93% percent) of local governments’ quantifiable emission reduction commitments focus on short-term targets, aiming to reduce emissions by or in 2020. The remaining 7% of targets are split relatively
300 250 200 150 100 50 0
South Asia North
America
East Asia and the Pacific Latin America and Caribbean Sub-Saharan Africa Europe Population (in millions)
Eastern Europe and Central Asia
City Region
Figure 1.
Population of cities and regions making quantifiable commitments to reduce GHG emissions
by geographic region
evenly between mid-term targets – which set target years between 2021 and 2030 – and long-term post-2030 targets (see Figure 2). The heavy focus on short-term targets reflects, in large part, high levels of adoption of a 2020 goal by the European participants in the Global Covenant of Mayors for Climate and Energy. This trend also applies – less dramatically – across other geographic locations. One exception is the US, which leads in terms of the number of cities and states making long-term quantifiable commitments. More than half of the US cities and states with 2050 targets also had mid-term targets for years after 2025.
The most common GHG emissions reduction target made by cities and regions hovers just above 20%. The average emissions reduction target is 27%, reflecting the short-term (-2020) nature of most of the targets, as mid- and long-term emissions reduction goals typically grow increasingly ambitious with later target years. The most common mid-term (2021-2030) emissions reduction target is 40%, while the most common target for longer-term targets
(set after 2030) is 80%. The most common base year for all commitment types (short-, mid-, and long-term) is 2007, though the full range of base years spans 1990 to 2017. The full range of emission reduction goals across all commitments ranges from less than 1%, for a small handful of actors, and stretches up to targets to reduce 100% of emissions. Approximately 65 cities and regions have set net zero or carbon neutrality targets, pledging to bring their emissions to zero, many on rapid timelines. Copenhagen, for instance, aims to become the first carbon neutral capital city by 2025, and the US state of Hawaii has set an ambitious goal of reaching net zero emissions by 2045. In practice, this typically involves a combination of reducing the bulk of an actors’ GHG emissions and offsetting any remaining emissions by, for instance, planting and protecting forests or purchasing renewable energy credits. 150 125 100 75 50 25 0
Mexico Canada Japan Brazil South
Africa United Statesof America EU Long Term Targets
(post-2030) Mid Term Targets (2021-2030) Short Term Targets (up to 2020) Number of commitments
5,651
Indonesia China
India
Figure 2.
Number and target years of cities and regions’ quantifiable commitments to reduce
GHG emissions in 10 high-emitting economies
L A N D S C A P E O F S U B N A T I O N A L A N D N O N - S T A T E C L I M A T E A C T I O N
2.1.2
COMPANIES
Nearly 1,500 companies, operating within 10 of the world’s major emitting economies, have made quantifiable commitments to reduce GHG emissions through CDP. Their combined revenue totals over $20.5 trillion US Dollars (USD), the size of the US GDP (World Bank, 2019). More than 450, or just over 20%, of the world’s largest companies – defined in terms of their membership in the 2019 Fortune Global 5005 and Global Forbes 20006 lists – are included in this total.
Across the 10 major emitting economies this report considers, the EU, the US, and China host the greatest number of companies making quantifiable GHG reduction commitments. Targets set by companies headquartered in the US and the EU cover markedly more (self-defined) baseline emissions than companies in other regions, likely reflecting the high level of participation in these locations. Similarly, the largest concentration of revenue is found among companies headquartered in the US, the EU, and Japan.
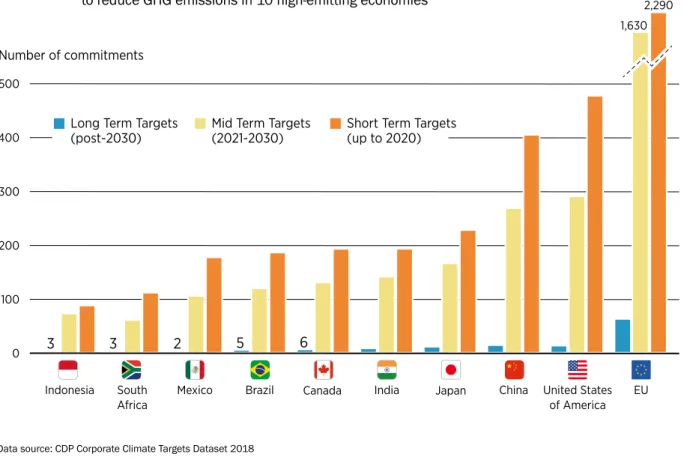
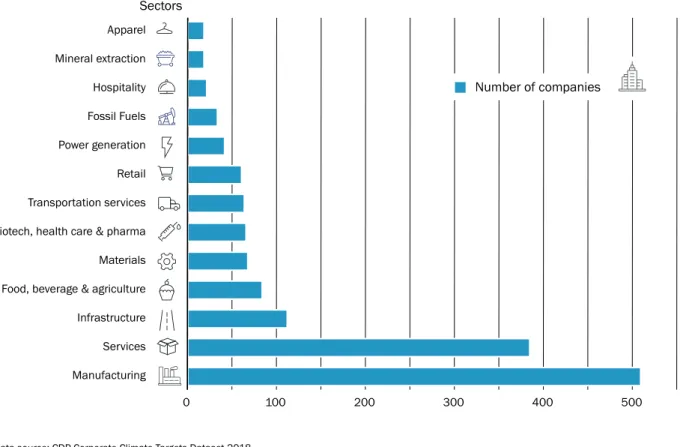
As with city, state and region commitments, most company commitments focus on short-term timelines, up to or in 2020. Across the GHG emissions reduction commitments made by companies reporting quantifiable emissions reductions to CDP in the 10 major emitting economies, 58% have targets up to or in 2020; 40% aim for target years between 2021 and 2030; and 2% set targets after 2030 (see Figure 3). The most common GHG emissions reduction target aims to cut GHG emissions by roughly 20%, with varying base years between 1990 and 2018 (the most common base year is 2014). Unlike the subnational actors, the most common GHG emissions reduction goal of approximately 20% remains fairly consistent across short-, mid-, and long-term targets. Commitments span a wide range of sectors, with particularly high concentration in the manufacturing and services sectors (see Figure 4). More than 500 commitments each reference renewable energy and fuel efficiency, while over 350 commitments mention energy efficiency, and nearly 200 mention transport.
500 400 300 200 100 0
Mexico Brazil Canada Japan
South Africa
China
India United States
of America EU Number of commitments 2,290 Indonesia 1,630 3 3 2 5 6
Long Term Targets
(post-2030) Mid Term Targets (2021-2030) Short Term Targets (up to 2020)
Figure 3.
Number and target years of companies’ quantifiable commitments
to reduce GHG emissions in 10 high-emitting economies
2.2
INTERNATIONAL COOPERATIVE
INITIATIVES
International cooperative initiatives (ICIs) are multi-stakeholder arrangements that aim to mitigate the GHGs that cause climate change and/or help to adapt to impacts of climate change. They are joint projects in which subnational and non-state actors work together across borders, often with national governments and international organizations.
International cooperative initiatives have been in the spotlight in recent years for their possible role in reducing global greenhouse emissions (see section 3 in this study; see also UNEP (2018). In addition to direct mitigation impacts, ICIs are seen as important tools of experimentation, innovation, and diffusion of knowledge and resources across actors (Bernstein and Hoffman, 2018; Hermwille, 2018; Abbott, 2017). Decarbonization and adaptation approaches in one area, or by one actor, can spread to others, potentially driving larger transformations. Such catalytic effects could eventually also affect government policies (Hale, 2018). Moreover, ICIs have the potential to simultaneously deliver on other aspects of sustainable development (see section 4 in this study). Although most observers agree on the great potential of these initiatives, in particular vis-a-vis closing the global emissions gap, most studies do not provide evidence on their actual performance and effectiveness.
0 100 200 300 400 500 Hospitality Power generation Transportation services Fossil Fuels Mineral extraction
Biotech, health care & pharma Retail
Materials Food, beverage & agriculture Infrastructure Services Manufacturing Sectors Apparel Number of companies
Figure 4.
The distribution of companies making quantified GHG emissions reduction commitments by sector
L A N D S C A P E O F S U B N A T I O N A L A N D N O N - S T A T E C L I M A T E A C T I O N
2.2.1
OVERVIEW
This section analyses 190 ICIs that have been active between 2014, when the previous UN Secretary General’s Climate Summit was held, to the first half of 2019. The sample was obtained by recording the initiatives launched at similar global summits, at COPs, and at other relevant fora. To be included in the sample, ICIs needed to have participants in two or more separate countries and to explicitly target climate mitigation and/or adaptation measures. Note that initiatives are related to but distinct from two similar categories: individual projects and networks, coalitions, or associations (see Bulkeley et al. 2014 for further discussion). For example, the RE100 initiative may support many individual projects to install renewable energy capacity around the world, but those individual projects are not recorded here. Similarly, the RE100 initiative is supported by the We Mean Business coalition, a global association of businesses, but it is the initiative, not the parent network, that we focus on in this analysis.
The authors are confident that the 190 ICIs analysed here include the vast bulk of initiatives globally, but the sample likely under-represents smaller and more informal initiatives. We do not analyse domestic cooperative initiatives (i.e., those that only include actors from the same country) though these are also an important aspect of climate action around the world. Most of the 190 initiatives in the sample are currently active, though some have concluded.
The quantitative estimates of ICIs’ GHG emissions reductions in section 3 applies additional selection criteria to focus on 17 of these 190 cooperative initiatives. The results presented in this section instead describe the broader membership of 190 initiatives.
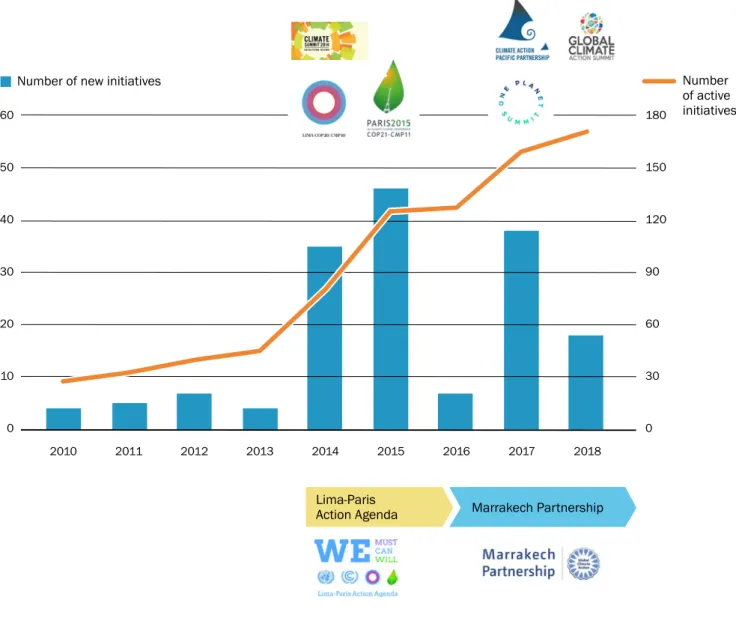
Five years of global summits have driven a rapid increase in the number of initiatives. Of the 190 initiatives, 170 are “active” as of mid-2019, nearly three times the number active before the 2014 UN Climate Summit and a 36% increase from the 125 initiatives active at the time of COP21 (see Figure 5). Most initiatives emerge around major global summits (see Figure 5), and more initiatives will be launched at the United Nations Secretary General’s Climate Summit in September 2019. In 2018, 18 new initiatives were launched.
Consistent with earlier studies, we observe a massive scale and scope of participation in ICIs. Across the 190 ICIs, we identify nearly 29,000 “instances of participation” of actors in these initiatives. This figure differs from the individual actors’ analysis in section 2.1, because the same city or business might participate in more than one initiative. This provides an additional, complementary way to gauge not just the breadth but also the depth of climate action. Measured in this way, sub-national governments and businesses account for the lion’s share of participation, representing almost 40% of ICIs’ membership each, with state, international organizations, and research bodies making up the rest.
A few ICIs are very large, involving hundreds or thousands of participants, but most are more modest in scale; the median number of participants in an initiative is 39. It is important to note that the aggregation of mitigation potential in Section 3.2 focuses on larger initiatives with high mitigation potential. This is an appropriate focus for the present report, but it is important to consider that such initiatives are not necessarily representative of all initiatives.
Actors from developing countries account for a quarter of participation in ICIs, but make up nearly half of lead partners. Although the number of actors from non-OECD countries who participate in ICIs has continued to grow since the Paris Agreement in 2015, actors based in developing countries still represent only 23% of instances of participation. This gap reflects the high levels of participation from European cities and businesses in some of the largest initiatives. However, actors from developing countries are better represented in the leadership of ICIs, now making up nearly half of all lead partners. Previous studies found just a quarter of developing country lead partners. This increase suggests that efforts by, for example, the High-level Climate Champions to spur more initiatives focused on developing countries have delivered results.
While ICIs address all areas of climate action, emissions reductions remain the dominant focus. The landscape of ICIs is very diverse, including large and small initiatives that target a vast spectrum of outcomes across all areas of climate action. Nonetheless, 60% of ICIs mainly focus on mitigation, 17% mainly on adaptation, and 23% on both equally.
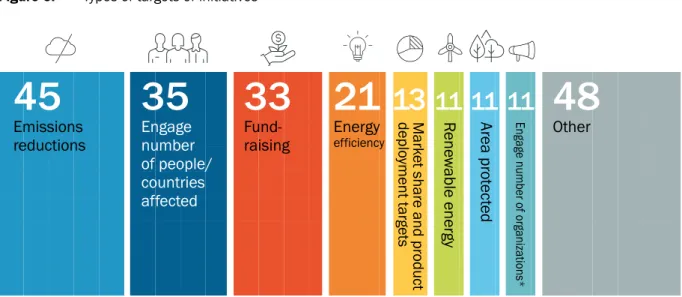
At a more granular level, initiatives pursuing mitigation, adaptation, or both employ a range of strategies and targets (Figure 6). Emissions reductions are the most common target, but many ICIs focus on targets like engaging a certain number of sub/non-state actors or individuals, raising funding, or other aspects of climate action.
Marrakech Partnership 60 50 40 30 20 10 0 180 150 120 90 60 30 0 2015 2016 2013 2014 2011 2012 2010 2017 2018
Number of new initiatives Number
of active initiatives
Lima-Paris Action Agenda
L A N D S C A P E O F S U B N A T I O N A L A N D N O N - S T A T E C L I M A T E A C T I O N
2.2.2
PROGRESS OF INTERNATIONAL
COOPERATIVE INITIATIVES
This section focuses on the progress of this set of 190 ICIs and asks whether initiatives have been taking appropriate steps to deliver their goal, and how output performance has developed over the last 6 years. The analysis updates previous work conducted by the ClimateSouth project in since 2017, previously also reported in the 2017 and 2018 Yearbook of Global Climate Action by the Marrakech Partnership for Global Climate Action (ClimateSouth, 2018; UNFCCC, 2018; United Nations Climate Change Secretariat, 2018)
2.2.2.1 Approach
Measuring the performance of a diverse set of ICIs presents significant challenges. As shown above, ICIs have very different kinds of targets. Moreover, data on outputs, outcomes and impacts is scarce, and – if available – difficult to compare. Some authors have evaluated ICIs by their design characteristics, for instance: the presence of secretariats and accountability mechanisms; whether targets and goals are specific and time-bound; and whether organizational capacities are in place that might indicate a higher likelihood that desired impacts may be achieved (e.g. Michaelowa and Michaelowa, 2017). The current analysis goes beyond the more familiar analysis of design characteristics and aims to understand the output performance of climate initiatives.
Outputs include a wide variety of tangible and attributable production by climate initiatives, including new or enhanced infrastructure or installations, training seminars, course material, campaign materials, conferences, studies, etc. These outputs do not ensure that initiatives reach their targets. However, initiatives that produce fitting outputs are more likely to generate desired environmental or social outcomes, such as emissions reductions or sustainable development benefits.
Figure 6.
Types of targets of initiatives
45
Emissions
reductions
35
Engage
number
of people/
countries
affected
33
Fund-raising
21
Energy
efficiency13
11 11 11
48
Other
Mar
ke
t shar
e and pr
oduct
deplo
yment t
ar
ge
ts
R
ene
w
able ener
gy
Ar
ea pr
otect
ed
Eng ag e number of or ganizations* *(businesses/NGOs/subn. Gov)To indicate the performance of non-state and subnational climate actions, we applied the Function-Output-Fit (FOF) methodology that assesses the fitness of initiatives’ functions and their respective outputs (see Technical Annex II) (see Pattberg et al., 2012; Widerberg and Stripple, 2016; Chan et al., 2018; United Nations Climate Change Secretariat, 2018). FOF is therefore a way to track whether initiatives are producing the kind of outputs that demonstrate progress in light of their functions. For instance, an initiative that aims at flood risk reduction through infrastructural adjustments should be expected to enhance or install new infrastructure for it to accomplish its desired impacts. An initiative that aims at raising awareness can be associated with very different expected outputs, such as campaigning materials and public events. The FOF methodology is appropriate for comparing very heterogeneous initiatives with a wide range of functions, and for indicating progress, even when target years may be significantly in the future.
The assessment of output performance is conducted in three steps. First, individual initiatives are classified by 12 inductively clustered function categories, including training, technical and on-the-ground implementation (e.g. local pilot projects, new installations and infrastructure), knowledge production, knowledge dissemination, campaigning, lobbying, and product development. Second, data on outputs and their years of production are collected for every initiative from publicly available sources, including annual reports, websites, and social
media accounts, in addition to occasional email correspondence. Finally, output performance is calculated by matching data on functions of climate initiatives with data on tangible and attributable outputs (26 output data categories). The resulting values indicate the proportion of functions for which an initiative produces appropriate outputs. Methodological details of the FOF method can be found in Technical Annex II.
While taking an important step towards understanding ex-post effectiveness of ICIs, the current
analysis exhibits important limitations. FOF values are a minimal indicator for effectiveness. High values do not guarantee desired impacts or behavioural change among target actors, rather they indicate a greater likelihood that desired outcomes and impacts may be achieved. By contrast, very low values certainly rule out attributable environmental or social impacts. Moreover, the method requires considerable interpretation of qualitative data. To ensure inter-coder reliability, initiatives were coded by multiple coders, who discussed and compared coding results throughout the data collection process.
2.2.2.2 Results
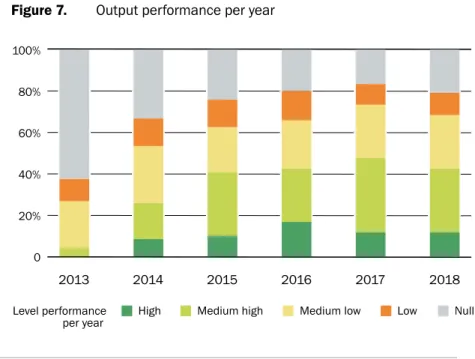
Using the FOF method, we find that, over time, the sample of 190 ICIs have generally improved output performance significantly since 2013 (Figure 7). A slightly lower share of high and medium-high performing initiatives in 2018 compared to 2017 may be related to the addition of a significant number of new initiatives, which need more time to produce fitting outputs.
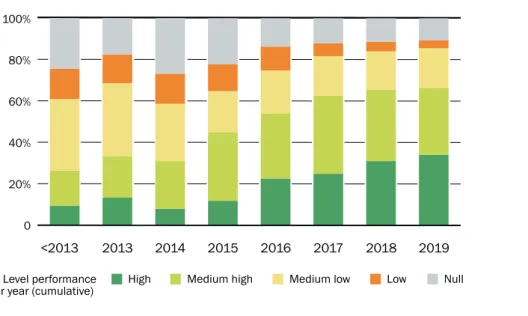
Many outputs, such as infrastructure and trainings, are not only relevant in their particular year of production but also in subsequent years. Assuming the cumulative effects of outputs, we find that almost 70% of initiatives have delivered high or medium high output performance by July 2019 (Figure 8), producing relevant outputs that increase the likelihood that desired changes in
Figure 7.
Output performance per year
100% 80% 60% 40% 20% 0 2013 2014 2015 2016 2017 2018High Low Null
Level performance
L A N D S C A P E O F S U B N A T I O N A L A N D N O N - S T A T E C L I M A T E A C T I O N
environmental and social indicators may be achieved. The development of cumulative output performance since 2013 compares particularly well with previous analysis of international cooperative initiatives in broader sustainable development; for instance, eight years after their launch, 43% of partnerships for sustainable development presented at the 2002 World Summit on Sustainable Development were still performing poorly, with many producing no outputs at all (Pattberg et al., 2012).
The addition of many new initiatives since 2017 may result in additional improvements in output performance. Indeed, we see that initiatives tend to perform better over time, especially during the first several years of their life spans (Figure 9). This performance pattern is consistent with our expectation that initiatives strengthen over time as they institutionalise, attract resources, and implement their plans. However, among older initiatives (approximately 3-4 years or older) we do not see a singular pattern; some initiatives tend to further improve over time, while others are beginning to deteriorate. Further analysis is needed to determine whether the “decay” of a subset of ICIs requires additional efforts to strengthen and support of existing initiatives.
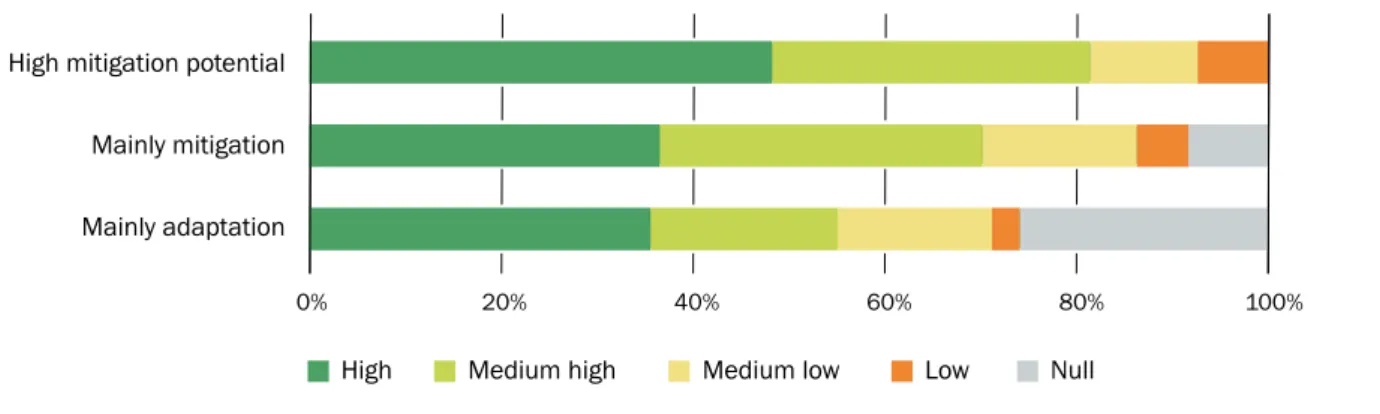
Mitigation initiatives tend to perform better, on average, than adaptation initiatives (Figure 10). The share of high and medium-high performing initiatives is higher among those that mainly focus on mitigation compared to those that mainly focus on adaptation. Almost a quarter of initiatives that mainly focus on adaptation produce no outputs at all. The output performance of a subset of initiatives with high mitigation potential (also used for the analysis of mitigation potential in section 3.2 of this study) perform particularly well; more than 80% reached a high or medium high level of performance. The findings indicate the potentially strong contribution to global mitigation efforts by effective cooperative initiatives, while also suggesting the need to enhance initiatives’ contributions to adaptation to climate change.
Figure 8.
Level of performance per year (cumulative)
<2013 2013 2014 2015 2016 2017 2018 2019 100% 80% 60% 40% 20% 0
High Low Null
Level performance
Age <1 Age 1 –<2y Age 2 – <3y Age 3 – <4y Age 4 – <5y Age 5 – <6y Age 6 – <7y Age > 7y 0% 10% 20% 30% 40% 50% 60% 70% 80% 90% 100% High
Output performance Medium high Medium low Low Null
Figure 9.
Output performance by initiatives’ age
Figure 10. Output performance: adaptation, mitigation and high mitigation potential initiatives
High mitigation potential
Mainly mitigation
Mainly adaptation
0% 20% 40% 60% 80% 100%
High Medium high Medium low Low Null
2.2.2.3 Key insights
Since 2013, ICIs have improved output performance significantly; they are delivering relevant outputs, increasing their likelihood to achieve desired environmental and social impacts. In particular, initiatives that focus on mitigation, and the subset of high-mitigation potential initiatives quantified in this report, show strong output performance. These results provide additional confidence that the potential emissions reductions calculated below can be realised.
Despite positive trends in output performance, however, continued efforts are necessary to strengthen existing initiatives to ensure that their keep up performance over their lifespans. Moreover, given the rapid and worsening impacts of climate change, the relative underperformance of cooperative initiatives that mainly focus on adaptation is cause for concern.