Total greenhouse gas (GHG) emissions in the Netherlands in 2017 decreased by approximately 1.1%, compared with 2016 emissions. This decrease was mainly the result of decreased coal combustion for energy and heat production.
In 2017, total GHG emissions (including indirect CO2 emissions and excluding emissions from Land use, land use change and forestry (LULUCF)) in the Netherlands amounted to 193.7 Tg CO2 eq. This is approximately 12.6% below the emissions in the base year 1990 (221.7 Tg CO2 eq.).
CO2 emissions in 2017 were still above the level in the base year (+1.0%). This increase was offset by the reduction since 1990 in emissions of methane, nitrous oxide and fluorinated gases (CH4, N2O and F-gases). This report documents the Netherlands’ annual submission for 2019 of its GHG emissions inventory in accordance with the 2006 IPCC Guidelines for National Greenhouse Gas Inventories (IPCC, 2006) prescribed by the United Nations Framework Convention on Climate Change (UNFCCC), the Kyoto Protocol (KP) and the European Union’s Greenhouse Gas Monitoring Mechanism.
This report includes explanations of observed trends in emissions; an assessment of the sources with the highest contribution to total national emissions (key sources) and the uncertainty in their emissions. Per source category, methods, data sources and emission factors (EFs) are described; besides a description of the quality assurance system and the verification activities performed on the data. It also describes chang-es in methodologichang-es compared to the former submission (NIR 2018), the rchang-esults of recalculations
and planned improvements.
Greenhouse
Gas Emissions
in the Netherlands
1990-2017
National Inventory Report 2019
Committed to
health and sustainability
Published by:
National Institute for Public Health and the Environment
P.O. Box 1 | 3720 BA Bilthoven The Netherlands www.rivm.nl/en April 2019 RIVM Report 2019-0020 in the Netherlands 1990-2017
National Inventory Report 2019
P.G. Ruyssenaars | P.W.H.G. Coenen | P.J. Zijlema | E.J.M.M. Arets | K. Baas | R. Dröge | G. Geilenkirchen | M. ’t Hoen | E. Honig | B. van Huet | E.P. van Huis | W.W.R. Koch | L.L. Lagerwerf | R.A. te Molder | J.A. Montfoort | C.J. Peek | J. Vonk | M.C. van Zanten
Greenhouse gas emissions in
the Netherlands 1990–2017
National Inventory Report 2019
15 April 2019 Version
Colophon
© RIVM 2019National Institute for Public Health and the Environment (RIVM), P.O. Box 1, 3720 BA Bilthoven, Netherlands; Tel: +31-30-274 91 11; Fax: +31-30-278 75 31; www.rivm.nl/en.
Parts of this publication may be reproduced, provided acknowledgement is given to the ‘National Institute for Public Health and the Environment’, along with the title and year of publication.
DOI 10.21945/RIVM-2019-0020
P.G. Ruyssenaars, P.W.H.G. Coenen1, P.J. Zijlema2, E.J.M.M. Arets6, K. Baas3, R. Dröge1, G. Geilenkirchen5, M. ’t Hoen5, E. Honig, B. van Huet7, E.P. van Huis4,W.W.R. Koch1, L.A. Lagerwerf, R. te Molder, J.A.
Montfoort, C.J. Peek, J. Vonk, M.C. van Zanten,
1 Netherlands Organization for Applied Scientific Research (TNO), P.O. Box 80015, NL-3508 TA Utrecht
2 Netherlands Enterprise Agency (RVO.nl), P.O. Box 8242, NL-3503 RE Utrecht
3 Statistics Netherlands (in Dutch: ‘Centraal Bureau voor de Statistiek’, CBS), P.O. Box 24500, NL-2490 HA Den Haag
4 Dutch Emissions Authority (NEa), P.O. Box 91503, NL-2509 EC Den Haag
5 PBL Netherlands Environmental Assessment Agency, P.O. Box 30314 NL-2500 GH Den Haag
6 Wageningen Environmental Research (Alterra) Wageningen UR, P.O. Box 47 NL-6700 AA Wageningen
7 Rijkswaterstaat, P.O. Box 2232, NL-3500 GE Utrecht Contacts:
Margreet van Zanten (RIVM) (margreet.van.zanten@rivm.nl) Peter Zijlema (NIE / Netherlands Enterprise Agency (RVO.nl)) (Peter.Zijlema@rvo.nl)
This report has been compiled by order and for the account of the
Directorate-General for the Environment and International Affairs, within the framework of the project Emission Registration M/240037/15/NI, ‘Netherlands Pollutant Release & Transfer Register’. Report prepared for submission in accordance with the United Nations Framework
Convention on Climate Change (UNFCCC) and the European Union’s Greenhouse Gas Monitoring Mechanism [including electronic Common Reporting Format (CRF) Excel spreadsheet files containing the data for 1990 to 2017].
This is a publication of:
National Institute for Public Health and the Environment
P.O. Box1 | 3720 BA Bilthoven The Netherlands
Acknowledgements
Many colleagues from a number of organizations Statistics Netherlands (CBS), Wageningen Environmental Research (WUR), Netherlands Enterprise Agency (RVO.nl), Netherlands Environmental Assessment Agency (PBL), RIVM and TNO have been involved in the annual update of the Netherlands Pollutant Release & Transfer Register (NL-PRTR), also called the Emission Registration (ER) system, which contains emissions data on about 350 pollutants. The emissions calculations, including those for greenhouse gas (GHG) emissions, are performed by members of the ER Task Forces. This is a major task, since the Netherlands’ inventory contains details of many emissions sources.
The emissions and activity data of the Netherlands’ inventory were converted into the IPCC1 source categories contained in the Common Reporting Format (CRF) tables, which form a supplement to this report. The description of the various sources, the analysis of trends and the uncertainty estimates (see Chapters 3 to 8) were made in cooperation with the following emissions experts: Eric Arets (KP and Land use), Bas van Huet (Waste), Gerben Geilenkirchen and Maarten ‘t Hoen
(Transport), Romuald te Molder and Jolien van Huijstee (key sources and uncertainty analysis), Rianne Dröge (Energy and uncertainty assessment), Johanna Montfoort (Fugitive emissions), Kees Peek and Erik Honig (Industrial processes and product use, data control, chart production), Kees Baas (Wastewater handling), Lotte Lagerwerf and Jan Vonk (Agriculture).
In addition, Bas Guis provided pivotal information on CO2 emissions related to energy use. This group also provided activity data and
additional information for the CRF tables in cases where these were not included in the data sheets submitted by the ER Task Forces.
We are particularly grateful to Bert Leekstra, Dirk Wever and Jacqueline Wanders for their contributions to data processing, chart production and quality control.
We greatly appreciate the contributions of each of these groups and individuals to this National Inventory Report and supplemental CRF tables, as well as those of the external reviewers who provided comments on the draft report.
Synopsis
Greenhouse gas emissions in the Netherlands 1990–2017
Total greenhouse gas (GHG) emissions in the Netherlands in 2017 decreased by approximately 1.1%, compared with 2016 emissions. This decrease was mainly the result of decreased coal combustion for energy and heat production.
In 2017, total GHG emissions (including indirect CO2 emissions and excluding emissions from Land use, land use change and forestry (LULUCF)) in the Netherlands amounted to 193.7 Tg CO2 eq. This is approximately 12.6% below the emissions in the base year 1990 (221.7 Tg CO2 eq.).
CO2 emissions in 2017 were still above the level in the base year (+1.0%). This increase was offset by the reduction since 1990 in emissions of methane, nitrous oxide and fluorinated gases (CH4, N2O and F-gases).
This report documents the Netherlands’ annual submission for 2019 of its GHG emissions inventory in accordance with the 2006 IPCC
Guidelines for National Greenhouse Gas Inventories (IPCC, 2006) prescribed by the United Nations Framework Convention on Climate Change (UNFCCC), the Kyoto Protocol (KP) and the European Union’s Greenhouse Gas Monitoring Mechanism.
This report includes explanations of observed trends in emissions; an assessment of the sources with the highest contribution to total national emissions (key sources) and the uncertainty in their emissions. Per source category, methods, data sources and emission factors (EFs) are described; besides a description of the quality assurance system and the verification activities performed on the data. It also describes changes in methodologies compared to the former submission (NIR 2018), the results of recalculations and planned improvements.
Publiekssamenvatting
Emissies van broeikasgassen tussen 1990 en 2017
In 2017 is de totale uitstoot van broeikasgassen van Nederland met ongeveer 1,1 procent gedaald ten opzichte van 2016. Deze daling komt vooral doordat minder kolen zijn gebruikt om elektriciteit te produceren en ruimtes te verwarmen.
De totale uitstoot van broeikasgassen naar de lucht wordt uitgedrukt in CO2-equivalenten en bedroeg in 2016 193,7 miljard kilogram. Het jaar 1990 geldt als referentiejaar (het zogeheten Kyoto-basisjaar) voor de te halen doelstellingen. De uitstoot in 1990 bedroeg 221,7 miljard kilogram CO2-equivalenten. Ten opzichte van het basisjaar is de uitstoot gedaald met ongeveer 12,6 procent.
De uitstoot van CO2 ligt ongeveer 1 procent boven het niveau van het basisjaar. Omdat de uitstoot van de andere broeikasgassen (methaan, distikstofoxide en gefluoreerde gassen) sinds 1990 flink is gedaald, is de totale uitstoot van broeikasgassen lager dan in 1990.
Dit blijkt uit een inventarisatie van broeikasgasemissies die het RIVM jaarlijks op verzoek van het ministerie van Economische Zaken en Klimaat (EZK) opstelt. Met deze inventarisatie voldoet Nederland aan de nationale rapportageverplichtingen voor 2018 van het Klimaatverdrag van de Verenigde Naties (UNFCCC), van het Kyoto Protocol en van het Bewakingsmechanisme Broeikasgassen van de Europese Unie.
De inventarisatie bevat verder analyses van ontwikkelingen in de uitstoot van broeikasgassen tussen 1990 en 2017, een analyse van de belangrijkste bronnen die broeikasgassen uitstoten (‘sleutelbronnen’), evenals de onzekerheid in hun uitstoot. Daarnaast zijn de gebruikte berekeningsmethoden en databronnen beschreven. Ten slotte bevat het een overzicht van het kwaliteitssysteem en de manier waarop de
Nederlandse Emissieregistratie de berekeningen controleert.
Contents
Samenvatting — 13 Executive summary — 17
Part I: Annual inventory report — 27
1. Introduction — 29
1.1 Background information on greenhouse gas inventories and climate change — 29
1.2 A description of the national inventory arrangements — 31
1.3 Inventory preparation; data collection, processing and storage — 40 1.4 General description of methodologies (including tiers used) and data
sources used — 44
1.5 Brief description of key categories — 48
1.6 General uncertainty evaluation, including data on the overall uncertainty of the inventory totals — 49
1.7 General assessment of completeness — 53
2. Trends in GHG emissions — 55
2.1 Emissions trends for aggregated GHG emissions — 55 2.2 Emissions trends by gas — 55
2.3 Emissions trends by source category — 58
2.4 Emissions trends for indirect greenhouse gases and SO2 — 59
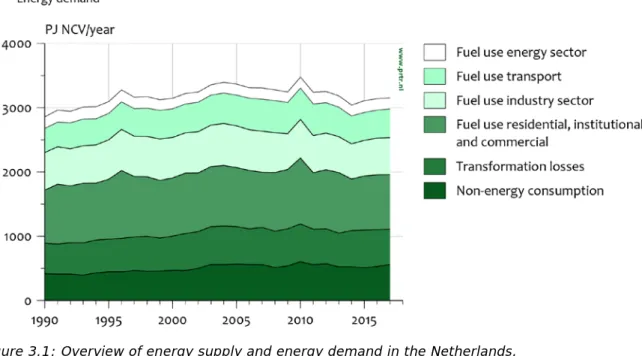
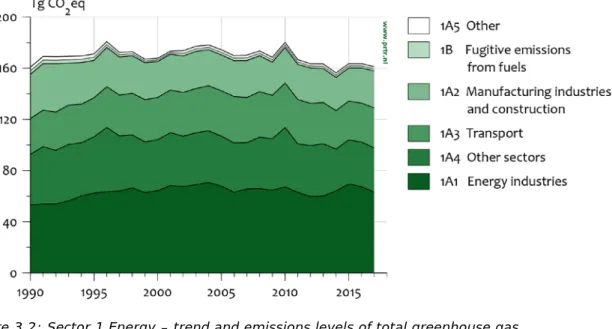
3. Energy (CRF sector 1) — 61
3.1 Overview of sector — 61 3.2 Fuel combustion (1A) — 64
3.3 Fugitive emissions from fuels (1B) — 110 3.4 CO2 transport and storage (1C) — 115
4. Industrial processes and product use (CRF sector 2) — 117
4.1 Overview of the sector — 117 4.2 Mineral products (2A) — 120 4.3 Chemical industry (2B) — 125 4.4 Metal production (2C) — 136
4.5 Non-energy products from fuels and solvent use (2D) — 139 4.6 Electronics industry (2E) — 140
4.7 Product use as substitutes for ODS (2F) — 142 4.8 Other product manufacture and use (2G) — 148 4.9 Other (2H) — 151
5. Agriculture (CRF sector 3) — 153
5.1 Overview of the sector — 154 5.2 Enteric fermentation (3A) — 158 5.3 Manure management (3B) — 163 5.4 Agricultural soils (3D) — 171 5.5 Liming (3G) — 177
6. Land use, land use change and forestry (CRF sector 4) — 179
6.2 Land-use definitions and the classification systems used and their correspondence to the land use, land use change and forestry categories — 192
6.3 Information on approaches used to representing land areas and land-use databases land-used for the inventory preparation — 194
6.5 Cropland (4B) — 206 6.6 Grassland (4C) — 207 6.7 Wetland (4D) — 212 6.8 Settlements (4E) — 214 7. Waste (CRF sector 5) — 221 7.1 Overview of sector — 221
7.2 Solid waste disposal on land (5A) — 223 7.3 Biological treatment of solid waste (5B) — 231 7.4 Waste incineration (5C) — 232
7.5 Wastewater handling (5D) — 235
8. Other (CRF sector 6) — 247
9. Indirect CO2 emissions — 249
9.1 Description of sources — 249 9.2 Methodological issues — 249
9.3 Uncertainties and time series consistency — 249 9.4 Category-specific QA/QC and verification — 249 9.5 Category-specific recalculations — 249
9.6 Category-specific planned improvements — 249
10. Recalculations and improvements — 251
10.1 Explanation of and justification for the recalculations — 251 10.2 Implications for emissions levels — 253
10.3 Implications for emissions trends, including time series consistency — 256
10.4 Recalculations, response to the review process and planned improvements — 257
Part ll: Supplementary information required under Article 7, paragraph 1 — 261 11. KP-LULUCF — 263 11.1 General information — 263 11.2 Land-related information — 264 11.3 Activity-specific information — 267 11.4 Article 3.3 — 279 11.5 Article 3.4 — 283 11.6 Other information — 284
11.7 Information relating to Article 6 — 285
12. Information on accounting of Kyoto units — 287 13. Information on changes in the National System — 291 14. Information on changes in national registry in 2018 — 293
15. Information on minimization of adverse impacts in accordance with Article 3, paragraph 14 — 297
Annex 1 Key categories — 301
Annex 2 Assessment of uncertainty — 334
Annex 3 Detailed methodological descriptions of individual sources or sink categories — 344
Annex 4 CO2: the national energy balance for the most recent inventory year — 345
Annex 5 The Netherlands’ fuel list and standard CO2 emission factors. Version January 2019 — 353
Annex 6 Assessment of completeness and (potential) sources and sinks — 362
Annex 7 Additional information to be considered as part of the NIR submission — 364
Annex 8 Chemical compounds, GWP, units and conversion factors — 365
Annex 9 List of abbreviations — 368
ANNEX 10 Improvements made in response to the in-country UNFCCC review of September 2017 — 371
Samenvatting
Het National Inventory Report (NIR) 2019 bevat de rapportage van broeikasgasemissies (CO2, N2O, CH4 en de F-gassen) over de periode 1990 tot en met 2017. De emissiecijfers in de NIR 2019 zijn berekend volgens de methoderapporten behorend bij het ‘National System’ dat is voorgeschreven in het Kyoto Protocol. In de methoderapporten zijn de berekeningswijzen vastgelegd voor zowel het basisjaar (1990) als voor de emissies in de periode tot en met 2017. De methoderapporten zijn opgenomen in Annex 7 en ook elektronisch beschikbaar op de website http://www.rvo.nl/nie
National Inventory Report (NIR)
Dit rapport over de Nederlandse inventarisatie van broeikasgasemissies is op verzoek van het ministerie van Economische Zaken en Klimaat (EZK) opgesteld om voor 2019 te voldoen aan de nationale
rapportageverplichtingen van het Klimaatverdrag van de Verenigde Naties (UNFCCC), het Kyoto Protocol en het Bewakingsmechanisme Broeikasgassen van de Europese Unie. De emissies in dit rapport zijn berekend conform de rapportagerichtlijnen van de UNFCCC en de 2006 IPCC Richtlijnen voor Nationale Broeikasgassen Inventarisatie.
Dit rapport bevat de volgende informatie:
• trendanalyses voor de emissies van broeikasgassen in de periode 1990-2017;
• een analyse van zogenaamde sleutelbronnen en de onzekerheid in hun emissies volgens de ‘Benaderingen 1 en 2’-methodiek van de 2006 IPCC Richtlijnen;
• documentatie van gebruikte berekeningsmethoden, databronnen en toegepaste emissiefactoren;
• een overzicht van het kwaliteitssysteem en de validatie van de emissiecijfers voor de Nederlandse EmissieRegistratie;
• overzicht van de herberekeningen van de broeikasgasemissies als gevolg van de meest recente wijzigingen in de
berekeningsmethoden.
De NIR bevat ook de informatie die voorgeschreven is volgens artikel 7 van het Kyoto Protocol (deel 2 van dit rapport). Hiermee voldoet
Nederland aan alle rapportagerichtlijnen van de UNFCCC.
Een losse annex bij dit rapport bevat elektronische data over emissies en activiteit data in het zogenaamde Common Reporting Format (CRF), waar door het secretariaat van het VN-Klimaatverdrag om wordt
verzocht. In een aparte annex worden ook de methodiek rapporten meegeleverd. In de bijlagen bij dit rapport is onder meer een overzicht van de belangrijkste bronnen (“sleutelbronnen”) en onzekerheden in de emissie opgenomen.
De NIR gaat niet specifiek in op de invloed van het gevoerde
overheidsbeleid op de emissies van broeikasgassen; meer informatie hierover is te vinden in de Balans van de Leefomgeving 2018 (opgesteld door het Planbureau voor de Leefomgeving, PBL), de zevende Nationale
Communicatie onder het Klimaatverdrag (NC7; EZK, 2017a) en de derde Tweejaarlijkse Voortgangsrapportage (BR3; EZK, 2017b).
Figuur S.1 Broeikasgassen: emissieniveaus en emissietrends (exclusief LULUCF), 1990-2017
Ontwikkeling van de broeikasgasemissies
De emissieontwikkeling in Nederland wordt beschreven en toegelicht in dit Nationale Inventarisatie Rapport. Figuur ES.1 geeft het
emissieverloop over de periode 1990-2017 weer. De totale emissies bedroegen in 2017 circa 193,7 Tg (Mton ofwel miljard kg) CO2 equivalenten en zijn daarmee circa 12,6 procent afgenomen in
vergelijking met de emissies in het basisjaar (221,7 Tg CO2 eq). In de in dit rapport gepresenteerde emissies worden de indirecte CO2 emissies meegerekend. De emissies van landgebruik en bossen (LULUCF) worden echter niet meegeteld.
De emissie van CO2 is sinds 1990 met circa 1,0 procent toegenomen, de emissies van de andere broeikasgassen zijn met 50,7 procent
afgenomen ten opzichte van het basisjaar.
In 2017 daalde de CO2 emissie met 1,1 procent ten opzichte van het jaar 2016. Deze daling komt vooral doordat er minder kolen zijn verbruikt voor elektriciteitsproductie en ruimteverwarming. De emissie van CH4 daalde in 2017 licht ten opzichte van 2016, met 1,7 procent. De N2O emissie steeg in 2017 met 2,8 procent. De emissie van F-gassen daalde in 2017 met 6,1 procent ten opzichte van 2016. De totale emissie van broeikasgassen in 2017 ligt daarmee 1,1 procent lager dan het niveau in 2016.
Box ES.1 Onzekerheden
De emissies van broeikasgassen kunnen niet exact worden gemeten of berekend. Onzekerheden zijn daarom onvermijdelijk. Het RIVM schat de onzekerheid in de jaarlijkse totale broeikasgasemissies op circa 3
procent. Dit is geschat op basis van informatie van emissie-experts in een eenvoudige analyse van de onzekerheid (volgens IPCC Benadering 1). De totale uitstoot van broeikasgassen ligt daarmee met 95 procent betrouwbaarheid tussen de 188 en 200 Tg (Mton).
De onzekerheid in de emissietrend tussen het basisjaar (1990) en 2017 is geschat op circa 2 procent; dat wil zeggen dat de emissietrend in die periode met 95 procent betrouwbaarheid ligt tussen de -11 en -15 procent.
Methoden
De methoden die Nederland hanteert voor de berekening van de broeikasgasemissies zijn vastgelegd in methoderapporten. Deze rapporten geven een gedetailleerde beschrijving van alle emissie schattingsmethoden voor alle stoffen in de EmissieRegistratie. Deze rapporten zijn opgesteld door deskundigen van de EmissieRegistratie (voor wat betreft de beschrijving en documentatie van de
berekeningsmethoden voor broeikasgassen) in nauwe samenwerking met de Rijksdienst voor Ondernemend Nederland (RVO.nl).
De methoderapporten zijn opgenomen in Annex 7 en ook elektronisch beschikbaar te vinden op http://english.rvo.nl/nie
Executive summary
ES1 Background information on greenhouse gas (GHG) inventories and climate change
This report documents the Netherlands’ annual submission for 2019 of its greenhouse gas (GHG) emissions inventory, as to fulfil the annual reporting requirements under the United Nations Convention on Climate Change (UNFCCC) and its Kyoto Protocol (KP). It is also prepared to fulfil part of the reporting requirements under the EU Monitoring Mechanism Regultation (EU 525/2013).
This report is prepared in line with the reporting guidelines as provided in Decisions by the UNFCCC Conference of the Parties (COP) and the Conference of the Parties serving as the meeting of the Parties to the Kyoto Protocol (CMP) as well as in line with the relevant (2006) IPCC reporting Guidelines.
The content of this report is as follows:
- Chapter 1 documents the “National System” as reviewed and approved upon UNFCCC review in 2007 (and reconfirmed in 2017);
- Chapter 2 summarises the emission trends, as further described and documented in the consecutive chapters;
- Chapter 3 – chapter 8 document emissions and trends for the following sectors, respectively:
o Energy (sector 1)
o Industrial Processes and Product Use (IPPU, sector 2) o Agriculture (sector 3)
o Land Use, Land Use Change and Forestry (LULUCF, sector 4) o Waste (sector 5)
o Other (sector 6)
- Chapter 9 describes Indirect CO2 emissions
- Chapter 10 documents recalculations and improvements compared to the former report (NIR2018).
The supplementary information required under KP Article 7, paragraph 1 of the Kyoto Protocol is reported in five additional Chapters in part II of this report.
Note that this report provides no specific information on the
effectiveness of government policies for reducing GHG emissions. This information can be found in ‘Netherlands State of the Environment report2018’ (biennial edition; in Dutch: ‘Balans van de Leefomgeving’) prepared by the Netherlands Environmental Assessment Agency (PBL), the 7th National Communication (NC7; EZK, 2017a) and the Third Biennial Report (BR3; EZK, 2017b).
The Common Reporting Format (CRF) files, containing data on
emissions, activity data and implied emission factors (IEFs), accompany this report. The complete set of CRF tables, as well as the NIR2019 in PDF format and the methodology reports, are also available on the website http://english.rvo.nl/nie.
Base year
The Netherlands uses 1990 as the base year for all gases.
Key categories
To identify the ‘key categories’ (the source categories which constitute 95% of national emissions) according to the definition of the 2006 IPCC Guidelines, national emissions are categorized according to the IPCC source categories list wherever possible. The IPCC Approach 1 method consists of ranking this list of source categories according to their contribution to both national total annual emissions (level assessment) and the national total trend (trend assessment). The results of this ranking are presented in Annex 1: 95% of the national total annual emissions derive from 32 key categories and 95% of the national total trend is due to 38 key categories, out of a total of 107 source
categories.
Next, the IPCC Approach 2 method for identifying the key categories is used; this requires incorporating the uncertainty in the emissions estimate of each of these categories before ranking them in relation to their share of total emissions. The result is a list of 35 key categories (both level and trend) from the total of 107 source categories.
Finally, after the inclusion of 10 Land use, land use change and forestry (LULUCF) source categories in the key category analysis, 4 more key categories are found in the LULUCF sector; except for the Approach 1 trend assessment (3 additional key categories).
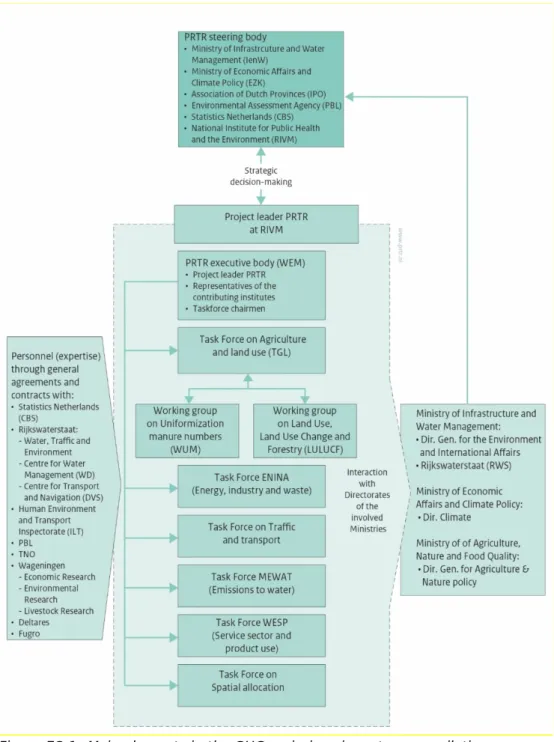
Institutional arrangements for inventory preparation
The GHG emissions inventory process of the Netherlands is integrated part of the national Pollutant Release and Transfer Register (NL-PRTR). Figure ES.1 shows the structure/responsibilities in the inventory
process.
The National Institute for Public Health and the Environment (RIVM) has been contracted by the Ministry of Infrastructure and Water
Management, respectively the ministry of Economic Affairs and Climate policy (EZK) to compile and maintain the PRTR and to coordinate the annual preparation of the NIR and the completion of the CRF tables (see Figure ES.1). RVO.nl is designated by law as the National Inventory Entity (NIE) and coordinates the overall QA/QC activities and the support/response to the UNFCCC review process.
The inventory is compiled annually in accordance with the procedures applicable to National Systems, in accordance with the requirements of Article 5.1 of the Kyoto Protocol, the UNFCCC reporting guidelines and the EU MMR, while in accordance with these requirements the National Inventory Entity (NIE) is the designated single national entity with overall responsibility for the national inventories.
Figure ES.1: Main elements in the GHG emissions inventory compilation process
Methodology reports
Emissions data are reported in accordance with the 2006 IPCC
Guidelines (IPCC, 2006)). Methodologies are described in methodology reports. The present CRF/NIR is based on these methodology reports, which are part of the National System.
The methodology reports are also part of the National GHG submission. References are included in Annex 7 and are available at the National System website http://english.rvo.nl/nie. (Any changes in) the methodology reports are reviewed and approved by the NIE and the PRTR project leader at RIVM.
ES2 Summary of trends in national emissions and removals
In 2017, total GHG emissions (including indirect CO2 emissions and excluding emissions from LULUCF) in the Netherlands were estimated at 193.7 Tg CO2 equivalents (CO2 eq.). This is approximately 12.6% below total emissions in the base years (221.7 Tg CO2 eq.).
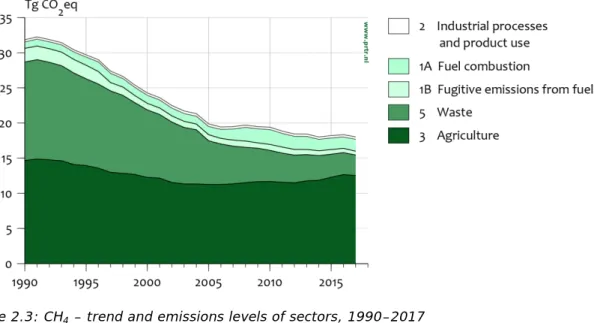
The Netherlands uses 1990 as the base year for all greenhouse gas emissions. CO2 emissions (excluding LULUCF) increased by about 1% between 1990 and 2017. CH4 emissions in 2017 were 43.4% lower than 1990 levels, mainly due to decreases in emissions from the Waste sector and the Agricultural sector. N2O emissions decreased by 51.7% in 2017 compared with 1990, mainly due to decreases in emissions from
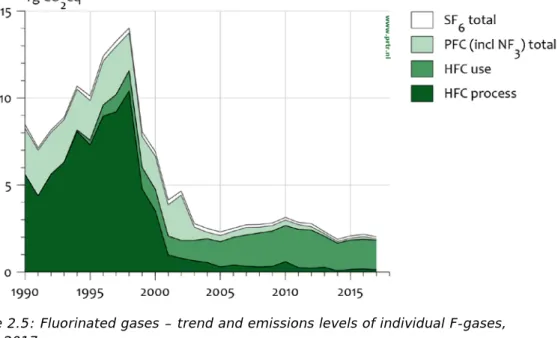
Agriculture and from Industrial processes and product use (IPPU). In contrast, N2O emissions from fossil fuel combustion (mainly from Transport) increased. Compared to the base year, the emissions of F-gases (HFCs, PFCs and SF6) decreased by 67.4%, 97.1% and 38.9%, respectively; see table ES.1. Total emissions of all F-gases were 76.1% lower than in 1990. Figure ES.2 shows a graphical representation of these trends.
Table ES.1: Summary of emissions trends per gas (Tg CO2 equivalents, including indirect CO2 emissions)
CO2 excl.
LULUCF CH4 excl. LULUCF N2O excl. LULUCF HFCs PFCs SF6 Total excl. LULUCF
1990 (base yr) 163.3 31.8 18.0 5.6 2.7 0.2 221.7 1995 173.7 29.7 18.2 7.6 2.3 0.3 231.7 2000 172.5 24.3 16.2 4.8 1.9 0.3 219.8 2005 178.0 19.9 14.6 1.7 0.4 0.2 214.7 2010 182.6 19.4 8.6 2.7 0.3 0.2 213.8 2015 166.9 18.2 8.8 1.8 0.1 0.1 196.0 2016 166.8 18.3 8.5 1.9 0.2 0.1 195.8 2017 164.9 18.0 8.7 1.8 0.1 0.1 193.7
Compared to 2016, the overall GHG emissions decreased by about 1.1%. The development for the specific gases was as follows:
• CO2 emissons (excluding LULUCF) decreased by 1.1% (-1.9 Tg), mainly due to less coal combustion for electricity and heat production (1A1a);
• CH4 emissions decreased by 1.7% (ca -0.3 Tg CO2 eq.); mainly in category 3A (Enteric fermentation) and category 5A (Solid waste disposal on land);
• N2O emissions increased by about 2.8% (ca 0.2 Tg CO2 eq.), mainly due to an increase of emissions in category 3D
(agricultural soils).
• F-gas emissions decreased by 6.1% (ca -0.1 Tg CO2 eq.). This was primarily caused by a reduction of PFC emissions of 49.3% (-0.07 Tg CO2 eq.).
Figure ES.2: Overview of the trends in GHG emissions (excl. LULUCF) 1990– 2017
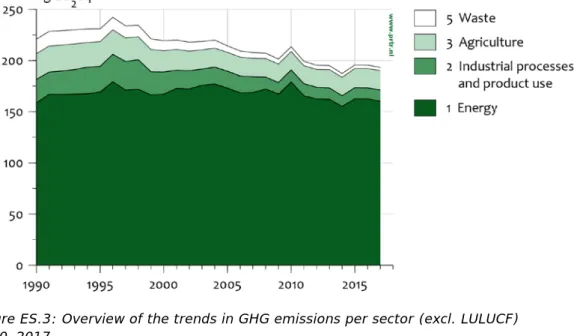
ES3 Overview of source and sink category emissions estimates and trends
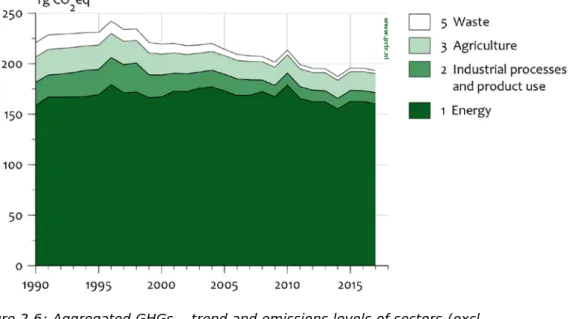
Table ES.2 and figure ES.3 provide an overview of the emissions trends (in CO2 eq.) per IPCC sector. The Energy sector is by far the largest contributor to national total GHG emissions. Emissions from this sector were in 2017 ca 1% higher than in 1990. Emissions from all other sectors were lower than in the base year, the largest decreases being in Waste, IPPU (Industrial Production and Product Use) and Agriculture. Source categories showing the largest increase in CO2-equivalent emissions since 1990 are Transport (1A3) and Energy industries (1A1) (+11% and +19%, respectively).
Table ES.2 Summary of emissions trends per sector (Tg CO2 equivalents, including indirect CO2 emissions)
Energy
(1) IPPU (2) Agriculture (3) LULUCF (4) Waste (5) Total incl. LULUCF Total excl. LULUCF
1990 (base yr) 158.6 23.8 25.1 6.5 14.2 228.2 221.7 1995 169.3 25.6 24.2 6.4 12.6 238.1 231.7 2000 167.1 22.2 20.7 6.1 9.8 225.9 219.8 2005 173.0 17.0 18.4 5.7 6.4 220.4 214.7 2010 178.9 12.3 18.0 5.6 4.6 219.4 213.8 2015 162.5 11.4 18.7 5.6 3.4 201.7 196.0 2016 162.6 11.1 18.9 5.6 3.3 201.4 195.8 2017 160.2 11.5 18.9 5.6 3.1 199.3 193.7
Figure ES.3: Overview of the trends in GHG emissions per sector (excl. LULUCF) 1990–2017
ES4 Other information
General uncertainty evaluation
The results of the uncertainty estimation according to the IPCC
Approach 1 are summarized in Annex 2 of this report. The overall results are shown in Table ES3. IPCC Approach 2 also takes the correlation between source categories (such as cattle numbers for enteric
fermentation and animal manure production) into account. The results of the Approach 2 uncertainty assessment (using Monte Carlo analysis) are also included in Annex 2. The overall results (see Table ES3) show that the calculated uncertainty in the national emissions is of the same order of magnitude as the Approach 1 uncertainty assessment. For non-CO2 GHG the Approach 2 uncertainties are lower than the results from Approach 1, as they are now based on revised uncertainty estimates at the lowest source level.
Table ES.3: Approach 1 and Approach 2 uncertainty assessment of 2017 emissions (without LULUCF)
Greenhouse
gas Approach 1 annual
uncertainty Approach 2 annual uncertainty (Monte Carlo) Carbon dioxide 2% 3% Methane 13% 9% Nitrous oxide 36% 26% F-gases 41% 34% Total 3% 3%
The trend uncertainty in total CO2-equivalent emissions (excluding LULUCF) for 1990–2017 is ±2%. This means that the trend in total CO2-equivalent emissions between 1990 and 2017 (excluding LULUCF), which is calculated to be a 12.6% (rounded 13%) decrease, will be between a 11% decrease and a 15% decrease.
Per individual gas, the trend uncertainties in total emissions of CO2, CH4, N2O and the total group of F-gases have been calculated at ±2%, ±6%, ±7% and ±11%, respectively. More details of the trend uncertainty assessment can be found in Annex 2.
Completeness of the national inventory
The Netherlands GHG inventory includes almost all sources that, according to the 2006 IPCC Guidelines, should be included in the inventory. The following very minor sources are not included:
• CO2 from Asphalt roofing (2A4d), due to missing activity data; • CO2 from Road paving (2A4d), due to missing activity data; • CH4 from Enteric fermentation of poultry (3A4), due to missing
EFs;
• N2O from Industrial wastewater treatment (5D2) and septic tanks (5D3), due to negligible amounts;
• Part of CH4 from Industrial wastewater (5D2 sludge), due to negligible amounts;
• Precursor emissions (i.e. CO, NOx, NMVOC and SO2) from memo item ‘International bunkers’ (international transport).
Precursor emissions (carbon monoxide (CO), nitrogen oxide (NOx), non-methane volatile organic compounds (NMVOC) and sulphur dioxide (SO2)) from memo item ‘International bunkers’ (international transport) are not included.
Methodological changes, recalculations and improvements
Compared to the NIR2018, some improvements of the inventory (including recalculations) have been implemented and documented in this NIR2019. The rationale behind the recalculations is documented in Chapters 3–10. Table ES.4 shows the results of these recalculations in the NIR2019 compared with the NIR2018.
Table ES.4: Differences between the NIR2019 and NIR2018 due to recalculations (in Tg CO2 eq. including indirect CO2 emissions; F-gases in Gg CO2 eq.)
Source 1990 2000 2010 2016 CO2 NIR 2019 169.8 178.5 188.1 172.2 Incl. NIR 2018 169.2 178.3 188.5 172.3 LULUCF Difference 0.4% 0.1% -0.2% 0.0% CO2 NIR 2019 163.3 172.5 182.6 166.8 Excl. NIR 2018 163.1 172.3 182.4 165.7 LULUCF Difference 0.1% 0.1% 0.1% 0.7% CH4 NIR 2019 31.9 24.3 19.4 18.3 NIR 2018 32.0 24.4 19.6 18.6 Difference -0.3% -0.5% -1.0% -1.3% N2O NIR 2019 18.0 16.2 8.6 8.5 NIR 2018 17.7 15.9 8.4 8.4 Difference 1.7% 1.8% 3.4% 1.6% PFCs NIR 2019 2663 1903 314 152 NIR 2018 2663 1903 314 152 Difference 0.0% 0.0% 0.0% 0.0% HFCs NIR 2019 5606 4765 2669 1876 NIR 2018 5606 4764 2677 2418 Difference 0.0% 0.0% -0.3% -22.4% SF6 NIR 2019 207 259 154 134 NIR 2018 207 259 154 134 Difference 0.0% 0.0% 0.0% 0.0% Total NIR 2019 228.2 225.9 219.4 201.4 Tg CO2-eq. NIR 2018 227.3 225.5 219.6 201.9 Incl. LULUCF Difference 0.4% 0.2% -0.1% -0.3% Total NIR 2019 221.7 219.8 213.8 195.8
Tg CO2 eq. NIR 2018 221.3 219.4 213.4 195.2
Excl.
LULUCF Difference 0.2% 0.2% 0.2% 0.3%
Improving the QA/QC system
The QA/QC (quality assurance/quality control) programme is up to date and all procedures and processes meet National System requirements (as part of the annual activity programme of the Netherlands’ PRTR). QA/QC activities, to be undertaken as part of the National System, are described in Chapter 1.
Emissions trends for indirect GHGs and SO2
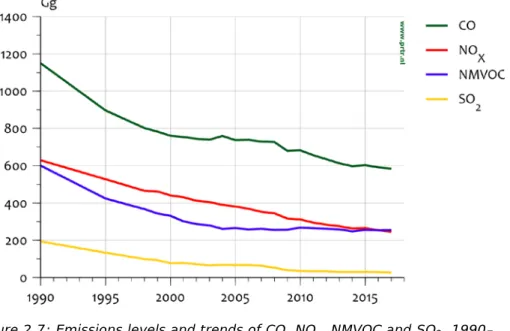
Compared with 1990, CO and NMVOC emissions were reduced in 2017 by 54% and 66%, respectively. For SO2, the reduction was 86%; for NOx, the 2017 emissions were 62% lower than the 1990 level. Table ES.5 provides trend data.
Table ES.5: Emissions trends for indirect GHGs and SO2 (Gg) 1990 1995 2000 2005 2010 2015 2016 2017 Total NOX 586 486 399 349 287 241 230 223 Total CO 1,248 976 905 747 677 597 586 579 Total NMVOC 519 375 272 210 206 185 177 178 Total SO2 187 126 71 62 33 30 28 27
Introduction
1.
1.1 Background information on greenhouse gas inventories and climate change
1.1.1 Background information on climate change reporting
Climate Convention, Kyoto Protocol and EU Monitoring Mechanism Regulation
The United Nations Framework Convention on Climate Change
(UNFCCC) was ratified for the European part of the Netherlands in 1994 and took effect in March 1994. In 2005, the Kyoto Protocol (KP) under the Convention entered into force. Rules for Monitoring, Reporting and Verification (MRV), initially agreed under the Convention itself, have been further elaborated in the KP under the articles 5, 7 and 8; and have been implemented successively. The “National System” under article 5.1 of the KP, has been reviewed (art 8 of the KP) and accepted for the Netherlands in 2007. The Greenhouse gas (GHG) inventory is prepared on an annual basis under this national system (article 7.1 of the KP). The latest in country review of the inventory in 2017 confirmed that the Netherlands inventory and inventory process are still in line with the rules for national systems.
The inventory is accompanied by the Common Reporting Format (CRF), representing the national GHG emissions of the Netherlands. The methodologies applied for calculating the emissions, are in accordance with the Guidelines of the IPCC, as agreed upon in 2006.
Besides, both the inventory and this National Inventory Report are in line with the rules of the European Commission; as laid down in the EU Monitoring Mechanism Regulation (EU 525/2013).
This national inventory report (NIR), together with the Common Reporting Format (CRF), represents the 2019 national emissions
inventory of GHGs under the UNFCCC and the KP (Part I of this report). Additional reporting requirements under the KP, other than inventory related issues, are included inPart II of this report.
Geographical coverage
The reported emissions are those that derive from the legal territory of the Netherlands. This includes a 12-mile zone out from the coastline and inland water bodies. It excludes Aruba, Curaçao and Sint Maarten, which are constituent countries of the Kingdom of the Netherlands. It also excludes Bonaire, Saba and Sint Eustatius, which since 10 October 2010 have been public bodies (openbare lichamen) with their own legislation that is not applicable to the European part of the Netherlands.
Emissions from offshore oil and gas production on the Dutch part of the continental shelf are included
1.1.2 Background information on the GHG emissions inventory
The NIR (and CRF) cover the seven direct GHGs included in the Kyoto Protocol: carbon dioxide (CO2), methane (CH4), nitrous oxide (N2O), hydrofluorocarbons (HFCs), perfluorocarbons (PFCs), sulphur
hexafluoride (SF6) and nitrogen trifluoride (NF3) (the last four are called the F-gases). NF3 is included in the figure for PFCs. Emissions cannot be
reported separately due to the confidentiality of the data. The
Netherlands reports total greenhouse gas emissions including indirect CO2 emissions. Besides, emissions of the following indirect GHGs are also reported: nitrogen oxides (NOx), carbon monoxide (CO), non-methane volatile organic compounds (NMVOC) and sulphur oxides (SOx).
This report provides explanations of the trends in GHG emissions per gas and per sector for the period 1990–2017. It summarizes the methods and data sources used for:
(a) Approach 1 assessments of the uncertainty in annual emissions and in emissions trends;
(b) Key source assessments following Approach 1 and Approach 2 of the 2006 IPCC Guidelines;
(c) Quality assurance and quality control (QA/QC) activities. This inventory report does not include detailed assessments of the extent to which changes in emissions are due to the implementation of policy measures. This information can be found in: ‘The Netherlands State of the Environment Report 2018’ (biennial edition; in Dutch: ‘Balans van de Leefomgeving’) (PBL, 2018), the 7th Netherlands National Communication under the United Nations Framework Convention on Climate Change (NC7: EZK, 2017a) and the Third Biennial Report (BR3: EZK, 2017b).
The Netherlands also reports emissions under other international agreements, such as the United Nations Economic Commission for Europe (UNECE) Convention on Long Range Transboundary Air Pollutants (CLRTAP) and the EU’s National Emission Ceilings (NEC) Directive. All emissions estimates are taken from the Netherlands’ Pollutant Release and Transfer Register (PRTR), which is compiled by various cooperating organizations, as further described in box 1 and table 1.3 underneath. The GHG emissions inventory and the PRTR share underlying data, which ensures consistency between the inventories and other internationally reported data.
In line with the requirements of the National System and in accordance with Art 5.1 of the KP, both the National System and the methodologies for calculating the GHG emissions in the Netherlands are kept up to date on an annual basis. Information on the latest changes to the National System is reported in Chapter 13 of this report.
Since 2015, emissions data are calculated according to the 2006 IPCC Guidelines (IPCC, 2006).The methodologies applied in the Netherlands are documented in five methodology reports, one for each PRTR Task Force. The NIR2019 is based on these methodologies. The methodology reports are an integral part of this submission (see Annex 7) and are available at the National System website http://english.rvo.nl/nie. The methodology reports and any changes in methodologies are reviewed by the National Inventory Entity (NIE) and approved by the chairperson of the PRTR Task Force concerned. Changes in methodologies are also described in the NIR; both in the relevant chapters as well as in chapter 10 (documenting recalculations and improvements made following the recommendations of the latest reviews).
The structure of this report complies with the format required by the UNFCCC (FCCC/SBSTA/2004/8 and the latest annotated outline of the National Inventory report, including reporting elements under the Kyoto Protocol). It also includes supplementary information under Article 7 of the Kyoto Protocol. This information is included in Part II of the NIR. Greenhouse gas (GHG) emissions are given in gigagrams (Gg) and teragrams (Tg) in this report. Global warming potential (GWP) weighted emissions of the GHGs are also provided (in CO2 equivalents), using GWP values based on the effects of GHGs over a 100-year horizon, in accordance with UNFCCC Decision 24/CP.19 Annex III (UNFCCC, 2013). The GWP of each individual GHG is given in Annex 7.
The Common Reporting Format (CRF) spreadsheet files accompany this report as electronic annexes. The CRF tables contain detailed
information on GHG emissions, activity data and (implied) emission factors (EFs) by sector, source category and GHG. The complete set of CRF tables and this report comprise the NIR, which is published on the website http://english.rvo.nl/nie.
1.1.3 Background information on supplementary information required by
Article 7 of the Kyoto Protocol
Part II of this report provides the supplementary information required by (Article 7 of) the Kyoto Protocol. This supplementary information on Land use, land use change and forestry according the Kyoto Protocol definitions (KP-LULUCF) pertains to activities under Article 3, paragraph 3, and Forest management, the mandatory activity under Article 3, paragraph 4, of the Kyoto Protocol. The Netherlands has elected not to include any other activities under Article 3, paragraph 4, of the Kyoto Protocol.
Information on the accounting of Kyoto units is also provided in the SEF file RREG1_NL_2018_2_1.xlsx
1.2 A description of the national inventory arrangements
1.2.1 Institutional, legal and procedural arrangements
The Ministry of Economic Affairs and Climate Policy (EZK) bears overall responsibility for climate change policy issues, including the preparation of the national GHG emissions inventory.
In December 2005, the Netherlands Enterprise Agency (RVO.nl) was designated by law as the National Inventory Entity (NIE), the single national entity required under the Kyoto Protocol. In addition to the coordination of the establishment and maintenance of a National System, the tasks of RVO.nl include overall coordination of improved QA/QC activities as part of the National System and coordination of the support/response to the UNFCCC review process. The National System is described in greater detail in the Seventh Netherlands National
Communication under the United Nations Framework Convention on Climate Change (NC7: EZK, 2017a).
The RIVM has been assigned by the EZK as the institute responsible for coordinating the compilation and maintenance of the pollutants emission register/inventory (PRTR system), which contains data on approximately 350 pollutants, including GHGs. The PRTR project system is used as the
basis for the GHG emissions documented in this NIR and for the
completion of the CRF tables. RIVM is also coordinating the compilation of the National Inventory Report.
1.2.2 Overview of inventory planning, preparation and management
The Dutch PRTR system has been in operation in the Netherlands since 1974. This system encompasses data collection, data processing and the registering and reporting of emissions data for approximately 350
policy-relevant compounds and compound groups that are present in air, water and soil. The emissions data are produced in an annual (project) cycle (RIVM, 2018). This system also serves as the basis for the national GHG emissions inventory. The overall coordination of the PRTR is outsourced by the EZK to the RIVM.
The main purpose of the PRTR project is the production of an annual set of unequivocal emissions data that is up to date, complete, transparent, comparable, consistent and accurate. In addition to the RIVM, various external agencies contribute to the PRTR by performing calculations or submitting activity data (see Box 1).
Box 1 Pollutant Release and Transfer Register (PRTR) project
Responsibilities for coordination of the PRTR project
Major decisions on tasks and priorities are taken by the Steering Committee ER (SCER) by approval of the Annual Work Plan. This committee consists of representatives of the commissioning ministries, regional governments, the RIVM and the PBL.
The PRTR project leader at the RIVM acts as coordinator and is
responsible for the PRTR process; the outcomes of that process are the responsibility of the bodies involved. The collaboration of the various bodies is ensured by means of contracts, covenants or other
agreements. Task Forces
Various emissions experts from the participating organizations take part in the Task Forces that calculate national emissions from 650 emission sources. A formal agreement is drawn up by all the participating organizations. After intensive checking, national emissions figures are accepted by the leader of the PRTR project and the data set is stored in the Central Database.
The 650 emissions sources are logically divided into 55 work packages. An emissions expert is responsible for one or more work packages, the collection of the data and the calculation of the emissions. The experts are also closely involved in developing the methodologies to calculate the emissions. Work packages are grouped into five Task Forces, as described below.
Task Force on Energy, Industry and Waste Management (ENINA)
Covers emissions to air from the Industry, Energy production, Refineries and Waste management sector. ENINA includes emissions experts from the following organizations: RIVM, TNO, Statistics Netherlands (CBS), Rijkswaterstaat Environment (Waste Management Department and Fugro-Ecoplan.
Task Force on Transportation
Covers the emissions to soil and air from the Transportation sector (aviation, shipping, rail and road transport). The following organizations are represented: PBL (Netherlands Environmental Asssessment Agency), CBS, RIVM, Rijkswaterstaat- and TNO.
Task Force on Agriculture
Covers the calculation of emissions to soil and airfrom agriculture. Participating organizations include RIVM, PBL, Wageningen
environmental Research (WenR), Wageningen economic Research (WecR) and CBS.
Task Force on Water (MEWAT)
Covers the calculation of emissions from all sectors to water. MEWAT includes Rijkswaterstaat, Deltares, PBL, RIVM, CBS and TNO.
Task Force on Consumers and other sources of emissions (WESP) Covers emissions caused by consumers, trade and services. The members are emissions experts from RIVM and TNO.
1.2.2.1 Responsibility for reporting
The NIR Part I is prepared by the RIVM as part of the PRTR project. Most institutes involved in the PRTR also contribute to the NIR. In addition, the Netherlands Enterprise Agency (RVO.nl) is involved in its role as NIE. RVO.nl also prepares most of the NIR Part II. RIVM integrates all information into the NIR. RVO.nl takes care of submission to the UNFCCC in its role as NIE. Submission to the UNFCCC takes place only after approval by the EZK.
1.2.2.2 Overview of the inventory preparation and management under Article 7 of the Kyoto Protocol
Following the annotated outline, the supplementary information, as required according to Article 7 of the Kyoto Protocol, is reported in the NIR Part II. This information is prepared by the RVO.nl using information from various other organizations involved, such as the NEa (Dutch Emissions Authority), the WUR and the EZK.
1.2.3 Reporting, QA/QC, archiving and overall coordination
The NIR is prepared by the RIVM with input from the relevant PRTR Task Forces and from RVO.nl. The preparation of the NIR also includes the documentation and archiving of statistical data for the estimates and QA/QC activities. The EZK formally approves the NIR before it is submitted; in some cases, approval follows consultation with other ministries. RVO.nl is responsible for coordinating QA/QC and responses to the EU and for providing additional information requested by the UNFCCC after the NIR and the CRF have been submitted. RVO.nl is also responsible for coordinating the submission of supporting data to the UNFCCC review process.
For KP-LULUCF, consistency with the values submitted for the Convention is assured by using the same base data and calculation structure. The data, as required in the KP-LULUCF CRF tables, are derived from these Convention calculations using specific aggregation to
the KP-LULUCF activities. The data and calculations are thus subject to the same QA/QC procedures (Arets et al., 2019).
The calculated values were generated using the LULUCF bookkeeping model at Wageningen Environmental Research and checked by the LULUCF sectoral expert. Consecutively, they were sent to the NL-PRTR for entering the data into the CRF database for all sectors, and checked again. Any unexpected or incomplete values were reported to the
LULUCF sectoral expert, checked and, if necessary, corrected. 1.2.3.1 Information on the QA/QC plan
The National System, in line with the Kyoto requirements, was finalized and established by the end of 2005. As part of this system, the Act on the Monitoring of Greenhouse Gases also took effect in December 2005. This Act required the establishment of the National System for the monitoring of GHGs and empowered the Minister of Economic Affairs and Climate Policy (EZK) to appoint an authority responsible for the National System and the National GHG Emissions Inventory. In a subsequent regulation, the Minister appointed RVO.nl as the NIE (National Inventory Entity, the single national entity required under the Kyoto Protocol). As part of its National System, the Netherlands has developed and implemented a QA/QC programme. This programme is assessed annually and updated, if necessary. The key elements of the current programme (RVO.nl, 2018) are summarized in this chapter, notably those relating to the current NIR.
1.2.3.2 QA/QC procedures for the CRF/NIR2019
The system of methodology reports was developed and implemented in order to increase the transparency of the inventory (including
methodologies, procedures, tasks, roles and responsibilities with regard to inventories of GHGs). Transparent descriptions of all these aspects are included in the methodology reports for each gas and sector and in process descriptions for other relevant tasks in the National System. The methodology reports are assessed annually and updated, if necessary. Several QC issues relate to the NIR:
• The ERT recommended in 2017 providing more information in the NIR, and this is now included in the methodology reports (which are an integral part of this 2019 submission, see Annex 7). The methodology reports sometimes refer to background
documentation. Most of the background documentation is in English and can be made available for review purposesThe Task Forces are eager to continuously improve the quality and
transparency of the methodology reports.
• In 2017 the Netherlands started a special project for the
improvement of notation keys in the CRF tables. This resulted in much better filling of CRF with notation keys.
• For the NIR 2019, changes were incorporated into both methodology reports and background documents. The methodology reports are available on the National System website (http://english.rvo.nl/nie) and are an integrated part of the NIR 2019 (see Annex 7).
To facilitate the general QC checks, a checklist was developed and implemented. A number of general QC checks have been added to the annual work plan of the PRTR and are also mentioned in the
methodology reports. The QC checks included in the work plan are aimed at covering issues such as the consistency, completeness and correctness of the CRF data. The general QC for the present inventory was largely performed at the institutes involved as an integrated part of their PRTR work (Wever, 2011).
The PRTR Task Forces filled in a standard-format database with
emissions data for 1990–2017 (with the exception of LULUCF). After a first check of the data by the RIVM for completeness, the (corrected) data were made available to the relevant Task Forces for consistency checks and trend analyses (comparability, accuracy). The Task Forces had access to the national emissions database. Several weeks before the dataset was fixed, a trend verification workshop was organized by the RIVM (6 December 2018). The conclusions of this workshop (including how the Task Forces should resolve the clarity issues that had been identified) are documented at RIVM. Further improvements to the database were then implemented by the Task Forces.
Basic LULUCF data (e.g. forest inventories, forests statistics and land use maps) do not have the same routing as the other basic data (see Figure 1.1). QA/QC for these data are elaborated in the description of QA/QC of the external agencies (Wever, 2011).
QA for the current NIR2019 includes the following activities:
• In preparing this NIR2019, the results of former UNFCCC reviews and ESD reviews are taken into account and the requested improvements were made;
• Usually the draft NIR is also subject to a public review in January/February. Due to problems encountered with the generation of CRF files, it was not possible to timely deliver a draft NIR for the planned public review. It was decided not to conduct a public review in 2019. For 2020, the Netherlands has planned the next public review;
• Due to organizational problems, the annual peer review has been postponed to April/May 2019. Results of the peer review will addressed in the NIR 2020;
The QA/QC system must operate within the available resources (both capacity and finance). Within those means, QA/QC activities especially focus on:
• The QA/QC programme (RVO.nl, 2018), which has been
developed and implemented as part of the National System. This programme includes quality objectives for the National System, the QA/QC plan and a schedule for the implementation of the activities. It is updated annually as part of an ‘evaluation and improvement cycle’ for the inventory and National System and is kept available for review. Figure 1.1 summarizes the main
elements of the annual QA/QC cycle, including the corresponding timeline. To ensure high-quality and continuous improvement, the annual inventory process is implemented as a cyclical project.
This cycle is a key quality management tool (based on the Deming cycle of Plan–Do–Check–Act).
Figure 1.1: QA/QC cycle (including timeline)
• Adaptation of the PRTR project to the quality system of the RIVM
(ISO 9001:2008 system), completed in 2012;
• The annual work plan of the RIVM (RIVM, 2018). The work plan
describes the tasks and responsibilities of the parties involved in the PRTR process, such as products to be delivered, scheduling (planning) and emissions estimation (including the methodology reports on GHGs), as well as those of the members of the Task Forces. The annual work plan also describes the general QC activities to be performed by the Task Forces before the annual PRTR database is fixed (see Section 1.6.2).
• European Emission Trading Scheme (EU-ETS). Selected
companies (large emitters) are part of the EU-ETS. They are obliged to report their CO2 emissions in accordance with strict monitoring procedures, which include strict QA/QC. The reported emissions are checked and approved by the Dutch Emission authority (NEa) and used in the inventory for QC and to calculate specific EFs.
• Agreements/covenants between the RIVM and other institutes
involved in the annual PRTR process. The general agreement is that, by accepting the annual work plan, the institutes involved commit themselves to deliver capacity for the work/products specified in that work plan. The role and responsibility of each institute have been described (and agreed upon) within the framework of the PRTR work plan.
• Specific procedures that have been established to fulfil the
QA/QC requirements of the UNFCCC and Kyoto Protocol. General agreements on these procedures are described in the QA/QC programme as part of the National System. The following specific
procedures and agreements have been described in the QA/QC plan and the annual PRTR work plan:
o QC on data input and data processing, as part of the annual trend analysis and consolidation of the database following approval of the institutions involved;
o Documentation of the consistency, completeness and correctness of the CRF data (also see Section 1.6.2). Documentation is required for all changes in the historical dataset (recalculations) and for emissions trends that exceed 5% at the sector level and 0.5% at the national total level. In setting these levels the Netherlands is strict, as, according to the IPCC 2006 Guidelines, only changes in trend greater than 10% need to be checked.
o Peer reviews of the CRF tables and NIR by RVO.nl and institutions not directly involved in the PRTR process;
o Public review of the draft NIR: Every year, RVO.nl organizes a public review (via the internet). Relevant comments are incorporated into the final NIR.
o Audits: In the context of the annual work plan, it has been agreed that the institutions involved in the PRTR will inform the RIVM about forthcoming internal audits. Furthermore, RVO.nl is assigned the task of organizing audits, if needed, of relevant processes or organizational issues within the National System.
o Archiving and documentation: Internal procedures are agreed (in the PRTR annual work plan) for general data collection and the storage of fixed datasets in the RIVM database, including the documentation/ archiving of QC checks. Since 2012, the RIVM database has held storage space where the Task Forces can store the data needed for their emissions calculations. The use of this storage space is optional, as the storage of essential data is also guaranteed by the quality systems at the external agencies.
o The methodology reports have been updated and documented and are an integral part of this submission (see Annex 7); they will be published on the website
http://english.rvo.nl/nie. To improve transparency, the implemented QC checklists have also been documented and archived, as part of the QA/QC plan. RVO.nl (as the NIE) maintains the National System website and a central archive of relevant National System documents.
o Whenever a contributing institution cites or quotes data from the annually fixed database in their own reports, their own QA/QC procedures apply.
• Annual inventory improvement: Within the inventory project,
resources are made available to keep the total inventory up to the latest standards. In an annual cycle, the Task Forces are invited to draft proposals for the improvement of their emissions estimates. The proposals are prioritized in a consensus process and budgets are made available for the selected improvements. The available resources have to be shared between the different items of the inventory (GHG, air pollutants and water emissions). GHG-related issues are given high priority when they relate to improvements of key source estimates and/or if the reviews ask
for specific improvements in methods or activity data. Proposals for improvements that contribute to a decrease in the uncertainty of emissions estimates are given priority over others. All planned improvements are documented in the annual work plan.
• Evaluation: Those involved in the annual inventory tasks are
invited once a year to participate in an evaluation of the process. In this evaluation, the results of any internal and external
reviews and evaluations are taken into account. The results are used for the annual update of the QA/QC programme and the annual work plan.
• Category-specific QC: The comparison of emissions data with
data from independent sources was one of the actions proposed in the inventory improvement programme. However, because it did not seem possible to reduce uncertainties substantially through independent verification (measurements) – at least not on a national scale – this issue has received low priority. In the PRTR project over the last two years, efforts have been made to improve and update the assessment of uncertainties and the sector-specific QC activities. A revised uncertainty assessment (Approach 2 using Monte Carlo analysis) of Dutch GHG emissions is included in this NIR.
1.2.3.3 Verification activities for the CRF/NIR2019
Two weeks prior to a trend analysis meeting, a snapshot from the database was made available by the RIVM in a web-based application (Emission Explorer, EmEx) for checking by the institutes and experts involved (PRTR Task Forces). This allowed the Task Forces to check for level errors and inconsistency in the algorithms/methods used for calculations throughout the time series. The Task Forces performed checks for all gases and sectors. The sector totals were compared with the previous year’s dataset. Where significant differences were found, the Task Forces evaluated the emissions data in greater detail. The results of these checks were then brought up for discussion at the trend analysis workshop and subsequently documented.
During the trend analysis, the GHG emissions for all years between 1990 and 2017 were checked in two ways:
(1) The datasets from previous years’ submissions were compared with the current submission; emissions from 1990 to 2016 should be identical to those reported last year for all emissions for which no methodological changes have been announced.
(2) The data for 2017 were compared with the trend development for each gas since 1990. Checks of outliers were carried out at a more detailed level for the sub-sources of all sector background tables:
• Annual changes in emissions of all GHGs; • Annual changes in activity data;
• Annual changes in implied emission factors (IEFs); • Level values of IEFs.
Exceptional trend changes and observed outliers were noted and discussed at the trend analysis workshop, resulting in an action list. Items on this list must either be processed within two weeks or be dealt with in the following year’s inventory.
All the above-mentioned checks were included in the annual project plan for 2018 (RIVM, 2018). Furthermore, data checks (also for non-GHGs) were performed. To facilitate the data checks and the trend verification workshop, three types of data sheet were prepared from the PRTR emissions database:
• Based on the PRTR emissions database, a table with a comparison of emissions in 2016 and 2017. In this table, differences of >5% at sector level were used to document trends;
• A table with a comparison of data from the two sources, to check that no errors had occurred during the transfer of data from the PRTR emissions database to the CRF tables.
The data checks were performed by sector experts and others involved in preparing the emissions database and the inventory. Communications (emails) between the participants in the data checks were centrally collected and analysed. This resulted in a checklist of actions to be taken. This checklist was used as input for the trend verification workshop and was supplemented by the actions agreed in this workshop. Furthermore, in the trend verification workshop, trends of >5% at sector level were explained. Table 1.1 shows the key verification actions for the CRF tables/NIR2019.
Table 1.1: Key actions for the NIR2019
Item Date Who Result Documentation
Automated initial check on internal and external data consistency
During each
upload Data Exchange Module (DEX) Acceptation or rejection of uploaded sector data Upload event and result logging in the PRTR database Input of
outstanding issues for this inventory
4-07-2018 RIVM-PRTR List of remaining
issues/actions from last inventory
Actiepunten voorlopige cijfers 2017 v4 juli 2018. xls
Comparison sheets
with final data 5-12-2017 RIVM Input for trend analyses Verschiltabel_LuchtIPCC_19-11-2018.xls Trend analysis 6-12-2017 Task Forces Updated action list Actiepunten definitieve
cijfers 1990-2017 v 7 december 2018.xls Resolving the issues
on the action list Until 19-12-2017 Task Forces RIVM/NIC/TNO Final dataset Actiepunten definitieve cijfers 1990-2017 v 20 december 2018.xls Comparison of data
in CRF tables and EPRTR database
Until
10-2-2018 NIC/TNO First draft CRF sent to the EU and final CRF to EU
15-01-2019 15-03-2019 Writing and checks
of NIR Until 15-3-2019 Task Forces/ NIC/TNO/NIE Draft texts R:\.\NI National Inventory Report\NIR2019\NIR redactie
Generation of tables for NIR from CRF tables
Until
15-3-2019 NIC/TNO Final text and tables NIR R:\....\NIR2019 Tables and Figures v10.xlsx The completion of an action was reported on the checklist. Based on the
formally agreed to by the three principal institutes: RIVM, PBL and Statistics Netherlands. The acceptance of the dataset was, furthermore, discussed by the PRTR executive body (WEM).
The internal versions of the CRF and NIR and all documentation (emails, data sheets and checklists) used in the preparation of the NIR are stored electronically on a server at the RIVM.
1.2.3.4 Treatment of confidentiality issues
Some of the data used in the compilation of the inventory are
confidential and cannot be published in print or electronic format. For these data items, the Netherlands uses the code ‘C’ in the CRF. Although this requirement reduces the transparency of the inventory, all
confidential data nevertheless can be made available to the official review process of the UNFCCC.
1.3 Inventory preparation; data collection, processing and storage
1.3.1 GHG and KP-LULUCF inventory
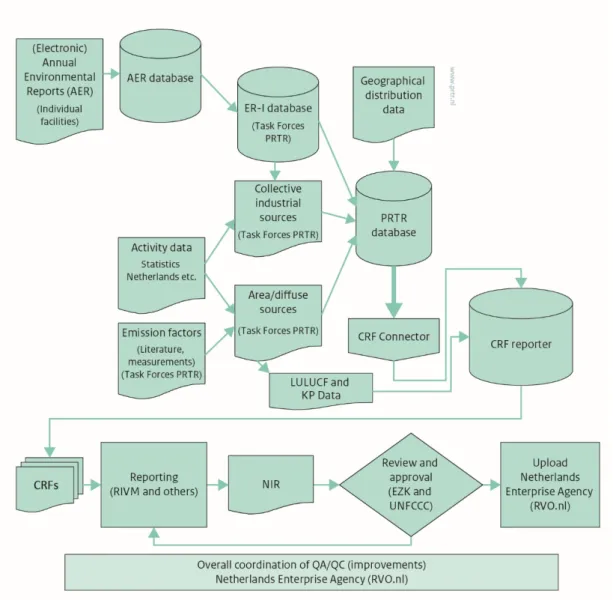
The primary process of preparing the GHG emissions inventory in the Netherlands is summarized in Figure 1.2. This process comprises three major steps, which are described in greater detail in the following sections.
The preparation of the KP-LULUCF inventory is combined with the work for reporting LULUCF by the unit Wettelijke Onderzoekstaken Natuur & Milieu, part of Wageningen UR. The LULUCF project team (which is part of the Task Force Agriculture) is responsible for data management, the preparation of the reports on LULUCF, and the QA/QC activities, and decides on further improvements.
Figure 1.2: Main elements in the GHG emissions inventory process
1.3.2 Data collection
Various data suppliers provide the basic input data for emissions estimates. The principal data sources for GHG emissions are:
Statistical data
Statistical data are provided under various (not specifically GHG-related) obligations and legal arrangements. These include national statistics from Statistics Netherlands and a number of other sources of data on sinks, water and waste. The provision of relevant data for GHGs is guaranteed through covenants and an Order in Decree prepared by the EZK.
For GHGs, relevant agreements with Statistics Netherlands and
Rijkswaterstaat Environment with respect to waste management are in place. An agreement with the Ministry of Agriculture, Nature and Food Quality (LNV) and related institutions was established in 2005.