CAN THE INLINE TRUNK ROTATION TEST
BE RELATED TO HIP IMPINGEMENT
COMPLAINTS
IN
FIELD
HOCKEY
PLAYERS? A RELIABILITY AND CASE
CONTROL STUDY
Hanne Vanden Berghe
Jérôme Vandermarliere
Stien Vanhoutte
Supervisors: Prof. Dr. Damien Van Tiggelen, Dorothée Gaeremynck
A dissertation submitted to Ghent University in partial fulfillment of the requirements for the degree of Master of Science in Rehabilitation Sciences and Physiotherapy (Rehabilitation Sciences and Physiotherapy with Musculoskeletal Afflictions)
A
CKNOWLEDGEMENTWhen submitting our thesis, we would first like to express our sincere gratitude to the people who supported us completing it.
First of all we would like to thank our supervisor, Prof. dr. Damien Van Tiggelen. His help, valuable advice and constructive feedback made it possible to write this thesis. We also want to thank him and Dorothée Gaeremynck for setting up the testing days with the Belgian national hockey teams.
Secondly, we would also like to express our gratitude to the players of the Belgian national hockey teams and all fellow students who were willing to cooperate during the test days. We would also like to thank the volunteers who were willing to give us some of their time in participating on our own test procedures.
Furthermore, we would like to thank our friends and fellow students for their help and advice. And last but not least, we would like to thank our parents and families for all the support and efforts they have put in to help us complete our studies.
T
ABLE
OF
CONTENTSAcknowledgement 3
Table of contents 4
List of figures and tables 6
List of abbreviations 8
Abstract 9
Introduction 11
Inline trunk rotation test: case control study 14
Methods 14 Study design 14 Subjects 14 Instrumentation 15 Procedures 15 Statistical procedures 16 Results 18
Demographic and descriptive data 18
Comparison of the ITRT: impingement vs non-impingement 20
Discussion 23
Limitations 27
Inline trunk rotation test: reliability study 28
Methods 28
Subjects 28
Experimental approach to the problem 28
Examiners 29
Instrumentation 29
Procedures 30
Statistical procedures 33
Results 35
Demographic and descriptive data 35
Reliability 36
Correlation between ITRT, seated rotation, inclinometry and body length - ten volunteers 38 Correlation between ITRT, seated rotation, inclinometry and body length - Hockey teams 39
Limitations 48
Conclusion 48
Reference list 49
Abstract in lekentaal 55
Bewijs van indiening ethisch comité 56
Appendix 1 58
L
IST
OF
FIGURES
AND
TABLES Figure 1: FADIR-testFigure 2: Percentage of players with or without impingement per position Figure 3: Percentage of players with impingement according to position Figure 4: Percentage of players with or without impingement per team Figure 5: Clinometer app
Figure 6: Mat seated rotation
Figure 7: Starting position of the inclinometry Figure 8: Rotations in flexed hip position Figure 9: Rotations in extended hip position Figure 10: Seated rotation test
Figure 11: Boxplot of the ITRT
Table 1: Demographic data - case control Table 2: Descriptive statistics - case control
Table 3: The Independent-Samples T-test and the Mann-Whitney U-test between subjects with impingement and without impingement
Table 4: The Paired Student’s T-test between right-sided impingement and no impingement and the Wilcoxon Matched-Pairs Signed-Ranks test between left-sided impingement and no impingement
Table 5: The Paired Student’s T-test between impingement right side and asymptomatic left side of the same player
Table 6: Wilcoxon Matched-Pairs Signed-Ranks test between impingement left side and asymptomatic right side of the same player
Table 7: Demographic data - reliability study Table 8: Descriptive statistics - reliability study
Table 9: Intraclass Correlation Coefficient of the Intrarater Reliability
Table 10: Intraclass Correlation Coefficient of the Interrater Reliability Procedure 1
Table 11: Intraclass Correlation Coefficient of the Interrater Reliability Procedure 2; E1, E2 and E3 together
Table 12: Pearson’s Correlation between seated rotation and Inline Trunk Rotation Table 13: Pearson’s Correlation between Range of Motion and Inline Trunk Rotation Table 14: Pearson’s Correlation between body length and Inline Trunk Rotation
Table 15: Descriptive statistics - Hockey teams
Table 16: Pearson’s Correlation between Seated rotation and Inline Trunk Rotation - Hockey teams
Table 17: Pearson’s Correlation between Range of Motion and Inline Trunk Rotation - Hockey teams
Table 18: Pearson’s Correlation between body length and Inline Trunk Rotation - Hockey teams
Appendix 1
Figure 12: Instrumentation ITRT Figure 13: Starting position ITRT
Figure 14: Neutral measurements for right rotation with right leg in front
L
IST
OF
ABBREVIATIONS FAI: femoroacetabular impingement ROM: range of motionITRT: inline trunk rotation test
FADIR: flexion, adduction, internal rotation of the hip BNT: Belgian national team
RR: ITRT movement with the right foot in front and rotation to the right side RL: ITRT movement with the right foot in front and rotation to the left side LL: ITRT movement with the left foot in front and rotation to the left side LR: ITRT movement with the left foot in front and rotation to the right side ICC: intraclass correlation coefficient
1. A
BSTRACTBackground
Athletic screening protocols implement functional performance tests to identify individuals with possible higher injury risk. Hip and groin pain, including femoroacetabular impingement (FAI), are common complaints in athletes. Athletes with FAI often have a lower range of motion (ROM) in the hip, but these findings are mostly based on single joint measurements. The question arose whether it is possible to find a ROM deficit through a physical performance test in a sport specific movement pattern. Therefore, the Inline Trunk Rotation Test (ITRT) was developed to examine the functional movement in field hockey players.
Study design and objectives
A case control and reliability study with aims to investigate whether FAI has an influence on the results of the ITRT and to examine the reliability of the ITRT.
Methods
114 male field hockey players of the Belgian national teams underwent the ITRT. They were also examined for hip impingement complaints using the FADIR-test. To interpret the results, the hockey players were divided into two groups, namely players with and without hip impingement complaints. The ITRT was then compared between both groups. Along with this, a reliability study of ITRT was conducted with ten volunteers.
Results
35 of the 79 players had unilateral or bilateral impingement. Analysis revealed that there was only one significant difference of the ITRT between the impingement and non-impingement group. All other results were not significant. Intra- and interrater reliability of the ITRT were moderate to good in most of the examined procedures. No clear correlation could be found between ITRT and seated rotation or inclinometry of the hip.
Conclusions
FAI hardly affected the results of the current version of the ITRT, however a first step to reliability levels is given. A lot of questions remain concerning the value of this test to screen hockey players in the prevention of possible injuries and further research is recommended.
Achtergrond
Screening protocollen voor sporters gebruiken functionele fysieke testen om spelers te identificeren met een potentieel verhoogd blessurerisico. Heup- en liespijn, waaronder femoroacetabulair impingement (FAI), zijn vaak voorkomend bij sporters. Sporters met FAI hebben vaak een lagere bewegingsuitslag in het heupgewricht, maar deze bevindingen zijn meestal gebaseerd op metingen per afzonderlijk gewricht. De vraag stelde zich of het mogelijk is om een bewegingstekort bij atleten te bepalen met een test in een sportspecifiek bewegingspatroon. Daarom is de Inline Trunk Rotation Test (ITRT) ontwikkeld met als doel de functionele beweging bij hockeyspelers te onderzoeken.
Studieonderwerp en doelen
Een patiënt-controle en betrouwbaarheidsstudie met als doelen te zoeken of impingement de resultaten van de ITRT beïnvloedt en de betrouwbaarheid van de ITRT te onderzoeken.
Methoden
114 mannelijke hockeyspelers van de Belgische nationale teams ondergingen de ITRT. Ze werden ook onderzocht op heup impingement klachten met behulp van de FADIR-test. Om de resultaten te interpreteren, werden de hockeyspelers verdeeld in twee groepen, namelijk spelers met en spelers zonder heup impingement klachten. ITRT tussen beide groepen werd vergeleken. Hiernaast werd ook een betrouwbaarheidsonderzoek uitgevoerd omtrent ITRT op tien vrijwilligers.
Resultaten
35 van de 79 hockeyspelers hadden unilaterale of bilaterale impingement. Uit analyse bleek dat er slechts één resultaat van de ITRT significant verschilde tussen de impingement en niet-impingement groep. Alle andere resultaten waren niet significant. De betrouwbaarheid van de ITRT werd in de meeste procedures matig tot goed bevonden. Er werden echter geen duidelijke verbanden gevonden tussen ITRT met seated rotation of heup inclinometrie.
Conclusies
FAI heeft amper invloed op de resultaten van deze ITRT-versie, er is echter wel een aanzet richting betrouwbaarheidsniveaus. Er zijn dus nog veel onzekerheden omtrent het nut van deze test om hockeyspelers preventief te screenen om mogelijke blessures te voorkomen. Verder onderzoek is aangewezen.
Sleutelwoorden: hockey - femoroacetabulair impingement - inline trunk rotation test - patiënt-controle -
2. I
NTRODUCTIONOver the past years a lot of research has been done on sports performance and prevention of injuries in athletes. Identification of risk factors has been an important part of this. A systematic review preceding the present study investigated whether a lower range of motion (ROM) in the ankle and hip joints are factors that affect the risk of lower limb injuries in athletes. Earlier research has suggested that a decreased ROM can increase the risk of injuries, however the evidence that further investigated this hypothesis has not yet found a clear conclusion (Murphy et al. 2003; Dallinga et al. 2012).
Injuries are not exceptional in many popular team sports, and field hockey is no different. It is a team sport characterized by a fast-paced play with a similar overall rate of injury as handball and a higher incidence than basketball or volleyball in professional players (Junge et al. 2009; Engebretsen et al. 2013). The reported rates of injuries that restricted an athlete from participating for at least 24 hours in female high school and collegiate field hockey ranged from 53.3 to 63.1% over a period of six to ten years (Lynall et al. 2018). Injuries to the lower limbs, such as lateral ankle sprains and internal knee injuries, are especially common in field hockey (Murtaugh K. 2009; Barboza et al. 2018, Feeley et al. 2019). This has a direct impact on the performance of the team. For example, injured ice hockey players experience a significant decrease in performance during the first two weeks after their return to play (Van Pelt et al. 2019). In other team sports such as football it has been indicated that teams with a lower injury incidence and higher match availability of their players have a better team performance. These findings highlight the importance of injury prevention in relation to the chances of a team’s success (Hägglund et al. 2013).
Shooting techniques in field hockey are complex skills that require multi-joint coordination in a closed kinetic chain. During a drag flick for example, players generate large peak ground reaction forces. This energy is transferred from the ground upward through the interaction of body segments in a proximal to distal kinematic sequence. This results in an explosive sequential movement of the lower limbs, pelvis, torso, upper limbs and stick (López de Subijana et al. 2010; Ibrahim et al. 2017; Ladru et al. 2019). The drag flick is performed in a forward lunge position and requires great rotation and lateral flexion of the lumbar spine combined with high flexion angles in the hip, knee and ankle joints. This is therefore a more extreme shooting technique than a regular hit. It demands players to move close to the end of their ROM in hip flexion or extension, and external rotation, as well as flexion, extension,
lateral flexion and rotation in the lumbar spine, and the knee and ankle movements (Ng et al. 2018). The rotational motion of the trunk greatly contributes to stick velocity at ball release (López de Subijana et al. 2010; Ibrahim et al. 2017). Additionally, the angular acceleration of the hips also affects the ball velocity during a drag flick through a hip rotation at the finish of the movement (Eskiyecek et al. 2018). Due to the rotational movement combined with high angles of hip flexion, athletes who regularly perform this technique may be at a higher risk of injury. Drag flick training hours have indeed been associated with higher incidence of hip and lower back injuries in field hockey players (Ng et al. 2016).
A growing trend in sports medicine research is the implementation of functional performance tests to determine the risk of injury in athletes during a preseason screening and consequently prevent lower extremity musculoskeletal injuries (Brumitt et al. 2018; Emery & Pasanen, 2019). A meta-analysis by Bunn et al. found that, although the risk of bias in most studies was high, individuals who were classified as “high risk” in the Functional Movement Screen were 51% more likely to develop an injury compared to those with a low risk score (Bunn et al. 2019). Other functional tests were also shown to associate a suboptimal result to an increased risk of injury, such as the Star Excursion Balance Test, Y-balance test, standing long jump, single-leg hop and Lower Extremity Functional Test (Plisky et al. 2006; Dallinga et al. 2012; Brumitt et al. 2018). Although it will likely never be possible to predict every single injury in sports, a recent review by Emery & Pasanen (2019) highlights the importance of prevention strategies to reduce the incidence and severity of injuries.
Range of motion (ROM) is one of the factors that could influence the risk of an athlete sustaining a lower limb injury (Murphy et al. 2003). Although research shows mixed results and the definite answer to this hypothesis remains unclear, it could still be useful to determine a possible ROM deficit in hockey players through a physical performance test in a functional movement pattern (Dallinga et al. 2012; Murphy et al. 2003; Reiman & Manske, 2011). In this way it is not a measurement of the ROM in a single joint or a single direction, but rather the combined functional movement in a kinetic chain that is needed in the sport. Functional testing protocols should be valid and reliable and therefore take the sport-specific game demands into consideration (Bird & Markwick, 2016). With this in mind, the Inline Trunk Rotation Test (ITRT) was developed to assess the functional mobility in field hockey players. The test is performed in a lunge position in an effort to mimic the position in which a field hockey player takes a shot. The test measures the rotation of the trunk, a movement that combines the ROM of the hip, and the lumbar and thoracic spine (Lee & Wong, 2002).
The aim of the present study is to determine whether the outcome of the ITRT measurements could be linked with hip complaints in field hockey players. This is examined by means of a case control study within the Belgian national field hockey teams. Femoroacetabular impingement (FAI) is a common cause of hip complaints in athletes, resulting in activity-related hip or groin pain (Trofa et al. 2017). Bony impingement between the femoral head and acetabulum occurs in movements that combine high abduction with hip flexion, and high flexion with adduction and internal rotation (Han et al. 2020). Athletes with FAI often show a decreased or asymmetrical rotational ROM in the hip joint (Trofa et al. 2017). Therefore the purpose of the case control section of the present study is to examine if a correlation exists between the results of the ITRT and impingement-related hip complaints in field hockey players.
Secondly, a physical performance test can only be used in practice if it is sufficiently reliable and valid. Proving the scientific efficacy of preventive measures is a crucial step in the model of sport injury prevention (Van Tiggelen et al. 2008). In order to be clinically useful, the first step is to establish the validity and both the intrarater and interrater reliability of the test (Hegedus et al. 2015). Therefore, the second part of the present study aimed to evaluate the inter- and intrarater reliability of the newly developed test on a group of students. A start to validity levels is examined by comparing the results of the ITRT with the outcome measures of passive internal and external rotation ROM in the hip, and the thoracic rotation by means of the seated rotation test. In summary, the study therefore consists of a combined case control study of field hockey players, and a reliability study concerning the ITRT.
3. I
NLINE
TRUNK
ROTATION
TEST:
CASE
CONTROL
STUDY3.1 Methods
3.1.1 Study design
The present study is a case control study concerning the Belgian national field hockey players. Field hockey players are susceptible to lower limb injuries, including hip complaints (Ng et al. 2016). FAI, a possible cause of pain in the athletic hip, is often found in soccer players (Zadpoor A. 2015). Field hockey and soccer have a lot in common so the question raised whether the prevalence of FAI-complaints in field hockey players is equally high and whether this limits their ability to perform. In this study a possible correlation between positive impingement tests and limited inline trunk rotation was examined. This was done by comparing the results of the inline trunk rotation test between players with hip impingement complaints and players without hip complaints of any kind.
The second part of this study consisted of a descriptive pilot reliability study concerning the newly developed Inline trunk rotation test (ITRT). In this section, the interclass- and intraclass reliability were examined, along with a possible correlation between the ITRT, the seated rotation test and the inclinometry of passive hip internal- and external rotation. This will be described further in chapter 4.
3.1.2 Subjects
The subjects were players of the Belgian national field hockey teams in the U16, U18 and U21 age divisions, and the Belgian National Team (BNT). Data were collected in September 2019. All players together, a total of 114 male subjects were recruited.
Based on the results of the hip impingement test, the group of subjects was divided into two subgroups. The first group consisted of the players who were found with at least one positive impingement test. This means that the left, right or both sides lead to a positive test. When only one side was found positive, only that side was included for data analysis in the impingement group. The players who did not have any hip impingement related complaints were put in the healthy control group. The data of the asymptomatic side of the players with unilateral impingement was not included in the control group. According to Clohisy et al. (2009), the hip range of motion is similar in the symptomatic and asymptomatic hips in
subjects with unilateral FAI. Therefore it could not be safely assumed that the ITRT results of the asymptomatic hip of these players could be included in the control group without adding bias.
For each subject with a positive impingement test, a matched control without impingement complaints was identified. Inclusion criteria for the matched controls were determined as being players from the same team or age division and who had the same position on the field. They also had to be within a limited range of height difference. Most players had a height difference of approximately 5 cm with their matched control. However, to be able to find a match for every player, the range was in some cases extended with a maximum difference of 14 cm.
The study was approved by The Ethical Committee of the Ghent University Hospital.
3.1.3 Instrumentation
The instrumentation of the ITRT is described in appendix 1. The FADIR-test, to examine FAI-complaints, only required a physiotherapy treatment table.
3.1.4 Procedures
All subjects underwent a series of tests during an organized screening day. Among the tests that were carried out, only the impingement test and the ITRT were used in the present study. The procedure of ITRT is explained in appendix 1.
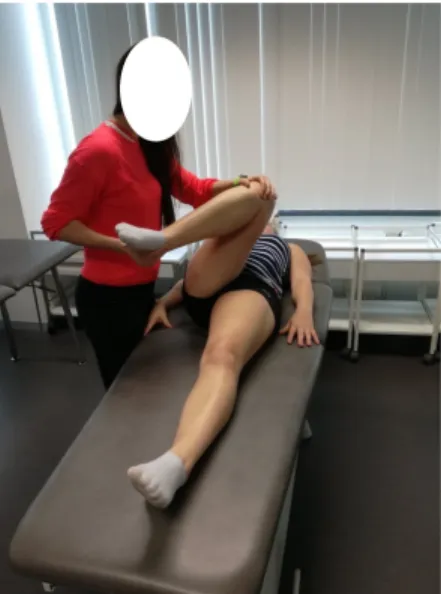
The impingement test used in this study was the FADIR-test. This consists of passive hip flexion, adduction and internal rotation (fig. 1). The subject was asked to lay down in supine position on a physiotherapy treatment table. The examiner then passively moved one leg towards a triple flexion position with additional hip adduction and internal rotation. To provoke the symptoms, the examiner applied a light force on the leg in this position directed perpendicular to the table. The test was performed on both legs. A negative test without provocation of symptoms indicated the absence of hip impingement complaints. The test was considered positive if the manoeuver recreated the characteristic type of pain that the athlete experiences during activity (Byrd T. 2014). A possible occurrence of pain in the lower back region was not counted as a positive impingement test and may instead indicate a sacroiliac joint injury. The FADIR-test is found quite sensitive but not specific (Byrd T. 2014).
Fig. 1: FADIR-test.
We used the results of the impingement test to determine whether the player was put in the case or control group. First, the results of the case group were compared to the results of the control group. After that, for each found case, a matched control was sought. The results of the ITRT of the case group were compared to the results of the matched control group. Finally, for players with only one positive side, the positive side was compared to the negative side of the same player as an additional control.
3.1.5 Statistical procedures
Data processing was performed using the SPSS Statistics software, version 26. Demographic data was summarized using descriptive statistics.
To examine whether the data distribution was normal, the Shapiro-Wilk test was used. The null hypothesis of the Shapiro-Wilk test consists of a normally distributed data collection. The alternative hypothesis would be accepted if the data distribution was found to be not normal. A p-value less than 0.05 was considered a significant result, which meant the data was not normally distributed and the null hypothesis could be rejected.
A normal data distribution was found in the non-impingement group concerning the movements with the left foot in front with rotation to the right and the right foot in front with rotation to the left. No normal distribution was found in the two homolateral movement directions. However due to the central limit theorem, which states that the distribution of the
sample means approaches a normal distribution as the sample size is over 30, these data distributions can be considered normal (Kwak & Kim, 2017). However, some data of the matched-control of the non-impingement group was not normally distributed, this being the left and right rotation with the left foot in front. The central limit theorem was not applicable here because of the smaller sample size. In the impingement group, all data distributions were found to be normal, except one. The central limit theorem was also not applicable here due to the smaller sample size. Thus, the results of the left rotation with the left foot in front could not be considered normally distributed.
To establish possible differences between the impingement and non-impingement group, either the Independent-Samples T-test was used when the data distribution was normal, or the Mann-Whitney U-test when the data distribution was not normal. In this study, 23 hockey players with impingement in the right hip were compared to the right hip of the 79 hockey players without impingement. The 25 hockey players with impingement on the left hip were also compared to the left hip of the 79 hockey players without impingement. Afterwards, the possible differences between the impingement group and the matched controls of the non-impingement group were examined. The matched controls were selected as described in section 3.1.2. The Paired Student’s T-test was used when the data distribution was normal, the Wilcoxon Matched-Pairs Signed-Ranks test when there was no normal data distribution.
Data was normally distributed in the groups of right sided impingement and their matched controls. No normal data distribution was found in the left sided impingement group and their matched controls. The Paired Student’s T-test was used to compare the 23 hockey players found with impingement complaints in the right hip and 23 matched control players without impingement complaints. This test was also used to compare the right and left hip within the players with unilateral impingement on the right side. The Wilcoxon Matched-Pairs Signed-Ranks test was used to compare the 25 hockey players with impingement complaints in the left hip to their 25 matched controls, and to compare the left and right hip within the players with unilateral impingement in the left hip.
For the Paired Student’s T-test, the Independent-Samples T-test, the Wilcoxon Matched-Pairs Signed-Ranks test and Mann-Whitney U-test, a p-value less than 0.05 was considered significant, in which case it would mean that hip impingement impacted the results of the ITRT.
3.2 Results
3.2.1 Demographic and descriptive data
The demographic data of the Belgian national field hockey teams is summarized in table 1. In the present study, 114 male players of the age categories U16, U18, U21 and the BNT were recruited. The age ranged between 15 and 29 years old.
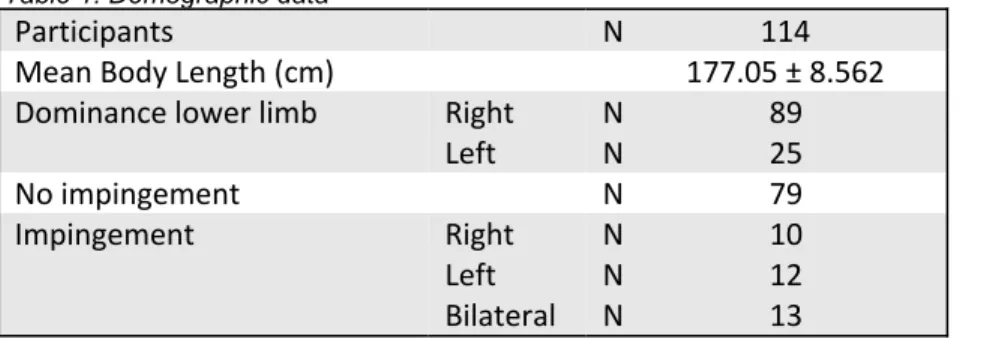
Table 1: Demographic data
Participants N 114
Mean Body Length (cm) 177.05 ± 8.562
Dominance lower limb Right N 89
Left N 25
No impingement N 79
Impingement Right N 10
Left N 12
Bilateral N 13
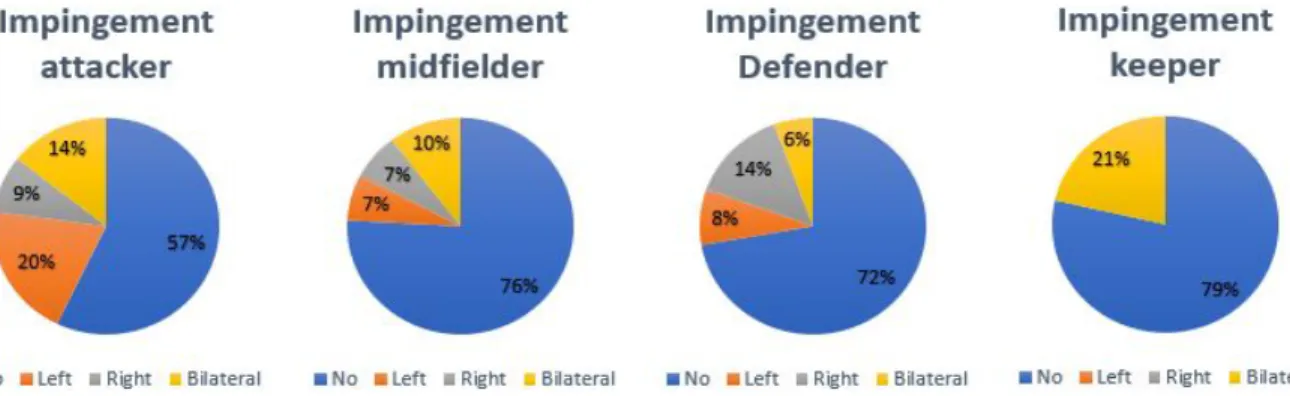
A total of 15 out of 35 strikers showed a positive hip impingement test. FAI-complaints were also found in seven of the 29 midfielders, 10 of the 36 defenders, and three of the 14 keepers (fig. 2). Of all 35 players with impingement complaints, the main proportion consisted of attackers (43%), followed by midfielders (29%), defenders (20%), and finally the keepers (8%), as shown in fig. 3. The proportion of players with a positive hip impingement test also differed through the age divisions. In the U16 team, 19% of the players had impingement complaints, in the U18 and U21 30% of the players had impingement complaints and in the national team the rate of hip impingement complaints was 50% (fig. 4).
Fig. 2: Percentage of players with or without impingement per position
Fig. 3: Percentage of players with impingement according to position
Descriptives concerning the ITRT results of all hockey players together are shown in table 2. The mean values and the standard deviations were calculated for each movement direction, together with the minimum and maximum scores for each variable.
Table 2: Descriptive statistics
Side N Mean*
Standard
Deviation Minimum Maximum
ITRT* RR 114 26.71 8.878 6 51
RL 114 19.90 5.963 4 38
LR 114 19.64 7.091 2 37
LL 114 26.54 8.461 7 50
RR: right foot in front with right rotation; RL: right foot in front with left rotation; LR: left foot in front with right rotation; LL: left foot in front with left rotation; * expressed in cm
3.2.2 Comparison of the ITRT: impingement vs non-impingement
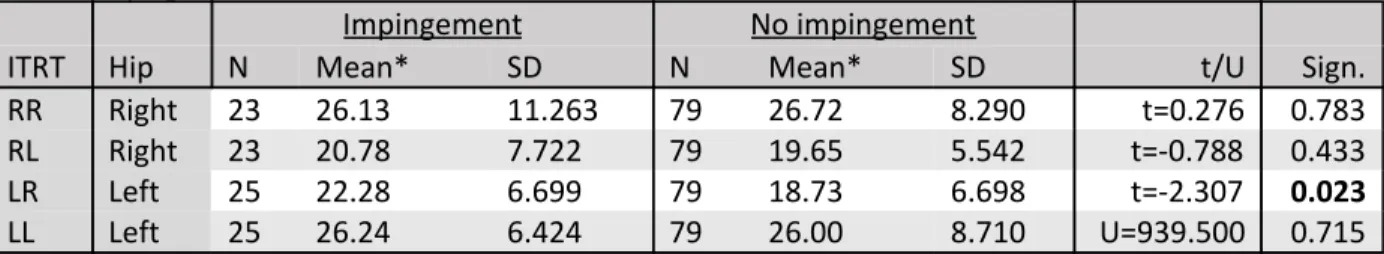
There was a total of 10 hockey players with unilateral impingement in the right hip, 12 players with unilateral impingement in the left hip, and 13 field hockey players scored positive on both sides. For the statistical analysis, the data of the right side was processed separately from the data of the left side. Therefore, the 23 cases of right-sided impingement consisted of the players with unilateral right-sided impingement and the right hip of the players with bilateral impingement complaints. The results of the ITRT for the right side of this group were then compared to the right hip of the non-impingement group. Likewise, the 25 players with impingement on the left side was the combined total of the subjects with unilateral left-sided impingement and the left hip of the players with bilateral impingement. Their data of the ITRT was then compared with the left hip of the non-impingement group. Only one significant result was found in this comparison. The ITRT with the left foot in front with heterolateral rotation (LR) was significantly larger in players with impingement (p = 0.023) (table 3).
Table 3: The Independent-Samples T-test and the Mann-Whitney U-test between subjects with impingement and without impingement
Impingement No impingement
ITRT Hip N Mean* SD N Mean* SD t/U Sign.
RR Right 23 26.13 11.263 79 26.72 8.290 t=0.276 0.783 RL Right 23 20.78 7.722 79 19.65 5.542 t=-0.788 0.433 LR Left 25 22.28 6.699 79 18.73 6.698 t=-2.307 0.023
LL Left 25 26.24 6.424 79 26.00 8.710 U=939.500 0.715 ITRT: Inline Trunk Rotation Test; Hip: tested hip in front; SD: Standard Deviation; Sign: significant; RR: right foot in front with right rotation; RL: right foot in front with left rotation; LR: left foot in front with right rotation; LL: left foot in front with left rotation; t: Independent-Samples T-test; W: Wilcoxon Matched-Pairs Signed-Ranks test; * expressed in cm
Afterwards, the same comparison was conducted as above, but instead of the whole non-impingement group, only the hips of the matched controls were included. No significant results were found in this analysis (table
4
).Table 4: The PairedStudent‘s T-test between right-sided impingement and no impingement and the Wilcoxon Matched-Pairs Signed-Ranks test between left-sided impingement and no impingement
Impingement No impingement
ITRT Hip N Mean* SD N Mean* SD t/W Sign.
RR Right 23 26.13 11.263 23 28.57 6.134 t=-0.817 0.423 RL Right 23 20.78 7.772 23 21.00 5.161 t=-0.103 0.919
LR Left 25 22.28 6.699 25 22.00 5.635 W 0.932
LL Left 25 26.24 6.424 25 25.48 5.486 W 0.452
ITRT: Inline Trunk Rotation Test; Hip: tested hip in front; SD: Standard Deviation; Sign: significant; RR: right foot in front with right rotation; RL: right foot in front with left rotation; LR: left foot in front with right rotation; LL: left foot in front with left rotation; t: PairedStudent‘s T-test; W: Wilcoxon Matched-Pairs Signed-Ranks test; * expressed in cm
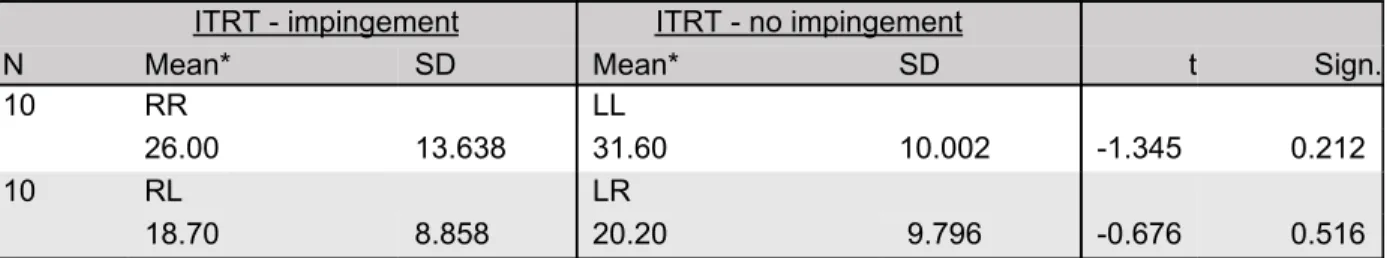
Concerning the players with unilateral impingement, the results of the ITRT were compared between both sides, thus the side with established hip impingement was compared to the side without complaints within the same player. The results for the 10 players with unilateral impingement in the right hip are presented in table 5. No significant differences were found when the ITRT was compared to the left side of the same player.
Table 5: The Paired Student‘s T-test between impingement right side and asymptomatic left side of the same player
ITRT - impingement ITRT - no impingement
N Mean* SD Mean* SD t Sign.
10 RR LL
26.00 13.638 31.60 10.002 -1.345 0.212
10 RL LR
18.70 8.858 20.20 9.796 -0.676 0.516
ITRT: Inline Trunk Rotation Test; SD: Standard Deviation; t: the test statistic for the Paired Student’s T-test; Sign: significant; RR: right foot in front with right rotation; RL: right foot in front with left rotation; LL: left foot in front with left rotation; LR: left foot in front with right rotation; * expressed in cm
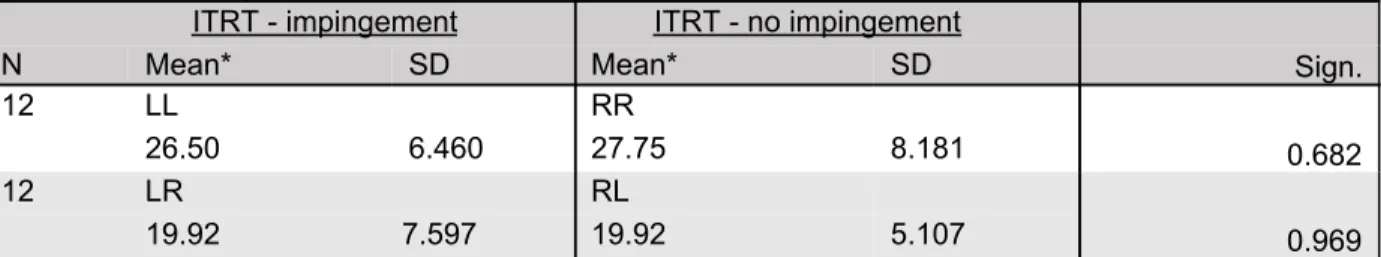
Similarly, the ITRT of the 12 players with unilateral impingement in the left hip was compared to the right, asymptomatic hip of the same player. No significant differences were found between the two sides (table 6).
Table 6: The Wilcoxon Matched-Pairs Signed-Ranks test between impingement left side and asymptomatic right side of the same player
ITRT - impingement ITRT - no impingement
N Mean* SD Mean* SD Sign.
12 LL RR 0.682 26.50 6.460 27.75 8.181 12 LR RL 0.969 19.92 7.597 19.92 5.107
ITRT: Inline Trunk Rotation Test; SD: Standard Deviation; Sign: significant; LL: left foot in front with left rotation; LR: left foot in front with right rotation; RR: right foot in front with right rotation; RL: right foot in front with left rotation; * expressed in cm
3.3 Discussion
This study investigated whether there is a link between the presence of femoroacetabular impingement related complaints and the results of the ITRT in male field hockey players. To our knowledge, the prevalence of FAI has not yet been studied in a population of field hockey players, however multiple studies confirmed that both the clinical and radiological signs of FAI are common findings in elite athletic populations of many different sports (Lee et al. 2016; Mlynarek & Coleman, 2018; Zadpoor, 2015). The present study found 35 out of 114 subjects with hip impingement complaints, counting for a proportion of 31%. Furthermore, 13 of these players suffered from bilateral impingement. A meta-analysis by Nepple et al. (2015) revealed that the pooled prevalence rate for cam deformity, a bony morphology associated with hip impingement complaints, was 29% in male athletes. Though not every athlete with cam deformity experiences symptoms and vice versa, this prevalence closely approaches the rate of FAI-complaints in the present study. As a matter of comparison, the rate of cam deformity was 19% for male controls (Nepple et al. 2015).
The prevalence of hip impingement in field hockey players increased with increasing age, with half of the players in the BNT (>21 years) showing at least one positive impingement test. This was in agreement with previous studies that reported an increasing prevalence of abnormal bony morphology linked with FAI with increasing athletic age in other field sports, such as soccer, Gaelic football and hurling (a Celtic stick-and-ball sport) (Carton & Filan, 2019; Zadpoor, 2015). Regular high intensity training during adolescent development could encourage the development of a cam deformity, especially in sports that involve repetitive high impact loading, hip flexion and internal rotation such as basketball, ice hockey and soccer (de Silva et al. 2016; Siebenrock et al. 2011). While field hockey was not investigated in those studies, the biomechanical demands of the sport match with the described movement patterns so the findings are likely to correspond to some degree. When taking the position on the field into account, players in an offensive position were most likely to have a positive impingement test. According to Kapteijns (2019), offensive strikers had a significantly higher workrate than any of the other positions, meaning the intensity during their in-game time was the highest. They also cover more distance running at speeds higher than 15 km/h. Due to these regular high intensity peaks, strikers may experience more strain in the hip joint, which could make them more prone to develop impingement.
The descriptive statistics of the ITRT revealed similar mean values for both the variations with homolateral rotation (26.71 ± 8.9 for RR and 26.54 ± 8.4 for LL), and heterolateral rotation (19.90 ± 6.0 for RL and 19.64 ± 7.0 for LR). Overall, the players had a greater range in the ITRT with homolateral rotation. The different field hockey shots and pushes can be divided into three phases: the backswing, the downswing, and the follow-through phase (Brétigny et al. 2011). The ITRT with heterolateral rotation is the most important movement during the backswing phase and the initiation of the downswing. From the moment of the impact with the ball until the end of the shot, the player completes the follow-through with a full rotation towards their front leg, which is the left leg in most of the shots or pushes. The ITRT with homolateral rotation most closely resembles this phase of the drive. The follow-through is a phase of deceleration after reaching a high velocity of movement during the downswing. The peak positive angular velocity of the stick right before or after ball release is much higher than the peak negative angular velocity that is reached during the backswing (López de Subijana et al. 2010). This could explain why a bigger ROM was reached in this direction. The maximal heterolateral rotation is reached in a more controlled way at the beginning of the drive, in order to obtain a consistent and accurate downswing after the backswing (Franks et al. 1985). Therefore the player will likely not achieve the same ROM.
In the present study, hip impingement was defined as a positive outcome of the FADIR-test, with provocation of a typical pain in the hip area. The FADIR-test was found quite sensitive but not specific, so the possibility of some false positive outcomes should be noted (Byrd et al. 2014). For an accurate diagnosis of FAI-syndrome, medical imaging would be necessary in addition to the clinical signs and symptoms of motion- or position related pain in the hip or groin (Griffin et al. 2016). The FADIR-test consists of passive hip flexion, adduction and internal rotation. When a player with a positive impingement test performed the ITRT, the expectations were that some of the results would be lower in comparison to the group without impingement. In the ITRT the front leg holds a position of hip flexion and the movement creates rotation which could therefore cause discomfort in the hip when impingement occurs. With this reasoning, a limited ITRT was especially expected for the RR and LL variations of the test, because a component of hip adduction is added to the movement when it is performed with the rotation directed towards the side of the front leg.
When comparing the results of the ITRT between the groups with and without impingement, the statistical analysis revealed that the ITRT was not significantly lower for players with
impingement. Both the analyses with the whole group of players without impingement, and with the group of matched controls agreed on this finding. One significant difference in the ITRT scores was noted in the analysis that included the whole group of healthy players as controls. The players with hip impingement had a significantly larger rotation to the right with the left foot in front (LR). The flexed hip moves towards external rotation in this ITRT variation. Although the provocative motion is most frequently internal rotation and adduction (FADIR), the FABER (hip flexion, abduction, external rotation) test is often found provocative as well in athletes with hip impingement, but the hip ROM towards external rotation is typically not restricted as reported by Carton & Filan (2019). Therefore, while the LR variation of the ITRT is performed in a position that may be provocative for impingement-related pain symptoms, the absence of a ROM deficit towards external rotation could add some slack during the test.
This one statistically significant result may not necessarily be clinically relevant, since the difference was not present in the comparison with the matched control group. It could possibly be attributed to other factors, such as the whole control group consisting of a relatively bigger proportion of younger players and players in non-offensive positions on the field. The prevalence of impingement was higher in older players and strikers so the group of matched controls consisted of players with the same profile. Apart from the goalkeepers, Kapteijns (2019) reported no differences in physiological parameters between positions in female field hockey players, although differences in physiological demands existed. Regarding ROM, no significant positional differences were found in professional soccer players (Wik et al. 2018). Therefore it is unlikely that the different distribution of player positions between the full control group and the matched control group is the reason of the significant result, but it should be considered that other factors such as possible age-related differences could have some influence on the results. It is also interesting to note that the movement direction of the ITRT with left foot in front and rotating to the right, is the movement hockey players use most frequently when taking different kinds of shots. According to Bretigny et al. (2008) short grip and classic drives both start with the left foot next to the ball. Ibrahim et al. (2017) also describe a left foot touchdown as the start of a drag flick.
Players with unilateral impingement did not have significantly different ITRT results in any of the variations when comparing the symptomatic hip to the asymptomatic side. If hip impingement had an influence on the measurements of the ITRT, it could be hypothesized
that players with unilateral impingement showed asymmetries between both sides, but this assumption was not confirmed. On a side note, Clohisy et a. (2009) reported that the ROM of hip flexion and internal rotation in subjects with anterior hip impingement was similar for both the symptomatic and asymptomatic sides. While both movements were restricted compared to normal subjects, they suggested that ROM deficits existed even in the healthy hip. Overall, the results of the present study suggest that impingement-related pain symptoms were not a limiting factor to the ITRT movements.
Previous studies have recognized that subjects with FAI-syndrome develop abnormal movement patterns around the hip and pelvis (Griffin et al. 2016). With this in mind, the absence of more significant differences in the ITRT between players in the present study may be explained by compensations that occur in the subjects with impingement. When one segment of the kinetic chain is limited, elite sportsmen may be able to balance out the negative impact of a loss of ROM with adaptations in other biomechanical parameters (Robb et al. 2010). Bretigny et al. (2011) found that there is a high inter-individual variability in the movement pattern of the field hockey drive at expert level. While the global coordination remains the same, each player develops their own specific movement pattern to achieve their most effective version of a drive. However, a systematic review concerning the baseball pitching motion found that altered biomechanics, for example early trunk rotation, may be linked with injury (Chalmers et al. 2017). Though it is not the exact same motion as a hockey shot, this pitching motion is also a kinetic chain movement that involves high forces and rotation of the lower extremities and trunk.
Another possible reason of the absence of clear significant differences may be that the ITRT is not a sufficiently provocative movement for hip impingement. In practice, a field hockey shot requires a more dynamic movement of the pelvis and hip. For example, during the drag flick, the peak angular velocity of the pelvis is reached before the peak angular velocity of the trunk (López de Subijana et al. 2010). When performing the ITRT, the trunk rotation is initiated from a stationary position with a stable pelvis. Additionally, the standardized position of 90° hip flexion may not be close enough to the end-range of hip mobility, especially if the maximum hip rotation is not fully reached either. Shooting techniques like the drag flick that lead to great shear, compression and tensile forces in lower limb and lumbar joints are performed with greater ankle dorsiflexion, knee and hip flexion in the front leg, and greater lumbar flexion (Ng et al. 2018). Impingement related complaints occur when the functional range of motion requirements are larger than normal motion limits, and the mechanical
stresses at the end range of rotation lead to reactive hip pain (Poultsides et al. 2012). Therefore, if the end-ROM in the hip was not reached during the test, the movement of the ITRT in the current standardized position might not be limited by the presence or absence of hip impingement symptoms.
The ITRT as an individual test may not be sufficient to determine whether a player is at risk for a specific injury like FAI, but it could be seen as a part of the complex system of factors that determine the risk of sports injury (Bittencourt et al. 2016). The relationship and interaction of the measurements with other existing conditions form a web of determinants that could add to the injury risk profile of an athlete (Bittencourt et al. 2016). The functional ROM as measured by the ITRT could be of higher value when other factors are taken into account at the same time. Recent studies with professional soccer players indeed suggested that a single musculoskeletal screening test could not predict the risk of future injury (Bakken et al. 2018; Van Dyk et al. 2018). As stated by Olds et al. (2019) a test battery has more clinical utility in comparison to a single test because it can focus on multiple aspects of return to sport such as strength, power, range of motion and neuromuscular control. This reasoning for return to sport test batteries also matches the reasoning to construct a test battery in prevention of injuries.
Limitations
There were some limitations that need to be acknowledged. First of all, the issue arose that the field hockey players were screened on multiple days. Additionally, almost every day a different inexperienced examiner was in charge of the ITRT. This could have affected the results because each examiner started without experience and had to find their way to make it his own. For this reason, the reliability study in chapter 4 was conducted and those results showed a fair to good interrater reliability. Furthermore, this study focused on the possible relation of the ITRT to FAI-complaints but this does not mean that FAI is the only possible injury which could influence the ITRT results. In further research, other frequently occurring injuries in field hockey could be examined on their predictive value. Another limitation of this study is that the validity of the ITRT as a measurement of functional ROM in hockey players has not yet been established. Future research on the validity of this measurement approach is needed. Lastly, due to the missing values of the FADIR-test on a following screening day in February 2020, a prospective analysis of the ITRT results from September 2019 concerning upcoming FAI-complaints, could not be conducted.
4. I
NLINE
TRUNK
ROTATION
TEST:
RELIABILITY
STUDY4.1 Methods
4.1.1 Subjects
A total of 10 subjects were recruited for the study (three male and seven female). All participants were healthy students aged between 20 and 24 years old (mean age: 21.9y; SD: 0.99). None of them had an injury in the hip- or thoracic area.
The inclusion criteria were that subjects had to be aged between 18 and 28 years old and they had to be free from any major hip or thoracic injuries or pain-provoking disorders which could lead to a deviant test result. They also had to be able to be present during the two test-days (25/11/2019 and 29/11/2019). Participants were recruited through email and word of mouth from acquaintances. To those interested in participating, emails with the exact information were sent five to seven days before the first date of tests.
Assessment of the correlation of the ITRT with the body length, the seated rotation test and the hip inclinometry was not only performed on these ten volunteers but data was also collected from the population of the Belgian national hockey teams. This was the same population as described in the case control study.
4.1.2 Experimental approach to the problem
With the introduction of the ITRT, establishment of the reliability and validity was considered essential in order to be useful in clinical settings. In this study, the intrarater reliability and interrater reliability was examined. Furthermore, the ITRT was compared to the inclinometry values of the passive hip internal- and external rotation. These ROM measurements were taken in positions of both hip flexion and extension to more closely approach the position in which the ITRT is executed. The ITRT was also compared to the seated rotation test which objectifies the thoracic rotation ROM.
This test was developed in order to objectify the functional movement possibilities in field hockey players when they strike the ball with their stick. This movement takes place in a
lunge position combined with a rotation to the left or right side, depending on which strike the player performs.
4.1.3 Examiners
The examiners E1, E2 and E3 are the three authors of the current study, last year students in Rehabilitation Sciences at the University of Ghent. All three examiners performed the measurements of the ITRT independently but not blinded from each other. The hip inclinometry was measured by E1 and E2 was in charge of the seated rotation test.
E1 had clinical experience with the ITRT on about a hundred athletes, E2 only had clinical experience on three athletes and E3 had no clinical experience in advance of the first date of tests. E2 was familiar with the seated rotation test with clinical experience on approximately 50 athletes. All three examiners had clinical experience with inclinometry but not with using the Clinometer app.
4.1.4 Instrumentation
The complete instrumentation of the ITRT is explained in appendix 1. To measure the inclinometry, the Clinometer app on a Huawei P9 Lite smartphone was used to objectify the hip rotation range of motions (fig. 5). The measurements in hip flexion were taken in seated position on a physiotherapy treatment table. Subsequently, the subject was asked to lay down in supine position for the measurements with extended hips. The seated rotation test was performed on a mat with a protractor of 180° (fig. 6). The subjects were asked to sit cross-legged in the middle of the mat with the shoulders parallel to the 0° line and a stick held against the shoulders.
4.1.5 Procedures
General testing procedure
The subjects were asked to attend two testing sessions, separated by four days. These sessions were held on the 25th and the 29th of November 2019 in one of the practice rooms at the Ghent University Hospital. Both the intrarater and interrater reliability were determined. Therefore the subjects were asked to perform the ITRT procedure in two different ways. The first time the instructions were given by E1, while E2 and E3 took the measurements directly after each other and in the same exact position of the subject. This represented a condition of the measurement which remained as similar as possible between the two examiners. This is the first type of interrater reliability examined.
Afterwards, the second type of interrater reliability was examined. Each of the three examiners carried out the whole procedure of the ITRT again, but this time the measurements were taken completely independent from each other. Each examiner also gave their instructions and corrections to the subjects individually. Each movement was measured three times one after another. The order in which the examiners completed the testing procedures was the same for each subject, with E2 being the first to take measurements, followed respectively by E3, and E1. To be able to describe the intrarater reliability, the same procedures were repeated during the second day. On the first testing day, the inclinometry of the passive hip rotations and the seated rotation test were implemented to determine a possible correlation between the values of these tests and the Inline trunk rotation test. These tests were not repeated during the second day.
Inline trunk rotation test procedure
The procedure of the ITRT with both the instructions directed to the subject and to the examiner is explained in appendix 1. Specifically for the reliability study, the neutral and end-range measurements were performed three times for the second type of interrater reliability and only one time for the first type. This is different from the procedure described in appendix 1. This decision was made to try out the test but in reality it was timewise not possible to examine each rotation three times.
Passive hip internal and external rotation inclinometry procedure
Looking for possible correlations between the ITRT and the movements of the involved joints, inclinometry measurements of the internal and external rotations of the hip were taken. The ROM was measured both in flexed and extended position of the hip because of the similar position during the ITRT. The hip of the leg in front is positioned in a flexed position of 90° but the other hip is extended (0°).
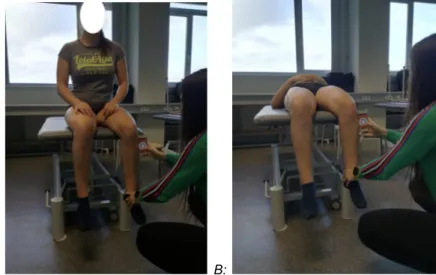
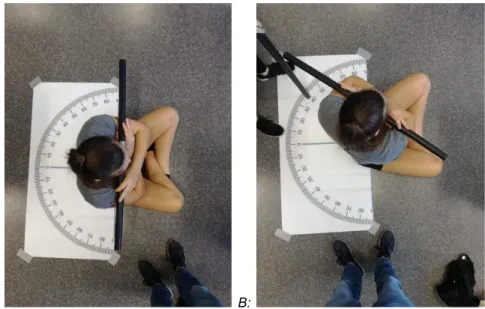
The subject was asked to sit on a physiotherapy treatment table with both lower legs hanging down (fig. 7, A). The examiner placed the inclinometer on the head of the fibula and passively moved the leg towards maximum internal (fig. 8, A) and external (fig. 8, B) rotation. After that, the subject was asked to lay down in supine, still with both lower legs hanging down (fig. 7, B). The examiner again placed the inclinometer on the head of the fibula and passively brought the leg in maximal internal (fig. 9, A) and external (fig. 9, B) rotation.
Each measurement was taken once, always by examiner E1 to provide consistent measurements. The measurements were always taken with the same smartphone and the same application. The measurements were performed passively because in the ITRT, the subjects do not actively rotate their hips within the entire ROM.
A: B:
A: B:
Fig. 8: Rotations in flexed hip position. A: internal rotation, B: external rotation.
A: B:
Fig. 9: Rotations in extended hip position. A: internal rotation, B: external rotation.
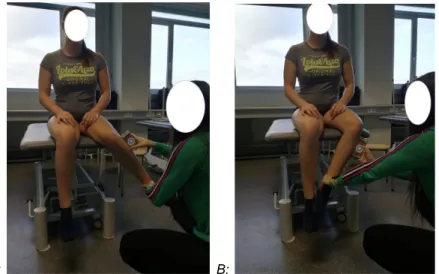
Seated rotation test procedure
The starting position of the seated rotation test was a cross-legged sitting position with the shoulders in line with the zero-line of a protractor-mat on the floor. The subject was instructed to hold a stick horizontally with the arms crossed over the trunk and the stick touching both shoulders (fig. 10, A). The patient was positioned in this way to minimize lumbar compensations. The subject was then asked to maximally rotate to the right and left side (fig. 10, B) with the stick still held against both shoulders and without leaning backwards. The examiner positioned a second stick vertically, tangent to the stick held by the subject, to read the number of degrees on the mat. All measurements of the seated rotation test were completed by examiner E2 to provide consistent measurements. The
measurements were performed three times on both sides and the mean value was used for the statistical analysis.
A: B:
Fig. 10: Seated rotation test. A: neutral starting position, B: left rotation.
Procedures in the hockey teams
The seated rotation test and the hip inclinometry were used to try and find a correlation with the ITRT. All included hockey players in the case control study also underwent these tests on their screening days. The results of the ITRT, seated rotation test and hip inclinometry of these players were used to find a correlation between them in a bigger population. Additionally, a comparison was made between the body length of the hockey players and their ITRT results.
4.1.6 Statistical procedures
Data processing was performed using the SPSS Statistics software, version 26. Demographic data was summarized using descriptive statistics.
The reliability of all measurements was assessed with the intraclass correlation coefficient (ICC) and their 95% confidence intervals (CI). To determine the intrarater reliability, the ICC was calculated based on a single measurement, absolute agreement, two-way mixed effects model. For the interrater reliability, the ICC was computed by a single measurement, absolute agreement, two-way random effects model. A p-value less than 0.05 was considered significant. Based on the 95% confidence interval of the intraclass correlation coefficient, values less than 0.5 indicated poor reliability, between 0.5 and 0.75 moderate,
between 0.75 and 0.9 good and values greater than 0.9 indicated an excellent reliability (Koo & Li 2016).
Correlations between the ITRT and the inclinometry of the hip were assessed using the Pearson’s correlation coefficients. The same test was used to assess the correlations between the ITRT and the seated rotation test and between the ITRT and body length. These three types of correlations were examined for both the 10 subjects of the reliability study and the field hockey players. The Pearson’s correlation coefficient can vary between -1 and +1. A coefficient value of 0 indicates that there is no linear correlation. A value less than 0 indicates a positive correlation and a value greater than 0 indicates a negative one. Values of the correlation coefficient were classified according to Chan (2003). Values less than 0.3 indicate a poor correlation, values between 0.3 and 0.5 give a fair correlation, values between 0.6 and 0.8 a moderately strong correlation and values greater than 0.8 a very strong correlation.
4.2 Results
4.2.1 Demographic and descriptive data
The main demographic data is summarized in table 7.
Table 7: Demographic data - Reliability study
Gender Male N 3
Female N 7
Mean age (y) 21.90±0.994
Mean body length (cm) 172.30±9.381
Dominance lower limb Right N 6
Left N 4
Concerning the ITRT, the mean measurements and standard deviations were calculated for each movement direction, together with the minimum and maximum scores for each variable (table 8). The same calculations were made for the measurements of the seated rotation test, and the ROM of hip internal and external rotation in both a seated (hip flexion) and supine lying position (hip extension).
Table 8: Descriptive statistics - Reliability study
Side N Mean
Standard
Deviation Minimum Maximum
ITRT* RR 10 17.07 4.713 6 29 RL 10 18.53 5.787 7 36 LR 10 18.26 4.479 7 34 LL 10 16.21 4.429 5 29 Seated Rotation** R 10 60.13 5.645 52.33 70.00 L 10 56.13 10.098 39.33 69.66
Hip Internal rotation FL**
R 10 36.70 7.945 25 54
L 10 38.00 7.257 28 50
Hip External rotation FL**
R 10 37.70 10.318 21 50
L 10 38.40 10.200 20 53
Hip Internal rotation EXT**
R 10 34.40 6.769 24 42
L 10 37.20 6.529 30 48
Hip External rotation EXT**
R 10 37.30 9.546 23 49
L 10 36.00 12.806 14 50
RR: right foot in front with right rotation; RL: right foot in front with left rotation; LR: left foot in front with right rotation; LL: left foot in front with left rotation; R: right; L: left; FL: position of hip flexion; EXT: position of hip extension; * expressed in cm; ** expressed in degrees (°)
The boxplot, as shown below in fig. 11, represents the variation in the results of the ITRT within each movement direction and shows the outliers as dots.
Fig. 11: Boxplot of the ITRT
4.2.2 Reliability
Concerning the intrarater reliability, all measurements were significant (p<0.001). The 10 participants completed the procedure. Examiner E2 had one poor but mostly moderate results, examiners E1 and E3 both had moderate results in all movement directions (table 9).
Table 9: Intraclass Correlation Coefficient of the Intrarater Reliability
ICC
95% CI
Lower B. Upper B. Sign. Value Estimation E1 RR 0.654 0.411 0.874 p<0.001 Moderate RL 0.669 0.429 0.882 p<0.001 Moderate LR 0.626 0.344 0.874 p<0.001 Moderate LL 0.598 0.330 0.861 p<0.001 Moderate E2 RR 0.582 0.323 0.841 p<0.001 Moderate RL 0.664 0.424 0.879 p<0.001 Moderate LR 0.679 0.442 0.886 p<0.001 Moderate LL 0.480 0.222 0.784 p<0.001 Poor E3 RR 0.584 0.326 0.842 p<0.001 Moderate RL 0.739 0.521 0.911 p<0.001 Moderate LR 0.669 0.429 0.881 p<0.001 Moderate LL 0.664 0.423 0.879 p<0.001 Moderate
ICC: Intraclass Correlation Coefficient; CI: Confidence Interval; Sign: significant; Lower B.: lower bound; Upper B upper bound; RR: right foot in front with right rotation; RL: right foot in front with left rotation; LR: left foot in front with right rotation; LL: left foot in front with left rotation
The interrater reliability was examined using two different procedures. The ICC with 95% confidence intervals for both procedures is represented in table 10 and table 11, together with the respective level of significance and value estimation. The procedures are explained in section 4.1.5. Ten participants completed the first procedure, one however was excluded on the first day due to incorrect data notation for the movement directions LR and LL. On the first day no significant interrater reliability of the left foot in front with homolateral rotation (LL) was found (p = 0.142). However, there was a moderate interrater reliability with the right foot in front with both right and left rotation, and a good reliability with the left foot in front with heterolateral rotation (LR). On the second day all the movement directions lead to significant results. ITRT with the right foot in front with both right and left rotation, and left foot in front with left rotation all showed a good reliability. A moderate reliability was found with the left foot in front with heterolateral rotation (LR) (table 10).
During the second procedure the three examiners carried out the ITRT completely independently. All 10 volunteers completed the procedure, one participant however was excluded on the first day due to wrong data notation for the movement directions LR and LL. To determine the ICC of the interrater reliability, all data of the three examiners were compared. On the first day, the results of the ITRT with the right foot in front with right and left rotation, and left foot in front with right rotation were moderate. However, the results of the ITRT with left foot with left-sided rotation lead to a good reliability. On the second day all the results had a moderate reliability (table 11).
Table 10: Intraclass Correlation Coefficient of the Interrater Reliability Procedure 1
ICC
95% CI
Lower B. Upper B. Sign. Value Estimation Day 1 RR 0.702 0.158 0.917 0.010 Moderate RL 0.707 0.193 0.918 0.009 Moderate LR 0.844 0.442 0.963 0.002 Good LL 0.401 -0.385 0.830 0.142 - Day 2 RR 0.769 0.095 0.944 p<0.001 Good RL 0.795 0.378 0.945 0.002 Good LR 0.740 0.267 0.928 0.005 Moderate LL 0.752 0.306 0.913 0.004 Good
ICC: Intraclass Correlation Coefficient; CI: Confidence Interval; Sign: significant; Lower B.: lower bound; Upper B.: upper bound; RR: right foot in front with right rotation; RL: right foot in front with left rotation; LR: left foot in front with right rotation; LL: left foot in front with left rotation
Table 11: Intraclass Correlation Coefficient of the Interrater Reliability Procedure 2; E1, E2 and E3 together
ICC
95% CI
Lower B. Upper B. Sign. Value Estimation Day 1 RR 0.568 0.340 0.827 p<0.001 Moderate RL 0.679 0.462 0.883 p<0.001 Moderate LR 0.742 0.532 0.918 p<0.001 Moderate LL 0.759 0.557 0.924 p<0.001 Good Day 2 RR 0.648 0.428 0.868 p<0.001 Moderate RL 0.582 0.355 0.833 p<0.001 Moderate LR 0.614 0.390 0.851 p<0.001 Moderate LL 0.642 0.420 0.865 p<0.001 Moderate
ICC: Intraclass Correlation Coefficient; CI: Confidence Interval; Sign: significant; Lower B.: lower bound; Upper B.: upper bound; RR: right foot in front with right rotation; RL: right foot in front with left rotation; LR: left foot in front with right rotation; LL: left foot in front with left rotation
4.2.3 Correlation between ITRT, seated rotation, inclinometry and body length
- ten volunteers
A moderately strong significant correlation was found between the seated rotation to the left, and the ITRT with the right foot in front with left rotation (r = 0.739, p = 0.015) . A very strong significant correlation was found between the seated rotation to the left and the ITRT with the left foot in front with right rotation (r = 0.847, p = 0.002) (table 12). No significant results were found for the correlation between the ITRT and the inclinometry (table 13).
Table 12: Pearson’s Correlation between Seated rotation and Inline Trunk Rotation
Side Mean RR Mean RL Mean LR Mean LL
Seated rotation L Pearson Correlation 0.583 0.739 0.847 0.480 Sig. (2-tailed) 0.077 0.015 0.002 0.160 R Pearson Correlation 0.263 0.057 -0.035 -0.161 Sig. (2-tailed) 0.462 0.876 0.924 0.657 RR: right foot in front with right rotation; RL: right foot in front with left rotation; LR: left foot in front with right rotation; LL: left foot in front with left rotation; R: right; L: left; Sig.: significant
Table 13: Pearson’s Correlation between Range of Motion and Inline Trunk Rotation
Mean RR
Hip internal rotation FL Right Pearson Correlation 0.102
Sig. (2-tailed) 0.779
Hip external rotation EXT Left Pearson Correlation 0.011
Sig. (2-tailed) 0.976
Mean RL
Hip external rotation FL Right Pearson Correlation 0.000
Sig. (2-tailed) 1.000
Hip internal rotation EXT Left Pearson Correlation 0.142
Sig. (2-tailed) 0.696
Mean LR
Hip external rotation FL Left Pearson Correlation 0.188
Sig. (2-tailed) 0.604
Hip internal rotation EXT Right Pearson Correlation -0.078
Sig. (2-tailed) 0.829
Mean LL
Hip internal rotation FL Left Pearson Correlation -0.369
Sig. (2-tailed) 0.293
Hip external rotation EXT Right Pearson Correlation -0.171
Sig. (2-tailed) 0.636
RR: right foot in front with right rotation; RL: right foot in front with left rotation; LR: left foot in front with right rotation; LL: left foot in front with left rotation; FL: position of hip flexion; EXT: position of hip extension; Sig.: significant
There was a moderately strong correlation between the body length and the ITRT with the left foot in front and rotation to the right (r = 0.730, p = 0.017) (table 14).
Table 14: Pearson’s Correlation between body length and Inline Trunk Rotation
Mean RR Mean RL Mean LR Mean LL Body Length (cm) Pearson Correlation Sig. (2-tailed) 0.007 0.381 0.730 0.319 0.984 0.278 0.017 0.369
RR: right foot in front with right rotation; RL: right foot in front with left rotation; LR: left foot in front with right rotation; LL: left foot in front with left rotation; R: right; L: left; Sig.: significant
4.2.4 Correlation between ITRT, seated rotation, inclinometry and body length
- Hockey teams
These descriptives were also executed on the hockey players population for the measurements of the seated rotation and the ROM of hip internal and external rotation in both a seated (hip flexion) and supine lying position (hip extension) (table 15).