ANTIBIOTIC DISPOSITION IN
CRITICALLY ILL CHILDREN WITH
CANCER AND HEMATOLOGICAL
DISEASES
Liselot De Cloedt
Student number: 01404838
Hendrik Vercruysse
Student number: 01510350
Supervisors: Prof. Dr. Peter De Paepe, Apr. Dr. Pieter De Cock, Dr. Bram De Wilde, Dr.
Evelyn Dhont
A dissertation submitted to Ghent University in partial fulfilment of the requirements for
the degree of Master of Medicine in Medicine
ANTIBIOTIC DISPOSITION IN
CRITICALLY ILL CHILDREN WITH
CANCER AND HEMATOLOGICAL
DISEASES
Hendrik Vercruysse
Student number: 01510350
Liselot De Cloedt
Student number: 01404838
Supervisor(s): Prof. Dr. Peter De Paepe, Apr. Dr. Pieter De Cock, Dr. Bram De Wilde, Dr.
Evelyn Dhont
A dissertation submitted to Ghent University in partial fulfilment of the requirements for
the degree of Master of Medicine in Medicine
Deze pagina is niet beschikbaar omdat ze persoonsgegevens bevat.
Universiteitsbibliotheek Gent, 2021.
This page is not available because it contains personal information.
Ghent University, Library, 2021.
VOORWOORD
In het kader van onze opleiding geneeskunde kozen wij bewust voor een experimenteel onderwerp voor deze masterproef. Het leek ons bijzonder leerrijk om het volledige proces van een klinische studie van dichtbij te kunnen bijwonen en te kunnen bijdragen aan de voltooiing ervan. Wij hebben veel geleerd over farmacologie, maar ook over wat een klinische studie precies inhoudt en wat de hindernissen zijn waarop je kan botsen. Om deze hindernissen te overwinnen, konden wij rekenen op onze promotoren en begeleiders. Bedankt dr. Pieter De Cock, dr. Evelyn Dhont, dr. Bram De Wilde en professor Peter De Paepe voor jullie begeleiding, ondersteuning, vele tips, en antwoorden op onze eindeloze lijst vragen. De kennis en vaardigheden die jullie ons bijbrachten kwamen ons niet alleen nu van pas, maar zullen ongetwijfeld ook in onze latere carrière dienen. Ook bedankt aan het gehele team van de diensten pediatrische hemato-oncologie en de PICU van het UZ Gent, voor het includeren van de patiënten en de afname van de stalen. Vervolgens willen wij ook zeker Anca, de studieverpleegkundige, bedanken voor de vele tijd en energie die ze stak in het tot stand komen van onze datasets. Ten slotte nog een laatste dankwoord naar de vrienden en familie die de tijd hebben willen
Table of contents
Abstract ... 1Samenvatting ... 3
1.
Introduction ... 5
1.1.
Pharmacokinetics ... 5
1.1.1.
Absorption ... 5
1.1.2.
Distribution ... 6
1.1.3.
Metabolism ... 6
1.1.4.
Excretion ... 6
1.1.5.
Clearance, extraction ratio, half-life and steady-state concentration ... 7
1.2.
Impact of growth and development on ADME processes ... 8
1.2.1.
Impact of growth and development on absorption ... 8
1.2.2.
Impact of growth and development on distribution ... 8
1.2.3.
Impact of growth and development on metabolism ... 9
1.2.4.
Impact of growth and development on excretion ... 9
1.3.
Impact of cancer on ADME processes ... 11
1.3.1.
Impact of cancer on absorption ... 11
1.3.2.
Impact of cancer on distribution ... 11
1.3.3.
Impact of cancer on metabolism ... 11
1.3.4.
Impact of cancer on excretion ... 12
1.3.5.
Hematological diseases ... 14
1.4.
Pharmacokinetics and pharmacodynamics of antibiotics ... 15
1.4.1.
Pharmacodynamics of antibiotics ... 15
1.4.2.
Amikacin ... 16
1.4.3.
Vancomycin ... 18
2.
Objectives ... 22
2.1.
Research question ... 22
2.2.
Objectives ... 22
3.
Material and methods ... 23
3.1.
Study design ... 23
3.2.
Patient selection ... 23
3.3.
Data collection and processing ... 23
3.4.
Drug dosing and administration ... 24
3.5.
Blood sampling ... 25
3.7.
Statistical analysis ... 27
3.7.1.
Patient characteristics ... 27
3.7.2.
PK/PD Target ... 27
3.7.3.
Pharmacokinetic parameters ... 28
3.7.4.
Correlation eGFR and antibiotic clearance ... 28
4.
Results ... 30
4.1.
Amikacin ... 30
4.1.1.
Demographic data and clinical parameters ... 30
4.1.2.
Sampling characteristics ... 31
4.1.3.
Target attainment ... 32
4.1.4.
Pharmacokinetic parameters ... 32
4.1.5.
Correlation between clearance of amikacin and eGFR ... 33
4.2.
Vancomycin ... 35
4.2.1.
Demographic data and clinical parameters ... 35
4.2.2.
Sampling characteristics ... 36
4.2.3.
Target attainments ... 37
4.2.4.
Pharmacokinetic parameters ... 39
4.2.5.
Correlation between clearance of vancomycin and eGFR ... 40
5.
Discussion ... 41
5.1.
Amikacin ... 41
5.1.1.
Target attainment ... 41
5.1.2.
Comparison of pharmacokinetic parameters ... 41
5.1.3.
Role of amikacin clearance in clinical practice ... 42
5.2.
Vancomycin ... 43
5.2.1.
Target attainment ... 43
5.2.2.
Comparison of pharmacokinetic parameters ... 43
5.2.3.
Role of vancomycin clearance in clinical practice ... 44
5.3.
Limitations and future research ... 44
5.4.
Conclusions ... 46
1
Abstract
INTRODUCTION AND OBJECTIVES Growth, development and cancer may influence
pharmacokinetic (PK) and pharmacodynamic (PD) processes and currently, no specific antimicrobial drug dosing regimens are determined for children with cancer. In this thesis, framed in the ADIC-study at the University Hospital of Ghent, target attainment with current dosing regimens of amikacin and vancomycin was examined as a pilot study with the aim of determining an adequate dosing strategy. In addition, the correlation between both targets used to express vancomycin targets was observed. The pharmacokinetic-parameters of critically ill children with hemato-oncological diseases were compared with pharmacokinetic parameters in other populations. Furthermore, estimated glomerular filtration rate (eGFR) was estimated by standardized formulas, based on creatinine and cystatin C and was compared with antibiotic clearance.
MATERIAL AND METHODS Children of the University Hospital in Ghent, aged between 1 month
and 15 years, treated with amikacin (n=10) or vancomycin (n=9), following standard of care, and meeting both the criteria of the ADIC-study for in- and exclusion, were included. Plasma concentrations of amikacin were measured with liquid chromatography, plasma vancomycin concentrations with immunoassay. Pharmacokinetic parameters were calculated with PK Solver (MS Excel) and median, Q1 and Q3 were analyzed by IBM, SPSS. Targets were set for amikacin as peak concentration (Cmax) = 54-64mg/L. For vancomycin, the preferred targets were the area under the concentration-time curve (AUC24h) above minimal inhibitory concentration (MIC) = 400-650 and trough concentration (Ctrough) = 10-15mg/L.
RESULTS Amikacin. 60% of the patients treated with amikacin achieved the target Cmax> 54 mg/L. Pharmacokinetic parameters showed expected differences, compared to other populations. A higher volume of distribution (Vd), a higher clearance (Cl), and a similar half-life (T1/2) were observed, compared with healthy children. Amikacin clearance did not significantly correlate with eGFR. Vancomycin. 43% of the patients treated with vancomycin did achieve the target of AUC24h/MIC>400. No single patient achieved trough concentrations between 10 and 15 mg/mL. 14% had supratherapeutic trough concentrations above 15 mg/L and 86% did not reach a trough concentration of >10mg/L. PK parameters showed expected differences compared to other studies with children. In comparison with healthy children, a similar Vd, higher vancomycin clearance and lower T1/2 were found. Vancomycin clearance is not significantly correlated with eGFR.
2
CONCLUSION Current dosing regimens are inadequate to achieve concentration targets in
children with cancer or a hematological disease. Both supratherapeutic and subtherapeutic concentrations were observed, with a high inter-individual variability. More individualized dosing regimens should be developed, considering altered pharmacokinetics of antimicrobials in these patients. Development of a more accurate way to estimate kidney function in this population is desired.
3
Samenvatting
Dat kinderen niet zomaar als kleine volwassenen kunnen behandeld worden, is ondertussen al verschillende malen bewezen. Echter blijft het farmacologisch onderzoek op kinderen beperkt, zeker in subpopulaties zoals kinderen met kanker of hematologische aandoeningen. In deze studie, kaderend binnen de ADIC studie van het UZ Gent, wordt het bereiken van doelconcentraties onderzocht voor amikacine en vancomycine, toegediend volgens de huidige doseerschema’s. Dit is een pilootstudie met als doel om uiteindelijk adequate doseerschema’s te bekomen. Bovendien worden farmacokinetische parameters zoals klaring, distributievolume en halfwaardetijd van amikacine en vancomycine in deze patiëntenpopulatie vergeleken met andere populaties en wordt gekeken in welke mate de antibioticaklaring een maat kan zijn voor de nierfunctie. Dit door de antibioticaklaring te vergelijken met de geschatte glomerulaire filtratie snelheid (eGFR), berekend volgens gestandaardiseerde formules, gebruik makend van creatinine en cystacine C.
Kinderen van de pediatrische hemato-oncologische afdeling en de pediatrische intensieve afdeling op het UZ Gent tussen 1 maand en 15 jaar, die volgens de standaard behandelingsprocedure amikacine of vancomycine toegediend kregen, werden geïncludeerd rekening houdende met de inclusie- en exclusiecriteria van de ADIC-studie lopende in het kinderziekenhuis van het UZ Gent. Concentraties van de antibiotica worden gemeten door respectievelijk een gevalideerde vloeistofchromatografie-massaspectrofotometrie methode en immunoassay. Farmacokinetische parameters werden berekend door PK Solver (een add-in programma in Excel) en mediaan, Q1 en Q3 werden geanalyseerd met SPSS. Verschillende doelconcenratie intervallen per antibioticum worden vooropgesteld. Voor amikacine (n=10) : Cmax=54-64mg/l, voor vancomycine (n=9): AUC24h/MIC=400-650 en Cdal=10-15 mg/l.
60% van de met amikacine behandelde patiënten behaalde de minimale doelconcentratie van 54 mg/L. PK-parameters verschilden met de gezonde populaties zoals verwacht binnen het theoretisch kader. In vergelijking met gezonde kinderen, werden hogere distributievolumes, hogere klaringen en gelijkaardige halfwaardetijd gevonden. Er werd geen duidelijke relatie gevonden tussen amikacineklaring en de eGFR. Hieruit kan vermoed worden dat de eGFR geen goede indicator is voor de nierfunctie in deze populatie of voor dosisaanpassing van amikacine. Van de met vancomycine behandelde patiënten, haalde 43% de doelconcentratie AUC24h/MIC>400, geen enkele patiënt haalde de standaard target dalconcentratie binnen een interval van 10-15mg/l. 86% haalde geen dalconcentraties >10mg/l en bij 14% was er sprake van een supratherapeutische dalspiegel. Farmacokinetische parameters toonden verwachte of verklaarbare verschillen met andere pediatrische populaties. In vergelijking met gezonde kinderen werden lagere
4 distributievolumes en hogere klaringen en halfwaardetijden geobserveerd. Ook tussen vancomycineklaring en eGFR werd geen significante relatie gevonden in deze studiepopulatie. De huidige doseringsschema’s zijn niet adequaat voor deze subpopulatie. Zowel over- als onderdosering werd gezien met een hoge interindividuele variabiliteit. Verder onderzoek is nodig om meer geïndividualiseerde behandelingen te kunnen vooropstellen, naargelang predispositie voor veranderde farmacokinetische parameters voor antibiotica in deze populatie. Bovendien zijn meer accurate methodes vereist om de nierfunctie van deze subpopulatie te kunnen inschatten.
5
1. Introduction
Worldwide, millions of children suffer from cancer and hematological diseases. These children have an increased risk of contracting infections, due to prolonged hospital stays, decreased immune response due to drugs and invasive devices. Moreover, mortality due to infection is the highest in this subpopulation (1). Therefore, they need specialized care, for example in the field of antibiotics policy. Adequate dosing of antibiotics is best known in adult populations, and guidelines for antibiotic dosing in other populations are often an extrapolation of these researches. But an adult with cancer shows major differences compared with a child with cancer. On the one hand, since in children the pharmacokinetics and pharmacodynamics of drugs are influenced by growth and development. On the other hand, pathophysiological effects of cancer, hematological disease and therapy also have a significant impact on drug handling. Optimal dosing of antibiotics is a major determinant of the effectivity of the therapy and suboptimal dosing can lead to antibiotic resistance and therapy failure, where supra-optimal dosing can compromise safety. That is why more pharmacokinetic and pharmacodynamic research in this population is needed. In this study, amikacin and vancomycin are observed.
1.1. Pharmacokinetics
Pharmacokinetics (PK) describes the drug concentration over time (‘what the body does to the drug’) and is determined by four processes: absorption, distribution, metabolism and excretion (ADME).
1.1.1. Absorption
Absorption is the process whereby the active drug gets transported to the systemic circulation from its site of administration. This process is determined by two important parameters: bioavailability (F) and the route of administration. Bioavailability is the fraction of the given drug that enters the general circulation. The route of administration is the way the drug is given e.g. intravenously. When medicines are administered intravenously, bioavailability is per definition 100%. Two factors determine the rate and magnitude of absorption. On the one hand, the drug related factors, such as lipophilicity, ionization state, particle size and solubility. On the other hand, patient specific factors, such as gastric emptying, gastrointestinal pH and splanchnic blood flow (2).
6 1.1.2. Distribution
Distribution to the target tissues occurs when the drug has reached the systemic circulation. The fluency of this process is determined by physiochemical characteristics of the drug, blood flow, tissue perfusion, membrane transporters and plasma and tissue protein binding (2). This protein binding is determined by the acid dissociation constant (pKa) of a drug. The bigger the pKa of a drug is, the less it dissociates and the less acidic it is. Acidic medicines will mainly bind albumin, while more basic medicines will bind albumin and a1-glycolic acid glycoprotein (AAG). An important parameter is the volume of distribution (Vd), this is the theoretical volume to resolve a certain dose of drug with a concentration equal to the plasma concentration. When Vd is large, the largest fraction of the administered dose will be extravascular. A lipophilic medicine, that has low protein binding, will have a large Vd (3).
1.1.3. Metabolism
The process of metabolism or biotransformation is the enzymatic conversion of a drug to a metabolite. Those metabolites can be either biologically inactive or they can be more potent (4). The metabolism of drugs takes place in different organs. The major metabolizing organs are the liver, the intestines and the kidney. The liver is assumed to be the most important site of drug metabolism. Metabolism in the liver depends on various factors such as blood flow, hepatic enzyme activities, transport systems and plasma protein binding (2). Hepatic metabolism can be divided into two phases, phase I gives modification reactions (hydrolysis, oxidation and reduction) and phase II gives conjugation reactions. Cytochrome P450 enzymes are the most important group of enzymes involved in drug metabolism. The activity of drug-metabolizing enzymes is age-dependent and can be affected by disease states (4).
1.1.4. Excretion
Excretion is the process in which drugs and their metabolites are removed from the body. Drug elimination is mainly performed by the kidneys, but it can also go through hepato-biliary route or lungs (5).Vancomycin and amikacin are generally eliminated by the kidneys. Renal elimination is determined by glomerular filtration, active tubular secretion, tubular reabsorption and renal metabolism. Compounds mainly eliminated by renal excretion are water-soluble and have a low molecular weight (MW). Only small (MW<500) and unbound compounds in blood circulation
7 undergo glomerular filtration. Tubular secretion is an active carrier-mediated transport process, which occurs in the proximal tubules that are formed by epithelial cells. Anions and cations are actively secreted by the proximal tubules transporters and can eliminate anionic drugs. Tubular reabsorption occurs in the distal tubules and is a passive process depending on the physicochemical characteristics of the metabolites. Renal metabolism is a minor elimination pathway but can play an important role in the clearance of several drugs. Altered renal function will affect renal drug clearance (6, 7)
The equation of renal clearance:
ClR = (fu,p x GFR + ClR,sec) x (1- FR)+ ClR,m
Where ClR is renal clearance, fu,p is the free fraction of unbound compounds in plasma, GFR is the glomerular filtration rate, ClR sec represents the tubular secretion clearance, FR represents the filtered and secreted fraction of the compound that is reabsorbed and ClR,m is the metabolic clearance.
1.1.5. Clearance, extraction ratio, half-life and steady-state concentration
Clearance (Cl) is the volume of plasma that is completely cleared of a substance by an excreting organ in a certain time e.g. in milliliter/minute (mL/min). Total clearance is determined by all different clearances of excretory organs (8). The fraction of drug that gets eliminated by an organ depends on both the blood flow of that specific organ and the extraction ratio. Extraction ratio is determined by parameters such as protein binding.
Drugs are divided into categories according to their extraction ratio (E). Drugs with an extraction ratio of E>0.7 are considered as highly extracted drugs, these have a low protein binding. Drugs with an E 0.3-0.7 and E<0.3 are considered as intermediate extraction drugs and low extraction drugs respectively (9). Since the total clearance of an individual and the distribution of drugs are difficult to measure in individual patients, a more practical parameter is used, namely plasma half-life (T1/2). This is the time needed to reduce the plasma concentration of a drug to half (7, 10). Finally, steady-state concentration is the concentration by which the amount of drug administered is equal to the amount of drug eliminated in a dose interval. This concentration is reached after four to five times the plasma half-life in drugs with first-order kinetic elimination (3). First-order kinetics proportionally increaseelimination as the plasma concentration increases, following an exponential elimination phase as the system never achieves saturation (10).
8
1.2. Impact of growth and development on ADME processes
Since human growth is not linear, extrapolation of adult drug doses by weight or by body surface to the pediatric population holds a risk for either drug toxicity and sub-therapeutic drug exposure (2). Growth, development and maturation have a significant impact on the pharmacokinetics and the pharmacodynamics of drugs (5). The kidneys and the liver for example, show an important evolution in maturation and consequently also in the functioning of these organs. Therefore, to achieve adequate drug exposure in children, maturational and developmental changes have to be taken into account. An overview of differences in pharmacokinetics and pharmacodynamics is exposed in figure 1.
1.2.1. Impact of growth and development on absorption
Maturational changes of surfaces involved in the process of absorption (e.g. the gastrointestinal tract, skin, and pulmonary tree) will affect their absorptive capacity. As these surfaces mature, the bioavailability of drugs might change. The most important difference in relation to absorption is the varied gastric emptying time and intestinal motility (2). Gastric emptying develops within the first 6-8 months of life to a mature level. Delayed gastric emptying might cause delayed peak concentrations. This can be important in the dosing of some drugs (11). Other factors that influence absorption are: number of intestinal villi (which contributes to a bigger absorption surface area), the evolution of splanchnic blood flow, intestinal secretion and activity of metabolizing enzymes that demonstrate age dependence, whereas the intestinal activity of cytochrome P-450 1A1 appears to increase with age (2).
1.2.2. Impact of growth and development on distribution
Due to the relatively larger extracellular and total-body water spaces and due to the higher ratio of water to lipid in adipose stores, neonates and young infants show a different distribution of drugs compared to adults, which result in lower plasma levels of drugs in these compartments, when administered in a weight-based dose.
Other factors associated with development, such as variability in regional blood flow, organ perfusion, permeability of cell membranes, changes in acid–base balance and cardiac output can also influence drug binding and distribution (2).
9 Young children have a lower concentration of drug binding plasma proteins, resulting in a higher unbound fraction for drugs with an important plasma protein-binding.
For water-soluble drugs, such as amikacin and vancomycin, the volume of distribution is generally higher and the peak concentration is lower. The volume of distribution is further increased by a higher capillary permeability, hydrostatic pressure and a decreased oncotic pressure. Consequently, medicines are mainly in the extravascular part of the body of children.
For lipophilic drugs that are primarily distributed in tissue, the influence of age and development is less apparent (2).
1.2.3. Impact of growth and development on metabolism
The metabolizing capacity of the different organs where metabolism can take place, changes during childhood. This is due to alterations in organ blood flow, the amount of drug receptors and the activity of drug metabolizing enzymes. Both phase I enzymes as well as phase II enzymes are immature at birth (4).
Grey baby syndrome is an example of a lack of liver enzymes in neonates. The UDP-glucoronyl transferase enzyme system is deficient in neonates and in combination with an insufficient kidney, antibiotic (chloramphenicol) toxicity occurs (12).
1.2.4. Impact of growth and development on excretion
The three processes of renal elimination (glomerular filtration, tubular excretion and tubular reabsorption) develop at an independent rate (5). Renal clearance is a fluctuating, dynamic process in the body of infants and young children due to both the morphological development of the kidneys and the maturation of renal function during childhood. At birth, glomerular filtration rate (GFR) is low and tubular secretion limited. GFR increases gradually in the first weeks, to reach adult GFR values around the age of 2. In contrast to glomerular filtration, tubular excretion and tubular reabsorption appear to mature at much slower rates. These immature renal clearance processes have an impact on the elimination of drugs and cause prolongation of their half-lives in the first years of life (4, 13) .
10
Figure 1. The impact of developmental changes on drug pharmacokinetics and pharmacodynamics
11
1.3. Impact of cancer on ADME processes
1.3.1. Impact of cancer on absorption
Cancer patients may have altered organ perfusion, intestinal atrophy and gastro-intestinal motility dysfunction. Opioids as well as some chemotherapeutics, slow down the gastro-intestinal tract and provoke obstipation and motility dysfunction. Mucositis frequently occurs because of the effects of chemotherapy. Furthermore, food intake in heavily ill cancer patients is decreased. Since gastrointestinal proliferation is stimulated by enteral feeding, microvilli will decrease in number and height in oncological patients. Moreover, patients with severe illness often receive sedatives and/or analgesics. These types of drugs delay gastric emptying and intestinal motility and slow down drug absorption. Intravenous administration is the most reliable route of drug administration in critically ill patients because of their bioavailability of 100% (14).
1.3.2. Impact of cancer on distribution
Fluid overload, edema, pleural effusion and ascites are frequent conditions in the population of hemato-oncologic patients. They are a result of inflammation, capillary leak, fluid resuscitation and acute kidney injury due to nephrotoxic chemotherapy and antibiotics. Fluid accumulates in extravascular and extracellular places. This ‘shifted fluid’, of which the quantity is difficult to determine, results in the fact that the volume of distribution is higher than expected (14). The Vd seems to be less increased than the Vd of critically ill children with no malignancy (such as burned patients, trauma patients, infections or other pathologies) (15). However, a study of Bury et al. showed that the volume of distribution remained unaffected in neutropenic adults treated with vancomycin. The plasma protein binding of cancer patients is highly variable, since hypoalbuminemia is common in these patients. Fewer drugs can bind on albumin and AAG and the unbound fraction of drugs increases, which can now circulate freely to the different fluid regions. Hence, the volume of distribution increases even more and this has a significant impact on plasma levels of concentration-dependent antibiotics (16).
1.3.3. Impact of cancer on metabolism
In early sepsis, e.g. during neutropenic fever episodes, hyperdynamic situations occur and the cardiac output increases. Most of the blood flows through the most vital organs (including the liver), which results in an increase of the metabolism, especially for the high hepatic-excretion ratio drugs (the drugs with a high unbound fraction E>0.7). On the one hand, when patients have a septic
12 shock, which is common in patients with cancer, hepatic blood flow (HBF) decreases and consequently the liver metabolism decreases too.
On the other hand, the cancer patient with sepsis has an augmented level of stress hormones and acute phase proteins as a response to sepsis. The pro-inflammatory cytokines level rises because of the enlarged acute phase response. The cytokines inhibit the cytochrome P450 complex in the liver (phase I reactions), whereas the effect on phase II reactions is smaller. The response of inflammatory mediators as a consequence of sepsis affects mainly the low extraction drugs (14). Chemotherapy itself can also affect metabolism. Doxorubicin and vinblastine, for instance, cytostatic drugs are both substrate and inducer of P-glycoprotein (P-gp). P-gp is a carrier protein that carries drugs to places that expose them to metabolic mechanisms such as the cytochrome P450 (CYP) system in the liver (17).
1.3.4. Impact of cancer on excretion
The renal function in hemato-oncological patients is constantly fluctuating as a result of underlying disease processes, changing hemodynamic status and therapeutic interventions. Chemotherapy-related kidney damage can affect several components of the nephron. Cisplatin for example can damage the tubules. Decreased renal function can be acute or chronic (18).
Acute Kidney Injury (AKI) is a well-known comorbidity in critically ill children as well as in patients with cancer or hematological diseases. Dose reduction to avoid drug toxicity is common practice (19). AKI can be a result of nephrotoxic chemotherapy, administration of radiocontrast agents (during staging examinations), tumor invasion in the kidney and tumor lysis syndrome (TLS). TLS is a constellation of metabolic abnormalities, resulting from either spontaneous or chemotherapy-induced tumor cell death. Kidneys cannot adequately clear tumor waste products after cell breakdown by chemotherapy. Since the kidneys are not optimally functioning, antibiotics and other drugs are not well excreted. TLS is a pathological state that mostly occurs in children with acute lymphoblastic leukemia (ALL). 25% of the children, suffering from TLS, have ALL (20, 21).
On the other hand, in contrast to a decline in kidney function, a significant amount of cancer patients displays a supraphysiological renal function with enhanced renal perfusion and glomerular hyperfiltration resulting in increased drug elimination through renal excretion mechanisms (22). This condition, called “augmented renal clearance” (ARC), is the consequence of continuous release of vasoactive mediators. Nowadays, ARC is mainly described in the adult intensive care unit (ICU) population.
13 Meanwhile, there is growing evidence that ARC is also prevalent inan important number of children with malignancies and in critically ill children. The reason why critically ill children develop ARC seems to be a hyperdynamic cardiovascular state and an underlying inflammatory response. The potential causes of ARC in cancer patients need further investigation (23), but a hypothesis is illustrated in figure 2. Recent studies demonstrate that febrile neutropenia, younger age, systemic inflammatory response syndrome (SIRS) and the first week after surgical operation can be considered as risk factors for developing ARC in children with malignancies (4). As SIRS and neutropenia are the most important ones in the population of oncological patients, some further explanation on these will follow now.
When the patient has SIRS, the inflammatory and vasoactive mediators, as mentioned above, are typically present. SIRS induces hemodynamic alterations and in combination with extra fluid and vasoactive agents (prescribed to stabilize the patienthemodynamically) vasodilatation occurs and the cardiac output elevates. Consequently, the renal preload increases, there is hyperfiltration and as a result, augmented clearance of renally excreted drugs (22).
Another important risk factor is febrile neutropenia (which can cause SIRS or can induce ARC on its own) (24). Neutropenia is caused by bone marrow depression in cancer or by the effects of chemotherapy, both as a side effect and purposeful, as preparation for stem cell transplantation. Keita Hirai investigated the effect of febrile neutropenia on vancomycin clearance and ARC and concluded febrile neutropenia as an independent risk factor for ARC, which, on its turn, is a risk factor for changes in vancomycin clearance by the elevation of eGFR (23). The reason why febrile neutropenia causes ARC is still unclear (16). The same effect of febrile neutropenia on clearance of antibiotics is shown on the aminoglycoside arbekacin (10-13).
All above mentioned factors, related to cancer, which influence excretion, one way or another, are individually variable. The pharmacokinetic changes can currently not be predicted by one or a combination of known parameters, such as the type of cancer, the severity of neutropenia or the amount of chemotherapy (25).
Augmented renal clearance holds a risk of subtherapeutic drug exposure and thus warrants a dose increase in selected patients. That’s why only a small part of the neutropenic population achieved adequate predetermined concentration of antibiotics with standard dosing regimens in a study of Bury (16).
14
Figure 2. Hypothetic working mechanism of augmented renal clearance (ARC) in hemato-oncologic
patients. CO = cardiac output, GFR = glomerular filtration rate, RBF = renal blood flow, SIRS = systemic
inflammatory response syndrome. Adapted from (22).
1.3.5. Hematological diseases
Patients with hematological disease, who show a lot of similarities to cancer patients, are also included in this study. Patients with myelodysplasia, B-thalassemia and other hematological diseases undergoing stem cell transplant also suffer from neutropenia. The conditioning treatment precluding stem cell therapy involves intensive chemotherapy and causes similar pathological conditions as in children with cancer. Examples of this are anemia and fluid resuscitation resulting in a hyperdynamic status, neutropenia resulting in infection and organ toxicity to the kidneys and the liver due to treatment side effects.
15
1.4. Pharmacokinetics and pharmacodynamics of antibiotics
1.4.1. Pharmacodynamics of antibiotics
Pharmacodynamics (PD) describe the effect of the medicine (‘what the drug does to the body’). An important parameter, representing pharmacodynamics is the MIC (minimal inhibitory concentration). This is the minimum concentration of the antibiotic that inhibits growth of the micro-organism. There are three main patterns in the killing capacity of antibiotic drugs (illustrated in figure 3A). The first pattern is ‘concentration-dependent killing’, determined by peak concentration (Cmax). The efficacy of microbial killing of these drugs depends on the maximal plasma concentration. A long persistent effect (or post antibiotic effect, as described by Rybak (26)) is seen. Giving high doses will cause a higher efficacy than dosing more frequently. Therefore, the daily dose is usually administered in one gift (27). Amikacin, an aminoglycoside, is an example of a concentration-dependent antibiotic.
The second pattern is ‘time dependent killing’, which is determined by the time of the dosing interval during which the unbound plasma drug concentration remains above MIC. Concentrations under MIC can lead to the failure of the therapy and the selection of resistant bacteria. The longer the drug concentration is above MIC, the higher the killing impact of the antibiotic on the micro-organisms will be. Therefore, dosing frequently is more important than administering high doses (see figure 3B). Exact criteria are still not known. Preferably, antibiotic concentration is above MIC more than 50% of the time. In critically ill children, even a target of 100% of the time above MIC is aimed (28).
The last pattern is called ‘area under the concentration-time curve’. The efficacy is determined by AUC (area under the concentration-time curve) above MIC (see figure 3). Maximal effect can be attained by administrating as much antibiotic as possible within safe ranges to avoid toxicity. To estimate the effect of these drugs, AUC24h/MIC can be used. Vancomycin is an example of this category.
It is important to achieve the predetermined PK/PD-index. When therapeutic target is not attained, the antibiotics will not have their maximal effect and patients will be under-treated. Moreover, resistance of the pathogen will arise. When the concentration is supratherapeutic, toxicity can occur and side-effects will be more common (29).
16
Figure 3. Concentration-time curve. (A) 3 families of antibiotics: time-dependent (T>MIC),
concentration-dependent (Cmax>MIC) and AUC-concentration-dependent (AUC/MIC) (B) concentration-time curve of time-concentration-dependent antibiotics. Maximal effect of the time-dependent antibiotics with frequent doses.(Adapted from Siebers (27))
1.4.2. Amikacin
1.4.2.1. Working mechanism
Amikacin belongs to the aminoglycosides, which inhibit the protein synthesis of bacteria by binding the RNA of the prokaryotic 30S-ribosomes. Aminoglycosides are bactericida (30, 31).
(A)
17
1.4.2.2. Spectrum
It is one of the most frequently used aminoglycosides to treat severe multidrug-resistant Gram-negative infections, such as Enterobacteriaceae and Pseudomonas aeruginosa. They are ineffective against Gram-positive and anaerobic bacteria. Amikacin is often used empirically for complicated abdominal, nosocomial and urinary tract infections. Some Mycobacteria, such as M. tuberculosis, are also susceptible to aminoglycosides (15, 32).
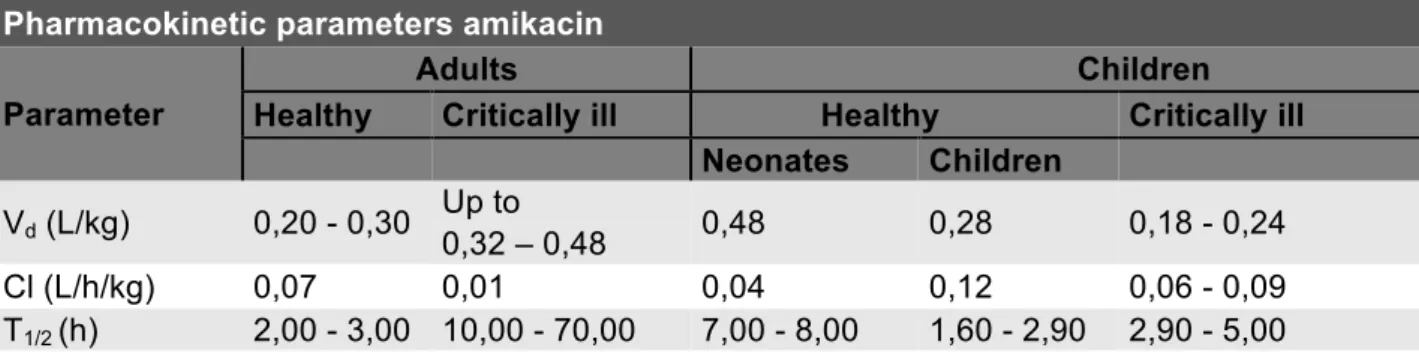
1.4.2.3. Pharmacokinetics
Amikacin is administered intravenously and poorly distributed due to its hydrophilic characteristics. It has a Vd of 0,2 - 0,3l/kg in healthy adults (33, 34), 0,28 L/kg in healthy children (35) and 0,23 L/kg in critically ill children (36). Other pharmacokinetic parameters are displayed in table 1. Amikacin is a low-extraction antibiotic and elimination takes place primarily by glomerular filtration (15). Since it’s almost exclusively glomerular filtrated, amikacin excretion can be considered as a potential parameter, evaluating kidney function.
Table 1. Pharmacokinetic parameters of amikacin in different populations (33-39).
Pharmacokinetic parameters amikacin Parameter
Adults Children
Healthy Critically ill Healthy Critically ill
Neonates Children
Vd (L/kg) 0,20 - 0,30 Up to 0,48 0,28 0,18 - 0,24 0,32 – 0,48
Cl (L/h/kg) 0,07 0,01 0,04 0,12 0,06 - 0,09
T1/2 (h) 2,00 - 3,00 10,00 - 70,00 7,00 - 8,00 1,60 - 2,90 2,90 - 5,00
1.4.2.4. Dosage and method of administration
Since Amikacin is a concentration-dependent antibiotic, the PK/PD index is the ratio of peak concentration above MIC (considered as 8 in this study). This ratio should be ≥8 and is strongly associated with clinical outcome. As clinical targets, the target peak concentration is set at 54-64 mg/ml (40), which is derived from the Cmax/MIC target. Amikacin has a narrow therapeutic index (32). Therefore, a once daily intravenous administration is accepted as standard. The standard daily dose is 20 mg/kg in children with cancer (25).
18
1.4.2.5. Side effects
Nephrotoxicity and ototoxicity are the main adverse effects of aminoglycosides.
Aminoglycosides affects the proximal tubule epithelial cell of the nephron. The occurrence of AKI varies between 20 and 33% of children with cancer who were exposed to aminoglycosides. The most powerful predictor of nephrotoxicity is the serum albumin concentration. The lower the serum albumin concentration, the likelier the chance of nephrotoxicity, since only free amikacin can harm the tubules. The reason for the inter-individual variability between patients is not clear (41, 42). Ototoxicity can also occur as a side effect. Although, nephrotoxicity is accepted as the most frequent side effect. There are differences between aminoglycosides: gentamycin and streptomycin especially affect the vestibular system whereas amikacin and neomycin are primarily cochleotoxic (43). Cochlear damage results in hear loss, especially high tones are mostly affected. Normally the ototoxicity consists of bilateral high frequency hear loss.
1.4.2.6. Therapeutic drug monitoring
Optimal dosing is highly inter- and intra-individually variable. It depends on the susceptibility of the organism, site and severity of infection. Additionally, the pharmacokinetic behavior of the drug can be influenced in children with cancer or hematological diseases, as described above (29). The high interpatient variability, the known narrow therapeutic index and potential adverse effects of amikacin are good reasons for starting therapeutic drug monitoring. In addition, amikacin safety was linked to the steady-state unbound trough plasma concentration being less than 5 mg/liter (25). Higher concentrations can be associated with the development of kidney injury and ototoxicity. However, patients with hematological cancers have a higher risk of kidney injury, even at lower concentrations (44).
1.4.3. Vancomycin
1.4.3.1. Working mechanism
Vancomycin is a glycopeptide antibiotic and inhibits the production of the peptidoglycan layer and consequently hedge the cell wall synthesis, by inhibiting the formation of NAG/NAM-chains. More specifically, it binds to acyl-D-alanyl-D-alanine in peptidoglycan. It has been on the market since 1958 (45).
19
1.4.3.2. Spectrum
Vancomycin is active against Gram-positive bacteria (Staphylococci, Enterococci, Pneumococci…). Gram-negative bacteria are resistant to vancomycin.
1.4.3.3. Indications
Vancomycin is used for invasive β-lactam-resistant Gram-positive infections. It is the most preferred antibiotic to treat methicillin-resistant Staphylococcus aureus (MRSA), Enterococcus faecium and methicillin-resistant coagulase-negative Staphylococci (46).
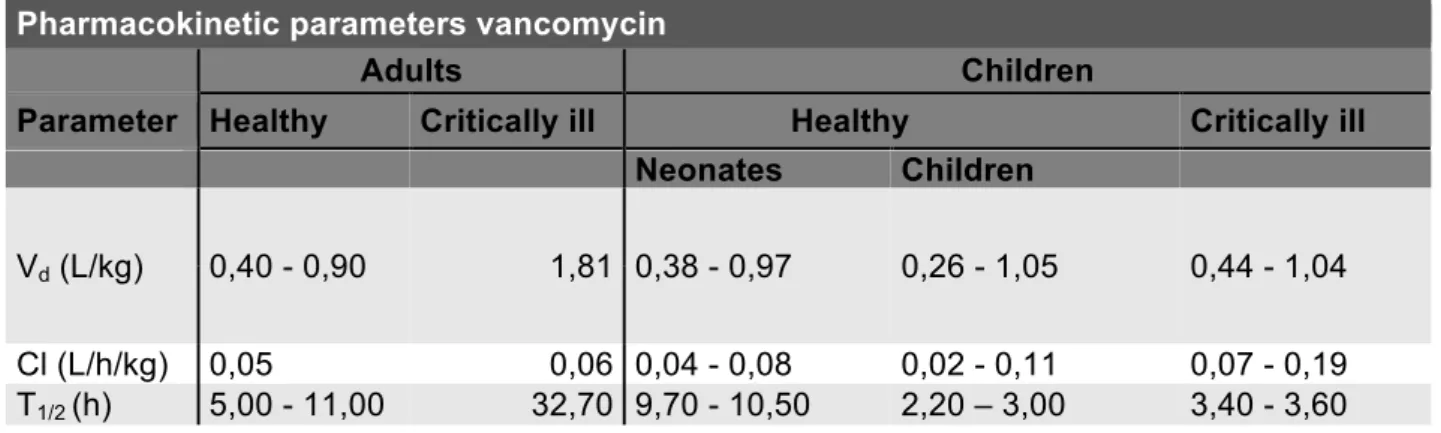
1.4.3.4. Pharmacokinetics
Vancomycin has a volume of distribution of 0.4-1L/kg in healthy adults (47), 0,66 L/kg in children (48) and 0,74 L/kg in critically ill children (49). Other pharmacokinetic parameters can be found in table 2. The degree of plasma protein binding is intermediate (50-55%), mainly to albumin and IgA. It also has a narrow therapeutic range and is primarily renally eliminated. Since it’s almost exclusively glomerular filtrated, vancomycin excretion can be considered as a parameter, evaluating kidney function. The PK/PD index is AUC/MIC, which results in the fact that area-under-the concentration-time curve (AUC) for 24h divided by area-under-the MIC (AUC24h/MIC) is the best predicting factor when treating invasive MRSA infection. Treatment target is set as AUC24h/MIC>400 (50).
Table 2. Pharmacokinetic parameters of vancomycin in different populations. (47-49, 51)
Pharmacokinetic parameters vancomycin
Adults Children
Parameter Healthy Critically ill Healthy Critically ill
Neonates Children
Vd (L/kg) 0,40 - 0,90 1,81 0,38 - 0,97 0,26 - 1,05 0,44 - 1,04 Cl (L/h/kg) 0,05 0,06 0,04 - 0,08 0,02 - 0,11 0,07 - 0,19 T1/2 (h) 5,00 - 11,00 32,70 9,70 - 10,50 2,20 – 3,00 3,40 - 3,60
20
1.4.3.5. Dosage and method of administration
Vancomycin is administered intravenously. The dosage must be based on the weight of the patient. The recommended dosage is 15-20 mg/kg every 6h unless children suffer from impaired kidney function, in that case, vancomycin is administered every 8h. The empiric therapy for critically ill children is 40 mg/kg/day. According to the most recent guidelines an initial vancomycin loading dose of 25-30 mg/kg should be administered. After the loading dose, intermittent maintenance doses should be given to achieve a trough plasma concentration of 20 mg/L. The target is to obtain an AUC24h/MIC>400. In clinical environment, trough concentrations are often used as surrogate parameters for AUC. In these situations, trough concentrations between 10 and 15 mg/mL can also be used as a target, following the guidelines of the University Hospital of Ghent. Vancomycin can be given intermittently or by continuous infusion. A study of Gwee A. et al. (a multicenter randomized controlled trial in 200 young infants in 2018) suggests that Continuous Infusions of Vancomycin (CIV) are a better alternative since adult studies report a higher attainment of target vancomycin levels, simpler therapeutic drug monitoring (TDM) and fewer side effects. However, it must be mentioned that these studies included only children of 0-90 days (52). In this study, CIV was not used.
1.4.3.6. Side effects
The risk of toxicity is low when the conventional dosage is used. This is the case for both ototoxicity and nephrotoxicity.
Nephrotoxicity occurs in 10-20 % of the patients treated by the conventional vancomycin therapy. When patients get a high dose vancomycin therapy, nephrotoxicity occurs in 30-40% of the patients. The mechanism is probably caused by an increased production of reactive oxygen species and oxidative stress. According to studies on animals, the oxidative stress attacks the cells of the proximal renal tubule. There are some factors that augment the risk of nephrotoxicity including high vancomycin levels, the concomitant treatment with nephrotoxic agents, a long therapy and the stay in an intensive care unit. Other frequentlyused concurrent nephrotoxic agents are aminoglycosides, loop diuretics, amphotericin B and penicillin. The nephrotoxicity of vancomycin is normally reversible (53).
Ototoxicity occurs in 1-9% of the patients. On top of that, one study showed that 12% of the patients who were under vancomycin therapy demonstrated an abnormal audiogram. However, the risk of ototoxicity is smaller than the risk of nephrotoxicity. Vancomycin-induced ototoxicity is still
21 controversial because it has never been demonstrated in animal trials. The damage is focused on the auditory nerve. Initially the high-frequency sensory hairs in the cochlea are affected, later followed by low-frequency hairs. This can eventually lead to total hear loss (54).
1.4.3.7. Therapeutic drug monitoring
Therapeutic Drug Monitoring (TDM) is measuring the drug concentration in blood, normally on drugs with a narrow therapeutic window. TDM of vancomycin has two goals, the first goal is to prevent supratherapeutic vancomycin concentrations, so the chance of nephrotoxicity and ototoxicity is reduced. The second goal is to achieve ideal therapeutic concentrations. Nowadays, TDM is standard of care (55, 56). In table 3, pharmacokinetic and pharmacodynamics properties of vancomycin and amikacin are shown.
Table 3. Comparison between PK and PD of vancomycin and amikacin.
(PK=pharmacokinetics, PD=pharmacodynamics, Vd=volume of distribution, Cl=clearance, T1/2=half-life,
AUC=area under concentration-time curve, MIC=minimally inhibitory concentration, Cmin=trough
concentration, Cmax=peak concentration) (15, 25, 30-32, 40-43)
VANCOMYCIN AMIKACIN
GROUP Glycopeptide Aminoglycoside
WORKING MECHANISM Inhibit cell wall synthesis Inhibit protein synthesis
SPECTRUM Gram-positive bacteria (bactericid) Gram-negative bacteria (bactericid) VD (L/KG) IN CHILDREN 0,3-1 0,3 CL (L/H/KG) IN CHILDREN 0,02-0,1 0,12 T1/2 (H) IN CHILDREN 1,5-3 2-3 PROTEINBINDING (%) 30-60 0-11 RENAL EXCRETION (%) 80-90 94-98
THERAPEUTIC RANGE Narrow Narrow
PK/PD-INDICES AUC/MIC=400-650 Cmax/MIC=8-12
EMPIRICAL TDM INDICES Cmin=10-15 mg/L Cmax=54-64mg/L Cmin<5mg/L
MODE OF ADMINISTRATION Mostly intermittent Intermittent
SIDE EFFECTS Ototoxicity Nephrotoxicity Red man syndrome
Ototoxicity Nephrotoxicity
22
2. Objectives
2.1. Research question
Reaching target concentrations is extremely important in treatment of children with cancer or hematological diseases, because one of the most dangerous causes of mortality in this population is infection. For this type of patients, special antibiotics are preserved such as vancomycin and amikacin. Previous studies have assumed that in this subpopulation, intended therapeutic concentrations of these antibiotics are often not reached, using current dosing regimens. As there is still a lack of knowledge about dosing for this population, this dissertation investigates if children with malignancies achieve the intended therapeutic concentrations of amikacin and vancomycin, observing current antibiotic treatment, using the standard of care.
The second question is whether both targets (AUC24h/MIC and trough concentrations), used to express vancomycin targets, are correlated between themselves.
The third question is whether the observed pharmacokinetic parameters differ from healthy and critically ill children in general, based on values of other studies.
Fourthly, since amikacin and vancomycin are almost exclusively excreted renally by glomerular filtration, it can be assumed that clearance of these antibiotics will be an adequate parameter of the kidney function. Accuracy of these hypotheses will be examined.
2.2. Objectives
The primary objective of this observational study is to examine the antimicrobial target attainment with current dosing regimens of amikacin and vancomycin in children with cancer and hematological diseases. Secondary objectives include: (i) the correlation between both targets used to express vancomycin targets, (ii) the estimation of PK parameters of both antibiotics and (iii) the study of correlation of antibiotic clearance with renal function as estimated using different eGFR formulas.
23
3. Material and methods
3.1. Study design
This study is an observational, open label study at the pediatric hemato-oncology department and pediatric intensive care department of the Ghent University Hospital, Belgium, conducted between March 2019 and October 2019. The study is in line with the Helsinki Declaration and approved by the institutional Ethics Committee (attachment 1 and 2). Being part of the ADIC study (started in July 2012), it is a pilot study in this subpopulation.
3.2. Patient selection
Patients with an oncological disease, aged 1 month to 15 years, treated with amikacin or vancomycin as standard of care, with a minimum weight of > 1 kg, and a double lumen central venous catheter or an arterial line other than the infusion line, already in place for the treatment, were included. Before patient inclusion, informed consent was obtained from the parents or legal representatives, in patients younger than 12 years old, and by the patients themselves if they are over 12 years old (attachment 3). Because of slow accrual (low number of patients treated with the study antibiotics matching the inclusion criteria and difficulties in obtaining informed consent), patients with hematological diseases were also included. These patients have many similar characteristics, compared to cancer patients and can therefore be included in the study.
Two study populations were observed: one group treated with amikacin, another group treated with vancomycin, both following the standard of care. Patients were recruited from the pediatric intensive care (amikacin n=5 and vancomycin n =8) and pediatric hemato-oncology department (amikacin n=5 and vancomycin =1).
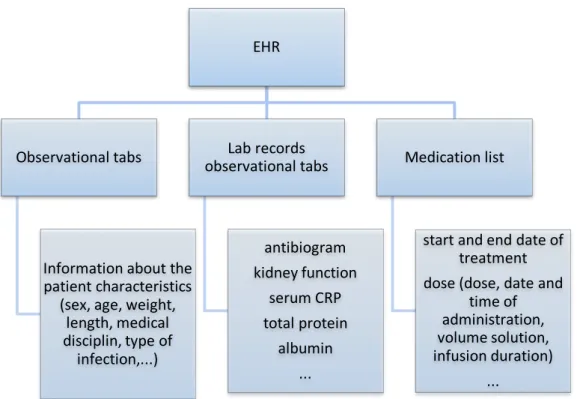
3.3. Data collection and processing
Data was used from the different tabs in the Electronic Health Record (EHR) of the Ghent University Hospital. The source of the data is represented in figure 4. The collected data has been processed in Microsoft Excel 2016.
24
Figure 4. The source of patients’ information.
3.4. Drug dosing and administration
Dosing regimens were applied according to hospital guidelines (table 4). In the case of vancomycin, central administration is preferable to peripheral administration. And the infusion time is about 60 minutes, whereas amikacin is infused in 30 minutes, preferably by peripheral administration. According to standard practice, the catheter was flushed with normal saline, after administering the necessary antibiotics. This was done immediately after drug administration with 1 à 2 ml (twice the volume of the dead space volume). The start date and time, the stop date and time and the infusion rate must be noted carefully for every dose.
Table 4. Dosing regimens for vancomycin and amikacin (25)
EHR Observational tabs Information about the patient characteristics (sex, age, weight, length, medical disciplin, type of infection,...) Lab records observational tabs antibiogram kidney function serum CRP total protein albumin ... Medication list start and end date of treatment dose (dose, date and time of administration, volume solution, infusion duration) ... AMIKACIN VANCOMYCIN
DOSE 15mg/kg once daily 20mg/kg every 6h
INFUSION TIME 30 minutes 60 minutes
PREFERRED MODE OF ADMINISTRATION
25
3.5. Blood sampling
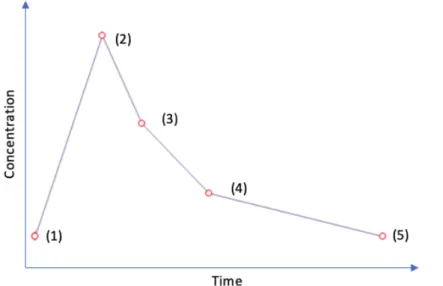
Serial blood samples were obtained intravenously on different moments, using another catheter than the drug infusion line. Depending on the type of the administered antibiotics, an adjusted sampling scheme should be followed. The blood samples of one dose included a sample before dosing, a sample immediately after administration of the dose (peak), a distribution sample, a mid-dose-interval sample and a final sample, to measure the trough concentration. The samples should be taken when steady state is achieved (from the third dose). An overview of the samples and their timing can be found in figure 5 and table 5. At least 4 consecutive samples per dose should be taken, in order to obtain enough data for adequate calculations. At the pediatric hemato-oncology department no distribution and pre-dose samples were taken in order to decrease the burden for the patients and staff. In steady state, a concentration of 2.5 mg/L (corresponding to the limit of quantification (LOQ) of the detecting device) was used as pre-dose concentration in calculations, if no pre-dose sample was available for amikacin. This could only be used when corresponding trough concentrations of the previous dose were also <2,5mg/L, which were checked and validated. For vancomycin, a clinical trough concentration, which was taken independently from the study, was used once as pre-dose concentration because no pre-dose sample was available. This in order to obtain 4 consecutive samples so the AUC would be more correct. The timing of blood sampling was recorded accurately, using the same clock as reference. The maximal amount of blood that can be taken per individual patient for PK sampling is 2.4 ml/kg body weight (57). When sampling patients on vancomycin, 2 ml blood was taken per sample. In the case of amikacin 1 ml of blood per sample was sufficient. Blood samples were pipetted into Eppendorf tubes, centrifuged (8 minutes, 1,885 x g) and kept cold before assay. The samples were stored at -80°C, before sending them to the chemistry laboratory for bio-analysis, at least within 3 months.
26
Figure 5. Blood samples taken in the ADIC study, an example of concentration-time curve. (1)
pre-dose sample (2) peak sample (3) distribution sample (4) mid-pre-dose sample (5) trough sample.
Table 5. Blood samples taken in the ADIC study
Vancomycin Amikacin
First dose Steady state dose
(+/- 3th dose)
First dose Steady state dose
(+/- 3th dose)
Pre-dose sample Just before administration of first dose Just before administration next dose Just before administration of first dose 6-3h before administration next dose Sample at the end of infusion
Right after flush Distribution
sample
Sample in the window of 60-180 minutes after start infusion
Sample in the window of 30-90 minutes after start infusion
Mid-dose sample Half-way dose-interval Half-way dose-interval Half-way dose-interval – 12h after start Half-way dose-interval
Trough sample Right before administration next dose 6-3h before administration of the next dose
27
3.6. Drug and biochemical assays
Amikacin concentration was determined in the laboratory of the Faculty of Veterinary Medicine in Merelbeke based on a validated liquid chromotography – mass spectrometry (LC-MS) method. As quantification limit, 5 mg/l was used. When the concentration was below the quantification limit, it was replaced by a value equal to half the LOQ (2,5mg/l). No precise PK-parameters could be calculated if in two or more consecutive samples-concentrations were below LOQ.
Vancomycin concentrations were determined in the clinical laboratory of Ghent University Hospital based on a validated chemiluminescence microparticle immunoassay, with the Architect i2000SR analyzer (Abbott, Illinois, VS). The minimum of measurable vancomycin concentration is 3mg/l. GFR was estimated on the basis of formulas, based on measured serum cystatin C and/or enzymatic creatinine and/or creatinine, measured following a compensated Jaffe method. Enzymatic creatinine is preferred in calculations. However, in case this was not available due to too small a sample, creatinine, calculated by the modified Jaffe creatinine method, was used. In order to compare the results of the calculated GFR for the same antibiotic, all calculations for amikacin were done with enzymatic creatinine and all calculations for vancomycin were done with the creatinine measured by the modified Jaffe creatinine. Cystatin C was analyzed in the clinical laboratory of the University Hospital of Ghent, by the Behring Nephelometer Analyzer II, Siemens© and expressed in mg/L. Enzymatic creatinine was also analyzed in the laboratory clinical biology of the University Hospital of Ghent, by the enzyme assay photometric method with the device ‘Alinity’, Abott© and is expressed in mg/dL.
3.7. Statistical analysis
3.7.1. Patient characteristicsPatient characteristics were analyzed by IBM©, Statistics SPSS 25. Since the obtained parameters have no normal distribution, median, Q1 and Q3 are reported.
3.7.2. PK/PD Target
According to the protocol of the University Hospital of Ghent, Cmax is used to evaluate target attainment of amikacin. This peak concentration should be between 54 and 64 mg/L, derived from the goal of Cmax/MIC-ratio between 8 and 12. In the case of vancomycin, the AUC24h/MIC-ratio should be between 400 and 650. All AUC calculations were made of samples from patients in
28 steady state. All calculated AUC’s were converted to AUC24h before evaluating target attainment. As clinical target, the Ghent University Hospital uses a trough concentration between 10 and 15 mg/L. This target is also followed in this dissertation. When the target could not be achieved, the dosing regimens were considered as subtherapeutic. Reaching over target interval, the dosage was considered as supratherapeutic.
A worst-case approach was used to obtain MIC, on the basis of the ‘The European Committee on Antimicrobial Susceptibility Testing’ (EUCAST) breakpoints (58), as used before in similar studies (15). For amikacin, the MIC of 8mg/L was used (based on the MIC for E. Coli), for vancomycin, 1mg/L (based on the MIC for MRSA). According to recent guidelines the MIC for MRSA (methicillin resistant staphylococcus aureus) remains constant in recent years so the use of standardized MIC is possible. For MRSA can be noted that the MIC of vancomycin has remained < 1mg/L for ≥90% of germs (59). The MIC of amikacin of 8 mg/L can also be considered as a save standard because studies suggest it is an overestimation of the mean MIC (60).
3.7.3. Pharmacokinetic parameters
Pharmacokinetic parameters were calculated, using a non-compartmental analysis, based on the log-linear trapezoidal method by PKSolver© (61). PKSolver© is an add-in software program for Microsoft Excel for solving problems in pharmacokinetic and pharmacodynamic data analysis. It is developed in 2010 by Zhang et al. and it is widely used in pharmacologic studies. Non-compartmental analysis (NCA) was used to compute pharmacokinetic parameters of amikacin and vancomycin from the time course of measured drug concentrations and to determine the degree of exposure following administration of a drug and other PK parameters, such as the clearance and the terminal half-life.
Only patients in steady state were included to calculate pharmacokinetic parameters because not enough patients could be included with first dose samples to draw conclusions. One of the patients, treated with vancomycin, had to be excluded because of this criterion.
3.7.4. Correlation eGFR and antibiotic clearance
Amikacin and vancomycin clearance were calculated by the add-in software program PKSolver© (Microsoft Excel) (61). Kidney function was estimated by the eGFR, for which different formulas are used.In the past, standard Hoek and Larsson formulas were used, but since 2010 there are references for calibration of cystatin C in different devices. With the calibration factor of each
29 company it is now possible to compare results from different devices. In this study, the device of Siemens was used (see above), thus the Hoek and Larsson formulas were adapted with this correction factor: CysCnew = CysCold * 1.174. Undermentioned formulas were used.
Spearman’s correlation coefficient (rs) was used to examine correlation between eGFR and antibiotic clearance. It is used two-tailed tested in all calculations of correlation in this study since all variables were non-parametric.
- The updated Schwartz “bedside” formula (k is the constant parameter of 0,413): 𝑒𝐺𝐹𝑅 = '∗)*+,)- (/0)
2*340 /3*5-+6+6* (789:) (62) - The Hoek formula
𝑒𝐺𝐹𝑅 = −4,32 + AB,CC
DE2-5-+6 D 78F (63) - The Larsson formula
30
4. Results
4.1. Amikacin
4.1.1. Demographic data and clinical parameters
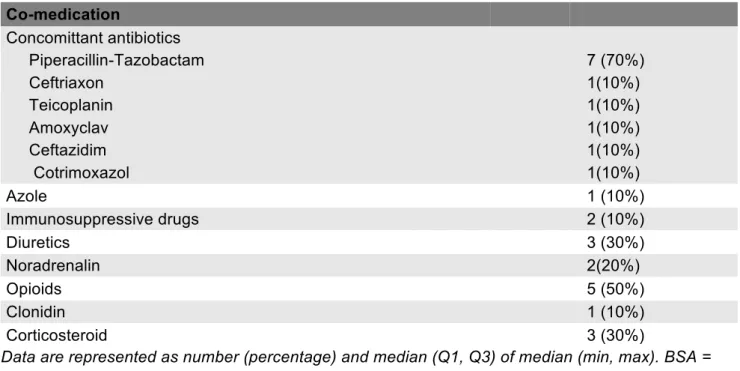
Demographic data and clinical parameters of patients treated with amikacin are illustrated in table 6. 58 samples of 10 patients in the ADIC-study with a median age of 5 were gathered. A median of 5 samples per patient were taken. 4 patients were intensive-care patients, 6 patients were hospitalized in the hemato-oncology department. 50% of the patients were treated with amikacin for febrile neutropenia, 80% of them had an empirical initial dosing of amikacin. Doses of amikacin ranged from 15 mg/kg to 26 mg/kg, with a median of 20 mg/kg. None of the patients received amikacin exclusively, co-medication varied according to pathology and symptoms. 70% of the patients were also treated with piperacillin-tazobactam.
Table 6. Patient characteristics of amikacin.
Patient characteristics amikacin
Demographic data All patients
Patients 10
Male 6 (60%)
Female 4 (40%)
Age in years, median (Q1-Q3) 5,04 (1,31-12,1)
Length in cm, median (Q1-Q3) 108 (80,25-148,25)
Weight in kg, median (Q1-Q3) 26,75 (10,64-39)
BSA in m2 median (Q1-Q3)
0,8 (0,48-1,33)
Samples and dose
Number of samples 58
Number of samples per patient, median (Q1-Q3) 5 (4,75- 7,25)
Dose in mg/kg, median (Q1-Q3) 20,17 (19,71-20,94)
Dose in mg/kg, median (min-max) 20,17 (15,00-26,32)
Indication for start antibiotics
Unspecified fever 2 (20%)
Febrile neutropenia 5 (50%)
Fever after chemotherapy 1 (10%)
Augmented CRP + Fever 1 (10%)
Profylaxis after surgery 1 (10%)
Empirical start of amikacin 8 of 10 (80%)
31 Co-medication Concomittant antibiotics Piperacillin-Tazobactam 7 (70%) Ceftriaxon 1(10%) Teicoplanin 1(10%) Amoxyclav 1(10%) Ceftazidim 1(10%) Cotrimoxazol 1(10%) Azole 1 (10%) Immunosuppressive drugs 2 (10%) Diuretics 3 (30%) Noradrenalin 2(20%) Opioids 5 (50%) Clonidin 1 (10%) Corticosteroid 3 (30%)
Data are represented as number (percentage) and median (Q1, Q3) of median (min, max). BSA = body surface area, CRP = C-reactive protein
4.1.2. Sampling characteristics
Concentration characteristics are given in table 7. A median concentration of 58,11 and 0,25 mg/L was measured in peak and trough samples, respectively. Trough concentrations were measured for 7 patients. No single one of them achieved trough plasma concentrations higher than 5mg/L, so all these trough concentrations are considered as non-toxic. It should be mentioned that two samples needed a reanalysis, due to wrong labeling.
Table 7. Sampling characteristics of amikacin from 7 patients in steady state.
Sample characteristics amikacin
Trough concentrations (mg/L) n = 7 Median (Q1-Q3) 0,25 (0,25-0,70) Median (Min-max) 0,25 (0,25-0,89) Peak concentrations (mg/L) n = 10 Median (Q1-Q3) 58,11 (38,24 - 75,46) Median (Min-max) 58,11 (31,59 -98,09)
32 4.1.3. Target attainment
The achievement of target in peak concentration can be found in figure 6. 6 out of 10 patients (60%) reach peak concentrations (Cmax) ≥54mg/L, 4 of them (40%) have supratherapeutic peak concentrations ≥64mg/L. The remaining 4 patients (40%) have a subtherapeutic concentration below the target peak concentration.
Figure 6. Amikacin target attainment. Target = Cmax 54-64mg/L
4.1.4. Pharmacokinetic parameters
The pharmacokinetic parameters half-life, volume of distribution and clearance of amikacin in the study population are displayed in table 8. Since at least 4 consecutive samples per dose should be taken from one patient in order to obtain enough data to calculate PK parameters and
concentrations of amikacin have to be high enough to calculate them precisely, one patient could not be included in the calculations.
0 20 40 60 80 100 120 1 2 3 4 5 6 7 8 9 10 Cm ax (m g/ L) Patient (number)
TARG ET AT TAINM ENT AM IKACIN CM AX
33
Table 8. Pharmacokinetic parameters amikacin in this study population and comparison with other
populations, based on literature
(i) PK-parameters of healthy children (ii) PK-parameters of critically ill children in general. Data are reported as median and quartile Q1 and Q3 (see table 1)
4.1.5. Correlation between clearance of amikacin and eGFR
No significant correlation could be found between amikacin clearance in this study population and eGFR, calculated by standardized pediatric formulas (Schwartz, Hoek and Larsson). Correlations are visualized in figure 7. For the above-mentioned reasons, only 9 patients could be included in the correlation measurements.
0 50 100 150 200 250 300 0 0,05 0,1 0,15 0,2 0,25 R evi se d S ch w ar tz fo rm ul a (m L/ m in /1 ,7 3m ²) Amikacin clearance (L/h/kg)
Revised Schwartz
Pharmacokinetic parameters amikacin (n = 9)
Parameters Median (Q1-Q3) (i) Healthy (ii) Critically ill
Volume of distribution (L/kg) 0,40 (0,34-0.61) 0,28 0,18 – 0,24 Clearance (L/h/kg) 0,143 (0,107-0,166) 0,12 0,06 – 0,09 Half-life (h) 2,17 (1,73-3,07) 1,60 – 2,90 2,90 – 5,00
34
Figure 7. Scatterplots between clearance of amikacin and eGFR in ml/min/1.73m² by (A) revised
Schwartz formula, (B) Hoek formula, (C) Larsson formula. No significant correlation could be shown. Schwartz formula uses serum creatinine, both Hoek and Larsson are based on serum cystatin C.
None of the correlations coefficients between amikacin clearance and any of the used formulas are significant. Also, all correlations are weak. Spearman’s correlation coefficients and their p-value are given in table 9.
0 20 40 60 80 100 120 140 160 180 200 0 0,05 0,1 0,15 0,2 0,25 H oe k fo rm ul a (m L/ m in /1 ,7 3m ²) Amikacin clearance (L/h/kg)