This study has been performed within the framework of project M/500034 Report 500034002/2005
Consequences for the Netherlands of the EU thematic strategy on air pollution
R.J.M. Folkert et al.
Contact: R.J.M. Folkert
Netherlands Environmental Assessment Agency Rob.Folkert@mnp.nl
Abstract
Consequences for the Netherlands of the EU thematic strategy on air pollution
Although air quality has greatly improved during the last decades, current levels of air pollution still have adverse effects on ecosystems and human health. Thousands or perhaps even tens of thousands of people may die prematurely every year as a result of air pollution in the Netherlands. In addition to this, the current EU air quality limit values for nitrogen dioxide (NO2) and particulate matter (PM10) are being exceeded in many locations in the Netherlands. Consequently, a large number of plans for spatial development are rejected because they do not conform to currently legislated limit values. This has serious economic and societal consequences.
In September 2005 the European Commission presented a thematic strategy on air pollution and a proposal for a new air quality directive for the abatement of air pollution in the European Union (EU). The measures come into effect after 2010 and are more far reaching than those recently proposed by the Dutch government which is directed to solving current problems. The measures proposed by the European Commission would greatly reduce air pollution while providing benefits to health that would be many times larger than the abatement costs. Attainment of the NO2 limit value in the Netherlands is possible under the new measures, provided that a 5-year extension of the attainment date is acknowledged by the European Commission. However, this is not the
case for the limit value for particulate matter (PM10).The large-scale exceedances of PM10 will probably be avoided; however local exceedances will probably remain, and these may still have serious consequences for spatial planning. Extra national and, in particular, European-wide measures will be required to meet the limit value for PM10 in the Netherlands. The potential for achieving additional national abatement policy is, in fact, limited and expensive, while the foreign contribution to particulate air pollution is large.
If the air quality limit values are actually to be realized in the future, it is crucial that the EU source policy – which still has to be worked out – will at least meet the ambition level taken up in the thematic strategy. This is of special importance with respect to reducing air pollution originating from road traffic, because road traffic at bottlenecks makes a large contribution to the poor air quality. The most recent proposal (July 2005) of the European Commission for tightening EU emission standards for light-duty road traffic sets a comparable level for particulate matter but a lower ambition level for nitrogen oxide than the ambition level on which the strategy is based. This lower ambition level will, in the Netherlands, prevent timely attainment of the NO2 limit value.
Rapport in het kort
Gevolgen voor Nederland van de EU thematische strategie voor luchtverontreiniging De luchtkwaliteit is in de afgelopen decennia sterk verbeterd. Desondanks hebben de huidige niveaus van luchtverontreiniging een negatief effect op ecosystemen en de gezondheid van de mens. Mogelijk duizenden of misschien zelfs enkele tienduizenden mensen overlijden elk jaar vroegtijdig in
Nederland door luchtverontreiniging. Daarnaast worden op veel lokaties in Nederland de huidige EU luchtkwaliteitsgrenswaarden voor stikstofdioxide (NO2) en fijn stof (PM10) overschreden. Een groot aantal plannen voor ruimtelijke ontwikkeling is door de Raad van State afgewezen omdat deze niet in overeenstemming waren met de wijze waarop de grenswaarden in Nederland zijn geïmplementeerd. Dit heeft serieuze economische en maatschappelijke gevolgen.
De Europese Commissie heeft een thematische strategie voor luchtverontreiniging en een voorstel voor een nieuwe luchtkwaliteitsrichtlijn uitgebracht in september 2005 om de luchtverontreiniging in de Europese Unie verder aan te pakken. Deze voorstellen worden effectief na 2010 en gaan veel verder dan de maatregelen van het kabinet uit het prinsjesdagpakket die op de huidige problemen is gericht. Met de voorgestelde maatregelen van de Commissie neemt de luchtverontreiniging fors af en ontstaan er baten voor de volksgezondheid die zijn vele malen groter dan de kosten. De grenswaarde voor stikstofdioxide is mogelijk haalbaar met de maatregelen mits de Europese Commissie Nederland 5 jaar uitstel van de ingangsdatum verleent. De grenswaarde voor fijn stof (PM10) is echter
waarschijnlijk niet haalbaar. Grootschalige overschrijdingen van de fijnstofgrenswaarde worden waarschijnlijk opgelost, maar lokale overschrijdingen blijven mogelijk. Deze overschrijdingen kunnen nog steeds een serieus effect hebben op plannen voor de ruimtelijke inrichting. Extra nationale en vooral maatregelen op Europese schaal zijn nodig om de grenswaarde voor PM10 in Nederland te realiseren. Het potentieel voor maatregelen in Nederland is namelijk klein en duur, terwijl de bijdrage uit het buitenland groot is.
Voor het werkelijk realiseren van de grenswaarden in de toekomst is het cruciaal dat het nog vorm te geven EU bronbeleid minstens even ambitieus is als in de thematische strategie. Dit is vooral van belang voor het terugdringen van de vervuiling van het wegverkeer omdat het verkeer op knelpunten sterk bijdraagt aan de slechte luchtkwaliteit. Het meest recente voorstel (juli 2005) van de Europese Commissie om de emissienormen voor licht wegverkeer aan te scherpen heeft voor fijn stof een vergelijkbare maar voor NOx een lager ambitie niveau dan waarop de thematische strategie is gebaseerd. Realisatie van de grenswaarde voor stikstofdioxide zal met dit lagere ambitieniveau in Nederland niet op tijd mogelijk zijn.
Preface
The thematic strategy on air pollution and a proposal for the new air quality directive, both constructed in the Clean Air for Europe (CAFE) programme, were published by the European Commission on 21 September 2005. These documents contain proposals for new policy on air pollution in the European Union. The Dutch government asked the Netherlands Environmental Assessment Agency to assess the proposals and the data used in the CAFE programme with respect to consequences for the Netherlands. The result of this assessment is presented in this report. The Dutch government, at the Opening of Parliament in September 2005, has also presented a plan for combating air pollution. The assessment report of this plan will be presented together with this report as a twin package.
We are indebted to a number of people from the Netherlands Environmental Assessment Agency and other organizations that collaborated with us in realizing this report. A special word of thanks goes to Janusz Cofala and Markus Amann from IIASA and Leonor Tarrason of EMEP for providing data, and to Ann Jenks and Ruth the Wijs for their efforts in turning our English into proper English. We would also like to thank Ingrid Kalter for her secretarial assistance. The people who have contributed to the contents of this report are listed below.
Rob Folkert Eltjo Buringh Pieter Hammingh Jan Aben Jeannette Beck Wim Blom Leendert van Bree Robert van den Brink Ed Buijsman
Mariette van Esbroek Jean Paul Hettelingh Hans van Jaarsveld Benno Jimmink Jan Matthijsen Arjen van Hinsberg Robert Koelemeijer Jeroen Peters Jan de Ruiter Winand Smeets Sandy van Tol Roel Thomas Guus Velders Karel van Velze Wilco de Vries Keimpe Wieringa Henk van Zeijts
Contents
Summary 9
1. Introduction 15
2. CAFE Baseline and policy scenarios 17
2.1 CAFE Baseline and Dutch national scenarios 17
2.2 Thematic strategy, measures and costs 20
2.3 Uncertainties in Dutch projections 27
2.4 Benchmarks 29
3. Air quality in the future 33
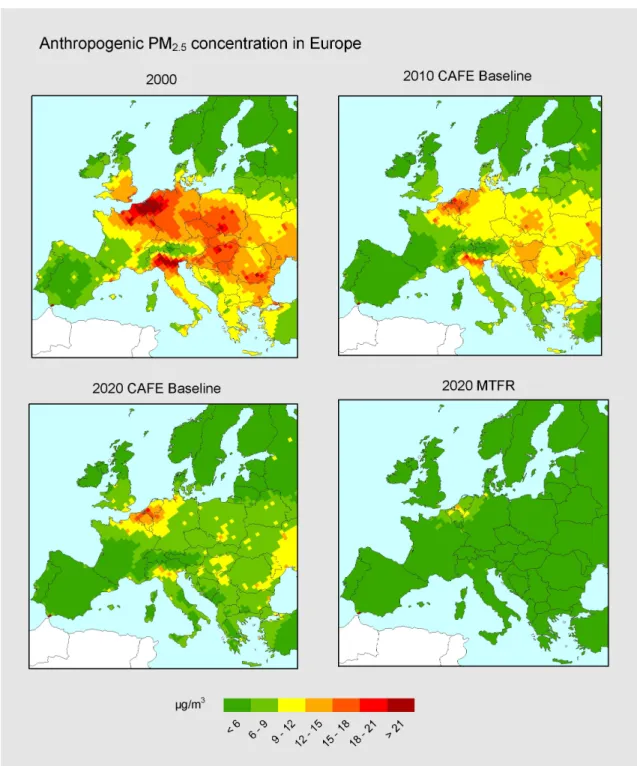
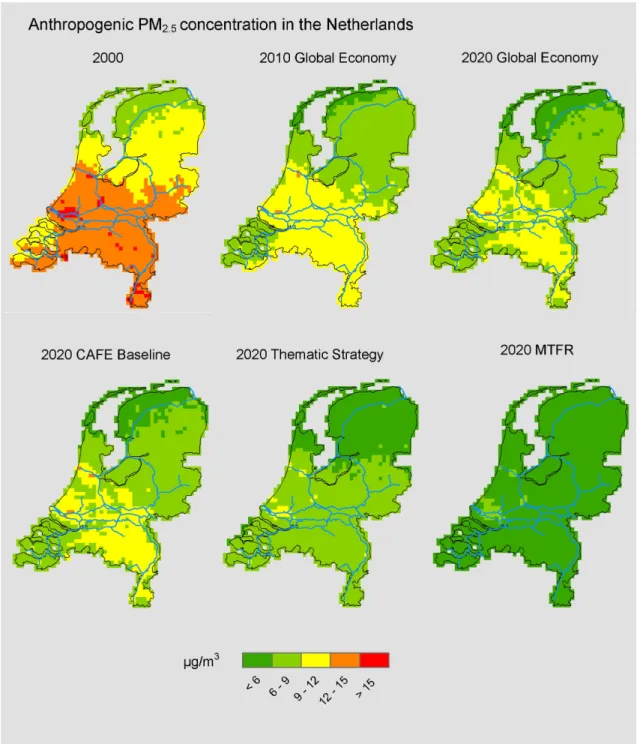
3.1 PM2.5 particulate matter 33
3.1.1 Concentrations in Europe 34
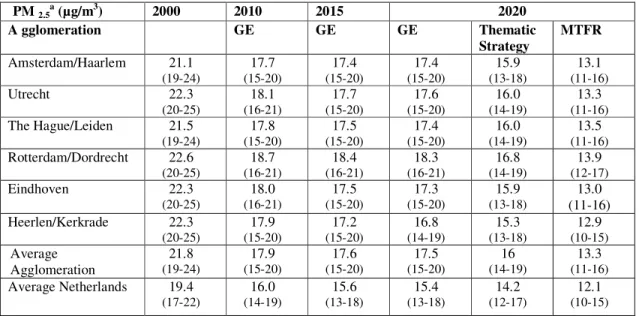
3.1.2 Concentrations in the Netherlands 36
3.1.3 Transboundary and sector contributions 39
3.1.4 Uncertainties 40
3.2 PM10 particulate matter 41
3.2.1 Concentrations in the Netherlands 41
3.2.2 Transboundary and sector contributions 44
3.2.3 Uncertainties 46
3.3 Nitrogen dioxide 46
3.3.1 Concentrations in Europe 46
3.3.2 Concentrations in the Netherlands 47
3.3.3 Transboundary and sector contributions 50
3.3.4 Uncertainties 51
3.4 Ozone 51
3.4.1 Concentrations in Europe 51
3.4.2 Concentrations in the Netherlands 52
3.4.3 Uncertainties 52
3.5 Acid and nitrogen deposition 52
3.5.1 Deposition in Europe 53
3.5.2 Deposition in the Netherlands 53
3.5.3 Transboundary contributions 54
3.5.4 Uncertainties 55
4. Impacts in the future 57
4.1 Health impacts 57
4.1.1 Health impacts in Europe 57
4.1.2 Health impacts in the Netherlands 58
4.1.3 Differences in calculating health impacts 59
4.1.4 Uncertainties in health impact assessments 60
4.1.5 Different hypotheses for particulate matter 62
4.2 Ecosystem impacts 65
4.2.1 Impacts within a European context 65
4.2.2 Ecosystem impacts in the Netherlands 67
4.2.3 Differences in calculating the impact on ecosystems 67
5. Costs and benefits of proposed measures 71
5.1 Costs and benefits in Europe 71
5.2 Costs and benefits in the Netherlands 72
5.3 Uncertainties 73
6. Implementation of new air quality policy 75
6.1 Air quality legislation 75
6.1.1 Applicability and assessment of limit values 76
6.1.2 Attainment and derogation of limit values 77
6.2 Revision of the NEC directive 80
6.3 EU measures 81
References 85
Annex A. Modeling methods 91
Annex B. Available measurements of PM2.5 in the Netherlands 94
Annex C. Definitions of ozone indicators 95
Annex D. Details health calculations 96
Summary
The problemAlthough air quality has greatly improved during the last decades, studies have indicated that short-term exposure to the air pollutants ozone and particulate matter can still be linked to the premature deaths of some thousands of people yearly in the Netherlands. The effects of long-term exposure to particulates, while very uncertain, have been estimated to be even more serious than those of short-term exposures, in that some ten thousands of people in the Netherlands may be dying up to 10 years prematurely. The biodiversity of Dutch ecosystems is also adversely affected by air pollution with nitrogen. Air pollution is a true transboundary problem in Europe. While one-half of the total air pollution in the Netherlands originates from sources abroad, the Netherlands itself exports a few times more air pollution than it imports. A common European policy on air pollution abatement would therefore provide the best means for combating air pollution overall. In response, the European Commission has formulated a thematic strategy on air pollution and a proposal for a new air quality directive within the framework of the Clean Air For Europe (CAFE) programme. The thematic strategy also presents a first proposal for the review of the NEC directive in which new agreements will be made with Member States for national emission ceilings for 2015 and 2020. In addition, at the Opening of Parliament in September 2005 the Dutch government presented a plan to combat air pollution.
The proposal of the European Commission
Because of the large health benefits to be obtained, the focus of the new EU policy is on particulate matter. The main elements of the strategy and the directive of the Commission are:
• Current air quality limit values for PM10 and NO2 that remain unchanged.
• A new annual concentration cap for the finer fraction of particulate matter (PM2.5) of 25µg/m3 averaged per year that has to be attained by 2010 throughout the entire territory of each member state.
• A new interim reduction target value to reduce the yearly average urban PM2.5 background level by 20% between 2010 and 2020. This target is not legally binding and will be reviewed when more monitoring data for PM2.5 are available. The setting of different target values for the Member States and the legal status of these agreements will be addressed in this review.
• A proposal to tighten the emission ceilings in order to reduce the emission of sulfur dioxide (SO2), nitrogen oxides (NOx), ammonia (NH3), non-methane volatile organic compounds (NMVOC) and particulate matter PM2.5 in 2020 in all Member States (see Table 1). This reduction will be realized with European Union (EU) and/or national source policies. The European standards for road traffic are crucial here because of their major impact on air pollution at all levels.
• A possibility for derogation of the limit values for particulate matter (PM10 and PM2.5) and NO2 by a maximum of 5 years beyond the attainment date if certain criteria are met. Any request for time extension should be accompanied by a plan to ensure compliance within the extended time period.
• A possibility to discount natural sources from air pollution levels for compliance purposes that can be determined with sufficient certainty. For the Netherlands, the contributions of sea salt and mineral dust from natural sources may be relevant in discounting these from particulate matter.
Table 1. EU proposal to reduce emission of air pollutants in 2020 with respect to 2000.
Substance Reduction, EU Reduction, the Netherlands
Sulphur dioxide (SO2) 82% 40%
Nitrogen oxide (NOx), 60% 50%
Volatile organic compounds
(NMVOC) 51% 40%
Ammonia (NH3) 27% 30%
The Netherlands has one of the most eco-efficient economies in Europe
The Netherlands is densely populated, with one of the highest environmental pressures in the EU, but it has also one of the most eco-efficient economies of the EU. Therefore, the reductions set for the Netherlands in the proposal to tighten the emission ceilings are lower than the EU average (Table 1) since there is less abatement potential remaining. Regional concentrations of particulate matter and NO2 in the Netherlands are among the highest in Europe, but the concentrations in Dutch cities are comparable to those of other large urbanized areas in Europe. For ambient ozone, the levels in the Netherlands are relatively low, but for the deposition of nitrogen and acid, the levels are among the highest in Europe.
What does this proposal to reduce pollution mean for air pollution in the Netherlands?
With current policy, the daily limit value for particulate matter (PM10) will probably still be exceeded in the southern part of the Netherlands and cities until 2020. With the reduction in pollution as proposed in the thematic strategy, the concentration of particulate matter (PM2.5 and PM10) decreases (by an additional 5–10% in 2020). Consequently, the number of exceedances of the PM10 limit value will decrease by 50–80% in 2020, although especially exceedances will probably still occur in busy streets. Exceedances of the limit value for NO2 will probably occur until 2020 with current policy. With the thematic strategy, the number of NO2 exceedances will show an extra fall of 60–100% between 2015 and 2020. The remaining NO2 exceedances can in principle be resolved with additional local policy from 2015 onwards. In addition to this, 5–20% of the ecosystems in the Netherlands will have extra protection against excess air pollution by nitrogen in 2020 with the ambition level in the thematic strategy.
Can the Netherlands meet the proposed requirements?
The exceedances of PM10 in 2005 and the limit value of NO2 in 2010 are still probable with the proposed reduction of pollution in the thematic strategy. However, the derogation of 5 years may provide enough time to possibly resolve the NO2 exceedances in 2015 with additional local measures. A crucial point is that the Commission does not loosen the ambition levels for the reduction of air pollution, especially for road traffic.
The most recent proposal (July 2005) of the European Commission for EU emission standards for light-duty road traffic sets a comparable level for particulate matter but a lower ambition level for nitrogen oxide than the standards on which the strategy is based. With this lower ambition level the limit value for NO2 will probably not be attainable in 2015, but attainment will just be possible in 2020. The derogation time is probably not sufficient to resolve the exceedances of PM10 in 2010. The reduction of pollution in Europe with application of the thematic strategy is not enough to prevent local exceedances of the PM10 limit value in the Netherlands until 2020. An additional national abatement policy is not sufficient and very expensive, amounting to billions of euros.
The new 2010 concentration cap for PM2.5 is stricter than the annual limit value for PM10, but it is less strict than the PM10 daily limit value. Current information on PM2.5 is very limited since only a few scattered measurements are available, and accurate assessments are therefore not possible. Preliminary assessments based on these limited data indicate that with the ambition level in the thematic strategy, the 2010 concentration cap is not probable until 2020. Exceedances are probably not widespread, but they do occur in busy streets in cities. The derogation time is not sufficient to resolve the exceedances of PM2.5 in 2015. It is highly probable that the proposed interim reduction target of 20% for the average urban background level for PM2.5 is unattainable with the ambition level in the thematic strategy; however, this target is not legally binding at the present time.
Sea salt has already been discounted from PM10 levels but not from the PM2.5 levels. If, in addition to the proposed measures in the thematic strategy, sea salt is discounted from the PM2.5 levels,
attainment of the 2010 concentration cap might be possible in 2020. The proportion of mineral dust that is not anthropogenic and, therefore, discountable as a natural source from particulate matter is uncertain. The contribution of mineral dust to PM2.5 is much smaller than its contribution to PM10. Consequently, for PM10, there is a potential for a large effect on attainment. However, a large part of
the contribution of mineral dust to PM10 is probably not from a natural source. Although it is not likely that sea salt affects health, mineral dust probably does. Discounting natural sources does not improve air quality and means a weakening of the current limit values.
Road traffic has a major impact on poor air quality in the Netherlands. © Rob Folkert
Consequences for the Netherlands
The current situation in the Netherlands is that plans for spatial development are rejected if they are in conflict with air quality limit values, such as those for NO2 and PM10, which has serious economic and societal consequences. The attainment of NO2 is possible with the policy in the thematic strategy but attainment for PM10 is not. For PM10, large-scale exceedances will be resolved. However, local exceedances will probably persist until 2020, with possible serious economic and societal
consequences. For PM2.5, exceedances will probably occur; however, since the PM10 limit value is stricter, no new areas with exceedances are expected. The limit values can probably not be attained with national policy since additional abatement policy for particulate matter (PM2.5 and PM10) is very expensive, amounting to billions of euros, whereas the effect of abatement possibilities are limited and the foreign contribution to particulate air pollution is large.
The connection with national policy
The Dutch government presented a plan for combating air pollution at the Opening of Parliament in September 2005. This plan is directed to solving current problems, whereas the European policy only comes into effect in 2010. The thematic strategy will supplement the effect of this national policy by tightening source policy in all Member States and by providing cleaner vehicles through stricter emission standards all over Europe. With its own plan, the Dutch government is, in particular, accelerating the introduction of these cleaner vehicles. Additional measures are also being taken to reduce emissions, which too will contribute to the attainment of the future new emission ceilings that will be set by the EU. The plan of the Dutch government also contains local measures to combat exceedances of air quality limit values. The extra costs of source policy in the thematic strategy are approximately threefold the cost of the proposals in the current national plan.
Review of national emission ceilings and measures
The proposal in the thematic strategy to tighten the emission ceilings in order to reduce the emission of air pollution represents the first step in a review of the NEC directive, which is to be completed in 2006. Part of this reduction will be realized with EU policies, for example, further implementation of the Product and Solvent Directives, IPPC legislation and the EURO emission standards for mobile sources. Other reductions have to be achieved with national policy. However, no direct link was made in the thematic strategy between possible legislation and technical measures. Uncertainties should be taken into account when agreements are being made on new emission ceilings since uncertainties in emission projections are of the same order of magnitude as the policy task. These uncertainties may lead to a costly unattainable ceiling and/or ceilings that can be attained with current policy. Current knowledge on PM2.5 emissions to provide the base upon which to build a national emission ceiling is very limited.
Costs and benefits
The proposal to tighten the emission ceilings in the thematic strategy will cost the Netherlands about 330 million euros per year. These additional costs have to be paid by agriculture (35%), industry (35%) and traffic (25%). The total abatement cost will increase by 10% in 2020. The benefits of the source policy in the thematic strategy for the Netherlands seem to be many factors larger than the costs, and almost all of the measures seem to be cost-effective. Benefits are dominated by the
reduction in the health impacts from long-term exposure to particulate matter, although the magnitude of these benefits seems to vary depending on the underlying health study chosen as reference.
Nevertheless, if the negative impact on health from short-term exposures to air pollution is taken into account, the mortality risk associated with this negative impact on health in the Netherlands is well above the Dutch limit values for environmental safety risks. Moreover, effects on ecosystems are not taken into account in the cost-benefit analysis since these benefits are not monetized.
The fraction of the particulates causing a specific health effect is unknown. Sea salt together with sulphate, ammonia and nitrate is most likely not a health hazard. As a precautionary measure, a reduction in the levels of particles from combustion sources would appear to be beneficial to health. Unfortunately, the abatement policy in the thematic strategy has not been optimized for this
hypothesis. Different causal fractions lead to totally different abatement strategies for different sources at different costs. If the policy were to be optimized for primary particles as the causal fraction, costs to the Netherlands would decrease by approximately 65–85%. Measures to reduce secondary aerosol precursors (SO2, NO2, NH3 and volatile organic compounds (NMVOC)) would then be unnecessary. However, a reduction in secondary aerosol precursors remains an important target for reducing the health risk from short-term exposure to ozone and the effects on ecosystems.
Reporting issues
Member States are obliged to submit reports on the levels of ambient air quality and exceedances of limit values to the European Commission. The current assessment methods of air quality in the EU result in assessments that are incomparable with respect to levels and exceedances between Member States. In the Netherlands, a combination of modelling and measurements is used, whereas many other Member States only use measurements. Moreover, the Netherlands uses a correction factor for the underestimation of particle measurements with the reference method, whereas many other Member States use different correction factors, while some do not use a correction factor at all. The detailed Dutch method of assessing air quality leads to relatively higher registered levels of air pollution and higher numbers of exceedances. While this inequity in assessment methodology seems to be improving, it is not yet resolved in the new air quality policy. However, reporting plans have not yet been worked out.
Differences in scientific data in CAFE
The cost for the Netherlands of the source policy as proposed in the thematic strategy should be regarded as a lower limit. The magnitude of the cost of the technical abatement measures reported by the EU is approximately in line with national figures, with the exception of the costs for NMVOC. Next, differences between national and EU scenario (CAFE Baseline) may lead to higher abatement costs for SO2 and NOx.
The current CAFE Baseline differs from national expectations showing a higher coal use and a higher proportion of diesel-powered vehicles, both of which lead to higher estimates for SO2 and NOx. These higher estimates have consequences for the position of the Netherlands with respect to negotiations for new emission ceilings, because a higher policy task will be calculated on the basis of the CAFE Baseline. However, the Commission is constructing a new CAFE Baseline, and the Netherlands has submitted a national scenario for presenting future developments specific to the Netherlands for the NEC review. Although there are differences in emissions between national expectations and the current CAFE Baseline, these differences are not significant with respect to the calculated environmental quality for the Netherlands.
The EMEP model, which is the basis for dispersion calculations in CAFE, overestimates the nitrate concentrations in the Netherlands and underestimates the NO2 air concentrations. The model may therefore overestimate the importance of the long-range transport of oxidized nitrogen over the Netherlands. Although the overestimation of nitrate concentration is not so high in other areas, the EMEP/RAINS system can be expected to overestimate the reduction of PM2.5 background
concentrations in the Netherlands when EU reductions in NOx emissions are applied. The system will also probably overestimate the efficiency of Dutch NOx emission reductions. National measures to reduce NOx Dutch emissions may thus prove more efficient than envisaged under the present CAFE calculations.
The Commission has not used scientific data to assess the attainment of the new PM2.5 concentration cap for the Netherlands. The RAINS model does not address concentrations in street canyons or around industrial hot spots and thus cannot determine attainability of limit values.
1. Introduction
Although air quality has greatly improved during the last decades, there is still a strong association between air pollution and premature mortality, while biodiversity remains under pressure mainly from air pollution by nitrogen. Consequently, the European Commission is establishing a new air pollution policy within the framework of the ‘Clean Air for Europe’ (CAFE) programme in accordance with Sixth Environmental Action Programme. The objective of the air quality policy formulated by the European Commission in their action programme is to achieve levels of air quality that do not give rise to significant negative impacts on – and risks to – human health and the environment. Because of the large health effect from exposure to particulates, the focus has been on the abatement of particulates in CAFE. Within their action programme, the European Commission announced the construction of a thematic strategy on air pollution – as one of the seven thematic strategies. Thematic strategies propose actions for dealing with complex issues that require a broad and multi-dimensional approach. The European Commission initiated the CAFE programme of technical analysis and policy development as the means to support three important policy processes:
• The construction of a thematic strategy on air pollution; • The review of the air quality directives;
• The review of the NEC (National Emissions Ceiling) directive.
The European Commission has published a thematic strategy on air pollution and a proposal for the new air quality directive in September, 2005 (EU, 2005a and 2005b). These plans will be discussed in the Council and Europarliament later this year. The proposed new limit values and revisions for air quality legislation are incorporated into the proposal for the new air quality directive. In the thematic strategy, the European Commission has proposed an ambition level to be considered with the revision of the NEC directive. The thematic strategy also represents the first step in a review of the NEC directive to be completed in 2006, in which new agreements will be made with Member States for national emission ceilings for 2015 and 2020.
The Dutch government asked the Netherlands Environmental Assessment Agency to assess the proposals and the data used in the CAFE programme. In this report, the environmental, economic and societal consequences of the new proposed legislation for the Netherlands have been assessed. This assessment has been made to support the position of the Netherlands during future negotiations and discussions of this new air pollution policy. Two key elements in the negotiations will be: (1) what are the costs of the proposals to the Netherlands and what are the environmental benefits for the same; (2) can the Netherlands meet the proposed demands. The Netherlands currently has problems attaining the national emission ceilings for 2010; additionally, the current EU limit values for PM10 and NO2 are having serious consequences for spatial planning. Spatial plans are subject to appeal because of possible breaching of these limit values. Last the data on which the proposals have been based have been checked with national data.
This assessment includes a detailed calculation of Dutch air quality. Additionally, the data provided in assignment by the European Commission for the Netherlands have been compared with the national data to verify if the proposed targets are soundly based on accurate information. Benchmarks on air pollution have been made with other countries in order to compare the problems of the Netherlands with those of other member states. In Chapter 2, the CAFE Baseline and source policy of thematic strategy are discussed; in Chapter 3, air quality is assessed with respect to air quality standards in the thematic strategy; Chapter 4 consists of a discussion on the impacts of the air quality policy on health and ecosystems; Chapter 5 the costs and benefits of the proposed air pollution policy are presented; finally, in Chapter 6, implementation of new air quality policy is discussed.
2. CAFE Baseline and policy scenarios
The European Commission has constructed a strategy for combating air pollution within the Clean Air for Europe (CAFE) programme. To assess future air quality up to 2020, a European-wide scenario that includes additional climate measures has been constructed by the International Institute for Applied Systems Analysis (IIASA). Different policy runs with abatement measures have been constructed with RAINS (Regional Air Pollution Information and Simulation) to assess future air pollution policy ambition levels and to construct the ambition level of the thematic strategy. In this chapter we discuss both the CAFE Baseline scenario and compare it to national projections. We discuss the policy runs and the thematic strategy, including abatement measures and the costs involved. Lastly, we compare the eco-efficiency of the Netherlands with that of other member states.
2.1 CAFE Baseline and Dutch national scenarios
• The CAFE Baseline scenario affects the Dutch position in negotiations for a new European air
pollution policy because national expectations show a higher coal use and a higher proportion of diesel cars, thereby leading to higher abatement costs.
• The RAINS model itself appears to be intrinsically appropriate for calculating abatement
scenarios for the Netherlands
The CAFE Baseline scenario originally consisted of three different variants: (1) a European-wide scenario without climate policy; (2) a European-wide scenario with climate policy; (3) a national scenario submitted by a member state incorporated into the European-wide scenario with climate policy (Amann et al., 2005a). In the CAFE programme, the calculations and different policy runs have all been based on the European-wide scenario with climate policy. In this report the CAFE Baseline scenario refers to this scenario.
For the purposes of meeting both the criteria for international reporting and support of national policy, the Netherlands has constructed emission projections up to 2020 (Van Dril and Elzenga, 2005) based on two economic scenarios ‘Global Economy’ (GE) and ‘Strong Europe’. The activities and resulting emissions based on these projections are compared to those of the CAFE Baseline scenario and are presented in Tables 2.1 and 2.2, respectively.
Global Economy is the scenario which assumes international cooperation (free market), private responsibility, a minimum of governmental interference, a gross domestic product (GDP) growth of 2.8% per annum and a population growth of 0.6% per annum. The Netherlands has submitted the GE as the national scenario to advance and incorporate specific Dutch future developments in the NEC review. Strong Europe is the scenario which assumes international cooperation (for institutions), public responsibility, and active government participation, a GDP growth of 1.7% per annum and a population growth of 0.5% per annum. For both scenarios, the same climate measures are assumed, with a price of 11/tonne CO2, and current legislation is assumed to be pursued until 2020 (i.e. exclusion of autonomous tightening of standards).
The GE scenario assumes a higher GDP growth rate than the CAFE Baseline, whereas the SE Scenario assumes a lower GDP growth rate than the CAFE Baseline. In the GE Scenario, energy use is higher than in both the CAFE Baseline and the SE Scenario. Compared to the CAFE Baseline scenario price of 20/tonne CO2, both the GE and SE scenarios assume the lower price of 11/tonne (Table 2.1).
Table 2.1 Activities of the CAFE Baseline scenario versus the Dutch national scenarios Strong Europe (SE) and Global Economy (GE) for 2020. Sources: EC (2003) and Van Dril and Elzenga (2005).
2020 CAFE SE GE
Population (in millions) 17.4 17.6 17.9
GDP growth (%) 2.3 1.7 2.8
Energy use (PJ) 3440 3500 3780
CO2 price ( /t) 20 11 11
Table 2.2. Activities of the CAFE Baseline versus the Dutch National Scenarios SE and GE for 2020. Sources: EC (2003) and Van Dril and Elzenga (2005).
Coal use in power plants (PJ)
2000 2010 2020
CAFE 214 59 25
GE 212 245 320
SE 212 245 160
Diesel use in passenger cars and for light-duty purposes (PJ)
CAFE 87.5 96.1 97.3 GE 112.6 146.4 191 SE 112.6 146.4 191 Dairy cows (x1000) CAFE 1504 1363 1333 GE 1504 1395 1725 SE 1504 1395 1461 Other cattle (x1000) CAFE 2566 2466 2198 GE 2566 2110 1791 SE 2566 2062 2005
The main difference between the CAFE Baseline and the two national scenarios for sulphur dioxide (SO2) is due to the lower use of coal assumed in the CAFE Baseline (Tables 2.2 and 2.3), which in turn results in lower power plant emissions. In 2020, this causes higher emissions in the national scenarios (9 SE and 20 kt GE). The lower emissions for NOx in the CAFE Baseline result primarily from a lower proportion of diesel vehicles (17 kt in 2020) and an underestimation of emission factors from gas engines in the agricultural sector (10 kt in 2010). For total ammonia (NH3) emissions, the GE and the CAFE Baseline scenarios show a good match. However, for the sector-level emissions from other cattle, the CAFE Baseline projections are higher, whereas in that for dairy cattle, the GE Scenario projections are higher due to higher animal numbers (Tables 2.2 and 2.3). The projection of animal numbers in 2020 is lower in the SE scenario than in the CAFE Baseline and, consequently, the emissions of ammonia are lower in the former (Table 2.3). For non-methane volatile organic compounds (NMVOC) emissions, the main difference between the scenarios originates from differences in the implementation of policy measures (Jimmink et al., 2004). The projected emissions of particulates (PM10) shows a good match between the CAFE Baseline and GE scenarios, although a lower estimation of diesel cars in the former results in a lower projection of particulate emissions for road transport in 2020 (2 kt) compared to the GE and SE scenarios (Jimmink et al., 2004). Fewer animals and a lower activity at transfer points of goods lead to lower total emissions in the SE scenario.
Table 2.3. Projected Emissions of the CAFE Baseline versus the Dutch National Scenarios GE and SE and MTFR (Maximum Technical Teasible Reductions) for 2000, 2010 and 2020. Sources: Van Dril and Elzenga (2005); RAINSWEB (2005) and MNP (2005).
Emission (kilotonnes) 2000 2010 2020
Component Sector CAFE SE GE CAFE SE GE MTFR
SO2 Industry, Energy and Refineries 63 40 60 60 45 57 73 36 Consumers, Services, Trade and
Commercial 2 1 2 2 1 2 2 1
Transport 9 17 4 4 18 5 5 4
Total 75 59 66 66 64 64 80 41
NOx Industry, Energy and Refineries 100 62 73 75 62 77 84 27 Consumers, Services, Trade and
Commercial 46 22 25 28 19 18 21 19
Transport 268 198 185 185 159 167 167 120
Total 414 282 284 288 240 262 272 166
NMVOC Industry, Energy and Refineries 90 55 59 60 110 65 68 75 Consumers, Services, Trade and
Commercial 69 119 59 61 60 63 71 40
Transport 111 35 55 55 32 43 43 29
Total 269 210 173 176 202 171 182 144
NH3 Agriculture 139 131 109 111 126 103 130 87
Industry, Energy and Refineries 3 3 4 4 3 5 5 4
Consumers, Services, Trade and
Commercial 8 9 8 8 9 8 8 9
Transport 3 2 3 3 1 3 3 1
Total 152 144 124 126 139 119 147 101
PM10 Industry, Energy and Refineries 13 11 11 12 12 12 14 8 Consumers, Services, Trade and
Commercial 8 10 8 9 10 8 10 7
Transport 17 15 13 13 13 13 13 8
Agriculture 10 13 9 10 13 7 11 9
Total 49 50 42 44 48 41 47 32
PM2,5a Industry, Energy and Refineries 7 7 6 6 7 6 7 5
Consumers, Services, Trade and
Commercial 4 7 4 4 6 4 5 4
Transport 15 12 11 11 9 10 10 8
Agriculture 2 3 2 2 3 1 2 2
Total 28 27 22 23 26 21 23 19
aPM
2.5 emissions have been derived from PM10 emissions as an emission inventory for PM2.5 is not
available
The CAFE Baseline scenario differs from the GE and SE scenarios by its assumptions of a higher use of coal, lower proportion of diesel cars and number of animals (fewer dairy cattle and more other cattle). These differences are responsible for the main differences in emission (Table 2.3). Other Member States also report a higher use of coal than the CAFE Baseline (Eurelectric, 2005). Other differences in emissions are caused by differences in emission factors, use of control technologies and the definitions of activities. The higher fishery emissions for SO2 (about 20%) and NOx (about 9%) in 2010 and 2020 are caused by RAINS assuming the use of a heavy fuel instead of medium distillates for fishery ships (Jimmink et al., 2004). The level of implementation of control measures in RAINS in general reflects current Dutch policy, but not with respect to non-methane volatile organic compounds (NMVOC). RAINS seems to beappropriate for calculating abatement scenarios. (Jimmink et al., 2004).
The differences between RAINS calculations and national assessments may lead to the diffrent application of abatement measures (see Section 2.2) and result in other abatement emission levels.
This is especially true for the low coal use projection, which conceals abatement problems and costs for SO2 when compared with national expectations on coal-fired plants. Since the calculation of abatement levels at the lowest costs is dependent on the activity level and the level of control, a good reflection of Dutch policy and scenario assumptions is necessary. For this reason, the Netherlands has submitted the GE scenario as the national scenario for presenting future developments specific to the Netherlands. Moreover the European Commission will also review the CAFE Baseline for the NEC review.
The Netherlands cannot attain the national emission ceilings for SO2 and NOx in 2010 under current policy. For ammonia and NMVOC, the ceiling will be attained unless new insights show higher ammonia emissions for manure applications and higher NMVOC emissions from the road transport sector (Van Dril and Elzenga, 2005). In the national scenarios, the projected emissions stabilize or increase from 2010 to 2020 for all components but NOx. Consequently, in 2020 compliance with the 2010 agreements is still not achieved (Table 2.3).
2.2 Thematic strategy, measures and costs
• To achieve the objectives of the thematic strategy, SO2 emissions in the Netherlands should be
reduced by about 50% between 2000 and 2020, NOx emissions by 45%, NMVOC emissions by
40%, NH3 by 30% and PM2.5 emissions by 40%.
• Applying the ambition level for source policy in the thematic strategy, the total abatement costs
increase by 10% with respect to current policy for the Netherlands in 2020.
• Additional costs for the Netherlands amount to about 330 million annually by 2020. Costs of the
measures are paid for by the agricultural and industrial sector (both 115 million) traffic pays 25% ( 90 million) and the residential sector 5% ( 10 million).
• The gap closure approach is the most cost-efficient one for PM2.5 abatement in the Netherlands
since other countries contribute to the reduction of transboundary air pollution in the Netherlands.
• Total cost of the strategy for the Netherlands should be regarded as a lower limit. The magnitude
of the cost of the abatement measures reported by the EU is approximately in line with national figures, with the exception of the costs for NMVOC. Next differences between national and EU scenario data may lead to higher abatement cost for SO2 and NOx..
• Almost all of the technical measures the Netherlands is assumed to take are cost-effective. The CAFE Baseline scenario has been used to derive policy scenarios from. Consequently, these derived policy scenarios incorporate the same differences and problems as described in Section 2.1. For SO2 and NOx the levels for current policy are lower in CAFE than the national scenarios. The levels in the CAFE Baseline already require policy efforts with respect to the national scenarios. On the other hand for NMVOC the emission levels are higher than in the national scenarios.
In the CAFE Baseline, a great deal of international legislation is assumed, such as the Large Combustion Plants directive, the Product and Solvent Directives, IPPC legislation and the Auto/Oil EURO emission standards. For the ambition levels, additional legislation is assumed. All measures are generic ‘end-of-pipe’ techniques. For road traffic only one ambition level has been assumed instead of different levels for different costs (see also Section 6.3). Although highly cost-effective, additional measures on sea transport have been left out of the policy scenarios because of time limitations (Amann, 2005e). No volumetric measures or local measures are (yet) applicable within the
model context of RAINS. Furthermore, the link between possible techniques and the development of supporting European legislation is missing.
Environmental target setting
In the CAFE Baseline scenario, three different approaches to setting environmental targets have been explored, and RAINS has been utilized to calculate different environmental targets for the least cost within the framework of these different preconditions. The three different approaches are:
1. European-wide targets 2. Uniform limit values 3. Gap closure
In the European-wide approach, an environmental target is chosen. This may be a reduction in environmental effects averaged over the EU-25 (for example, a percentage reduction of mortality from chronic exposure to particulate matter in the EU-25). This target is achieved European-wide by identifying those measures in the EU-25 that reach the environmental target for the least costs. The location at which the environmental improvement is achieved is thus not taken into account, and the optimization measures will be implemented for those regions for which the benefits will be the largest for all of the member states. While this approach maximizes the use of resources, it may compromise on (perceived) equity aspects, because environmental improvement is not equally distributed.
In the uniform limit value approach, a limit value for PM2.5 has been chosen that may not be exceeded in the background anywhere in the EU25. This is achieved by applying cost-effective reductions that bring PM2.5 concentrations in urban background air sheds below a certain limit everywhere in the EU-25. The RAINS model has included City-Delta modelling results to address PM2.5 levels in an urban setting. This approach has been set to reflect roughly the setting of a limit value. However, RAINS is not capable of calculating concentrations in street canyons or around industrial hot spots and is thus not capable of calculating costs for setting limit values (Amann et al., 2005c). Furthermore, the EMEP model, on which the RAINS model rests its calculations of particulate matter dispersion, does not quantify contributions from natural resources and from secondary organic aerosols.
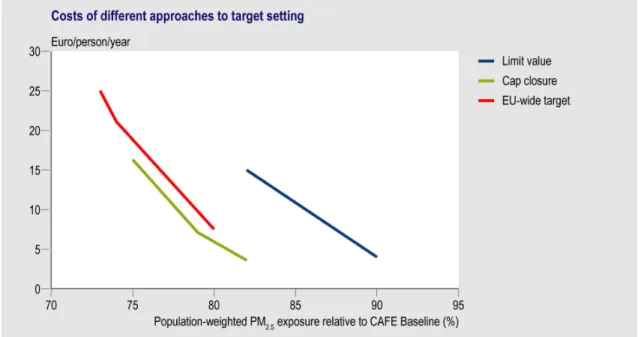
Figure 2.1 Costs for the three different approaches used in CAFE to abate PM2.5 exposure in the
The gap closure approach applies a uniform relative environmental improvement in every grid cell of RAINS in 2020 with respect to 2000. However, the uniform relative improvement in the gap between the current situation and environmental goals in 2020 is limited due to a few locations in the EU with typical situations. For example, the uniform gap closure is limited due to a large contribution from non-EU sources in Cyprus and the already relative clean air in Finland. In CAFE, the choice is made for a source-based ‘gap closure’ concept, which divides the scope for further improvement between the projected ‘current legislation’ case of the Baseline and the full application of all presently available control measures. In the source-based gap closure, a percentage of the maximum technical feasible reduction is applied for every member state.
On a European-wide scale, the different approaches do not differ greatly in cost and benefits (Amann et al., 2005d). However, on a national level, the approaches do differ. For the Netherlands, the limit value approach is an expensive approach and encompasses costs that are more than threefold higher for the same improvement with respect to exposure to PM2.5 as the gap closure or an EU-wide approach (Figure 2.1). Since the Netherlands is in an area with the highest PM2.5 concentration, the limit value approach leads to expensive measures for PM2.5 concentration reduction. If a source-based gap closure approach is applied, all countries will reduce their emissions. This approach is the most favourable one for the Netherlands since all countries must participate in efforts leading to
comparable measurements (the level playing field concept) and a lowering of the transboundary pollution in the Netherlands. Thus, other countries pay for reducing air pollution in the Netherlands, and vice versa (see Section 3.1.9). This approach is comparable to or slightly little more cost-effective than an EU-wide target approach (Figure 2.1).
Finally, an extensive analysis was carried out to determine the costs and the benefits of different levels of ambition for additional health and environmental protection. As mentioned earlier, these policy runs were based on a percentage improvement that lie between the baseline and the maximum technical feasible reduction for all countries (‘country-wide source-based gap closure’).
EU-wide objectives
The European Commission has ultimately chosen for a specific ambition level, which it sets out in its thematic strategy, a set of health and environmental objectives and emission reduction targets to be attained by 2020 (EU, 2005a).
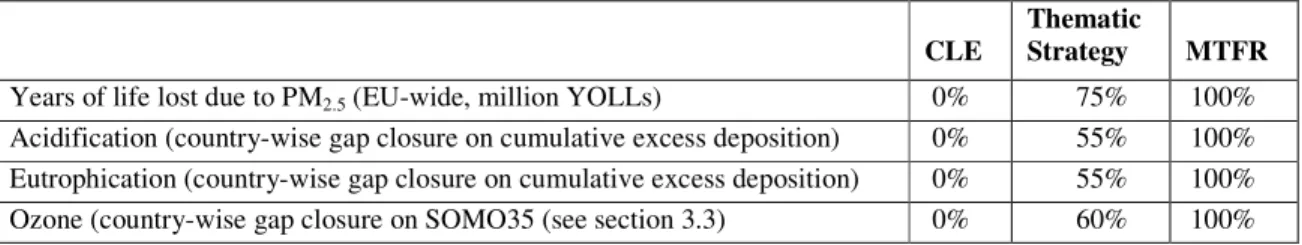
The environmental objectives imply that the years of life lost due to PM2.5 (concentration of PM2.5) will be reduced by 75% and the health impacts attributable to ozone (concentration of ground level ozone) will be reduced by 60% of that which is technically feasible by 2020. In addition, the threat to the natural environment from both acidification and eutrophication will be reduced by 55% from what is technically possible by 2020.
The thematic strategy also sets EU-wide targets for reducing emissions between 2000 and 2020. SO2 emissions will need to decrease by 82%, NOx emissions by 60%, NMVOC emissions by 51%, NH3 emissions by 27% and fine particulate matter PM2.5 emissions by 59%.
Table 2.4. Environmental targets defined as a percentage improvement of that which is technically possible by 2020: current legislation (CLE) and MTFR are equal to. 0% and 100% improvement, respectively. Source:Amann et al. ( 2005e).
CLE Thematic Strategy MTFR
Years of life lost due to PM2.5 (EU-wide, million YOLLs) 0% 75% 100% Acidification (country-wise gap closure on cumulative excess deposition) 0% 55% 100% Eutrophication (country-wise gap closure on cumulative excess deposition) 0% 55% 100% Ozone (country-wise gap closure on SOMO35 (see section 3.3) 0% 60% 100%
Consequences for the Netherlands
The thematic strategy proposes to reduce air pollution in EU between 2000 and 2020 with 82% for sulphur dioxide (SO2), nitrogen oxides by 60% (NOx), volatile organic compounds by 51%
(NMVOC), ammonia by 27% (NH3) and fine particulate matter (PM2.5) by 59% (EU, 2005a). For the Netherlands the proposal means a reduction of SO2 with about 40%, NOx by 50%, NMVOC by 40% (NMVOC), ammonia by 30% (NH3) and fine particulate matter (PM2.5) by 20% (Table 2.5). Part of this reduction will be realized with current EU and national policies for example, by further implementation of Large Combustion Plants directive, national NOx-emission trading system, the Product and Solvent Directives, IPPC legislation and the EURO emission standards for mobile sources (Table 2.5). In CAFE three ambition levels have been defined (A, B and C) to reduce air pollution in EU-25 (Amann et al., 2005e; Table 2.5). The objectives presented in the strategy are based on these ambition levels. The ambition level in the thematic strategy matches the A ambition level for SO2, the B ambition level for PM2.5 and NH3. The ambition level for NOx is in between the A and B ambition level for the Netherlands.
Table 2.5Emissions in 2000 and 2020 for current legislation (CLE) and according to the Thematic Strategy (TS) and the A, B and C ambition. Sources: Amann et al.(2005e and 2005f) for figures 2020 and MNP (2005) for figures 2000.
Emission (kt) 2000 2020
CLE TS A ambition B ambition C ambition
SO2 75 64 45 45 43 42
NOx 414 240 201 219 193 191
NMVOC 269 202 161 161 153 153
NH3 152 139 105 110 104 103
PM2.5 28 26 22 23 22 22
Costs of current emission control policies in the Netherlands are estimated at about 3300 million annually by 2020 for the Netherlands (Amann et al., 2005e), while additional costs have been estimated to be about 330 million annually by 2020 for the Netherlands. These additional costs represent a 10% increase over the costs of current policies.
Extra costs of the thematic strategy are borne by the agricultural and by the industrial sector (both 35% and 115 million), by the transportation sector (25%, 90 million), and by consumers (5%, 10 million).
Table 2.6 Control costs for current legislation (CLE) and additional costs for further emission reduction according to the Thematic Strategy (TS) and MTFR for the year 2020 for the Netherlands. Sources: RAINSWEB (2005) and Amann et al. (2005e and 2005f).
Costs (M /yr) CLE Costs (M /yr) additional to CLE
TS MTFRa SO2 360 20 62 NOx 285 82 714 NMVOC 42 10 415 NH3 589 126 344 PM2.5 118 8 363
Stationary sources sum 1394 246 1844
Traffic 1947 82 82
Total 3340 328 1926
a Costs for MTFR match with figures in table 2.3 and are also based on RAINSWEB ( 2005). In
Technical measures to reduce air pollution in the Netherlands
The calculated reductions and cost involved for the Netherlands are based on technical measures for different components (Table 2.7). The RAINS model has calculated the most cost-effective measures in the Netherlands to achieve the targets as set by the European Commission (Table 2.4). According to National Emission Regulations (NeR) measure are cost-effective if they cost about 5 euro per kg or less. Cost and measures in RAINS as presented here will be checked in greater detail in October 2005 during the bilateral consultation with IIASA.
For SO2, the most important cost-effective measures in the Netherlands to achieve thematic strategy ambition level by 2020 are further modifications in the refinery processes (7.5 kt). The
cost-effectiveness of SO2 measures is in line with Beck et al. (2004). All measures are cost-effective (Table 2.7). The cheapest and most important emission reductions according to RAINS is a switch to low sulphur fuels in sea fishery shipping (10.7 Kt, Table 2.7). However the figure of 10.7 kt is out of date; fishery ships already use low sulphur fuels in the Netherlands (Jimmink et al., 2004).
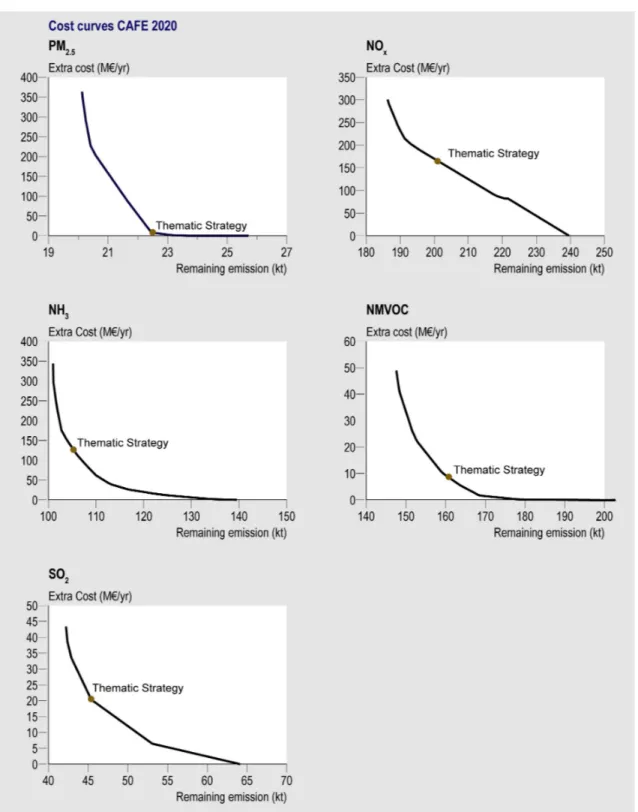
For NOx, new EU emission standards for road traffic is an important measure for the Netherlands to achieve thematic strategy ambition level by 2020 according to RAINS (18 kt). Further technical measures to reduce emissions in industry, the energy sector and refineries (such as combustion modification and selective catalytic reduction techniques) are also important (about 21 kt). The magnitude of the cost-effectiveness is approximately in line with Beck et al. (2004) and all measures are cost-effective (Table 2.7). The cost of transport measures amount to about 5/kg NOx (with important side effects on PM2.5); for industry the cost is about 5/kg NOx. Road traffic measures reduce NOx as well as PM2.5, however, only costs for NOx are considered in the cost curve NOx (Figure 2.2.)
For fine particulate matter PM2.5, thematic strategy ambition level may be achieved with new emission standards for road traffic (1.1 kt), highly efficient dedusting techniques in industry (1.0 kt) and various measures for households (1.2 kt, non-catalytic insertions in fireplaces and new stoves, ban on waste burning, filters in kitchens). Most measures are cost-effective with the exception of non-catalytic insert in fireplaces (Table 2.7). However, given the possible effect of primary particulates on health, the measures will be still be effective (see Chapters 4 and 6). The cost of these measures increases till about 10/kg (Figure 2.2).
Since agriculture is the major emitter of NH3, almost all NH3 measures apply to this sector. The most important of these are low ammonia emission applications of manure, the adaptation of animal housing (low emission stables) and low nitrogen-contained feed. In the Netherlands meanwhile extra measures have been taken for low ammonia emission application of manure with a potential of about 5-6 kt. The potential in RAINS (22 kt) for low ammonia emission applications of manure is rather high. This will be checked in greater detail in October 2005 during the bilateral consultation with IIASA.The cost-effectiveness for NH3 measures is in line with Beck et al. (2004). Most measures are cost-effective, with the exception of the measures for fertilizer production and low nitrogen feed and stable adaptations for cows and pigs (table 2.7). The cost of these measures increases up to about
14/kg (Figure 2.2).
Most measures for NMVOC reduction involve good housekeeping measures and process adaptations in industry (Table 2.7). The measures presented in RAINS are relatively cheap and cost-effective, with only the use of solvent-improved paint being relatively expensive. However, compared with the cost-effectiveness measures presented in Beck et al. (2004), the cost projected in RAINS is lower by a factor of 10. This will be checked in greater detail in October 2005 during the bilateral consultation with IIASA.
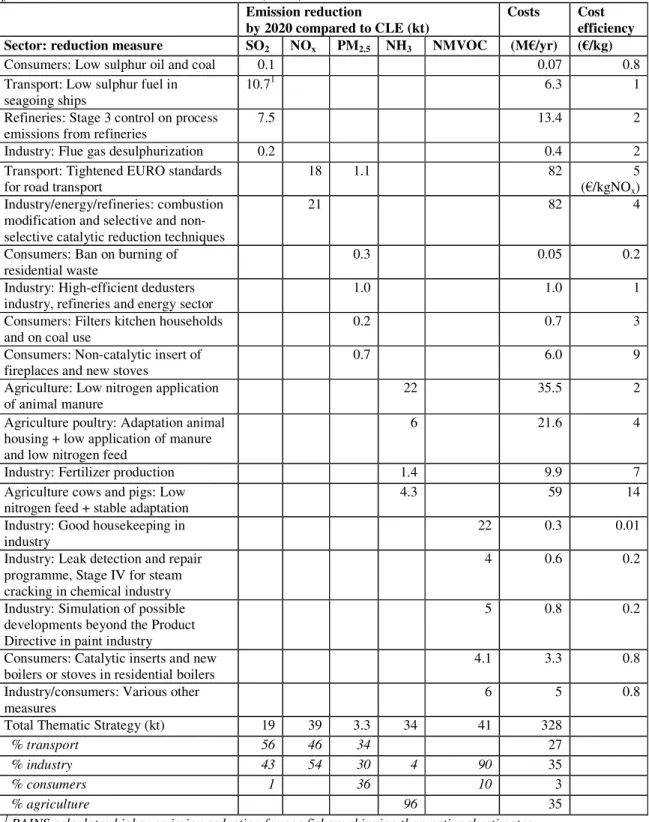
Table 2.7 Cost-effective measures according to RAINS for realizing the thematic strategy objectives for the Netherlands. Source: RAINSWEB (2005).
Emission reduction
by 2020 compared to CLE (kt) Costs Cost efficiency
Sector: reduction measure SO2 NOx PM2.5 NH3 NMVOC (M /yr) ( /kg)
Consumers: Low sulphur oil and coal 0.1 0.07 0.8
Transport: Low sulphur fuel in
seagoing ships 10.7
1 6.3 1
Refineries: Stage 3 control on process
emissions from refineries 7.5 13.4 2
Industry: Flue gas desulphurization 0.2 0.4 2
Transport: Tightened EURO standards
for road transport 18 1.1 82 ( /kgNOx5 )
Industry/energy/refineries: combustion modification and selective and non-selective catalytic reduction techniques
21 82 4
Consumers: Ban on burning of
residential waste 0.3 0.05 0.2
Industry: High-efficient dedusters
industry, refineries and energy sector 1.0 1.0 1
Consumers: Filters kitchen households
and on coal use 0.2 0.7 3
Consumers: Non-catalytic insert of
fireplaces and new stoves 0.7 6.0 9
Agriculture: Low nitrogen application
of animal manure 22 35.5 2
Agriculture poultry: Adaptation animal housing + low application of manure and low nitrogen feed
6 21.6 4
Industry: Fertilizer production 1.4 9.9 7
Agriculture cows and pigs: Low
nitrogen feed + stable adaptation 4.3 59 14
Industry: Good housekeeping in
industry 22 0.3 0.01
Industry: Leak detection and repair programme, Stage IV for steam cracking in chemical industry
4 0.6 0.2
Industry: Simulation of possible developments beyond the Product Directive in paint industry
5 0.8 0.2
Consumers: Catalytic inserts and new
boilers or stoves in residential boilers 4.1 3.3 0.8
Industry/consumers: Various other
measures 6 5 0.8
Total Thematic Strategy (kt) 19 39 3.3 34 41 328
% transport 56 46 34 27
% industry 43 54 30 4 90 35
% consumers 1 36 10 3
% agriculture 96 35
1 RAINS calculates higher emission reduction for sea fishery shipping than national estimates
The magnitude of the cost of the abatement measures reported by the EU is approximately in line with national figures, with the exception of the costs for NMVOC. Next to this the cost for abatement for SO2 and NOx are probably higher because of differences between the CAFE Baseline and national scenarios (see section 5.2). The total cost should therefore be regarded as a lower limit. The total costs based on national data are probably higher than calculated by RAINS.
Figure 2.2 Cost curves for PM2.5, SO2, NOx, NMVOC and NH3 in RAINS for the CAFE Baseline in
2020 for the Netherlands. The formulated ambition level of the thematic strategy is indicated in the cost curves. The cost for mobile sources are all assigned to NOx which is visible as a twist in the
2.3 Uncertainties in Dutch projections
• There is an uncertainty of about 20% in the emission projections for 2010; these uncertainties
will be larger in 2020.
• The uncertainty for particulate matter is unknown since the emission inventory is incomplete Uncertainties for the Dutch national scenarios have only been calculated for 2010. However, in 2020, the uncertainties in emission projections for the SE and GE scenario are at least as large as those for 2010. In 2010, the uncertainties amount to about 20% of the total emissions (Table 2.8).
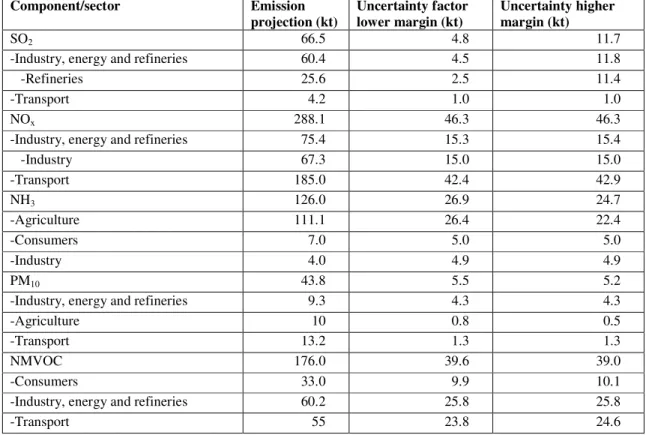
Table 2.8 Emission projection in 2010 with lower and higher uncertainties deviations in the 2010 GE emission projections for the Netherlands.
Component/sector Emission
projection (kt) Uncertainty factor lower margin (kt) Uncertainty higher margin (kt)
SO2 66.5 4.8 11.7
-Industry, energy and refineries 60.4 4.5 11.8
-Refineries 25.6 2.5 11.4
-Transport 4.2 1.0 1.0
NOx 288.1 46.3 46.3
-Industry, energy and refineries 75.4 15.3 15.4
-Industry 67.3 15.0 15.0 -Transport 185.0 42.4 42.9 NH3 126.0 26.9 24.7 -Agriculture 111.1 26.4 22.4 -Consumers 7.0 5.0 5.0 -Industry 4.0 4.9 4.9 PM10 43.8 5.5 5.2
-Industry, energy and refineries 9.3 4.3 4.3
-Agriculture 10 0.8 0.5
-Transport 13.2 1.3 1.3
NMVOC 176.0 39.6 39.0
-Consumers 33.0 9.9 10.1
-Industry, energy and refineries 60.2 25.8 25.8
-Transport 55 23.8 24.6
For SO2, the main uncertainties arise from refineries and power plants as the amount of fuel that will be used is uncertain. In the projections, it is assumed that a substantial reduction will be achieved because Shell has stated that its refineries will switch from oil to gas firing. However, there is a slim chance that this switch will not be made, which is the reason for the upper margin being larger than the lower one.
The main uncertainties for NOx emissions result from the uncertainties surrounding emission factors in the transport sector. Test results are still not representative of real life situations. In the transport sector, the combustion temperature is very influential in determining the amount of NOx emitted as are driving behaviours and the types of engines used. Because of the unpredictability of these factors, they cause large uncertainties. An additional considerable uncertainty for NOx emissions arises from combustion emission factors in industry and power plants and the total amount of energy used.
The main uncertain factor for future NH3 emissions, apart from an uncertainty in monitoring, is uncertainty concerning the efficiency of reducing NH3 emission during the application of nitrogen onto grassland. The emission from low-emission machinery is very uncertain and is probably higher than previously assumed. Another uncertainty factor is the extent to which this technique will be applied to sandy soils. Finally, it also remains uncertain how the ratio of nitrogen excretion per animal will develop in the future.
For particulate matter emissions, only uncertainties for the known sources have been given. However, the emission projection is incomplete. Unknown sources that will determine the uncertainty in particulate emissions are missing from the projections for total emissions. Consequently, no estimate can be given for the uncertainty of the particulate emissions.
Uncertainties for NMVOC emissions are the highest in industry, energy and refineries and in transport. It was not possible to determine whether these uncertainties are mostly statistical monitoring uncertainties or scenario uncertainties.
No uncertainties (quantitative or qualitative) are presented for the CAFE Baseline scenario. However, given the results in Section 2.2, these seem to be at least larger than the uncertainties presented for the national scenarios.
2.4 Benchmarks
• The Netherlands has one of the highest environmental pressures in the EU, but it also has one of
the most eco-efficient economies of the EU.
• Comprehensive knowledge of particulate emission is currently lacking; moreover, data on
particulate emission in RAINS seems to lack country-specific information.
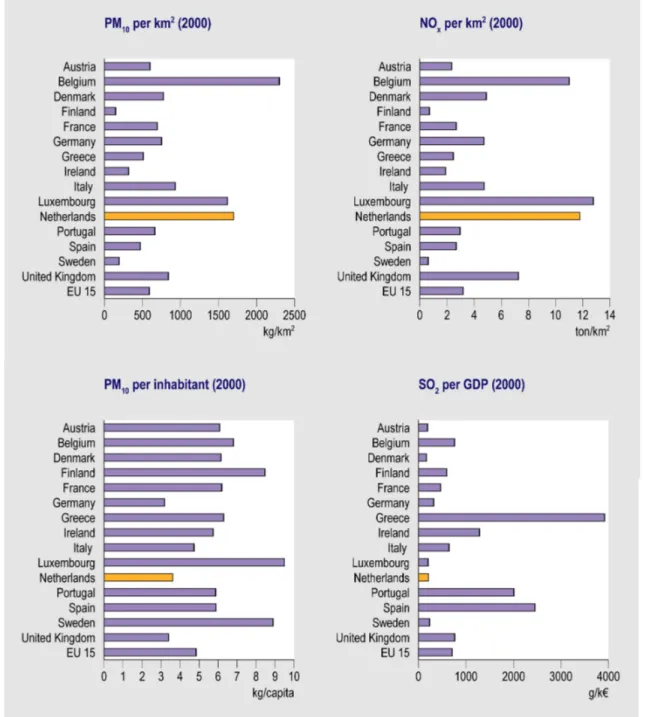
Compared to other Member States, the Netherlands is relatively densely populated and built up; it also has a lot of cattle. As a result, the Netherlands has a high emission of air pollutants per unit of surface area. This emission level is similar to those found in other densely populated areas in Europe, such as the Ruhr area in Germany, Northern Italy or London. However, when the emissions of many of these air pollutants are expressed per unit GDP or per number of inhabitants, the emission level in the Netherlands is relatively low compared with those of other Member States (Figure 2.4).
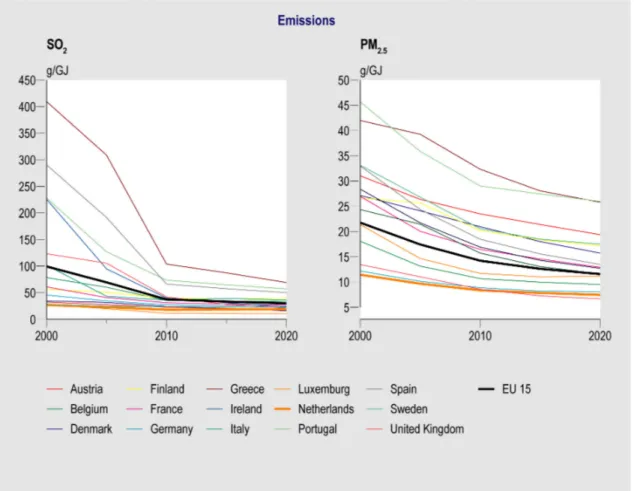
In the year 2000, emission factors for the Netherlands were lower than those in (almost) all of the other EU15 countries (Figure 2.3 and MNP (2005)). In the period 2000 to 2020, the decrease in emission factors for these other 14 countries is greater than in The Netherlands. An explanation for the difference in eco-efficiency is that the switch to natural gas had almost been completed by 2000 in the Netherlands, whereas in the other 14 Member States this transition proceeded at a later date. In addition to this, the Netherlands has applied more end-of-pipe technology than most of the other Member States. However, under current policy, other countries are catching up with the Netherlands.
Figure 2.3 Emission of SO2 and PM2.5 in the EU15 per unit of energy use for 2000-2020 in the CAFE
Figure 2.4 Emission levels per unit surface area GDP and per inhabitant for SO2, PM10 and NOx for
2000 for EU-15 countries. Source: RAINSWEB (2005).
PM2.5 data in RAINS
In the EU25, the main contribution (40%) to total PM2.5 emission comes from the domestic sector (stoves, fireplaces, barbeques, firework, smoking, space heating), with industrial processes and transport contributing approximately an additional 20%. Other sectors (power plants, waste burning, and agriculture) contribute 6%, 5%, and 3%, respectively (Table 2.9).
For stationary sources of PM2.5 emissions, it is noticeable that the implied emission factor (2000) is equal in all countries except for Austria, Germany and the Netherlands; for example, stoves
(RAINSWEB, 2005). The unabated emission factor is also the same for all countries (651 t/PJ), with the exception of Germany and Austria (67 and 149 t/PJ, respectively). For other components, such as
NOx, the emission factors differ between each of the member states, but the absolute difference is less, as expected.
It is also remarkable that the emission factors in 2020 for residential and commercial fireplaces are exactly the same as in 2000. This is most likely due to the fact that there is currently no legislation for these sources. Germany has by far the lowest emission factor (77 versus 698) for uncontrolled fireplaces. For mobile sources, the emission factors are country- and time-specific, (partly) due to the use of a transport model in the context of RAINS that generates country-specific data.
Current knowledge on the emission of particulate matter in Europe is limited and, as a result, uncertainties are large (EEA, 2003). This is consequently reflected in the RAINS database. An additional factor is that many countries have not (yet) incorporated their specific emission factors into RAINS.
Table 2.9 Contribution of different sources to total PM2.5 emission in the EU and in the Netherlands
Source: Amann et al. (2005a).
Sector Contribution to total emission in 2020 (%)
EU-25 The Netherlands
Domestic 43 23 Industrial processes 20 24 Transport 20 37 Power plants 6 0 Waste burning 4 2 Agriculture 3 9