0
GLOBAL CHANGE
Dutch National Research Programme on Global Air
Pollution and Climate Change
Ozone layer
-climate change interactions
Influence on UV levels and UV related effects
Report no 41 0 200 112 (2002)
ISBN 90 5851 079 4
G. Kellkens1, A. Bregman2, F. R. de GruijI3, J. C. van der Leun4, A. Piquet5, T. van Oijen5,
w.w.c.
Gieskes5, H. van Loveren6, G.J.M. Velders7, P. Martens8, H. Slaperl*TIVm
National Institute
for Public Health and the Environment
1 National Institute of Public Health and the Environment (RIVM), Laboratory for Radiation Research, RO. Box 1,
NL-3720 BA Bilthoven, The Netherlands; *(correspondence to dr. H. Slaper, projectcoördinator) 2 Atmospheric Composition Division, Royal Netherlands Meteorological Institute (KNMI), de Bitt 3 Departement of Dermatology, Leiden University Medial Center
4 Ecofys, Utrecht, The Netherlands
5 Department of Marine Biology, University of Groningen
6 National Institute of Public Health and the Environment (RIVM), Laboratory for Pathology and Immunobiology 7 National Institute of Public Health and the Environment (RIVM), Air Research Laboratory
8 International Centre for Integrative Studies, Maastricht University
This project was carried out in the framework of the Dutch National Research Programme on Global Air Pollution and Climate Change, registered under no. 950303, entitled: “OCCUR” (Ozone and Climate Change interaction effects for Ultraviolet radiation and Risks).
i••
:
•
•
Nationaal Onderzoek Programma Mondiale Luchtverontreiniging en Klimaatverandering (NOP)
Het Nationaal Onderzoek Programma Mondiale Luchtverontreiniging en Klimaatverandering (NOP) bevindt zich thans in de twee fase (1995-2001). De eerste fase, waarin 150 projecten zijn uitgevoerd, liep van 1990 tot 1995. Naar verwachting zullen in de tweede fase uiteindelijk circa 80 projecten worden uitgevoerd. Gezien de aard van het klimaatprobleem is een multi-disciplinaire benadering binnen het NOP noodzakelijk. Het programma is onderverdeeld in vier thema’s:
I Gedrag van het klimaatsysteem als geheel en in onderdelen
II Kwetsbaarheid van natuurlijke en maatschappelijke systemen voor klimaatverandering ifi Maatschappelijke oorzaken en oplossingen
Iv Integratie en assessment
Het primaire doel van hét NOP, als strategisch en lange termijn onderzoekprogramma, is te voorzien in de behoefte aan beleidsrelevante informatie voor de ontwikkeling van het nationale en intemationale klimaatbeleid. Naast het bereiken van dit inhoudelijke doel, wordt er ook veel belang
aan gehecht dat het onderzoek op de langere termijn verankerd zal blijven in de Nederlandse
onderzoeksstmctuur.
Door het NOP wordt twee maandelijks de (gratis) onderzoeksnieuwsbrief “CHANGE” uitgegeven. Voor meer informatie over het NOP kunt u zich richten tot:
Programmabureau NOP, Postbus 1 (pb 59), 3729 BA, Bilthoven Tel. : +3 1 30 2743211
Fax: +31302744436
e-mail: nopsecr@rivm.nl
http:I/ www.nop.nl
National Research Programme on Global Air Pollution and Climate Change (NRP)
The National Research Programme on Global Air Pollution and Climate Change (NRP) is currently
in its second phase, 1995-2001. The first phase, in which 150 projects were carried out, ran from 1990 to 1995. About 80 projects are expected to be finally realised in the second phase. The nature
of the climate problem warrants a multi-disciplinary approach within the NRP. The programme is categorised into four themes:
I Dynamics of the climate system and its component parts
II Vulnerability of natural and societal systems to climate change Ill Societal causes and solutions
IV Integration and assessment
The primary objective of the NRP as a strategic and long-term research programme is to meet the demand for policy-relevant information for the development of national and international climate policy. Besides realising this substantive objective, a great deal of importance is attached to the long-term anchoring of the research within the Dutch research structure.
The NRP Programme Office publishes a (free) research newsletter called “CHANGE” every two months. For more information on the NRP please contact:
Programme Office NRP, P.O. Box 1 (pb 59), 3729 BA, Bilthoven
Tel. : +3 1 30 2743211
Fax: +31 302744436
e-mail: nopsecr@nvm.nl http:// www.nop.nl
Contents
Contents 3
Abstract S
1. Introduction and outline ofthe report 7
2. Interaction between climate system and ozone layer 9
2.1 Introduction 9
2.2 Observations 9
2.3 Causes of mid-latitude ozone trends 1980-2000 10
2.3.1 Chemistry 10
2.3.2 Dynamical Processes 10
2.3.3 Thefutureozonelayer 11
2.4 Conclusions 13
3. UV-climatology and trends 17
4. Overview of UV induced effects 21
4.1 Skin cancer 21
4.2 Cataracts 22
4.3 Effects on the immune system 24
4.4 Effects on the marine environment 25
5. Integrated risk assessments 27
6. Conclusions 31
7. Future Research 33
References 35
Abbreviations 39
ppenaices 40
A.1 Skin cancers and ambient UV radiation 41
A.2 Lens opacities and cataract 57
A.3 The effects of UV radiation on the immune system and resistance to infections 67 A.4 Effects of increased UV irradiance on the marine environment: controversial results,
and perspectives 77
Abstract
Ozone in the atmosphere serves as a partially protective filter against the most harmful part of
the solar UV-spectrum. Decreases in ozone lead to increases in ambient UV with a wide
variety of adverse effects on human health, aquatic and terrestrial ecosystems and food chains. Human health effects include the incidence of skin cancer, cataracts and an impairment of the immune system.
Ozone depletion has been observed over the past decades, and is most likely caused by man made emissions of halocarbons. The ozone depletion observed over the past decades has probably led to a 5-10% increase in harmful UV-radiation in large parts of Europe. Due to the
long atmospheric life time of the ozone depleting substances the countermeasures agreed upon could at best be expected to lead to a slow recovery of the ozone layer in the next 50-60 years. However, in that best scenario it is assumed that no interaction occurs with
climatological changes, and that a full global compliance with the strictest Amendments of
the Montreal Protocol is obtained. Recent scientific evidence indicates that climate change
might delay the recovery of the ozone layer by 10 to 20 years. This report summarizes the present knowledge on the climate-ozone interaction, the past and present UV-climate in Europe and dose-effect relationships for health and aquatic effects. Using this information a preliminary integrated risk analysis is provided for skin cancer risks and effects on the primary production of phytoplankton. Skin cancer risks due to ozone depletion peaks in the period 2050-2070. The excess risks in North western Europe due to ozone depletion is estimated at 50-60 additional cases per million per year if no climate-ozone interaction is included, and nearly 100 additional cases per million per year if the interaction is included. It should be noted that large uncertainties still exist in view of the gaps in the present
1. Introduction and outline of the report
The stratospheric ozone layer effectively serves as a protective shield that reduces the harmful ultraviolet radiation (UV) reaching the earths surface. As a consequence, the depletion of stratospheric ozone observed over the last two decades, probably caused by emission of man-made halocarbons (CFCs), has probably led to higher ambient UV-levels.
An increase in UV at ground-level may induce a wide range of harmful effects like an
increase in skin cancer, cataracts, a decrease in bio-mass production and crop yields, and suppression of the human immune system [United Nations Environmental Program (UNEP),
19981. The Vienna Convention in 1985 was the starting point for international policy
agreements to reduce the production and emission of ozone depleting substances, and provided the framework for the restrictive protocols that were agreed upon later. The Montreal protocol in 1987 provided the first restrictive countermeasures and in view of the compelling evidence that ozone depletion occurred, this protocol was subsequently
strengthened in several more restrictive Amendments. In the latest Amendments the
production of the most potent ozone depleting substances is completely phased out in 1996.
A longer phase out period is allowed for the developing countries. These countermeasures are
expected to lead to a slow recovery of the ozone layer over the next century.
The effects of the agreed countermeasures in terms of a recovery of the ozone layer, the
(future) UV-radiation levels and their effect on the excess skin cancer risks associated with
ozone depletion were previously analysed for the USA and Europe [Slaper et al., 1996].
In line with other studies (UNEP, 199$) it was expected that a slow recovery of the ozone
layer will occur with a return to ‘normal’ (1980) levels around 2050. Excess skin cancer
risks, caused by ozone depletion, are in those scenarios expected to rise until 2050-2070.
Slaper et al [1996] clearly showed the potential success of the countermeasures in reducing
the future excess skin cancer risks associated with the chemical depletion of ozone.
A limitation of these analyses is that they assume ozone depletion to be purely chemically driven, and that no interaction with climate change is included in the analysis.
Growing insight in the radiative balance of the atmosphere and its disturbance by the
continued increased emission of greenhouse gases, indicates cooling of the stratosphere and a change in dynamical processes. These changes can have implications for the ozone levels on itself and furthermore they can interact with the chemical break down processes. Until recently, risk assessments did not account for this link between ozone layer morphology and dynamical processes initiated by climate change.
The major goal of this study is to give a quick scan of the possible interactions between the stratospheric ozone layer and climate change and to assess how this interaction may affect ambient UV-levels and health and environment. In the case of skin cancer a comprehensive risk assessment, including ozone-climate interaction, has been made.
Additionally this study gives an update of the present knowledge on UV related health and environmental effects, in particular: skin cancer, cataracts, effects on the immune system and effects on the marine environment.
The report consist of two parts: the main report summarising the general conclusions and knowledge on UV related health and environmental effects, and five appendices
for the reader who is interested in a concise overview of ozone-climate interaction, and the consequences for UV load and related effects on health and environment.
The appendices give an extensive overview of UV related effects and full detail on the risk assessment. It should be noted that this report reflects the outcome of a short integrative study, and as such should be seen as a preliminary assessment based on an integration of present knowledge.
This introduction is followed by a survey of recent knowledge on interactions between the climate system and the ozone layer (chapter 2). This chapter first overviews the
observational data and then focuses on the ozone depleting chemical and dynamical processes and their implications for the future development of the ozone layer. Chapter 3 gives a brief overview on the major factors determining the UV-climate and the changes in the UV
radiation levels in Europe that occurred over the past decades. Chapter 4 evaluates the present knowledge on UV related effects on human health and the environment. The main topics are: skin cancer, cataracts, immune modulation and effects on the marine environment. Chapter 5 is dedicated to an integrated risk assessment for skin cancer based on the survey presented in chapter 4 and appendix 1 and with inclusion of the interaction between the ozone layer and climate change described in chapter 2. Chapter 6 summarises the main conclusion of the report (and the appendices). Chapter 7 gives an overview of the future research needed to reinforce the scientific basis for these conclusions and to extend the scope of this report to other important UV related effects.
2.
Interaction between climate system and ozone layer
2.1 Introduction
Given the importance of chiorofluorocarbons (CFCs) for chemical ozone loss, one would expect the onset of ozone layer recovery to follow the decrease of CFCs that started at the end of the 1990s. However, severe chemical ozone loss was still observed in the most recent winters. Moreover, model studies suggested that the recovery could have a delay with even
10-15 years. The continued increase of greenhouse gases, such as C02, CH4, N20, and water
vapour is seen as the main cause for this delay. These gases disturb the radiative balance of the atmosphere with important consequences for temperature and dynamical processes. Only recently established temperature records yield convincing evidence of the existence of such a disturbance. The greenhouse gases not only affect the radiative balance, but also the chemical balance. The consequences of these effects for the ozone layer are just being explored. As
yet, many uncertainties still remain, both in the long-term dynamical variability as in the
complex chemical processes that both determine the global distribution of ozone and its long-term trend.
To predict the future ozone layer and the subsequent changes in UV-exposure it is clear that understanding of the interactions between changes in climate and the ozone layer over the past two decades is a prerequisite. This section summarises the most recent analysis of about 20 years of global ozone layer and meteorological data that form the basis of current
knowledge of ozone-climate interactions. In addition, a summary is given of prognostic calculations of the ozone layer using state-of-the-art two and three-dimensional chemistry-climate models. Finally, several poorly known processes will be discussed that may be crucial for future ozone layer recovery.
2.2
Observations
Ozone observation platforms include spectrometer techniques at ground-based stations and
on satellites and in-situ sampling on balloons. In addition, ground-based LIDAR observations
complement the network. The ground-based stations, including those with in-situ balloon-borne ozone profiling are located at various sites around the globe. The satellite data have a nearly global coverage. The majority of the ozone data contains only about 20-year records. At very sparse locations (for example Arosa) the records date back to the 1920’s.
Many studies have been carried out analysing these records. A recent analysis, including a compilation of ozone data from all available platforms, revealed significant negative trends outside the tropical region between 1979 and 1997 [Randel et al., 1999; Cunnold et aL, 20001. These trend studies discriminate between total ozone column data and vertical profiles. The profiles illustrate an altitude dependence of the trends. Two distinct minima for the negative trends are found, one in the lower part of the stratosphere between 10-22 km with a local minimum at 15 km of —7.4 ± 2.0%, and the other in the upper stratosphere above 35 km with
seasonal dependence with the largest trends occurring during winter and spring. We will focus on the lower stratosphere, where most of the ozone is located.
2.3
Causes
of mid-latitude ozone trends 1980
2000
2.3.1 Chemistry
After the recognition that man-made CFCs are responsible for large-scale ozone losses, it was believed that negative ozone trends were primarily due to chemical catalytic ozone
destruction. This view was mainly based on 2-D chemistry-transport modelling [Solomon et al., 1998]. More sophisticated 3-D modelling became available that shaded this view. It was shown that most of the ozone variations could be explained by dynamical processes
[Chipperfield et al., 1999]. Nevertheless, Chipperfield et al. [1999] calculated 2-3% decrease of the total ozone column at mid-latitudes between 1991-1998 due to chemical ozone loss during the polar winter/early spring. This finding was corroborated by a 3D Reverse Domain Filling study for several Arctic winters in the 1990s [Knudsen and Groos, 2000]. This study showed that in the 1990’s about 40% of the mid-latitude ozone reduction in spring is caused by chemical ozone destruction during the Arctic winter.
Additional global model studies indicated that not only the 2D [Portmann et al., 1999], but also the 3D global models underestimated the observed ozone trends [Austin et al., 2000]. Although it was shown that a 3D approach is required to describe the complex transport processes, one major problem is the computational costs. Increasing computational costs go on the expense of detail with which key processes are included. For example, to calculate chemical polar ozone loss heterogeneous chemical reactions on particles is essential, which none of the 3D model studies so far includes with the required detail. In fact, even the 2D models contain highly parameterised heterogeneous chemistry.
An important observational finding in this respect is the significant negative temperature trends in the lower stratosphere of —0.3 to —0.6 K per decade [Angell, 2000]. Heterogeneous chemistry is extremely temperature sensitive; lower temperatures means stronger ozone loss. The causes for the negative temperature trends in the lower stratosphere are not completely known. Several studies, however, have demonstrated that increasing greenhouse gases, including water vapour are primarily responsible for the cooling in the lower stratosphere
[Shindell et al., 2001; Forster and Shine, 1999]. A recent study illustrated that less UV absorption owing to the ozone decrease itself cannot fully explain these trends, al least in the northern hemisphere [Langematz, 2000; Zhou et al. [2000].
2.3.2 Dynamical Processes
By disturbing the radiative balance of the atmosphere, increasing greenhouse gases caused a change in dynamical processes [Shindell et al., 2001]. This directly influences the ozone layer. The strong link between dynamical processes and ozone layer morphology is known for a long time. For example, a trend is observed in the North Atlantic Oscillation (NAO) during winter and early spring during the past two decades [Appenzeller et a!., 2000]. This oscillation includes the low-pressure area close to Iceland and the high-pressure area at the Azores. This trend could explain part of the ozone trends at mid-latitudes, but only during winter [Appenzeller et a!., 2000].
Another meteorological analyses illustrated an increase in transport of ozone poor subtropical air into mid-latitudes over the last 25 years [Reid et al., 2000]. However, the analysis has only been carried out for a limited number of stations. A physical explanation for the decrease in ozone was first given by Steinbrecht et al. [1998]. Trends in the above mentioned transport
processes cause an increase of the tropopause altitude [Steinbrecht et al., 1998, 2001 ; De Forster and Tourpali, 20011. This further leads to a decrease in ozone. However, the studies do not show a consistent picture at different locations. Several locations do not show a difference in ozone column, despite the observed increase in tropopause altitude. In this respect it is important to note that most of this ozone decrease is limited to the lower part of the stratosphere, i.e., below the ozone maximum. This means that the changes in total ozone column are relatively small. Hence, the effect on UV absorption will also be limited.
These dynamic processes are somehow linked to each other and to an overall increase of the large-scale meridional circulation [Butchart and Scaife, 2001; Hood et al., 19991. It is not surprising that changes in the large-scale meridional circulation also cause changes in polar vortex dynamics. There is observational evidence that the Arctic vortex has strengthened over the last three decades [Hood et al., 19991. A stronger vortex persists longer into spring,
allowing more chemical ozone destruction. It is estimated that the polar vortex last about 4 weeks longer than 20 years ago [Zhou et al., 20001.
All together, the contribution of dynamic processes to the total ozone trends varies between
25-50%. However, note that most of the studies are restricted to the European winter and accurate estimates for all longitudes at northern midlatitudes and all seasons remain to be done. It is expected that the yearly and zonal average will be somewhat smaller. A summary of the trend studies can be found in the latest European Ozone Research Assessment Report
[EC, 2001]
2.3.3 The future ozone layer
The inability of models to simulate the recent ozone trends accurately prevents a reliable prediction of the ozone layer in the future. Nevertheless, attempts by several modelling groups will be summarised in this section.
Several 3D and 2D model studies predicted the ozone layer up to 2030-2060 [Shindell et al.,
1998; 1999; Austin et al., 2001, 2000; Bruehl, 2000; Dvortsov and Solomon, 2001]. Most
model results show that the ozone layer will be recovered around 2060, but some models predict that the recovery of the ozone layer is delayed with about 10-15 years. As mentioned earlier, it is assumed that increasing greenhouse gas abundances are primarily responsible. Given the complex interactions between dynamics and ozone, it is not surprising that the model results show significant differences. Shindell et al. report increased ozone loss during the Arctic winter until 2010-2020, while this is absent in the calculations of Austin et al. [2000]. In addition, in their latest calculations the delay is less pronounced than in Shindell et
al and the ozone changes fall within the inter-annual variability [Austin et al., 2001]. On the
other hand, Bruehl et al. show that there is an earlier building-up of the polar vortex and even
a southward movement of its location during the winter, near Europe in 2030. Dvortsov and
Solomon [2001] report a delay of the ozone recovery by chemical ozone loss owing to continued water vapour increase, which none of the models so far addressed. This chemical process affects mid-latitude ozone chemistry directly and requires no isolated cold polar vortex conditions.
The models that are used in all these studies differ significantly in resolution and in detail with which dynamics and chemistry are described. For example, Shindell et al. use a low-resolution model with highly parameterised chemistry, while Austin et al. [2001] and Bruehl
[2000] use higher resolutions and more sophisticated transport and chemistry schemes. Figure 2.1 summarises the future development of the ozone layer The shaded area gives the range in prognoses based on the publications mentioned above. As a comparison the
predictions for the year averaged ozone column, based on the RIVM risk assessment model AMOUR are included.
C E 0 0 a) C 0 N 0 0
F-Figure 2.1 Range in prognoses for the future development of the stratospheric ozone layer (hatched area) based on recent publications [$hindell et al., 1998;
1999; Austin et al., 2001, Austin et al., 2000; Dvortsov and Solomon, 2001]. The two drawn lines give the prognosis based on calculations with
RIVM AMOUR. In blue without ozone-climate interaction and in red with ozone-climate interaction (see appendix 5, figure 17).
From the results in figure 2. 1 we can conclude that the calculated past trend obtained from the global models appears somewhat lower, than the trend obtained with the AMOUR-model. The latter, however appears to be in better agreement with the observations (illustrated in the calculated UV-trends in appendix 5, figure 18). The observed differences may point to an underestimation of the (historical) ozone depletion by the global models. The difference may also arise from regional differences in ozone depletion. The global model calculations are based on zonal averages, but the AMOUR-profiles represent regional observations
representative for north west Europe (see figure 6, appendix 5).
A major uncertainty in all model calculations, however, is the crude representation of
heterogeneous chemistry, as mentioned earlier. A few studies report on the importance of ice particles and their effect on ozone loss if the future temperature decline in the stratosphere is continued. [Waibel et al., 1999; Tabazadeh et al., 2000]. Waibel et al. calculated sustaining fast ozone loss rates, even considering reduced chlorine abundance’s at 2070 levels.
However, a weakness is that these studies have only been performed with a boxmodel. Currently, no global chemistry-transport model has included a realistic ice particle sedimentation scheme, not even the most sophisticated 3D models.
It is clear that future changes in dynamical processes and continued cooling of the
stratosphere favours the conditions for strong chemical polar ozone loss. Most models predict some delay of the ozone recovery. However, it should be noted that the accuracy of the calculated transport processes is low, that the predicted temperature cooling shows large differences among the models, and that the chemical schemes representing polar ozone loss are too simple.
2.4
Conclusions
Figures 2.2 and 2.3 summarise the relative contribution of long-term mid-latitude trends in
key parameters discussed in this section to changes in total ozone column.
Table 2. 1 gives a brief explanation of the different variables.
During the past two decades the increasing chlorine loading and the development of strong isolated polar vortices, especially during the 1990s, were the major causes for the observed negative ozone trends. The world-wide moratorium on CFC emissions is expected to be the predominant cause of the recovery of the ozone layer. However, trends in other—climate
change driven-processes, with the largest contribution from the strength of the polar vortex
in combination with decreasing temperatures, will slow down the recovery speed. In figure 2.3 the assumed net recovery is shown in blue, which is approximately 70% in 2050 instead
of the expected 100% if climate change is neglected. This difference can be translated in
Table 2.1. Explanation of the processes in figures 2.2 and 2.3 , —— c_ c c .e c?C C •: I.4 I c-; Ii C C
Processes Description
CFCs, halons Catalytic ozone destruction in the x
stratosphere; decreased depletion is
anticipated due to lower emissions of CFCs,
halons, CC14, CH3CCI3, HCFCs.
N20 Chemical destruction of ozone by NOR-cycle; x X
anticipated increase in N20 emissions.
CH Formation of reservoir species HC1 decreases x x
ozone destruction.
T(gas chem) Temperature dependence of the Chapman x x
cycle; anticipated decrease in temperature in
the stratosphere.
Polar vortex Additional polar ozone loss by cooling and a x x x x
stronger vortex, combined with spread out of ozone depleted air into mid-latitudes
H20 increase Increase in stratospheric H20 as a result of x x x
changes in dynamics and methane oxidation,
and consequent chemical reactions that affect
ozone
Dynamics An increase of the stratospheric circulation x ?
intensity, leading to:
- Increase of tropopause height
- Accelerated removal of CFCs from the
atmosphere
- Increase transport subtropical air into
mid-latitudes
Notes: Table 2. (and figures 2.2 and 2.3) assume full compliance with the Montreal Protocol and no control measures on the emission of greenhouse gases (no Kyoto protocol).
Contribution to ozone column change 1980-2000
T(gas chem)
%
-50 CFCs
-B
affected by climate change -60high medium very low
Level of Scientific Understanding
Figure 2.2 Relative contribution (%) to the mid-latitude ozone column change between 1980 and 2000 by the processes considered in this study. The red coloured bars represent effects related to climate change. Horizontally an estimate of the level of scientific understanding is given.
Contribution to ozone column change 2000-205 0
150
affected by climate change
S
Montreal ProtocolCFCs
/oI•j(aschejH2{
polar vortex
-100
high medium very low
Level of Scientific Understanding
Figure 2.3 Relative contribution (%
) to the mid-latitude ozone column change
between 2000 and 2050 by the processes considered in this study. The red coloured bars represent effects related to climate change. The blue bar represents the estimated net recovery in 2050. Horizontally an estimate of the level of scientific understanding is given.page 17of116
3. UV-climatology and trends
A changing UV-climate may have a wide range of effects on the population and on
ecosystems (see section 1). To quantify the associated risks, information on the spectral
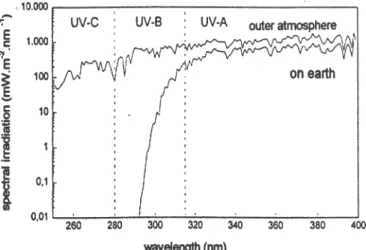
changes in UV irradiance at the earth surface is needed. Most adverse effects from solar UV exposure are primarily caused by UV-exposure from the UVB part (280-3 15 nm) of the solar
spectrum at the earth’s surface. Stratospheric ozone selectively absorbs these shortest
wavelengths of the solar spectrum, i.e. the so-called UVB and UVC part of the spectrum, and thus provides an effective shield against part of the harmful UV. We will focus here on the UV-radiation which is relevant for adverse effects, therefor the UV-spectrum at the ground is weighted and summed according to its effectiveness. The effective UV-radiation received at the ground is primarily depending on the solar height, the total ozone column, clouds,
aerosols and snow cover. Furthermore, the local environment like mountains, buildings, snow
and trees can shade and reflect part of the UV sky and influence the radiation levels actually
received.
The most direct way to assess changes in the UV-climate would be to use long-term data from highly accurate ground based UV-monitoring stations, however such long-term data are
largely lacking at present [WMO, 1998]. An assessment of changes over prolonged periods of time is therefor based on modelled UV-transfer, using ozone and other atmospheric data
from either ground based or satellite based sources. Such model approaches can be at least
partly validated by a comparison with ground based measurements for shorter time periods (den Outer et. al 2000, Slaper et. al 2001).
The effect of an ozone change on the effective UV-dose received at the ground is illustrated
in figure 3.1, which shows the clear anti-correlation between skin cancer weighted UV and
ozone.
Effective UV (SCUPh) in relation to ozone change
80 1 0 D 0 60 0 S 0 40 0 —measured (RIVM) . 20 —modelled D a) a) 13 -20 —40 -40 -30 -20 -10 0 10 20 30 40 Relative ozone change (% compared to 350 DU)
Figure 3.1 Relative change in daily doses of effective UV ($CUP-h weighted) in relation to changes in ozone. Data obtained from the RIVM UV monitoring system for Bilthoven (52 NL).
The measured resuks, which are corrected for cloud effects, are obtained using daily integrated UV-measurements from the RIVM UV-monitoring system in Bilthoven for the period 1996-2000, and are compared with modelled results. Similar approaches for other locations are summarised in WHO (1998). In addition it has been shown that an upward trend in clear-sky UV-dose is correlated to a downward trend in ozone [Zerefos et. al.,1998;
Mckenzie, 1999].
Figure 3.2 gives an example of a (UV) trend analysis—based on satellite data and ground
measurements - for De Bilt over the period 1979-2000. The trend calculated from these data
amount to an increase of around 5% per decade over the past two decades. A similar, albeit more uncertain increase is found if the cloud variability is included in the analysis.
—. Clear sky
165 3-year running average
. Analysed RIVM monitoring data
c___ 160 2 0 155 : 150 0 a) w 145• 140• 1980 1984 1988 1992 1996 2000 Year
Figure 3.2 Analysis of effective UV year-doses at De But over the period 1979-2000. Black squares indicate satellite derived data and blue circles data from the RIVM measuring site. In red the three year running mean is plotted.
Data from: ‘Milieucompendium 2001 at the RIVM Woridwideweb:
rivm.nllmilieucompendiuml section D 2.9
Apart from direct measurements, ground-level UV doses can be calculated using remote sensing techniques. These satellite based methods have been validated to yield good
estimates for UV doses at ground-level [Matthijsen et al., 2000, Slaper et al., 2001]. The way these UV budget maps changed over the last two decades can, in retrospect, be used to assess health and environmental risks. Figure 3.3 shows the change in effective UV over Europe over the period 1980-2000.
Difference in effective UV: 1
99811
999/2000 relative to 1 979/1 980/1 981 N : .1\;%I
:
. , Clear sky, . action specfrum: SCUPh
. Percent change •0-1 1 —2 2—3 3 —4 4—5
:
5-6 . •6-7 : cfigure 3.3 Budget map showing the change in effective UV over Europe.
The average effective UV over the period 1998-2000 is compared to the UV-budget over 1979-1981. Data from: ‘Milieucompendium 2001 at the RIVM Woridwideweb: rivm.nllmilieucompendiuml
Apart from ozone clouds are a dominating and highly variable factor in determining the year-round UV-budget. The treatment of clouds in UV-climatology and risk assessments is still a challenge. Clouds are a decisive factor in the effective UV on the ground (see figure 3.4), and thus in the actual exposure of the population. But their high variability in time and place makes accounting for their effects in long-term risk assessments difficult.
.-
-i4r
h I .
Figure 3.4 The reduction of the effective monthly UV-dose by clouds over the period
1996-2000.
The effects of clouds are also important with respect to climate change. Although no decisive evidence is available yet, climate change may well affect cloud cover and cloud optical thickness in a way dependent on season and location. A change in cloudiness and temperature will, in turn, influence (recreational) exposure with potential impacts on the overall risk of the population. At the moment, effects of structural change in cloudiness or a change in human behaviour due to climate change are not incorporated in our prognosis for (future) human risks.
Although there is a lack of direct observations of UV-trends in relation to ozone changes, it is highly likely that the yearly UV-doses received in large parts of Europe have increased by 5-10% over the past two decades. Further monitoring is required to substantiate the analysis and to establish how the climate-ozone changes influence the future UV-radiation levels at the ground. In addition to the climate-ozone interactions indicated in the previous chapter, clouds can also be influenced by climate change and thus lead to additional changes in the UV-doses received on the ground. In view of the high year to year variability of clouds and vortex effects, one might argue that a prolonged observation period will be required to fully establish UV-trends. c’j
E
0 > D > 0 ci)‘4-w
30—
1996-1999 average—
2000 25 cloud reduction20
r-r
Jan Feb Mar Apr May Jun Jul Aug Sep Oct Nov Dec
4. Overview of UV induced effects
4.1
Skin cancer
Skin cancer is a very common form of cancer among white Caucasians. The three main types are basal cell carcinomas (BCC), squamous cell carcinomas (SCC) and cutaneous melanomas (CM). SCC is most straightforwardly related to the total sun (UV) exposure: these tumours
occur on skin areas that are most regularly exposed (face, neck and hands) and the risk goes
up with the life-long accumulated UV dose. BCC and CM do not show these simple relations to UV exposure: these tumours appear to be more related to intermittent over-exposure
(episodes of sunburn, especially on irregularly exposed skin) and sun exposure in childhood [Kricker et al., 1995, Holman and Armstrong, 1984]. BCC is the most common of the three.
In NW Europe BCC occur in white Caucasians at a rate of about 90 cases per iO people per year, followed by SCC with about 15 cases per i& per year and CM with about 10 per iO
per year, summing up to 17.000 cases per year (in 1990) in the Netherlands [Health Council
1994). Recent brochures of the Dutch Cancer Society point to higher incidences; well over
20,000 cases of skin cancer per year in the Netherlands. Consequently, skin cancer forms a substantial pressure on the health system. Although the incidences are high, the mortality is generally low when compared to internal cancers.
Uv radiation is known to be a very prominent environmental toxic agent. It is absorbed by a great variety of organic molecules in the skin and superficial layers of the eye. It can damage these molecules or neighbouring molecules through the release of ‘radicals’ (intermediate reactive chemicals). DNA is a very prominent absorber of UV radiation and mutations may subsequently occur. This implies that human skin exposed to sunlight is under continuous threat of accumulating oncogenic damage, which may result in skin cancer. The evidence that Uv radiation is a major causal factor for skin cancer rests on three pillars: epidemiology, animal models and molecular genetics (de Gruijl, 1999).
1. Epidemiology
Epidemiological surveys show a clear correlation between ambient UV-dose and the incidence of skin cancer [Scotto and Fears, 1981, 19871.
2. Animal experiments
Animal experiments confirm that UV-induced genotoxicity indeed is the major driving force behind the induction of skin cancer. Dose-effect relationships from animal experiments combined with epidemiological data and data on ambient UV doses, yield the dose and age dependency for skin cancer induction in humans [de Gmijl et al.,1983]. On basis of the wavelength dependency for cancer induction derived from animal experiments, the action spectrum in humans has been estimated [de Gruiji et al., 1994].
3. Molecular genetics
Recently, the rapid advancements in the field of molecular genetics build the third pillar of evidence. It appears that skin tumours arise via a combination of an activated oncogenic pathway and an inactivated tumour suppressor gene (see appendix 1). The emerging
fundamental understanding on which specific molecular changes are involved in the various types of skin cancer will enable us to pin point which steps in the process of carcinogenesis
are affected by UV radiation.
The quantitative information on skin cancer outlined here (derived from appendix 1) is integrated in the RIVM risk assessment model AMOUR (appendix 5), which calculates extra UV-loads and excess skin cancer risks under a changing ozone layer. Results of the
4.2
Cataracts
The lens of the human eye changes with increasing age: it looses its brightness and it turns yellowish to brownish [Van Best et al., 1998]. In addition to this overall changes opaque spots may appear which grow in size and ultimately hamper vision. This lens opacity is referred to as a cataract and, as it is related to age, often as a ‘senile cataract’. Cataract is world-wide a major cause of blindness. In developed countries cataract is adequately treated by an operation, but in developing countries it often leads to permanent blindness with grave social/economic consequences. Three main types of cataract can be distinguished: cortical cataract (CC), nuclear (sclerotic) cataract (NC) and posterior subcaspular cataract (PSCC).
In contrast to UV exposure and skin cancer the relationship between cataracts and UV is much less univocal, and an animal model for senile cataracts is missing. The literature survey in appendix 2 leads to the (prudent) conclusion that UV radiation appears to have impact on all types of cataract, albeit perhaps at different stages of life (early versus continuously) and to different degrees: CC appears to be most clearly related to UV exposure (especially in chronically exposed male outdoor workers), and NC the least clearly (perhaps related to early in life UVB exposure).
From this starting point a preliminary dose-response model for cataract has been formulated in appendix 2. The overall yield for cataract can be described by:
Y(a)
=k0D (a—a)6
(1)Y = yield, number of cataracts
KO = UV-dose independent rate constant
D = annual ambient cataractogenic UV-dose
a =age
d = a delay period, approximately 22 years for senile cataract
p =exponent describing the dose dependency, p 0.55 (all cataracts)
In appendix 2 it has been made plausible that the ambient cataractogenic dose may be quite well approximated by the erythemally weighted UV-dose. This effective erythema dose can be derived from routine UV-monitonng or calculated with a UV-transfer model. However, an additional complication arises from the fact that the exposure of the eye is strongly dependent on the orientation of the eye surface. This complicates the use of equation (1), especially when large differences in ground reflectance occur (e.g. snow compared to grassy surfaces). To complete the description of the onset of UV-induced cataracts we need basic data for cataract incidence (yield) at a given ambient effective dose. This information is derived from the Dutch general practitioners registry on cataracts recorded in the ‘Nationaal Kompas Volksgezondheid’
Table 4. 1 gives the basic data for cataracts in the Dutch population in 1994. The ambient erythemally effective UV-dose for 1994 at De Bilt is approximately 165 I/cm2.
1
Hendrikse F. Hoe vaak komen gezichtsstoornissen voor? In: Volksgezondheid Toekomst Verkenning, Nationaal Kompas Volksgezondheid Volksgezondheid, versie 1 .3, 27 september 2001.© RIVM, Bilthoven.
Table 4.1 Basic data for prevalence, incidence and total numbers of cataracts for the Dutch population (1994)
Men Women Population
Prevalence 7.35 16.69 12.07
(per 1000)
Incidence 1.47 2.75 2.12
(per 1000, per year)
Number of new cases 1 1.200 21.400 32.600
(per year)
Total number of cases 55.900 129.700 185.600 (Dutch population 1994)
The quantitative information on UV induced cataracts outlined here (derived from appendix
2) and the information in table 4. 1 can be integrated in the RIVM risk assessment model
AMOUR (appendix 5). It provides a sufficient basis to assess the extra risk for cataracts under a changing ozone layer. At present, however, this new cataract risk module has not been implemented.
4.3
Effects on the immune system
Effects of UV radiation on the immune system have been shown to occur both in humans and in experimental animals. Modulation of the immune system occurs at relevant ambient doses, encountered in every day life. The experimental studies surveyed in appendix 3 provide evidence for a UV induced suppression of resistance to infections in humans. However, evidence is not unequivocal an the immune suppression is presumably moderate. In addition to genotoxic changes, the observed immunomodulation by UV radiation plays probably an important role in the formation of skin cancer.
The impact of the interaction of climate changes and ozone depletion on the expected levels of ambient UV exposure and resulting effects on neoplasms have been described elsewhere in this report (section 5). For an assessment of such impacts on the occurrence of infectious diseases, direct evaluations in humans cannot readily be made. As a consequence, risk assessments need to be based on dose-response studies in rodents, and the extrapolation of such studies to humans. Usually, animal experiments are performed using artificial UV sources, and not with sunlight. Therefor, in such an extrapolation, the action spectrum for immune suppression should be taken into account. Although actionspectra for a number of immunological parameters have been described in the literature, action spectra for the reduction of resistance to infections are not yet available. Preliminary studies at RIVM however, indicate that such actionspectra may be different from known immunological and genotoxic actionspectra.
In addition to information on actionspectra, also information on adaptation of the immune system to higher ambient UV-levels is essentially missing. Finally, nature and magnitude of inter-individual variation in sensitivity to UV-induced immune effects are largely unknown, although preliminary information gained at RIVM indicates that such differences may be considerable.
In conclusion, appendix 3 suggests a lower resistance to infections at higher ambient UV levels. But essential information for a full comprehension of the real risk of higher UV levels
—caused by interaction of ozone depletion and climate change - for the occurrence of
4.4
Effects on the marine environment
Marine phytoplankton in the world’s oceans is at the basis of the marine food web and plays
a major role in the global carbon cycle. The depletion of stratospheric ozone and subsequent
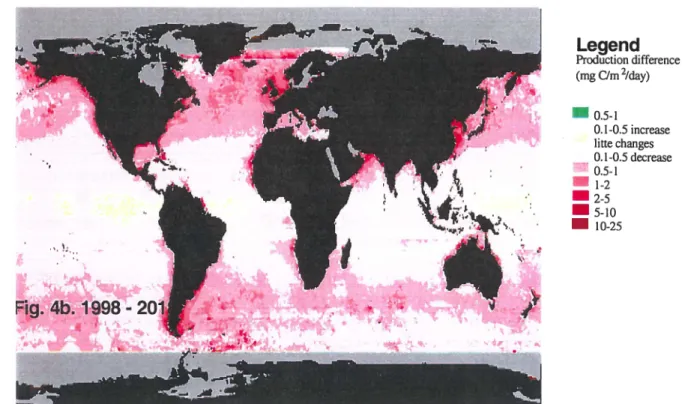
increase in ultraviolet irradiance affects this ‘primary production’ negatively. An extra increase in UV radiation at sea level, caused by ozone-climate interaction, will enhance this negative effect. Other trophic levels have found to be directly and indirectly affected by UV radiation. Modelling studies estimate that a 5% reduction in primary production would translate to an equivalent or even higher reduction in fishery catches.
In the framework of the OCCUR-project, model calculations are presented that compare
patterns of the potential global UV induced effect on primary production between 1978-1998 with the primary production over the period 1 998-20 1 8 (appendix 4). For the latter period, it
is assumed that the trend in ozone column observed over the past decades will remain the
same until 2018. This can be interpreted as a conservative ‘worst-case’ scenario for the development of the ozone layer.
The modelling results (figures 4. 1 and 4.2) indicate that increased UV will reduce the world-wide microalgal primary production over the period 1978- 2018. As a result the CO2 uptake capacity of the oceans will be reduced. The percentage decrease in primary production is highest in the Antarctic Ocean under the ozone hole, max. 5.3% (see figure 4.1). Compared to the period 1978-1998, there is a stronger decrease in carbon fixation in the North Atlantic over the period 1998-2018. These results suggest that in the near future, ozone depletion above the highly productive North Atlantic Ocean might even play a more important role in reducing global primary production than the ozone depletion in the south pole region, around Antarctica. As a loss of primary production is usually accompanied by reduction of higher trophic levels, a serious impact on fish production in the North Atlantics may be possible. Finally, ozone-climate interaction might activate a self-enforcing feedback loop; Higher CO2 levels lead to extra cooling in the stratosphere. This cooling may result in enforced ozone depletion (see section 5). According to appendix 3, higher UV-levels give rise to a loss of primary production and CO2 binding capacity of the oceans. This, in turn means higher CO2-levels and stronger stratospheric cooling, and so on.
For future research on the effects of UV radiation on phytoplankton, it is therefore
recommended not only to focus on the Antarctic situation. Further, more effort has to be put
in estimating the indirect and direct effects of UV radiation on other trophic levels, especially
Legend Production difference (mg C/rn 2/thy) — 0.5-1 0.1-0.5 increase litte changes 0.1-0.5 decrease 0.5-1 , 1-2 — 2-5 _ 5-10 — 10-25
Figure 4.1 Reduction inprimary productionresultingfrom increase ambient 1W-level’ Period: 197$ - 1998
.
I
Figure 4.2 Reduction inprimaryproductionresultingfrom increase ambient 1W-levels. Period: 1998 - 2018
5. Integrated risk assessments
Skin cancer is one of the best documented adverse effects of UV exposure. Ozone depletion
will enhance ambient UV-levels, ultimately resulting in a higher incidence of skin cancer. To
evaluate the consequence of ozone depletion - and of the possible stronger depletion induced by interaction between the ozone layer and climate change—the full source-risk chain has to be taken into account. The Assessment Model for UV Radiation and Risks (AMOUR) developed at RIVM gives such an overview; from production and emission scenario’s for CFCs, through photochemical breakdown of these CFCs in the stratosphere and ozone depletion to increase in (effective) ambient UV-levels and corresponding increased skin cancer risks. The prognosis for the development of the ozone layer over Europe during the period 1980-2100 is based on a scenario for chlorine in the stratosphere and on the ozone trend over 1979-1991 observed by the NASA-TOMS satellite. Monthly ozone values enable
us to calculate- with a UV-transfer model—the future effective UV-levels at the earth’s surface. These future UV-levels yield via a dose-response model for skin cancer, eventually the increased skin cancer incidence.
In this report the baseline risk - determined by the situation with no ozone-climate interaction —is compared with a scenario including ozone-climate interaction. The magnitude of the interaction is based on a literature survey, 2D model calculations for the Arctic vortex and on expert judgement. For the ozone-climate interaction we formulate the following
preconditions:
- Chlorine scenario Al [Madronich et. al, 19981
- Stratospheric temperature according to WCC, IS92a [Velders, 19971 - Stratospheric cooling results
—via a shift in the chemical equilibrium for ozone production/destruction - in 0.9% extra ozone per one Kelvin drop in temperature. - Splitting up of the arctic vortex induces a month and latitude dependent ozone depletion
over the Northern hemisphere. The magnitude of the ozone loss is calculated by 2 D simulation [Velders, 1997].
- Of the observed ozone trend 25% can be attributed to non-vortex dynamical changes. For details on the AMOUR model, the calculations and the interaction between the ozone layer and climate change, see appendix 5 and chapter 2.
The result of the AMOUR assessment can be given at a fixed location in terms of the increase
in effective UV and skin cancer incidence with and without ozone-climate interaction. Finally
AMOUR produces maps of the difference in effective UV and skin cancer incidence over Europe.
Figure 5.1 shows the increase in effective UV at De Bilt with and without ozone-climate interaction. Figure 5.2 depicts the extra cases of skin cancer at De Bilt with and without ozone climate interaction. AMOUR assessment yields similar information for all cells in the TOMS-gnd. These data can be put together in UV and skin cancer difference maps for Europe in a certain year. These maps strongly depend on the year chosen. For UV the maximum difference between the situation with and without ozone-climate interaction is expected around 2020. For skin cancer incidence the maximum difference is much later due
to the long latency period for skin tumours, and is detected around 2070. Figure 5.3 shows
the difference in 2020 over Europe for the effective UV with and without ozone-climate interaction. Figure 5.4 gives the same data for the excess skin cancer cases.
‘
Increase in effective UV at De But
Ca) 15,0
;
no ozone-climate interaction12 5- • —I—
Analysed UV-change 3-year running mean
,
I with ozone-climate interaction
1o,o.j
‘ I ‘
‘ I
1980 2000 2020 2040 2060 2080 2100
Year
Figure 5.1 Increase in effective UV with and without ozone climate interaction.
Location De But. As a comparison the analysed three year running mean, based on UV measurements included.
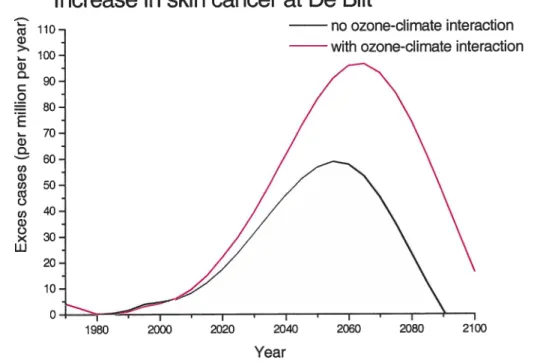
Increase in skin cancer at De But
I i 10- no ozone-climate interaction
with ozone-climate interaction
0 40-0) 0 x 30-w 20- 10-ol I I I ‘ I I • I I 1980 2000 2020 2040 2060 2080 2100 Year
Figure 5.2 Increase in skin cancer incidence at De Bilt, with ozone-climate interaction, and without ozone-climate interaction.
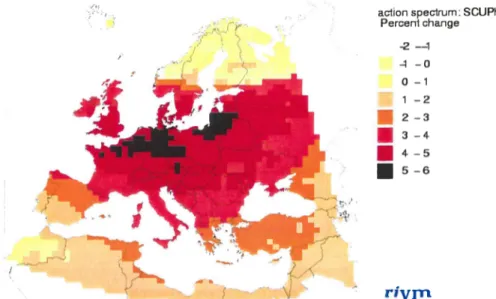
uv
change in 2020; with ozone-climate interaction relative to no interaction -2 --1 -1 -0 0 —1 1 —2 2 —3 3 —4 4 -5 5 -6figure 5.3 Increase in effective UV. Prognosis with ozone-climate interaction compared to that without ozone-climate interaction The effective UV is
expressed as the relative increase in UV compared to the effective UV without ozone-climate interaction
Extra skin cancer in 2070; with ozone-climate interaction tel. to no interaction
,
action specirum: SCUPh
excess cases
per milion per year
. <0 0 —10 1 0 —20 20 —30
K
30 -40I’
i’S
50-60S
—70Increase in skin cancer incidence. Prognosis with ozone-climate interaction compared to that without ozone-climate interaction. The change in risk is expressed as the number of extra cases (per million per year) in the situation with ozone-climate interaction compared to no ozone-climate interaction
- .j,_j.
action specirum :SCUPH
Perceni change
S
S
S
S
rivm çr‘i”
- ,L
, --0.k
-,<‘ )••[\( ‘ Figure 5.4 TivmThe result given have a large uncertainty because the stratospheric ozone concentration at mid-latitudes in our model is a subtle balance of chemical destruction of ozone, dilution by ozone poor air from the Arctic vortex, destruction/dilution by non-vortex dynamical effects and production of ozone due to chemical equilibrium shift. Scientific understanding of these processes, especially of the non-vortex dynamics and of the Arctic vortex itself, is far from perfect.
A preliminary analysis of the uncertainty introduced by the choice of the input parameters for the AMOUR model indicates that the fraction of the ozone trend attributed to the non-vortex dynamics introduces the largest uncertainty in the estimates of effective UV and
corresponding risks (see appendix 5, table 4). Unfortunately, scientific understanding of this effect and consensus on the magnitude of its contribution is the lowest.
Under the uncertainties given the risk assessments leads to the following conclusions:
Stratospheric cooling, induced by climate change, is likely to delay the recovery of the stratospheric ozone layer by approximately 20 years.
Delay in recovery of the ozone layer induced by ozone-climate interaction, results in a higher and more persistent increase in (effective) UV levels over Europe.
At De But the maximum increase in UV-level (with ozone-climate interaction) is reached around 2020. At the maximum the increase in effective UV (with ozone climate interaction) is 9.4% (relative to the 1980 level) as compared to 8.7% extra UV (in 2000) with no ozone-climate interaction.
Accounting for ozone-climate interaction, the effective UV-levels in 2020 for the mid-latitudes in Europe, are 4-6% higher compared to the situation with no climate interaction.
Higher UV-levels due to ozone climate interaction lead to a higher and more persistent increase in skin cancer incidence.
At De But with ozone-climate interaction the maximum increase in skin cancer incidence is reached in 2065. In this year there are approximately 95 extra cases of skin cancer per million inhabitants per year. With no climate interaction a maximum excess number of about 60 cases per million per year is reached in 2055.
Accounting for ozone-climate interaction, the excess skin cancer risk in 2070 for the mid-latitudes in Europe varies between 50 an 150 extra cases per million inhabitants per year, compared to the situation with no ozone climate interaction.
6. Conclusions
The result formulated in this quick scan of the impact of climate change on the recovery of
the ozone layer and related effects on human health and environment bear a large uncertainty.
This uncertainty arises from the fact that the stratospheric ozone concentration at mid-latitudes is a subtle balance of chemical destruction, dilution and production of ozone, and scientific understanding of the underlying processes, especially of the non-vortex dynamics
and of the Arctic vortex itself, is far from perfect. With this in mind we conclude:
•:• The ozone layer is expected to recover as a result of the implementation of the Montreal
protocol. Based on the expected decrease in chlorine and bromine a recovery is expected around 2050. The full recovery is probably delayed by increased concentrations of greenhouse gases.
•:• The delay calculated by Chemistry-Climate models show a large variation, ranging from about 10 years to more than 20 years.
•:• A stronger winter Arctic vortex - triggered by lower stratospheric temperatures—results
in more efficient (chemical) ozone loss. Thus, the Arctic vortex contributes substantially to the delayed ozone recovery. The mechanism underlying this enhanced ozone depletion,
however, is poorly understood.
+ Dynamic changes in the climate system, not coupled to the Arctic vortex, may also contribute substantially to a delay in ozone recovery. But, at present there is little consensus on the magnitude and relative importance of this contribution.
•:• A delay in recovery of the ozone layer, induced by ozone layer- climate change interactions, leads to a higher and more persistent increase in effective UV-levels over Europe. In 2020 UV-levels over mid-Europe, accounting for ozone-climate interaction, are estimated to be 4-6% higher compared to the UV-levels without interaction..
•:• Elevated ambient UV-levels result in a higher and more persistent increase in skin cancer incidence. Under the assumption that other conditions, in particular cloudiness, are not affected and that climate change does not influence behaviour of the population, the risk
at De Bilt increases from approximately 60 extra cases per million inhabitants per year
(no ozone-climate interaction, 2055) to about 95 extra cases per million per year (ozone-climate interaction taken into account 2065).
+ Increased UV at sea-level yields a reduction of microalgal primary production and carbon dioxide binding capacity in the oceans. Loss of primary production probably affects higher trophic levels in the food chain. This may lead to a serious impact on fish production, especially in the North Atlantic waters.
•:• A literature survey indicates a lower resistance to infections at higher ambient UV-levels. But essential information for a full comprehension of the real risk of elevated UV-levels for the occurrence of infectious diseases in the population is missing.
•:• A review of the causative factors for senile cataracts strongly indicates UV as a
contributing factor, especially for cortical cataracts. This makes cataract formation sensitive to an increase in ambient UV-levels caused by ozone-climate interaction.
7. Future Research
The integrated risk-assessment provided in this study should be seen as a preliminary analysis of the consequences of climate-ozone interactions and further research is required to
substantiate and improve the analysis. It should therefor be considered to initiate a broad integrative program, that further improves and integrates the knowledge of climate-ozone interactions, their consequences on UV-budgets, and the dose-time response relationship for
a variety of health and environmental effects. Such a research program could and should serve as an integrative framework for the improvement of prognostic scenario assessments of the UV-related risk associated with atmospheric change.
More specifically, the following topics can be considered in such an integrative research program on the consequences of climate change and ozone depletion on UV-budgets and
risks:
•:• Research on depletion of stratospheric ozone and research on climate change follow
separate tracks. But the interactions between climate change and ozone layer depletion found in this report are so many-sided and may induce such (potentially) important effects that integration of these lines of research is required to get a full understanding of
the impact on human health and environment. Internationally, this asks for a close co
operation of the Panels active under the Montreal protocol and the Intergovernmental
Panel on Climate Change (IPCC).
•:• For a better understanding of ozone-climate interaction, development and validation of 3-dimensional models including the troposphere and the stratosphere, with an adequate description of (temperature) driven dynamical changes in the atmosphere and with a full coupling to ozone chemistry is required.
•:• To give the risk assessment for skin cancer induction with climate-ozone interaction a
more solid basis, better information is required on the magnitude and nature of the
interactions between climate change and ozone layer depletion, especially on the contribution of non-vortex dynamics.
+ To better underpin the causes of the loss of primary production in the oceans and the effects on fish production further research on the contribution of North Atlantic Ocean is crucial. And more research effort is needed on influence on other trophic levels like fish production.
+ The improved insight in the molecular and genetic background of the induction of skin cancer should initiate research to improve en validate the quantitative modelling of the development of skin cancer. In particular diagnosis and quantification of benign, pre cancerous lesions may lead to improved models with a better prognostic capacity. •:• The strong association between UV exposure and cataracts requires further study on the
action spectrum for cataract formation and on the dose-effect relationship. The
preliminary model presented in this report provides a sufficient basis to make a risk assessment for cataracts under varying ambient UV-levels.
•:• Better insight in the effects of UV on the immune system requires research on: action
spectra for the reduction of resistance to infections, on adaptation of the immune system to higher UV-levels and on inter-individual differences in UV susceptibility.
+ The present risk assessment study focussed on the three most substantial interactions
between ozone layer and climate change. For a complete insight other contributions
(N20, CH4, water vapour, etc.) must be taken into account in the AMOUR-model.
•:• An increase in methane in the atmosphere is expected to speed up the recovery of the
ozone layer by the increased formation of chlorine reservoir species.
+ For a comprehensive overview of UV induced changes, other environmental effects, e.g.
effects on terrestrial ecosystems, should be evaluated.
+ Further improvements of the integrative modelling frame to account for climate-ozone
References
Angel!, J.K., Difference in radiosonde temperature trend for the period 1979-1998 of MSU data and the period 1959-1998 twice as long, Geophys. Res. Lett., 27, 2181-2184, 2000. Appenzeller, C, A.K. Weiss and J. Staehelin, North Atlantic Oscillation modulates total ozone winter trends, Geophys. Res. Lett., 27, 1 13 1-1 134, 2000a.
Austin, J., N. Butchart, and J. Knight, Three-dimensional model simulations of the ozone layer: 2015-55,
Q.
J. Meteorol. Soc., 127, 959-974, 2001.Austin, J., JR. Knight, and N. Butchart, Three-dimensional model simulations of the ozone
layer: 1979-2015,
Q.
J. Meteorol. Soc., 126, 1533-1556, 2000.Butchart, N., and A.A. Scaife, Removal of chiorofluorocarbons by increases mass exchange between the stratosphere and troposphere in a changing climate, Nature 410, 799-802, 2001. Bruehl, C., B. Steil, and E. Manzini, Feedback processes between chemistry and meteorology with focus on lower stratospheric polar vortices, simulations with a coupled GCM, in:
SPARC proceedings, 2000.
Chipperfield, M.P., Multiannual simulations with a three-dimensional chemical transport model, Journal of Geophysical Research, 104, 1781-1805, 1999.
Cunnold, D., H. Wang, L. Thomason, J. Zadiwny, I. Logan, and I. Megretskaia, SAGE (version 5.96) ozone trends in the lower stratosphere, I. Geophys. Res., 105, 4445-4457,
2000.
De Gruiji, F.R., Van der Meer, J.B. and Van der Leun, J.C. (1983) Dose-time dependency of tumor formation by chronic UV exposure, Photochem. Photobiol. 37, 53-62.
De Gruiji FR, Van der Leun IC, 1994. Estimate of the wavelength dependency of ultraviolet carcinogenesis in humans and its relevance to the risk assessment of a stratospheric ozone depletion. Health Phys. 67, 3 14-325.
De Gruiji FR, 1999. Skin cancer and solar UV radiation (Millennium review). Eur. J. Cancer
35, 2003-2009.
EC, Scientific Assessment, European Research in the Stratosphere 1996-2000, Report EUR
19867, 2001.
Forster, P.M., de, and K.P. Shine, Stratospheric water vapor changes as a possible contributor
to observed stratospheric cooling, Geophys. Res. Lett., 26, 3309-33 12, 1999.
Forster, de, P.M., and K. Tourpali, Effect of tropopause height changes on the calculation of ozone trends and their radiative forcing, J. Geophys. Res., 106, 2001.
Health Council, 1994.UV radiationfrom sunlight. Report no. 1994/05E, pp.83-i 18, The Hague, the Netherlands.
Holman CDJ, Armstrong BK. Cutaneous malignant melanoma and indicators of total accumulated exposure to the sun: an analysis separating histogenic types. J. Nati. Cancer Inst. 73, 75-82, 1984.
Hood, L.L, S. Rossi, and M. Beulen, Trends in lower stratospheric zonal winds, Rossby wave breaking behaviour, and column ozone at northern midlatitudes, J. Geophys. Res., 105, 24, 321-24,339, 1999.
Knudsen, B.M. and J.U. Grooss, Northern midlatitude stratospheric ozone dilution in spring modelled with simulated mixing J. Geophys. Res., 105, 6885-6890, 2000.
Kricker A, Armstrong B.K., English D.R., Heenan P.J. Does intermittent sun exposure cause basal cell carcinoma? A case-control study in Western Australia.
mt.
J. Cancer 60, 489-494,1995.
Langematz, U., An estimate of the impact of observed ozone losses on stratospheric temperature, Geophys. Res. Lett., 27, 2077-2080, 2000.
Madronich, S.; G.J.M. Velders., G. J. M.; Daniel, I. S.; Murari Lal, M.; McCulloch,A., and Slaper, H. Chapter 1 1. WMO, Scientific Assessment of Ozone Depletion: 1998. Geneva, Switserland: WMO; 1999.
Madronich, S. Implications of recent total ozone measurements for biologically active ultraviolet radiation reaching the Earth’s surface. Geophys. Res. Lett., 19, 37-40, 1992.
Matthijsen, J., Slaper, H., Reinen, H.A.J.M., and Velders, G. J.M., 2000. Reduction of solar
Uy by clouds: A comparison between satellite-derived effects and ground-based radiation
measurements. I. Geophys. Res., 105, 5069-5080, 2000.
McKenzie R., Connor B., Bodeker G., Increased summertime UV radiation in New Zealand in response to ozone loss, SCIENCE, 285, 1709-171 1, 1999.
Portmann, R., S. Brown, T. Gierczak, R. Talukdar, J. Burkholder, and A. Ravishankara, Role of nitrogen oxides in the lower stratosphere: A reevaluation based on laboratory studies, Geophys. Res. Lett., 26, 2387-2390, 1999.
Randel, W.J., R.S. Stolarski, D.M. Cunnold, J.A. Logan, M.J. Newchurch, and J.M. Zawodny, Trends in the vertical distribution of ozone, Science, 285, 1689-1692, 1999.
Reid, S.J.,.A.F. Tuck, and G. Kiladis, On the changing abundance of ozone minima at northern midlatitudes, I. Geophys. Res., 105, 12,169-12,180, 2000.
Scotto, I., and Fears, T.R. Incidence in Non-melanoma Skin Cancer in the United States. NIH publication 82-2433 (National Institue of Health, Washingtont DC, 198 1), 1981
Scotto, J., and Fears, T.R. The association of solar ultraviolet and skin melanoma incidence among Caucasians in the United States. Cancerinvest. 5, 275-283, 1987.
Shindell, D.T., D. Rind, and P. Lonergan, Increased polar stratospheric ozone loss and delayed eventual recovery owing to increasing green-house gas concentrations, Nature, 392, 589-592, 1998.
Shindell, D.T., R.L. Miller, G.A. Schmidt and L. Pandolfo, Simulation of recent northern winter climate trends by greenhouse-gas forcing, Nature, 399, 452-455, 1999.
Shindell, D.T., Climate and ozone response to increased stratospheric water vapor, Geophys. Res. Lett., 28, 1551-1554, 2001.
Slaper, H., Daniel, J.S., de Gruijl, F.R., and van der Leun, J.C. Estimates of ozone depletion and skin cancer incidence to examine the Vienna convention achievements. NATURE, 384, 256-258, 1996.
Slaper, H., Matthijsen, J.,den Outer, P.N., Velders, G. J.M. Climatology of Ultraviolet Budgets using Earth Observation (CUBEO): mapping UV from the perspective of risk assessments. Report by Beleidscommissie remote sensing (BCRS), User Support program, USP-2 00-17, ISBN 90 54 11 32 6, 2001
Solomon, S., Portmann, R.W., Garcia, R.R., Randel, W., Wu, F., Nagatani, R., Gleason, J., Thomason, L., Poole, LR., and McCormick, M.P., Ozone depletion at mid-latitudes: Coupling of volcanic aerosols and temperature variability to anthropogenic chlorine, Geophys Res Lett, 25, 1871-1874, 1998.
Steinbrecht, W., H. Claude, U. Köhler, and K.P. Hoinka, Correlations between tropopause height and total ozone: Implications for long-term changes, J. Geophys. Res., 103, 19,183-19,
192, 1998.
Steinbrecht, W., H. Claude, U. Koehler and P. Winkler, Interannual changes of total ozone and northern hemisphere circulation patterns, Geophys. Res. Lett., 28, 1 195-1 198, 2001.
Tabazadeh, A. et al., Quantifying denitrification and its effect of ozone recovery, Science, 288, 1407-1411, 2000.
UNEP, 1998. Environmental Effects of Ozone Depletion: 1998 Assessment. Photochem. Photobiol. B.: Biology, 46, 1-108.
Velders, G.J.M. 1997 Effect of greenhouse gas emissions on stratospheric ozone depletion. Report by the National Institute of Public Health and the Environment, no. 722201011, January 1997
Waibel, A.E., et al., Arctic ozone loss due to denitrification, Science, 283, 2064-2068, 1999. WMO, 1995. Scientific Assessment of Ozone Depletion: 1994, Global Ozone Research and Monitoring Project. WMOIRep. Nr. 37, Geneva.
Zerefos C., Meleti C., Balis D., Tourpali K., Bais A.F., 1998 Quasi biennial and long-term changes in clear sky UV-B solar irradiance, Geophys. Res. Lett., 25, 4345-4348.
Zhou, S., M.E. Gelman, A.J. Miller and J.P. McCormick, An interhemispheric comparison of the persistent stratospheric polar vortex, Geophys. Res. Lett., 27, 1 123-1 126, 2000