The impact of the new Cleaning Products
Fact Sheet 2018 on consumer exposure
estimation
RIVM Letter report 2018-0079
Page 2 of 34
Colophon
© RIVM 2018
Parts of this publication may be reproduced, provided acknowledgement is given to: National Institute for Public Health and the Environment, along with the title and year of publication.
DOI 10.21945/RIVM-2018-0079
J.A.J. Meesters (auteur), RIVM F. Affourtit (auteur), RIVM J.E. Delmaar (auteur), RIVM Contact:
consexpo@rivm.nl
This investigation has been performed by order and for the account of NVWA, within the framework of ConsExpo 2015 project
This is a publication of:
National Institute for Public Health and the Environment
P.O. Box 1 | 3720 BA Bilthoven The Netherlands
Synopsis
The impact of the new Cleaning Products Fact Sheet 2018 on consumer exposure estimation
Consumers come into contact with chemical substances by using
cleaning products. Accurate estimation of human exposure is a necessity in assessing the potential risks of chemical substances in consumer products. The Cleaning Products Fact Sheet that supports in estimating such exposure has been recently revised. New data collected from literature and re-interpretation of existing data has led to the adjustment of a number of default values used for exposure
calculations. For some cleaning products (such as all-purpose cleaner spray and bathroom cleaner spray) increased exposure values are calculated, whereas for other products (such as liquid laundry detergent and liquid floor cleaner) the calculated exposure value seems to
decrease.
This is shown by RIVM research in which the impact of new data on estimated human exposure to substances in cleaning products has been investigated. Consumer exposure estimates based on the content of the Cleaning Products Fact Sheet of 2006 were compared to those based on the updated content in 2018. The impact was evaluated and found to depend on the way the product is used, its substance ingredients, and whether the exposure is via dermal contact or inhalation of substances. The Cleaning Products Fact Sheet was developed to support the users of ConsExpo, a computer model developed by RIVM for calculating human exposure to substances in consumer products. This fact sheet describes the default models to use and the default values to insert in order to perform a standardised and transparent consumer exposure estimation for substances in cleaning products.
Keywords: ConsExpo Web, Fact Sheet, revision, consumer exposure estimation, cleaning products
Publiekssamenvatting
De impact van de nieuwe Schoonmaakmiddelen Factsheet op de blootstellingschatting voor consumenten
Als consumenten schoonmaakmiddelen gebruiken, komen zij in aanraking met chemische stoffen. Om mogelijke risico’s daarvan te kunnen beoordelen, is een goede schatting nodig van de mate waarin mensen blootstaan. De Schoonmaakmiddelen Factsheet die helpt om deze blootstelling in te schatten, is recentelijk herzien. Op basis van nieuwe literatuur en herinterpretatie van bestaande data zijn een aantal standaardwaarden waarmee wordt gerekend, aangepast. Voor sommige producten (onder andere allesreiniger spray en badkamer spray) wordt een hogere blootstelling berekend, terwijl de blootstelling voor andere producten (waaronder vloeibare wasmiddelen en vloeibare vloerreiniger) omlaag lijkt te gaan.
Dit blijkt uit onderzoek van het RIVM waarin de impact van de nieuwe gegevens op de geschatte blootstelling is onderzocht. De impact op de geschatte blootstelling hangt af van de samenstelling van het
schoonmaakmiddel en de manier waarop het wordt gebruikt. Daarnaast is van invloed of mensen via de huid aan het middel blootstaan of dat ze stoffen hieruit inhaleren. De impact is geëvalueerd door de
consumentenblootstellingsschattingen uitgevoerd op basis van de vorige factsheet (2006) te vergelijken met die op basis van de herziene versie uit 2018.
De factsheet is opgesteld voor gebruikers van ConsExpo, het
computermodel dat het RIVM heeft ontwikkeld om de blootstelling te berekenen. In de factsheet staan standaardmodellen en
standaardwaarden voorgeschreven om de blootstelling van
consumenten aan stoffen uit schoonmaakmiddelen op een transparante en gestandaardiseerde manier te schatten.
Kernwoorden: ConsExpo Web, Factsheet, herziening, consumentenblootstellingsschatting, schoonmaakmiddelen
Contents
Summary — 91 Introduction — 11
2 Methods — 13
2.1 Selecting relevant consumer exposure scenarios — 13 2.2 Comparing scenario consumer exposure estimates — 13
2.3 Review of exposure, Q-factors, and underlying data of defaults — 14 2.4 Relevant new features in ConsExpo Web — 14
3 Results — 15
3.1 Changes in exposure estimations and Q-factors by collection of new and re-interpretation of old data — 15
3.2 Comparison of estimated exposure per scenario — 16
4 Discussion — 19
4.1 Scenarios with most extensive changes in estimated exposure — 19 4.1.1 Inhalation from mixing, loading and pouring of undiluted liquids — 19 4.1.2 Inhalation of non-volatile substances in sprays — 20
4.1.3 Volatile substances in sprays and scattered powders — 22 4.1.4 Inhalation of substances in powders — 22
4.1.5 Dermal loads from surface treatment activities — 23 4.2 Total exposure estimates per product — 23
5 Conclusions — 25
6 References — 27
Summary
In order to assess the chemical safety of consumer products it is important to estimate the human exposure to substances from using these products. The computer software model ConsExpo is developed to estimate such inhalation, dermal and oral exposure. The model asks for input values such as frequencies and amounts used that refer to how the product is used by the consumer. To guide the model users herein, ConsExpo Fact Sheets are developed that describe standardised consumer exposure scenarios with default input values. The Cleaning Products Fact Sheet historically published in 2006 has been updated as part of the launch of ConsExpo Web as an online version of the model. The fact sheet update includes a reset of default values based on the most recent data on the use of cleaning products as well as re-interpretation of the data underlying the defaults of 2006. As such, the update in 2018 affects existing and future chemical safety assessments of cleaning products, but the extent of it is not directly clear. In the current report, an overview is drawn to present how many defaults are altered, whether such alterations imply increase or decrease of
estimated exposure, and whether the underlying data of 2018 is of greater quality than that of 2006. It is found that a majority of defaults and
underlying data quality remained unaltered. Moreover, the number of defaults with an increase in data quality is about equal to number of decreases. This also applies to the increases or decreases in estimated exposure implied per default.
In addition, consumer exposure estimations based on the Cleaning Products Fact Sheet of 2006 are compared to those of 2018. Next, it is analysed what altered defaults are most responsible for apparent changes in estimated exposure. The most important impacts of the Cleaning Products Fact Sheet update found by comparing the consumer exposure estimations of 2006 and 2018 are:
(1) a decrease in inhalation exposure from mixing and loading undiluted liquid cleaning products as a consequence of a new default for the mass transfer coefficient for evaporating substances,
(2) an increase in inhalation exposure of non-volatile substances in cleaning sprays as a consequence of a new fit for the particle size distributions of the sprayed droplets,
(3) a more refined approach to estimate dermal exposure from hand contact with wet cloths and treated surfaces that leads to both increases and
decreases of dermal loads.
Increases in the estimated total exposure per product is expected for dish wash powder, carpet spot remover, all-purpose cleaner spray, bathroom cleaner spray, all-purpose cleaner wipes, shoe polish cream and toilet rim blocks, whereas decreases are expected for liquid machine wash detergents, bathroom and floor cleaner liquids, floor stripper, furniture polish liquid, floor cleaner wipes, drain openers and hand wash powder.
It is concluded that the impact of the Cleaning Products Fact Sheet in 2018 is diverse and strongly depends on the specific cleaning product, the use scenarios for which exposure is estimated and whether the relevant exposure route is via inhalation or dermal.
1
Introduction
Accurate estimation of consumer exposure is a necessity in assessing the potential risks of chemical substances in consumer products. RIVM has developed the computer software ConsExpo, for which recently an online version was launched (ConsExpo Web), to estimate consumer exposure to chemicals. Additionally, ConsExpo Fact Sheets have been developed in order to guide the model users in performing exposure assessment in a standardised and transparent way. These fact sheets describe default models and default values and are available for different consumer products such as do-it-yourself-products, paints, cosmetics and cleaning products.
Following the update of the General Fact Sheet in 2014 (Te Biesebeek et al., 2014), the previous Cleaning Products Fact Sheet published in 2006 (Prud’homme de Lodder et al., 2006) has been updated in 2018
(Meesters et al., 2018). This updated version of the Cleaning Products Fact Sheet describes the most recent data, which have been evaluated, and default values in the fact sheet are adjusted when necessary. To indicate the reliability of a default value, a quality factor (Q-factor) is used in all ConsExpo fact sheets. The quality factor ranges from 1 (low quality) to 4 (high quality). Apart from the default values, also the quality factors of the old version are assessed and adapted in the newest update, if necessary based on the new data.
Subsequently, adjustments have been implemented in ConsExpo Web’s default database for estimating consumer exposure of substances in various cleaning products like laundry detergents, dishwashing products, all-purpose cleaners, abrasives, bathroom cleaners, floor, carpet and furniture cleaners and other cleaning products.
The Cleaning Products Fact Sheet historically is widely used for exposure estimation as a part of compliance to regulation in the chemical safety assessment of consumer products. The adjusted defaults in the update may therefore affect existing and future safety reports of substances in cleaning products. However, some default adjustments imply an
increase of consumer exposure, whereas other default adjustments imply a decrease. The overall impact of the adjusted defaults is therefore not directly clear.
After publication of the updated version of the Cleaning Products Fact Sheet in 2018, the Netherlands Food and Consumer Product Safety Authority (NVWA) has requested to indicate what the impact is of the adjusted defaults on the outcome of the consumer exposure estimation for chemicals from the use of cleaning products. This has been studied by comparing the default scenarios described in the Cleaning Products Fact Sheet of 2006 and 2018.
2
Methods
The impact of the adjusted defaults on the outcome of the consumer exposure estimation for chemicals in cleaning products is studied. This is performed by comparison of the ConsExpo Web estimates for
standardised consumer exposure scenarios described in the Cleaning Products Fact Sheets of 2006 and 2018. The consumer exposure scenarios selected for this comparison are those described in both fact sheets. ConsExpo Web is used for the exposure estimation of the
scenarios. For this, the model input referring to the substance properties and concentrations of household chemicals in the cleaning products has been set equal in the 2006 and 2018 simulations. In addition, any consequences to the quality of the adjusted defaults is evaluated by comparing and summarizing the 2006 and 2018 Q-factors assigned to the underlying data and by reviewing any differences in the motivation of these Q-factors.
2.1 Selecting relevant consumer exposure scenarios
The consumer exposure scenarios selected for this comparison are those described in both the Cleaning Products Fact Sheets of 2006
(Prud’homme de Lodder et al., 2006) and of 2018 (Meesters et al., 2018). As such, 51 consumer exposure scenarios are described for 38 different cleaning products. The consumer exposure scenarios that are new in 2018 are not included. The effect of changes in default values for exposure parameters is evaluated for the following consumer exposure outcomes presented in ConsExpo Web as:
the mean event concentration, peak concentration, mean concentration on day of exposure, year average concentration, external event dose and external dose on day of exposure for the
inhalation route,
the dermal load, external event dose and external dose on day of exposure for dermal exposure, and
external event dose and external dose on day of exposure for
oral exposure.
The defaults provided for exposure time in the fact sheet of 2006 when using the “diffusion through skin” mode for dermal absorption, are not included anymore in the fact sheet of 2018. Therefore, only external exposure estimates are compared in this study.
2.2 Comparing scenario consumer exposure estimates
The impact of the changes in parameter defaults in the update of the fact sheet is evaluated by simulating and comparing ConsExpo Web’s exposure estimates for the selected consumer exposure scenarios, according to the default settings of both fact sheets. Fact sheets typically describe the use and exposure scenario for the consumer product, not taking into account a specific substance. Defaults for the input parameters weight fraction, vapour pressure and molecular weight that are specific for the substance are thus not given in fact sheets. A weight fraction of 1%, a vapour pressure of 100 Pa and a molecular weight of 100 g/mol are therefore inserted in the simulations with
Page 14 of 34
ConsExpo Web, which are somewhat based on a representative of a volatile organic chemical ingredient in a cleaning product. The outcomes of the simulations of the different scenarios are then compared by expressing the outcomes of 2018 in a ratio to those of 2006.
2.3 Review of exposure, Q-factors, and underlying data of defaults The updated Cleaning Products Fact Sheet (Meesters et al., 2018) contains 746 defaults of which 412 are also included in the earlier fact sheet (Prud’homme de Lodder et al., 2006). During the process of writing the updated version, these 412 defaults have been re-evaluated with new collected underlying data and re-interpretation of existing data in the earlier fact sheet. This has led to changes in default values and respective Q-factors. For every default it is noted whether the value was altered, new data was collected, old data was re-interpreted, and
whether the Q-factors was reduced, kept the same, or raised. Per altered default value, it is separately checked whether the estimated exposure outcome increased or decreased. This is done by simulating all the exposure scenarios of the earlier fact sheet of 2006 and only adjust one default to the 2018 settings.
2.4 Relevant new features in ConsExpo Web
The aim of the update of the Cleaning Products Fact Sheet was to actualise and improve exposure assessment to cleaning products by including new data that has become available after publication of the earlier fact sheet in the period of 2006-2018. In the same period, the ConsExpo model has been converted from ConsExpo 4 (Delmaar et al., 2005) to ConsExpo Web (www.consexpoweb.nl; Delmaar and Schuur, 2017). The new ConsExpo Web consolidates largely the features of the ConsExpo 4 software tool, but with some new features such as a model to assess exposure to substances evaporating from solid materials and the ability to derive peak concentrations in indoor air. Furthermore, the low-tier model referred to as the “inhalation–exposure to spray–
instantaneous release” model to estimate inhalation of substances in
sprays (Delmaar and Schuur 2017) is a new feature that is relevant in assessing exposure to substances in cleaning products (Delmaar and Schuur, 2017). Albeit the fact sheet of 2018 explicitly describes to use the feature for volatile substances in sprays, it is not considered for deriving the 2018:2006 ratios, because of the absence of an explicit approach in the earlier fact sheet of 2006.
The update of the ConsExpo model is thus not included in this report, because there are no consumer exposure scenarios available in the earlier fact sheet to evaluate the new features of ConsExpo Web.
3
Results
3.1 Changes in exposure estimations and Q-factors by collection of new and re-interpretation of old data
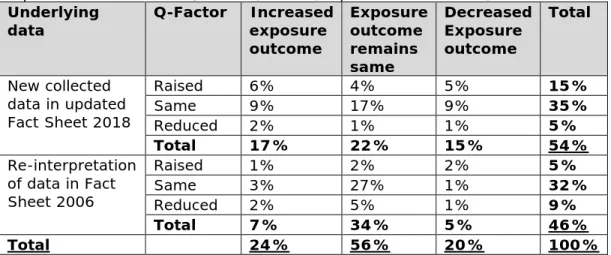
For all defaults that are included in both fact sheets it is noted whether the underlying data is new or re-interpreted, estimated exposure would increase, decrease or remain the same, and whether the assigned Q-factor was reduced, kept the same, or raised. As such, an overview of alteration of defaults, their underlying data and implications for exposure estimation is drawn (Table 1).
Table 1. Overview of the impact of collection of new data and re-interpretation of data in the earlier fact sheet (Prud’homme de Lodder et al., 2006) on exposure estimations and Q-factors (reduced, kept the same or raised)
Underlying
data Q-Factor Increased exposure outcome Exposure outcome remains same Decreased Exposure outcome Total New collected data in updated Fact Sheet 2018 Raised 6% 4% 5% 15% Same 9% 17% 9% 35% Reduced 2% 1% 1% 5% Total 17% 22% 15% 54% Re-interpretation of data in Fact Sheet 2006 Raised 1% 2% 2% 5% Same 3% 27% 1% 32% Reduced 2% 5% 1% 9% Total 7% 34% 5% 46% Total 24% 56% 20% 100%
For 54% of the defaults that were already in the earlier fact sheet of 2006, new data were collected. The collection of new data has led in most cases to an alteration of the default value (32%), which resulted in a few more exposure estimations to increase (17%) than decrease (15%). Nonetheless, 22% of the re-evaluated defaults after collection of new data have remained unaltered, resulting in the same exposure estimations. A similar pattern is seen for the defaults that were re-evaluated without new data (46%). A majority of the defaults remained unaltered (34%), whereas alteration of the value only led to slightly more increases (7%) than decreases (5%) of estimated exposure outcomes.
The collection of new data often did not lead to an adjustment of the Q-factor assigned to a default value (35%). In case the Q-Q-factor was adjusted, it was more often increased (15%) than decreased (5%). A reduction of a Q-factor despite the collection of new data is only reasonable in cases in which a different insight in data interpretation weighs stronger than the quality of newly collected data. In addition, re-interpretation of earlier fact sheet data often did not lead to an
adjustment of the Q-factor (32%). However, the Q-factors that are adjusted are more often reduced (9%) than raised (5%).
In total however, the Q-factors are more often raised (20%) than reduced (14%), which implies that the underlying data of the Cleaning
Page 16 of 34
Products Fact Sheet is of higher quality leading to less uncertainty in the described estimations of consumer exposure.
Furthermore, it is notable that 27% of the defaults that are in both fact sheets has not been subject to any reconsideration what so ever, since no new data was collected and re-interpretation of the old data from 2006 did not lead to adjustment of the default value or the Q-factor. However, when considering all 746 defaults in the updated 2018 version of the Cleaning Products Fact Sheet 85% is new. The novelty either relates to the introduction of new consumer exposure scenarios for which defaults are described (45 %) or to defaults in existing scenarios that underwent some update in status in 2018 (40%) such as the collection and reconsideration of underlying data, adjustment of default values or Q-factors. As such, only a fraction of 15% of the default descriptions in the updated Cleaning Products Fact Sheet of 2018 is actually similar to those in the earlier version of 2006.
3.2 Comparison of estimated exposure per scenario
For each simulated scenario ConsExpo Web derives six different external exposure estimates for the inhalation route (mean event concentration, mean concentration on day of exposure, external event dose, peak concentration, year average concentration, and external dose on day of exposure), three estimates for the dermal route (dermal load, external event dose, external dose on day of exposure), and two for oral
exposure (external event dose and external dose on day of exposure). First, different inhalation exposure estimates from the earlier and updated version of the fact sheet are compared per scenario.
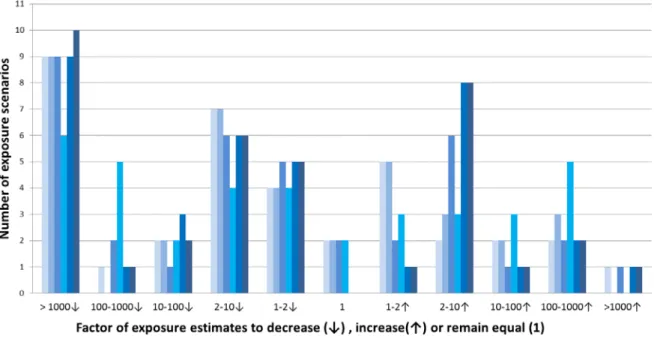
Out of the 222 inhalation exposure estimates derived for 37 scenarios that consider inhalation, 35% showed increased exposure, while 4% has stayed the same, and 62% decreased. In 10 scenarios, the estimated inhalation exposure decreased with at least a factor 1000, whereas for 1 inhalation scenario the exposure estimate increased more than a factor 1000 (Figure 1; Annex I, Table A1).
Figure 1. The number of exposure scenarios for which ConsExpo Web’s inhalation exposure estimates decrease (↓) or increase (↑) with a factor of > 1000, 100-1000, 10-100, 2-10, 1-2, or remain the same (1) after comparing the earlier defaults to the defaults in the updated fact sheet.
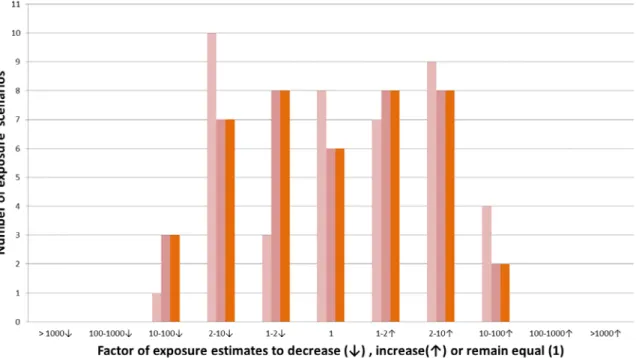
Out of the 126 dermal exposure estimates derived for 42 scenarios that consider the dermal route, changing the earlier defaults to the defaults in the updated version of the fact sheet has led to an increase for 44% of the dermal exposure estimates, whereas 16% stayed the same, and 40% decreased. Within four consumer exposure scenarios, the dermal load is increased with a factor 10 to 100 (Figure 2; Annex I, Table A1).
Page 18 of 34
Figure 2. The number of exposure scenarios for which ConsExpo Web’s dermal exposure estimates decrease (↓) or increase (↑) with a factor of > 1000, 100-1000, 10-100, 2-10, 1-2, or remain the same (1) after comparing the earlier defaults to the defaults in the updated fact sheet.
4
Discussion
4.1 Scenarios with most extensive changes in estimated exposure Below, consumer exposure scenarios are discussed that changed extensively due to the update of the Cleaning Products Fact Sheet (i.e. the exposure estimates increased by a factor 10-100 or more or
decreased by a factor 1000 or more).
4.1.1 Inhalation from mixing, loading and pouring of undiluted liquids
Nine out of ten scenarios for which a decrease greater than a factor 1000 is derived involve an activity in which the consumer mixes, loads, or pours an undiluted liquid cleaning product (Annex I, Table A1). Inhalation exposure is anticipated here as substances may evaporate from the opening of the bottle into the personal breathing zone of the consumer. Both the Cleaning Products Fact Sheets of 2006 and 2018 prescribe the “inhalation- exposure to vapour -evaporation- constant release area” model to estimate inhalation exposure. In addition, both fact sheets describe similar defaults for the following parameters:
• the amount of cleaning product in the bottle (product amount = 500 g),
• the area of the opening of the bottle (release area = 20 cm2), • the volume of the personal breathing zone (room volume = 1
m3),
• the time the bottle is open (emission duration = 0.3 min) and • the time the consumer spends in close proximity to the bottle
(exposure duration =0.75 min).
To estimate the mass transfer coefficient, the Cleaning Products Fact Sheet of 2006 suggests using the Langmuir’s model, which generally results in a mass transfer coefficient value in the order of 10,000 m/h, and 22,400 m/h in the case of the fictive substance described in the methods section (see 2.2). By contrast, the updated fact sheet of 2018 suggests a default mass transfer coefficient of 10 m/h, based on a review of different models simulating the mass transfer coefficient of a variety of substances under indoor conditions (RIVM, 2018). This
adaptation of the mass transfer coefficient is critical for the simulation of inhalation exposure estimates by ConsExpo Web, because it leads to a reduction of exposure estimates greater than a factor 1000. By carrying out sensitivity analyses in ConsExpo Web it is found that these
decreases of more than a factor 1000 are independent of other parameters such as the substance weight fraction in the product, molecular weight or vapour pressure. Hence, the reduction in inhalation exposure estimates for the mixing, loading and pouring of undiluted liquid cleaning products applies to all cleaning products and substance ingredients.
The quality of the data referring to the review of different models simulating mass transfer coefficients has been rewarded with a Q-factor of 2 in the Cleaning Products Fact Sheet of 2018. In the earlier version of 2006, there was no Q-factor assigned to the Langmuir approach. Nonetheless, the quality of the data underlying this default is raised,
Page 20 of 34
because the review considers multiple indoor models (Delmaar, 2010; US-EPA, 2016; Weschler & Nazaroff, 2008; RIVM, 2018) while the Langmuir approach refers to a single model under outdoor conditions.
4.1.2 Inhalation of non-volatile substances in sprays
The greatest increases in estimation of inhalation exposure are
considered for scenarios that involve spraying of cleaning products. For glass cleaner spray, the increase of the mean event concentration is even greater than a factor 1000 (Figure 1; Annex I). The defaults
adjusted in 2018 that are responsible for these increases are the particle size distributions (PSDs) of the droplet that are being sprayed. The PSDs as described in the fact sheet of 2006 inaccurately represents the
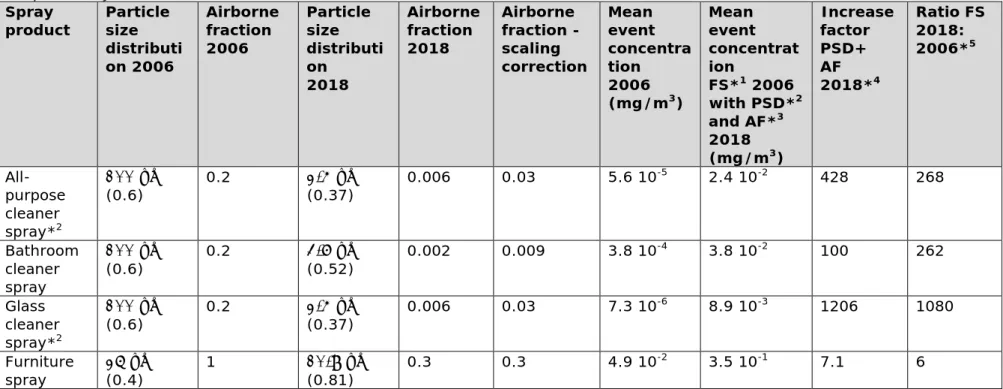
smaller and thus more inhalable droplets (RIVM, 2010). It was already proposed in 2010 by RIVM to draw PSDs fitted to only represent the inhalable droplets that are defined to be smaller than 22.5 μm (RIVM, 2010). As such, the PSDs in the fact sheet of 2006 refer to all droplets sprayed during a cleaning task, whereas the PSDs in the fact sheet of 2018 only refer to the inhalable droplets (< 22.5 μm) sprayed during a cleaning task (Meesters et al., 2018). However, the ConsExpo input value for “airborne fraction” which is defined as the fraction of the sprayed amount that becomes airborne upon spray, should be complementary to fitted PSD. In other words, if the PSD refers to all droplets sprayed, then the airborne fraction should refer to the fraction of the amount of sprayed product that is airborne. If the PSD refers to the inhalable droplets only, the airborne fraction should be scaled in order to refer to the fraction of the amount of sprayed product that is both airborne and < 22.5 μm. Scaling the airborne fraction as such is a correction that decreases the estimated inhalation exposure. Even with this correction though, it is found that adapting the PSDs in the fact sheet of 2006 to those of 2018 yields considerably higher estimates for inhalation exposure for bathroom cleaner, all-purpose cleaner, furniture, and glass cleaner sprays (Table 2).
Table 2. Increase factors for estimated mean event concentration due to adjustment of default particle size distributions and complementary airborne fractions
Spray
product Particle size distributi on 2006 Airborne fraction 2006 Particle size distributi on 2018 Airborne fraction 2018 Airborne fraction - scaling correction Mean event concentra tion 2006 (mg/m3) Mean event concentrat ion FS*1 2006 with PSD*2 and AF*3 2018 (mg/m3) Increase factor PSD+ AF 2018*4 Ratio FS 2018: 2006*5 All-purpose cleaner spray*2 100 μm (0.6) 0.2 2.4 μm (0.37) 0.006 0.03 5.6 10 -5 2.4 10-2 428 268 Bathroom cleaner spray 100 μm (0.6) 0.2 3.6 μm (0.52) 0.002 0.009 3.8 10 -4 3.8 10-2 100 262 Glass cleaner spray*2 100 μm (0.6) 0.2 2.4 μm (0.37) 0.006 0.03 7.3 10 -6 8.9 10-3 1206 1080 Furniture spray 25 μm (0.4) 1 10.8 μm (0.81) 0.3 0.3 4.9 10 -2 3.5 10-1 7.1 6 *1 FS = Fact Sheet
*2 PSD =Particle size distribution expressed as median diameter (arrhythmic coefficient of variation) *3 AF = airborne fraction
*4 The factor of increased mean event concentration by only adjusting the PSD and AF in the scenario of 2006
*5 The ratio of the mean event concentration according to the scenario and defaults of the Fact Sheet 2018 to the mean event concentration according to the scenario and defaults Fact Sheet 2006
Page 22 of 34
Only adapting the PSDs and airborne fractions in the exposure scenarios of the earlier fact sheet from 2006 (Table2) leads to increases that are quite comparable to the actual (corrected) 2018:2006 ratios (Table 2), which indicates that the altered PSD and airborne fraction are most responsible for the increase of the estimated inhalation exposure. The 2018:2006 ratio for bathroom cleaner spray (262) is least comparable to the increase factor of the values in the earlier fact sheet (2006) adjusted for PSD and scaled airborne fraction (100). However, in the updated fact sheet, the amount of product sprayed is also increased considerably for the scenario of spraying bathroom cleaner (mass generation rate x spray duration =34 g in 2006 vs 100 g in 2018). After correction with a factor 3 due for the increased sprayed amount, the increase factor is 292, which is actually quite comparable to the
2018:2006 ratio of 262. Consequently, inhalation exposure estimates of non-volatile substances in cleaning product sprays reported in chemical safety assessment dossiers based on the defaults of the earlier fact sheet of 2006 may now be considered too low.
4.1.3 Volatile substances in sprays and scattered powders
To estimate inhalation exposure to non-volatile substances, the earlier fact sheet suggests using the “inhalation–exposure to spray–
spraying” model. This model does not explicitly describe an approach to
estimate exposure to volatile substances from spraying sprays and scattering powders. Instead, in the earlier fact sheet, it is generally noted: “For volatile substances, the evaporation model is more appropriate with volatile > 0.1 Pa, slightly volatile 0.01 – 0.1 Pa, non-volatile < 0.01 Pa”. In the period after publication of the earlier fact sheet in 2006, a specific model to estimate exposures to volatile substances has been added to the ConsExpo Web version in October 2016, the “inhalation–exposure to spray–instantaneous release” model (Delmaar & Schuur, 2017). In the updated fact sheet, the use of this model has been suggested for exposure to volatile substances. The comparison of exposure estimates for volatile substances in sprays as described in updated fact sheet with exposure estimates derived for non-volatile substances in the earlier fact sheet is unfair, because of the use of different models. As such, no evaluation of the impact for volatile substances in sprays and scatter powders has taken place.
4.1.4 Inhalation of substances in powders
The estimation of inhalation exposure to substances from mixing and loading powders are calculated, resulting in an increase with a factor 10-100 upon when comparing the 2006 defaults with 2018 defaults (Figure 1; Annex I, Table A1). In the updated fact sheet, it is explained that the default “released mass” was not accurately included in the earlier fact sheet of 2006. “Released mass” refers to the amount of powder (g) that
is released to indoor air during loading, whereas in the earlier fact sheet
a default value is considered that originally refers to the product amount
that is inhaled by the consumer during loading (Hendricks, 1970). Based
on the original experiments and home observations performed by Hendricks (1970), it was found “that there is on average 0.27 μg detergent dust exposure per cup of product used”, which refers to the amount of laundry detergent inhaled. In the updated fact sheet, a supposed “released mass” of 8.3 μg is used, based on a recalculation by considering the laboratory conditions described in Hendricks (1970). As
such, estimated inhalation exposure is expected to increase with a factor 33 (8.3 μg /0.27 μg = 33) due to this adjustment of the default for “released mass”.
4.1.5 Dermal loads from surface treatment activities
The increase factors of dermal exposure because of the fact sheet update are less extensive compared to those for inhalation exposure. The highest increase factors for dermal load are between 10 and 100 and are found in the four scenarios describing surface treatment with carpet spot remover spray and liquid, water based metal cleaner, and shoe polish cream. For carpet spot remover spray and liquid and for shoe polish, the product amount used for dermal exposure is assumed to be 1% of the total amount of product used in the earlier fact sheet. In 2018, the product amount available for dermal exposure is calculated assuming that the amount per m2applied to treat the surface is equal to the amount per m2on the exposed skin area of the consumer. Carpet spots and shoes are small areas that are intensively treated. Touching these intensively treated areas yields high dermal loads, explaining the increased dermal loads for carpet spot remover and shoe polish cream. The consumer exposure scenario for the use of metal cleaner also involves intensive treatment of a kitchen worktop, but the product is diluted by wetting the surface. The product amount available for dermal exposure is calculated in the updated fact sheet by first deriving a 2.25 ml volume of water ending up on the hand of the consumer by touching a wet cloth that is used to rub the metal cleaner into the kitchen
worktop. Based on product information, it is described that the product concentration in the water is 0.5 g/ml, so that 1.1 g product ends up on the hand of the consumer. In the earlier fact sheet however, the product amount available for dermal exposure is calculated to be 0.1 g as 1% of the 10 g metal cleaner used for the cleaning task. This difference in deriving the product amount of metal cleaner available for dermal exposure explains the increase in dermal load after the 2018 update. A Q-factor of 1 is assigned to the calculated product amounts available for dermal exposure in the updated fact sheet of 2018. Nonetheless, the Q-factors for these product amounts are more explicitly explained and more refined per exposure scenario compared to the respective Q-factors for the product amounts in 2006 based on the assumption of dermal exposure being 1% of the total amounts of product used.
4.2 Total exposure estimates per product
ConsExpo fact sheets describe for several products different phases in the exposure scenario, such as mixing and loading, application and post-application. Within a risk assessment, the risk assessor needs to
combine the phases. The 2018:2006 ratios as mentioned in the current report all refer to separate exposure estimates per separate phase. This means that for calculation of total consumer exposure to for example substances in a liquid bathroom cleaner, the combination of dermal and inhalation exposure during the mixing and loading phase plus the dermal and inhalation exposure during the cleaning task itself is
required. Consequently, the actual impact of the changes in defaults in the updated Cleaning Products Fact Sheet in 2018 is therefore not directly insightful for cleaning products for which the separate exposure estimates need to be combined.
Page 24 of 34
The simplest approach to account for total exposure is to sum exposure estimates as part of the risk assessment of substances (ECHA, 2016). However, the 2018:2006 ratios as calculated here do not refer to the ratios of exposure estimates of one specific substance, but to a
generically expected difference in exposure to substances while using a cleaning product. Therefore, the impact of the changes in the 2018 fact sheet update on total exposure can only be discussed on a qualitative level by indicating for which cleaning products:
exposure is expected to increase for all routes and phases in the exposure scenarios considered, or
exposure is expected to decrease for all routes and scenarios considered.
As such, the estimated total exposure to cleaning products as a result of the update in parameter defaults increases for dish wash powder, carpet spot remover, purpose cleaner spray, bathroom cleaner spray, all-purpose cleaner wipes, shoe polish cream and toilet rim blocks. In contrast, the estimated total exposure decreases for liquid machine wash detergents, bathroom and floor cleaner liquids, floor stripper, furniture polish liquid, floor cleaner wipes, drain openers and hand wash powder. These expected decreases in total exposure however could still be overruled since in the updated fact sheet new exposure scenarios are introduced that were not considered in the earlier fact sheet. Only for liquid bathroom cleaner and floor stripper, no new scenarios are introduced. For all other cleaning products, a clear comparison of total exposure between the fact sheets on a generic level cannot be made because of the introduction of new consumer exposure scenarios such as hanging the laundry, rubbing-off substance ingredients from cleaned floors by crawling infants, and migration of laundry detergent
5
Conclusions
The extent to which consumer exposure estimation of substances in cleaning product is affected by the update of the Cleaning Products Fact Sheet is evaluated by comparing ConsExpo Web’s estimates for
standardised consumer exposure scenarios described in the earlier fact sheet of 2006 (Prud’homme de Lodder et al., 2006) to those of the updated version (Meesters et al., 2018). It is also analysed what specific defaults are most responsible for the most extensive changes in
exposure estimations. Moreover, all defaults that included in both versions of the fact sheet are sorted according to the underlying data and changes in exposure and assigned Q-factor.
It was found that:
• A slight majority of default values have remained unaltered (56%)
• New data has led to an increase of Q-factors for 20% of the defaults present in both versions of the fact sheet.
• Estimated inhalation exposure is decreased using the updated version for the majority of the consumer exposure scenarios considered (62%).
• In 10 out of 51 scenarios, the estimated inhalation exposure is decreased with at least a factor of 1000. Nine of these scenarios involve an activity in which mixing and loading, or pouring of undiluted liquid cleaning product is involved. The adjustment of the default mass transfer coefficient from 22400 m/h to 10 m/h is responsible for this major impact.
• Major increases in estimation of inhalation exposure (factor 100-1000 or more) are found in consumer exposure scenarios that involve the use of spray products. The defaults responsible for the increase are the particle size distributions and
complementary scaled airborne fractions fitted to represent inhalable spray droplets that are < 22.5 μm.
• Estimated inhalation exposure increased for scenarios that involve mixing and loading of powders. The adjustment of the default value for released mass after re-evaluation of old data is responsible for this.
• The most extensive increases in estimated dermal exposure (factor 10-100) are found for the dermal loads in exposure scenarios in which the consumer touches a wet cloth containing diluted cleaning product, incidentally touches a surface that has just been treated or uses a wet tissue. These increases are caused by different assumptions to derive the product amount that is available for dermal exposure.
• An increase of the total exposure estimated per product is found for dish wash powder, carpet spot remover, all-purpose cleaner spray, bathroom cleaner spray, all-purpose cleaner wipes, shoe polish cream and toilet rim blocks, because of higher exposure estimates across all activities in which the product is used. • A decrease in the total consumer exposure per product is found
for liquid machine wash detergents, bathroom and floor cleaner liquids, floor stripper, furniture polish liquid, floor cleaner wipes,
Page 26 of 34
drain openers and hand wash powder, because of lower exposure estimates across all the activities in which the product is used. In conclusion, the impact of the updated defaults and Q-factors on the estimation of exposure to substances in cleaning products in the updated version of the Cleaning Products Fact Sheet is diverse and strongly depends on the specific cleaning product, the use scenarios in which exposure is anticipated and whether the relevant exposure route is via inhalation or dermal.
6
References
Delmaar J.E., Park M.V.D.Z., Van Engelen J.G.M. 2005. ConsExpo 4.0 Consumer Exposure and Uptake Models Program Manual. RIVM report 320104004/2005
Delmaar J.E. and Bremmer H.J. 2009. The ConsExpo spray model. Modelling and experimental validation of the inhalation exposure of consumers to aerosols from spray cans and trigger sprays. RIVM report 320104005/2009
Delmaar J.E. 2010. Emission of chemical substances from solid matrices: A method for consumer exposure assessment. RIVM report 320104011/2010 Delmaar J.E. and Schuur A.G. 2017. ConsExpo Web Consumer exposure models Model documentation Update for ConsExpo Web 1.0.2.
RIVM Report 2017-0197
ECHA 2016. Guidance on Information Requirements and Chemical Safety Assessment Chapter R.15: Consumer exposure assessment. ECHA-16-G-07-EN July 2016
Hendricks M.H. 1970. Measurement of enzyme laundry product dust levels and characteristics in consumer use. Journal of the American Oil Chemists’ Society, 47, 207–211
Meesters J.A.J., Nijkamp M.M., Schuur A.G. and te Biesebeek J.D. 2018. Cleaning Products Fact Sheet Default parameters for estimating consumer exposure. Updated version 2018. RIVM Report 2016-0179
Prud’homme de Lodder L.C.H., Bremmer H.J. and Van Engelen J.G.M. 2006. Cleaning products fact sheet. To assess the risks for the consumer. Bilthoven, the Netherlands. RIVM report 3204104003/2006.
RIVM. 2010. New default values for the spray model. March. Available online at: http://www.rivm.nl/Documenten_en_publicaties/Wetenschappelijk/Modellen/Mili eu_Leefomgeving/Downloadpagina_van_ConsExpo/New_defaults_for_the_spray _model.org
RIVM. 2018. Overarching issues – ConsExpo Web and fact sheets.
https://www.rivm.nl/en/Topics/C/ConsExpo/Documents/Overarching_issues_Con sExpo_Web_and_fact_sheets_October2018.pdf
Te Biesebeek J.D., Nijkamp M.M., Bokkers B.H.G. and Wijnhoven S.W.P. 2014. General fact sheet. General default parameters for estimating consumer
exposure – Updated version 2014. RIVM Report 090013003/2014
US-EPA (Environmental Protection Agency). 2016. Consumer exposure model (CEM) DRAFT user guide. EPA Contract EP-W-12-010
Weschler C.J. and Nazaroff W.W. 2008. Semivolatile organic compounds in indoor environments. Atmospheric Environment, 42, 9018–9040
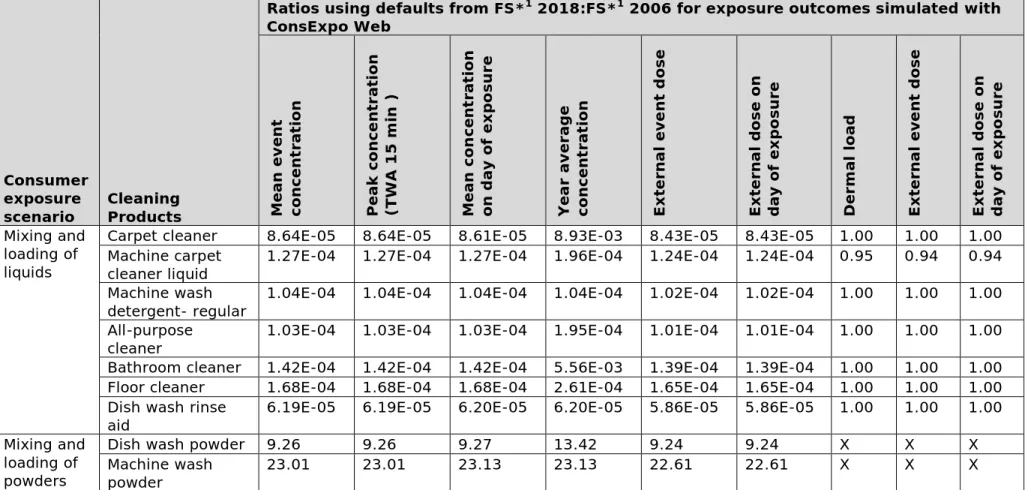
Annex I: 2018:2006 ratios per consumer exposure scenario
Table A1: Ratios of exposure doses related to default the consumer exposure scenarios of cleaning products described in the updated Cleaning Products Fact Sheet of 2018 and the earlier Cleaning Products Fact Sheet of 2006 simulated with ConsExpo Web
Consumer exposure
scenario Cleaning Products
Ratios using defaults from FS*1 2018:FS*1 2006 for exposure outcomes simulated with ConsExpo Web M ea n ev ent co n ce n tr at io n P eak co n ce n tr ati o n (T W A 15 m in ) M ea n co nc en tr at io n on d ay of e xp o su re Y ea r av er ag e co n ce n tr at io n E xt ern al e ve n t d o se E xt er n al d o se o n da y of e xp o su re D er m al lo ad E xt ern al e ve n t d o se E xt er n al d o se o n da y of e xp o su re Mixing and loading of liquids
Carpet cleaner 8.64E-05 8.64E-05 8.61E-05 8.93E-03 8.43E-05 8.43E-05 1.00 1.00 1.00
Machine carpet
cleaner liquid 1.27E-04 1.27E-04 1.27E-04 1.96E-04 1.24E-04 1.24E-04 0.95 0.94 0.94
Machine wash
detergent- regular 1.04E-04 1.04E-04 1.04E-04 1.04E-04 1.02E-04 1.02E-04 1.00 1.00 1.00
All-purpose
cleaner 1.03E-04 1.03E-04 1.03E-04 1.95E-04 1.01E-04 1.01E-04 1.00 1.00 1.00
Bathroom cleaner 1.42E-04 1.42E-04 1.42E-04 5.56E-03 1.39E-04 1.39E-04 1.00 1.00 1.00
Floor cleaner 1.68E-04 1.68E-04 1.68E-04 2.61E-04 1.65E-04 1.65E-04 1.00 1.00 1.00
Dish wash rinse
aid 6.19E-05 6.19E-05 6.20E-05 6.20E-05 5.86E-05 5.86E-05 1.00 1.00 1.00
Mixing and loading of powders
Dish wash powder 9.26 9.26 9.27 13.42 9.24 9.24 X X X
Machine wash
Page 30 of 34
Consumer exposure
scenario Cleaning Products
Ratios using defaults from FS*1 2018:FS*1 2006 for exposure outcomes simulated with ConsExpo Web M ea n ev ent co n ce n tr at io n P eak co n ce n tr ati o n (T W A 15 m in ) M ea n co nc en tr at io n on d ay of e xp o su re Y ea r av er ag e co n ce n tr at io n E xt ern al e ve n t d o se E xt er n al d o se o n da y of e xp o su re D er m al lo ad E xt ern al e ve n t d o se E xt er n al d o se o n da y of e xp o su re Migration of liquids from textile Regular machine wash liquid X X X X X X 0.38 0.36 0.36 Regular machine wash powder X X X X X X 0.29 0.28 0.28 Surface treatment with liquids Abrasive liquid - 0.07 0.12 0.45 0.39 0.44 0.44 9.30 9.19 9.19 All-purpose cleaner 1.02 0.99 1.02 1.92 1.00 1.00 1.04 1.14 1.14 Bathroom cleaning liquid - 0.25 0.35 0.25 9.71 0.24 0.24 0.62 0.67 0.67 Carpet cleaner liquid - 0.96 1.09 2.08 216.31 2.03 2.03 0.43 1.05 1.05 Carpet spot remover liquid - X X X X X X 24.54 8.07 8.07
Floor cleaner liquid
- 0.27 0.28 0.27 0.41 0.26 0.26 0.33 0.36 0.36
Floor polish liquid
- 0.54 0.84 0.54 14.05 0.53 0.53 0.19 0.09 0.09
Acrylatic floor
sealer liquid - 1.89 3.19 1.89 1.89 1.85 1.85 0.35 0.17 0.17
Consumer exposure
scenario Cleaning Products
Ratios using defaults from FS*1 2018:FS*1 2006 for exposure outcomes simulated with ConsExpo Web M ea n ev ent co n ce n tr at io n P eak co n ce n tr ati o n (T W A 15 m in ) M ea n co nc en tr at io n on d ay of e xp o su re Y ea r av er ag e co n ce n tr at io n E xt ern al e ve n t d o se E xt er n al d o se o n da y of e xp o su re D er m al lo ad E xt ern al e ve n t d o se E xt er n al d o se o n da y of e xp o su re liquid - Furniture polish liquid 0.95 0.92 0.95 0.96 0.94 0.94 0.19 0.09 0.09
Toilet cleaner acid
- 0.38 0.38 0.90 0.54 0.88 0.88 1.54 3.03 3.03
Toilet cleaner
bleach - 0.26 0.26 0.60 0.78 0.59 0.59 1.03 2.03 2.03
Water based metal
cleaner 0.41 0.42 0.41 0.41 0.40 0.40 10.52 10.39 10.39 Surface treatment with sprays All-purpose cleaner spray X X X X X X 1.85 1.83 1.83 Bathroom cleaner spray X X X X X X 1.97 1.95 1.95 Carpet spot remover spray X X X X X X 24.54 8.07 8.07 Oven cleaner spray X X X X X X 5.74 2.83 2.83 Spot remover spray X X X X X X 4.77 4.71 4.71 Surface All-purpose 1.47 1.77 5.85 1.41 5.75 5.75 1.01 1.01 1.01
Page 32 of 34
Consumer exposure
scenario Cleaning Products
Ratios using defaults from FS*1 2018:FS*1 2006 for exposure outcomes simulated with ConsExpo Web M ea n ev ent co n ce n tr at io n P eak co n ce n tr ati o n (T W A 15 m in ) M ea n co nc en tr at io n on d ay of e xp o su re Y ea r av er ag e co n ce n tr at io n E xt ern al e ve n t d o se E xt er n al d o se o n da y of e xp o su re D er m al lo ad E xt ern al e ve n t d o se E xt er n al d o se o n da y of e xp o su re treatment
with wipes cleaner wipe Floor cleaner wipe 0.22 0.35 0.22 0.14 0.22 0.22 0.19 0.19 0.19
Surface treatment with cream
Shoe polish cream X X X X X X 12.43 12.27 12.27
Scattering powder(no n-volatile substances ) Abrasive powder 0.94 0.94 0.93 0.82 0.06 0.06 4.71 0.53 0.53 Carpet powder X X X X X X 2.37 0.27 0.27 Spraying of sprays (non-volatile substances ) All-purpose cleaner spray 268 149 268 268 262 262 4.72 1.06 1.06 Bathroom cleaner spray 262 199 251 580 246 246 7.48 1.68 1.68 Furniture spray 6 4 6 6 6 6 2.58 0.58 0.58 Glass cleaner spray 1080 246 1080 195 1061 1061 3.59 0.81 0.81 Oven cleaner trigger spray 77.52 20.27 0.32 0.06 0.32 0.32 X X X
Consumer exposure
scenario Cleaning Products
Ratios using defaults from FS*1 2018:FS*1 2006 for exposure outcomes simulated with ConsExpo Web M ea n ev ent co n ce n tr at io n P eak co n ce n tr ati o n (T W A 15 m in ) M ea n co nc en tr at io n on d ay of e xp o su re Y ea r av er ag e co n ce n tr at io n E xt ern al e ve n t d o se E xt er n al d o se o n da y of e xp o su re D er m al lo ad E xt ern al e ve n t d o se E xt er n al d o se o n da y of e xp o su re spray
Rubbing-off powder Carpet powder X X X X X X 0.33 0.31 0.31
Surface treatment with machines Machine carpet cleaner liquid 1.00 1.10 2.19 227.54 2.14 2.14 0.43 1.05 1.05 Pouring drain opener Sulphuric based
drain opener 2.77E-04 2.77E-04 2.79E-04 1.67E-03 2.73E-04 2.73E-04 1.00 0.94 0.94
Water based drain
opener 5.42E-05 5.42E-05 5.45E-05 3.27E-04 5.32E-05 5.32E-05 1.00 0.94 0.94
Hand wash laundry with powders Regular hand wash powder X X X X X X 0.88 0.97 0.97 Residues on table ware*2 Machine dishwash rinse aid*2 - X X X X X X X X X Manual dishwash liquid*2 X X X X X X X X X Manual
Page 34 of 34
Consumer exposure
scenario Cleaning Products
Ratios using defaults from FS*1 2018:FS*1 2006 for exposure outcomes simulated with ConsExpo Web M ea n ev ent co n ce n tr at io n P eak co n ce n tr ati o n (T W A 15 m in ) M ea n co nc en tr at io n on d ay of e xp o su re Y ea r av er ag e co n ce n tr at io n E xt ern al e ve n t d o se E xt er n al d o se o n da y of e xp o su re D er m al lo ad E xt ern al e ve n t d o se E xt er n al d o se o n da y of e xp o su re
Toilet visit Liquid rim block 1.00 1.00 1.00 1.00 2.62 2.62 X X X
Rim block tablet 1.00 1.00 1.00 1.00 2.63 2.63 X X X
*1 FS = Fact Sheet
*2 The consumer exposure does not refer to inhalation or dermal exposure, but to oral exposure. For dishwash rinse aid the 2018:2006 ratio is 25.4 for both the external event dose and external dose on day of exposure, whereas for manual dishwash liquid the 2018:2006 ratio is 0.94 for both the external event dose and external dose on day of exposure.