Report 340350003/2009
J. Ezendam | F.R. van der Klis | H. van Loveren
Time trends in prevalence of
sensitiza-tion to milk, egg and peanut in the
Netherlands
RIVM Report 340350003/2009
Time trends in prevalence of sensitization to milk, egg
and peanut in the Netherlands
J. Ezendam, Laboratory for Health Protection Research
F.R. van der Klis, Laboratory for Infectious Diseases and Perinatal Screening H. van Loveren, Laboratory for Health Protection Research
Contact: J. Ezendam
Laboratory for Health Protection Research Janine.Ezendam@rivm.nl
This investigation has been performed by order and for the account of Food and Consumer Products Safety Authority, within the framework of 9.4.2 Voedselovergevoeligheid bij kinderen en volwassenen
© RIVM 2009
Parts of this publication may be reproduced, provided acknowledgement is given to the 'National Institute for Public Health and the Environment', along with the title and year of publication.
Abstract
Time trends in prevalence of sensitization to milk, egg and peanut in the Netherlands
In the Netherlands, the number of people with a peanut allergy increased in the period from 1995 to 2007. There are no indications of any increase in food allergies for cow’s milk and eggs. These results were obtained from a study carried out by the National Institute for Public Health and the Environment (RIVM) by order of the Food and Consumer Product Safety Authority. The aim of this research was to investigate whether there are any trends in the prevalence of food allergies in the Netherlands. In this study, the prevalence of food allergy was based on the presence of IgE antibodies specific for peanuts, cow’s milk and eggs in human blood - a measure for allergic sensitization. Approximately 30 to 60% of these sensitized subjects will develop allergic symptoms.
The prevalence of allergic diseases, such as asthma and eczema has increased in Western countries during the nineteen-eighties and nineties. There are indications that the prevalence of peanut allergy is also increasing. It is currently unknown which genetic and environmental factors are involved in this increase. Peanut allergy has a large impact on a person’s quality of life. Allergic people who
accidentally ingest peanuts can develop life-threatening symptoms, which can only be prevented by eliminating peanuts from the diet. This is not always easy, since peanuts are used as ingredients in many food products.
In this study the presence of IgE antibodies for the food allergens was assessed in blood. The blood samples were obtained in two different time periods: in 1995/1996 and in 2006/2007. The prevalence of sensitization was assessed in four age groups: 0-4 years, 5-18 years, 19-40 years and 41-79 years.
Key words:
Rapport in het kort
Trends in het voorkomen van voedselallergie voor pinda, melk en ei in Nederland
Tussen 1995 en 2007 is in Nederland het aantal mensen dat allergisch is voor pinda’s toegenomen. Voedselallergie voor koemelk en ei is niet toegenomen. Dit blijkt uit onderzoek van het RIVM uitgevoerd in opdracht van de Voedsel en Warenautoriteit (VWA) om trends vast te stellen in de mate waarin voedselallergie in Nederland voorkomt. In het onderzoek is de mate waarin voedselallergie voorkomt gebaseerd op de aanwezigheid van IgE-antistoffen tegen pinda, melk of ei in bloed, een maat voor allergische sensibilisatie. Ongeveer 30 tot 60% van de personen met deze antistoffen heeft daadwerkelijk allergische klachten.
In westerse landen zijn in de jaren tachtig en negentig van de vorige eeuw allergische aandoeningen zoals astma en eczeem sterk toegenomen. Enkele studies tonen aan dat voedselallergie voor pinda ook aan het toenemen is. Het is echter nog niet bekend welke genetische en omgevingsfactoren deze toename kunnen verklaren. Pinda-allergie heeft een grote invloed op de kwaliteit van leven. Allergische mensen die per ongeluk pinda’s eten kunnen daar levensbedreigende symptomen van ondervinden. Dit kan alleen voorkomen worden door geen pinda’s te eten. Dat is niet altijd gemakkelijk omdat pinda’s in veel voedingsproducten worden verwerkt.
Voor deze studie is de aanwezigheid van IgE-antistoffen tegen de onderzochte voedingsstoffen in bloed bepaald. De bloedmonsters zijn in twee perioden afgenomen, waartussen ongeveer tien jaar tijd zit (1995/1996 en 2006/2007). De mate waarin sensibilisatie voorkomt is voor vier leeftijdscategorieën bepaald: 0 tot 4 jaar, 5 tot 18 jaar, 19 tot 40 jaar en 41 tot 79 jaar.
Trefwoorden:
pinda-allergie, voedselallergie, prevalentie, trends
Contents
Summary 6
1 Introduction 7
2 Methods 9
2.1 Study design and population 9
2.2 Sample size and serum collection 9
2.3 IgE measurements 10
2.4 Statistics 10
3 Results 11
3.1 Prevalence of cow’s milk sensitization 11
3.2 Prevalence of chicken egg sensitization 12
3.3 Prevalence of peanut sensitization 13
3.4 Differences in peanut-specific IgE titres between Pienter 1 and 2 14
4 Discussion 15
Acknowledgement 17
Summary
In developed countries allergic diseases affect 15-30% of the population and the prevalence of asthma and atopic eczema has increased in the past. Currently it seems that this prevalence has reached a plateau. There are indications that the prevalence of food allergy and especially peanut allergy has been increasing in Western countries as well. To investigate time trends in food allergy in the Netherlands, an immunosurveillance was conducted in which sensitization was measured to cow’s milk, chicken egg and peanut in children and adults.
The sera for this immunosurveillance were obtained from two sequential nationwide serum banks which were collected for the Pienter studies in 1995-1996 and 2006-2007. Sensitization to food allergens was assessed with a radioallergosorbent test (RAST) and IgE titres equal to or higher than 0.35 or 1.2 IU/ml were used to select sensitized subjects. Sensitization was assessed in four age groups: 0-4 years (n=452), 5-18 years (n=1067), 19-40 years (n=1493) and 41-79 years (n=2006).
There was no increase in sensitization to milk and egg when Pienter 1 and 2 were compared. However, peanut sensitization increased in the period from 1995-1996 to 2006-2007, except in the age group 5-18 years. In adults (19-79 years) the most prominent changes were observed, and these were significant when all sensitized subjects were compared. At higher IgE levels (≥ 1.2 IU/ml) the time trend was still present in the adults, but failed to reach significance. Peanut allergy develops in the majority of patients during childhood and is in almost all cases a lifelong problem. The most significant differences were observed in the adults, who were probably sensitized at a younger age. Therefore, the observed trends between 1995 and 2007 might be a reflection of events that took place when these subjects were much younger and the rise in prevalence of peanut sensitization in these individuals may be due to conditions that were apparent during that earlier time period.
This study demonstrates a time trend in peanut sensitization, which is in line with what has been shown previously in studies from the UK and Australia. Currently, it is unknown how this increase in peanut allergy can be explained.
1
Introduction
It is estimated that 15-30% of the population in developed countries is affected with one or more allergies (Aberg et al., 1999). Epidemiological studies have provided strong evidence for a rise in the prevalence of allergic diseases during the last decades (Bach, 2002). This has especially been shown for allergic asthma and rhinitis in the period from 1980 through the mid 1990s (Woolcock and Peat, 1997; Aberg et al., 1999, Ross Anderson, 2007 #147; Upton et al., 2000; CDC, 2006; Ross Anderson et al., 2007). After this increase, the prevalence of asthma has remained relatively stable and a plateau seems to be reached or the prevalence is decreasing slightly (Braun-Fahrlander et al., 2004; Nowak et al., 2004; Mommers et al., 2005; Zollner et al., 2005; Smit and Van Schayck, 2006).The prevalence of atopic eczema has increased as well in developed countries but has reached a plateau during the last decade. In developing countries, however, the prevalence of atopic dermatitis is still increasing (Williams, 1992; Williams et al., 2008).
There is evidence that food allergies are on the rise as well. In the US, a cross-sectional survey was conducted to study trends in food allergy. In the period from 1997 through 2007 the prevalence of self-reported food allergy increased significantly from 3.2% to 3.9%. Furthermore, the ambulatory care visits and hospitalizations related to food allergy increased (Branum and Lukacs, 2008; Branum and Lukacs, 2009). In addition, a telephone survey conducted in 1997 and in 2000 in the US has shown that reported peanut allergy has increased from 0.4% to 0.8% in children aged 0-18 years (Sicherer et al., 2003). Also, in the UK it has been demonstrated that the number of hospital admissions for food-related anaphylaxis has increased since 1990 (Gupta et al., 2007). These studies indicate that food allergies are increasing, but it cannot be excluded that these estimates are influenced by increasing awareness of physicians and patients.
There is a limited number of longitudinal studies that has assessed the prevalence of sensitization to food allergens or the prevalence of food allergy diagnosed with food challenges. Such studies would provide more quantitative data that can be used to estimate time trends. In the UK, time trends in peanut sensitization and allergy were studied in three birth cohorts from the same geographical area. Sensitization was assessed with skin prick testing in children aged 3-4 years. It was shown that the prevalence of peanut sensitization increased significantly from 1.3% in those born in 1989 to 3.3% in those born between 1994 and 1996 (Grundy et al., 2002). In children born between 2001 and 2002 the prevalence of sensitization decreased to 2%. Similarly, the increase of clinical peanut allergy increased in the first two cohorts from 0.5% to 1.4% and than decreased slightly to 1.2% (Venter et al., 2009). A retrospective study in Australia has shown that in children aged 0-6 years the incidence of clinically diagnosed peanut allergy rose from 0.73% in those born in 2001 to 1.15% in those born in 2007 (Mullins et al., 2009). In contrast, in a follow-up study conducted in Canada, the prevalence of
clinically diagnosed peanut allergy in 7-year old children did not change between 2000-2002 and 2005-2007 (Ben-Shoshan et al., 2009). Hence, there is evidence that there is an increase in food allergy and especially peanut allergy, but similar to other allergies this increase may have reached a plateau in the last decade.
In order to get more insight in time trends in the prevalence of food allergy in the Netherlands, the Dutch Food and Consumer Products Safety Authority (VWA) has initiated this project. The RIVM has conducted two different studies to establish if food allergy is on the rise in the Netherlands. In the first immunosurveillance, no evidence was found for an increase in sensitization to milk and egg in 1-year old Dutch children in the period from 1992 to 2003 (Ezendam et al., 2008). To further investigate trends in food sensitization, a second immunosurveillance was conducted in which
for this immunosurveillance were obtained from two sequential national serum banks, which were collected for the Pienter studies in 1995-1996 and 2006-2007 (De Melker and Conyn-Van Spaendonck, 1998; Van der Klis et al., 2009).
2
Methods
2.1
Study design and population
In order to investigate trends in the prevalence of sensitization to food allergens, food-specific IgE was measured in sera obtained from two nationwide serum banks. These serum banks were collected for two sequential cross-sectional population-based studies, called the Pienter studies (Peiling Immunisatie
Effect Nederland Ter Evaluatie van het Rijksvaccinatieprogramma). The Pienter study was initiated to
evaluate the efficacy of the Dutch vaccination program. The first serum bank was collected from October 1995 to December 1995 in collaboration with the public health services (Pienter 1). A total of 8539 blood samples were collected from subjects in the ages 0-79 years, covering all areas of the Netherlands (De Melker and Conyn-Van Spaendonck, 1998). The second national serum bank was collected from February 2006 to June 2007 and the study design was kept similar to that of Pienter 1. A total of 6386 sera were collected in subjects aged 0-79 years (Van der Klis et al., 2009).
2.2
Sample size and serum collection
In the sera from Pienter 1 and 2 specific IgE against cow’s milk, chicken egg and peanut was measured in four age groups: 0-4 years old, 5-18 years old, 19-40 years old and 41-79 years old. A power analysis was performed to calculate the sample size in each age group. For the age groups 0-4 years and 5-18 years, a sample size of 500 subjects was recommended, assuming a change in prevalence from 10 to 15% at 5% levels of significance and a power of 80%. For the age groups 19-40 years and 41-79 years a sample size of 1000 subjects was recommended to detect a change in prevalence from 6 to 9%.
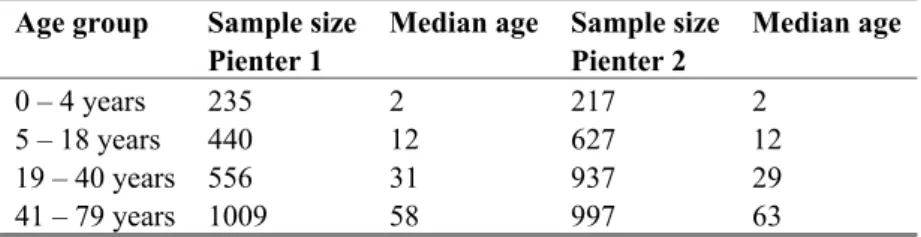
The databases from the Pienter studies were used to select randomly sufficient numbers of subjects. It was not possible to obtain sufficient samples in all age groups, due to limited availability. The sample sizes are summarized in Table 1. There were not enough samples available in age group 0-4 years from Pienter 1 and 2 and in age group 19-40 years from Pienter 1.
Table 1 Number of analyzed sera per age group Age group Sample size
Pienter 1
Median age Sample size Pienter 2 Median age 0 – 4 years 235 2 217 2 5 – 18 years 440 12 627 12 19 – 40 years 556 31 937 29 41 – 79 years 1009 58 997 63
In Table 1 the median age in each age group is shown as well. The distribution of the different ages within an age group is similar in all age groups, except in age group 41-79 year. In this age group the median age in Pienter 2 was 5 years higher than in Pienter 1, which is attributed to a larger proportion of subjects aged 65 years and older.
2.3
IgE measurements
The measurement of specific IgE for peanut, milk and egg in serum was performed at Sanquin in Amsterdam, The Netherlands. Specific IgE was assessed with a radioallergosorbent test (RAST) as described previously (Aalberse et al., 1981). Sera were first screened by performing a RAST for a combination of the three allergens. Then, RAST was performed for the individual allergens in the positive samples (IgE ≥ 0.35 IU/ml). Sensitization to milk, egg or peanut was assessed by using two cut-off levels: IgE levels equal or higher than RAST class 1 (≥ 0.35 IU/ml) or equal to or higher than RAST class 2 (≥ 1.2 IU/ml).
2.4
Statistics
Statistical analyses were performed by using SPPS statistical software (SPSS Inc., Chicago, IL, USA). Differences between Pienter 1 and 2 concerning the prevalence of sensitization were assessed with a chi-square test.
3
Results
3.1
Prevalence of cow’s milk sensitization
In Figure 1 the prevalence of cow’s milk sensitization is shown. This figure presents all sensitized subjects with IgE titres ≥ 0.35 IU/ml. Furthermore, Table 2 summarizes data on the prevalence of cow’s milk sensitization using two cut-off values. The highest prevalence rates were found in children aged 0-4 years and cow’s milk sensitization declined with ageing. There were no significant differences between Pienter 1 and Pienter 2 when a cut-off value of 0.35 IU/ml was used. However, when a higher cut-off level was used (IgE titres ≥ 1.2 IU/ml) sensitization was significantly lower in the age group 19-40 years in Pienter 2 compared to Pienter 1.
0 5 10 15 20 25 0-4 5-18 19-40 41-79 Age groups % sen sit izati on
Figure 1: Cow’s milk sensitization in 1995/1996 and 2006/2007.
The prevalence of sensitization was calculated by comparing the number of sensitized subjects (IgE ≥ 0.35 IU/ml) with the total number of subjects analyzed (expressed as %). Sera were sampled in 1995/1996 (Pienter 1, dark grey) or 2006/2007 (Pienter 2, light grey).
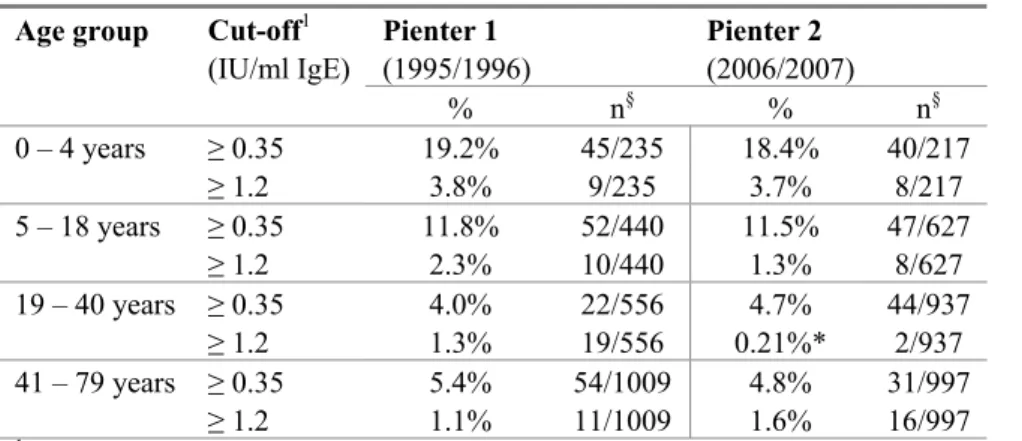
Table 2: Prevalence of cow’s milk sensitization Age group Cut-off1
(IU/ml IgE) Pienter 1 (1995/1996) Pienter 2 (2006/2007) % n§ % n§ 0 – 4 years ≥ 0.35 19.2% 45/235 18.4% 40/217 ≥ 1.2 3.8% 9/235 3.7% 8/217 5 – 18 years ≥ 0.35 11.8% 52/440 11.5% 47/627 ≥ 1.2 2.3% 10/440 1.3% 8/627 19 – 40 years ≥ 0.35 4.0% 22/556 4.7% 44/937 ≥ 1.2 1.3% 19/556 0.21%* 2/937 41 – 79 years ≥ 0.35 5.4% 54/1009 4.8% 31/997 ≥ 1.2 1.1% 11/1009 1.6% 16/997
1 The prevalence of sensitization to cow’s milk was calculated by using two cut-off values: 0.35 IU/ml and 1.2 IU/ml
IgE. § n is the number of sensitized subjects compared to the total number of subjects analyzed. * Significantly different
3.2
Prevalence of chicken egg sensitization
The frequency of egg sensitization was in both cohorts lower than milk and peanut sensitization (Figure 2, Table 3). The highest frequency of egg sensitization was found in children aged 0-4 years. There was a decrease in egg sensitization in age groups 5-18 and 19-40 years, but in age group 41-79 years an increase of egg sensitization was observed. There was no difference between Pienter 1 and 2. 0 1 2 3 4 5 6 7 0-4 5-18 19-40 41-79 Age groups % se nsit iz ati on
Figure 2: Chicken egg sensitization in 1995/1996 and 2006/2007.
The prevalence of sensitization was calculated by comparing the number of sensitized subjects (IgE ≥ 0.35 IU/ml) with the total number of subjects analyzed (expressed as %). Sera were sampled in 1995/1996 (Pienter 1, dark grey) or 2006/2007 (Pienter 2, light grey).
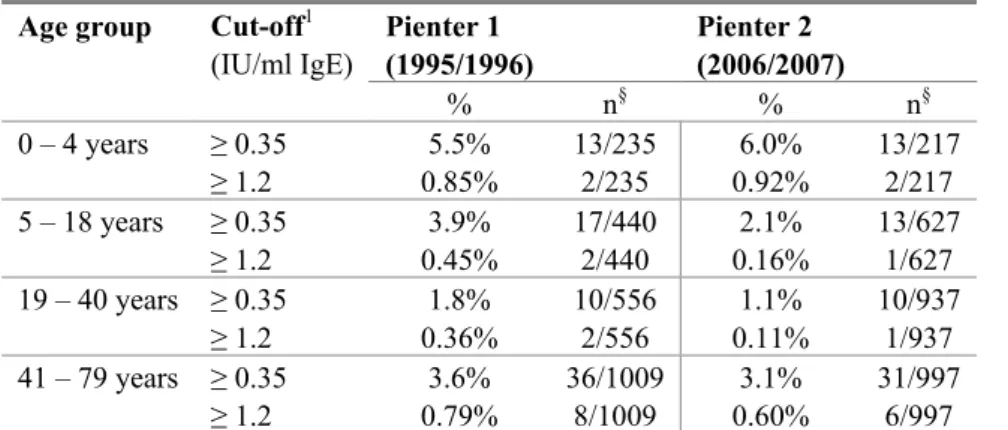
Table 3 Prevalence of chicken egg sensitization Age group Cut-off1
(IU/ml IgE) Pienter 1 (1995/1996) Pienter 2 (2006/2007) % n§ % n§ 0 – 4 years ≥ 0.35 5.5% 13/235 6.0% 13/217 ≥ 1.2 0.85% 2/235 0.92% 2/217 5 – 18 years ≥ 0.35 3.9% 17/440 2.1% 13/627 ≥ 1.2 0.45% 2/440 0.16% 1/627 19 – 40 years ≥ 0.35 1.8% 10/556 1.1% 10/937 ≥ 1.2 0.36% 2/556 0.11% 1/937 41 – 79 years ≥ 0.35 3.6% 36/1009 3.1% 31/997 ≥ 1.2 0.79% 8/1009 0.60% 6/997
1 The prevalence of sensitization to chicken egg was calculated by using two cut-off values: 0.35 IU/ml and
1.2 IU/ml IgE. § n is the number of sensitized subjects compared to the total number of subjects analyzed.
3.3
Prevalence of peanut sensitization
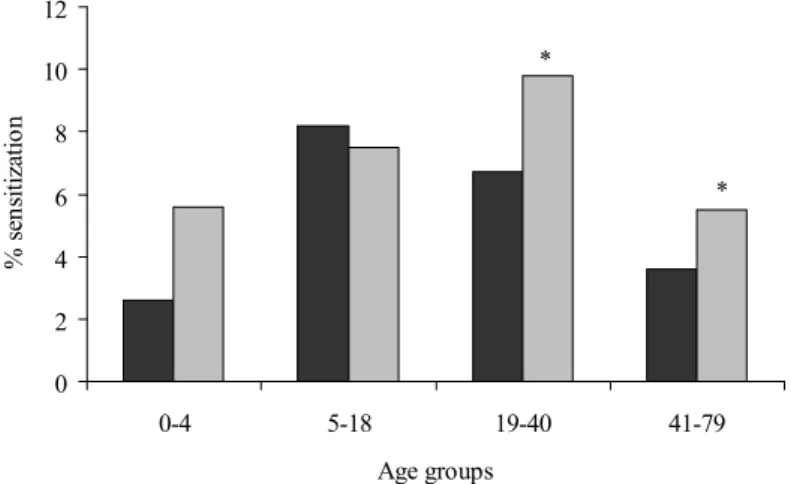
In Figure 3 and Table 4 the results for peanut sensitization are summarized. In Pienter 1, the prevalence of peanut sensitization increases approximately 4-fold from 0-4 to 5-18 years. Thereafter, a decline in peanut sensitization is observed in the other age groups. In Pienter 2 the prevalence of peanut
sensitization increases further in age group 19-40 years and then declines again. The prevalence of peanut sensitization is higher in Pienter 2 than in Pienter 1, except for the age group 5-18 years. When all sensitized subjects were analyzed (IgE ≥ 0.35 IU/ml), this increase was significant in age groups 19-40 years and 41-79 years. When a higher cut-off value of 1.2 IU/ml was used, the prevalence rates in the age groups 19-40 years and 41-79 years are still higher in Pienter 2, but these increases failed to reach significance. 0 2 4 6 8 10 12 0-4 5-18 19-40 41-79 Age groups % sen sit izat io n * *
Figure 3: Peanut sensitization in 1995/1996 and 2006/2007.
The prevalence of sensitization was calculated by comparing the number of sensitized subjects (IgE ≥ 0.35 IU/ml) with the total number of subjects analyzed (expressed as %). Sera were sampled in 1995/1996 (Pienter 1, dark grey) or 2006/2007 (Pienter 2, light grey). * Significantly different from Pienter 1 (p<0.05)
Table 4: Prevalence of peanut sensitization Age group Cut-off1
(IU/ml IgE) Pienter 1 (1995/1996) Pienter 2 (2006/2007) % n§ % n§ 0 – 4 years ≥ 0.35 2.6% 6/235 5.6% 12/217 ≥ 1.2 2.1% 5/235 2.8% 6/217 5 – 18 years ≥ 0.35 8.2% 36/440 7.5% 47/627 ≥ 1.2 4.3% 19/440 3.5% 22/627 19 – 40 years ≥ 0.35 6.7% 37/556 9.8%* 92/937 ≥ 1.2 3.4% 19/556 5.4% 51/937 41 – 79 years ≥ 0.35 3.6% 36/1009 5.5%* 55/997 ≥ 1.2 1.2% 12/1009 2.0% 20/997
1 The prevalence of sensitization to peanut is calculated by using two cut-off values: 0.35 IU/ml and 1.2 IU/ml IgE. § n is the number of sensitized subjects compared to the total number of subjects analyzed. * Significantly different from
3.4
Differences in peanut-specific IgE titres between Pienter 1 and 2
In order to see if there was a difference in the height of peanut-specific IgE titres between Pienter 1 and 2, the IgE titres were categorized in 5 RAST classes: RAST 1: 0.35 – 1.1 IU/ml,
RAST2: 1.2 – 2.7 IU/ml, RAST3: 2.9 - 7.7 IU/ml, RAST4: 7.8 – 66 IU/ml and RAST 5: ≥ 66 IU/ml. The distribution of the different RAST classes in all sensitized subjects is shown in Figure 4.
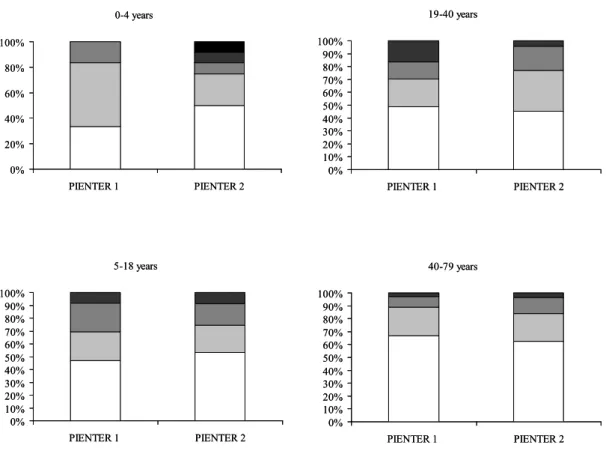
In the age group 0.-4 years the majority of the sensitized subjects had IgE titres in the categories RAST 1 and 2. However, IgE levels were higher in Pienter 2 than in Pienter 1. In 16.7% of the children, the IgE titres were RAST class 4 and 5, whereas these titres were absent in Pienter 1. In the age group 19-40 years the distribution of RAST classes was different between Pienter 1 and 2. In Pienter 1. In Pienter 1, more subjects had RAST class 4 titres than in Pienter 2. There were no large differences (< 5%) between Pienter 1 and 2 in the RAST class distribution in age groups 5-18 years and 40-79 years. 0-4 years 0% 20% 40% 60% 80% 100% PIENTER 1 PIENTER 2 5-18 years 0% 10% 20% 30% 40% 50% 60% 70% 80% 90% 100% PIENTER 1 PIENTER 2 19-40 years 0% 10% 20% 30% 40% 50% 60% 70% 80% 90% 100% PIENTER 1 PIENTER 2 40-79 years 0% 10% 20% 30% 40% 50% 60% 70% 80% 90% 100% PIENTER 1 PIENTER 2 0-4 years 0% 20% 40% 60% 80% 100% PIENTER 1 PIENTER 2 5-18 years 0% 10% 20% 30% 40% 50% 60% 70% 80% 90% 100% PIENTER 1 PIENTER 2 19-40 years 0% 10% 20% 30% 40% 50% 60% 70% 80% 90% 100% PIENTER 1 PIENTER 2 40-79 years 0% 10% 20% 30% 40% 50% 60% 70% 80% 90% 100% PIENTER 1 PIENTER 2
Figure 4: Distribution of peanut-specific IgE titres in 1995/1996 and 2006/2007.
The IgE titres were categorized in five RAST classes (RAST 1(white bars), RAST 2 (light grey bars), RAST3 (dark grey bars), RAST 4 (darker grey bars), RAST 5 (black bars). Distribution of the RAST classes in Pienter 1 and 2 is displayed for each age group.
4
Discussion
In this immunosurveillance an increase in peanut sensitization was shown in the period from 1996-1997 to 2006-2007, which was especially observed in children aged 0-4 years and in adults aged 19-79 years but not in children aged 5-18 years. The observed increase in adults was significant when a cut-off level of 0.35 IU/ml was used. There was no trend in sensitization to cow’s milk and chicken egg, which is in line with our previous study. In this study, we have shown that there is no evidence for an increase in cow’s milk and egg sensitization in 1 year old Dutch children born in 1992-1994 and those born in 2002-2003 (Ezendam et al., 2008).
The observed time trend in peanut sensitization is in line with what has been shown in other studies. In these studies an increase in peanut sensitization was shown, which was accompanied by a rise in clinical peanut allergy (Mullins et al., 2009; Venter et al., 2009). In the UK it was possible to compare three sequential cohorts and the first time point was earlier than in our study. Peanut sensitization was assessed in three year old children born in 1989 or in 1996 and a tree-fold increase in peanut
sensitization and clinical peanut allergy was shown. However, a slight decrease was observed in children born in 2001-2002, suggesting that the prevalence reached a plateau (Venter et al., 2009). The increase in the Australian study was shown in children born in 2001 and those born in 2007 (Mullins et al., 2009). A study from Canada shows no increase in clinically diagnosed peanut allergy in seven year old children that were born between 1993-1995 and those born in 1998-2000 (Ben-Shoshan et al., 2009). Possibly, in this period in Canada a plateau was already reached, similar as was shown in the three sequential cohorts from the UK.
In our immunosurveillance both children and adults were included, whereas the abovementioned studies only included children. The onset of peanut sensitization and allergy is predominantly in childhood. Approximately 95% of the peanut allergic patients have their first reaction under the age of 15 years (Moneret-Vautrin et al., 1998; Mullins et al., 2009). Furthermore, in almost all patients peanut allergy is a lifelong problem, which resolves only in a minority of the patients. In this
immunosurveillance the trends between different age groups are compared in two time periods. It is to be expected that in the adults, peanut sensitization has occurred at a young age. The differences between the two cohorts could be a reflection of changes in prevalence that occurred earlier than between 1996-2007. The most significant differences were observed in the adults, which may be a reflection of events that took place during their childhood, and the rise in prevalence of peanut
sensitization in these individuals may be due to conditions that were apparent during that time period. The increase in peanut allergy which has been shown in a limited number of longitudinal studies might simply be a reflection of the general increase in atopic diseases. Probably there are general genetic and environmental factors that have an impact on all atopic diseases, including food allergy. There is limited data available on genetic and environmental factors that influence food allergy. One important genetic factor that increases the risk on food allergy and other allergies is a family history of atopic diseases (Hourihane et al., 1996). There is currently not much evidence for a role of the ‘hygiene hypothesis’, which postulates that a reduced microbial burden impairs the maturation of
immunoregulatory mechanisms resulting in a rise in allergies (Strachan, 1989; Romagnani, 2004). The association between dog ownership and lower risk on food allergy (Gern et al., 2004) gives some evidence that increased exposure to (dog) microbes beneficially influences the development of food allergy. The absence of a time trend in milk and egg sensitization could imply that there are certain factors that specifically influence peanut allergy and could explain the observed time trend.
There are numerous risk factors proposed that could influence peanut allergy, but the scientific evidence for a role of these factors is lacking (Boulay et al., 2008). One of the new hypothesis is the impact of early life exposure to peanuts. For many years, the American Academy of Pediatrics and the UK government recommended maternal dietary avoidance during pregnancy, lactation and in the fist years of life. Recently, these recommendations have been abandoned because of lack of conclusive evidence for a protective effect (Hourihane et al., 2007). Interestingly, there is anecdotic evidence that it might be the other way around. In some countries peanut is introduced to the diet early in life and consumed in relative high amounts already at an early age, as is the case for example in Israel. Nevertheless, the prevalence of peanut allergy is low in this country, whereas the prevalence of other food allergies is comparable to other countries (Dalal et al., 2002; Du Toit et al., 2008). These
observations have introduced a new hypothesis, that early life introduction of peanut might lead to oral tolerance and protects against peanut sensitization. Currently, this is not proven in epidemiological studies, but in experimental animal studies evidence for this hypothesis has been found. In mice it was shown that low-dose peanut exposure during pregnancy and lactation reduced the risk on peanut allergy (Lopez-Exposito et al., 2009). In the current study, no information was available on peanut
consumption during pregnancy. Currently, in the UK an epidemiological study is ongoing to investigate this hypothesis in humans.
In conclusion, we have shown that in the Netherlands there is a time trend in peanut sensitization in the period from 1996-1997 to 2006-2007, which was especially seen in adults. Currently there is
insufficient knowledge on genetic and environmental risk factors that could explain this rise in peanut sensitization. Insight in environmental factors that influence peanut allergy and also food allergy is important in order to develop preventive strategies to reduce the burden of peanut allergy and other food allergies.
Acknowledgements
All members of the Pienter 1 and 2 project teams are acknowleged and especially all participants of the Pienter 1 and 2 studies are thanked for their contribution. We would like to thank Bert Verlaan from the Laboratory for Health Protection Research and Gaby Smits and Ton Marcek from the Laboratory for Infectious Diseases and Perinatal Screening for the selection and collection of the samples. We would thank Dr. Alet Wijga from Centre for Prevention and Health Services Research for performing the power analysis and for the fruitful discussions on the statistical analysis of the data. The IgE
measurements were performed at Sanquin Research in Amsterdam and the authors kindly acknowledge Steven Stapel and Astrid van Leeuwen for this.
References
Aalberse RC, Koshte V and Clemens JG (1981) Immunoglobulin E antibodies that crossreact with vegetable foods, pollen, and Hymenoptera venom. J Allergy Clin Immunol 68, 356-364. Aberg N, Berlin A, Bertollini R, Bonini S, Brunekreef B, Carlsen KH and Weck Ad (1999) European
Allergy White Paper Update.
Bach JF (2002) The effect of infections on susceptibility to autoimmune and allergic diseases. N Engl J Med 347, 911-920.
Ben-Shoshan M, Kagan RS, Alizadehfar R, Joseph L, Turnbull E, St Pierre Y and Clarke AE (2009) Is the prevalence of peanut allergy increasing? A 5-year follow-up study in children in Montreal. Journal of Allergy and Clinical Immunology 123, 783-788.
Boulay A, Houghton J, Gancheva V, Sterk Y, Strada A, Schlegel-Zawadzka M, Sora B, Sala R, van Ree R and Rowe G (2008) A EuroPrevall review of factors affecting incidence of peanut allergy: priorities for research and policy. Allergy 63, 797-809.
Branum AM and Lukacs SL (2008) Food allergy among U.S. children: trends in prevalence and hospitalizations. . NCHS data brief No. 10 National Center for Health Statistics
Branum AM and Lukacs SL (2009) Food Allergy Among Children in the United States. Pediatrics, peds.2009-1210.
Braun-Fahrlander C, Gassner M, Grize L, Takken-Sahli K, Neu U, Stricker T, Varonier HS, Wuthrich B and Sennhauser FH (2004) No further increase in asthma, hay fever and atopic sensitisation in adolescents living in Switzerland. Eur Respir J 23, 407-413.
CDC (2006) The state of childhood asthma, United States, 1980 - 2005. U.S. Department of Health and Human Services. Centers for Disease Control and Prevention. National Center for Health Statistics. Advance Data From Vital and Health Statistics Number 381
Dalal I, Binson I, Reifen R, Amitai Z, Shohat T, Rahmani S, Levine A, Ballin A and Somekh E (2002) Food allergy is a matter of geography after all: sesame as a major cause of severe
IgE-mediated food allergic reactions among infants and young children in Israel. Allergy 57, 362-365.
De Melker HE and Conyn-Van Spaendonck MAE (1998) Immunosurveillance and the evaluation of national immunization programmes: a population-based approach. Epidemiology and Infection 121, 637-643.
Du Toit G, Katz Y, Sasieni P, Mesher D, Maleki SJ, Fisher HR, Fox AT, Turcanu V, Amir T, Zadik-Mnuhin G, Cohen A, Livne I & Lack G (2008) Early consumption of peanuts in infancy is associated with a low prevalence of peanut allergy. Journal of Allergy and Clinical Immunology 122, 984-991.
Ezendam J, Wijga AH, Thijs C, Brunekreef B, Aalberse RC and Van Loveren H (2008) Trends in the prevalence of sensitization to milk and egg in Dutch children. RIVM report 340350001. Gern JE, Reardon CL, Hoffjan S, Nicolae D, Li Z, Roberg KA, Neaville WA, Carlson-Dakes K, Adler
K, Hamilton R, Anderson E, Gilbertson-White S, Tisler C, DaSilva D, Anklam K, Mikus LD, Rosenthal LA, Ober C, Gangnon R and Lemanske RF (2004) Effects of dog ownership and genotype on immune development and atopy in infancy. Journal of Allergy and Clinical Immunology 113, 307-314.
Grundy J, Matthews S, Bateman B, Dean T and Arshad SH (2002) Rising prevalence of allergy to peanut in children: Data from 2 sequential cohorts. J Allergy Clin Immunol 110, 784-789.
Gupta R, Sheikh A, Strachan DP and Anderson HR (2007) Time trends in allergic disorders in the UK. Thorax 62, 91-96.
Hourihane JO, Dean TP and Warner JO (1996) Peanut allergy in relation to heredity, maternal diet, and other atopic diseases: results of a questionnaire survey, skin prick testing, and food challenges. Bmj 313, 518-521.
Hourihane JOB, Aiken R, Briggs R, Gudgeon LA, Grimshaw KEC, DunnGalvin A and Roberts SR (2007) The impact of government advice to pregnant mothers regarding peanut avoidance on the prevalence of peanut allergy in United Kingdom children at school entry. Journal of Allergy and Clinical Immunology 119, 1197-1202.
Lopez-Exposito I, Song Y, Jarvinen KM, Srivastava K and Li XM (2009) Maternal peanut exposure during pregnancy and lactation reduces peanut allergy risk in offspring. J Allergy Clin Immunol 124, 1039-1046.
Mommers M, Gielkens-Sijstermans C, Swaen GMH and Van Schayck CP (2005) Trends in the prevalence of respiratory symptoms and treatment in Dutch children over a 12 year period: results of the fourth consecutive survey. Thorax 60, 97-99.
Moneret-Vautrin DA, Rancé F, Kanny G, Olsewski A, Gueant JL, Dutau G and Guerin L (1998) Food allergy to peanuts in France --evaluation of 142 observations. Clinical & Experimental Allergy 28, 1113-1119.
Mullins RJ, Dear KBG and Tang MLK (2009) Characteristics of childhood peanut allergy in the Australian Capital Territory, 1995 to 2007. Journal of Allergy and Clinical Immunology In Press, Corrected Proof.
Nowak D, Suppli Ulrik C and von Mutius E (2004) Asthma and atopy: has peak prevalence been reached? Eur Respir J 23, 359-360.
Romagnani S (2004) The increased prevalence of allergy and the hygiene hypothesis: missing immune deviation, reduced immune suppression, or both? Immunology 112, 352-363.
Ross Anderson H, Gupta R, Strachan DP and Limb ES (2007) 50 years of asthma: UK trends from 1955 to 2004. Thorax 62, 85-90.
Sicherer SH, Munoz-Furlong A and Sampson HA (2003) Prevalence of peanut and tree nut allergy in the United States determined by means of a random digit dial telephone survey: A 5-year follow-up study. Journal of Allergy and Clinical Immunology 112, 1203-1207.
Smit HA and Van Schayck CP (2006) [Recent changes in the prevalence of asthma in children]. Ned Tijdschr Geneeskd 150, 233-236.
Strachan DP (1989) Hay fever, hygiene, and household size. BMJ 299, 1259-1260.
Upton MN, McConnachie A, McSharry C, Hart CL, Smith GD, Gillis CR and Watt GCM (2000) Intergenerational 20 year trends in the prevalence of asthma and hay fever in adults: The Midspan family study surveys of parents and offspring. British Medical Journal 321, 88-92. Van der Klis FR, Mollema L, Berbers GA, De Melker HE and Coutinho RA (2009) Second national serum bank for population-based seroprevalence studies in the Netherlands. Neth J Med 67, 301-308.
Venter C, Arshad SH, Grundy J, Pereira B, Clayton CB, Voigt K, Higgins B and Dean T (2009) Time trends in the prevalence of peanut allergy: three cohorts of children from the same
geographical location in the UK. Allergy 65, 103-108.
Williams H, Stewart A, von Mutius E, Cookson W and Anderson HR (2008) Is eczema really on the increase worldwide? Journal of Allergy and Clinical Immunology 121, 947-954.e915.
Williams HC (1992) Is the prevalence of atopic dermatitis increasing? Clinical and Experimental Dermatology 17, 385-391.
Woolcock AJ and Peat JK (1997) Evidence for the increase in asthma worldwide. Ciba Found Symp 206, 122-134; discussion 134-129, 157-129.
Zollner IK, Weiland SK, Piechotowski I, Gabrio T, von Mutius E, Link B, Pfaff G, Kouros B and Wuthe J (2005) No increase in the prevalence of asthma, allergies, and atopic sensitisation among children in Germany: 1992-2001. Thorax 60, 545-548.
RIVM
National Institute for Public Health and the Environment P.O. Box 1
3720 BA Bilthoven The Netherlands