RIVM report 680717002/2007
Agricultural practice and water quality on farms benefiting from derogation
Design and organisation of the monitoring network for 2006-2009 and annual reports from 2008 onwards
B. Fraters, T.C. van Leeuwen1, J. Reijs1, L.J.M. Boumans, H.F.M. Aarts2, G.H.G. Daatselaar1, G.J. Doornewaard1, D.W. de Hoop1, J.J. Schröder2, G.L. Velthof 3, M.H. Zwart
This study was carried out on behalf of the Ministry of Housing, Spatial Planning and the Environment, under the auspices of project 680717, National Programme for Monitoring the Effectiveness of the Minerals Policy.
RIVM, P.O. Box 1, 3720 BA Bilthoven, telephone: +31 30 2749111; fax: +31 30 2742971 Contact: B. Fraters
Laboratory for Environmental Monitoring b.fraters@rivm.nl
1 Wageningen University and Research Centre - Agricultural
Economics Research Institute
2 Wageningen University and Research Centre – Plant Research
International
Abstract
Agricultural practice and water quality on farms benefiting from derogation
Design and organisation of the monitoring network for 2006-2009 and annual reports from 2008 onwards
In 2006 RIVM and LEI set up a monitoring network that measures the consequences of the option for farmers to deviate from the European use-standard for livestock manure
(derogation). The monitoring network follows three hundred farms benefiting from individual derogations and records the consequences for agricultural practice and water quality. This report describes the design and set-up of the monitoring network, as well as the content and layout of the annual reports from 2008 onwards that will contain the results of the monitoring network. The report indicates, for example, what data will be available at a certain point in time, and what methods will be used to calculate such factors as fertilisation and yield. The Nitrates Directive obliges Member States to limit the use of livestock manure to a maximum of 170 kg of nitrogen per hectare. A Member State may request the European Commission to deviate from this obligation under certain conditions. In December 2005, the European Commission granted the Netherlands the right to derogate from the obligation from 2006 to 2009 inclusive, implying that farmers could use up to 250 kg of nitrogen via manure of grazing livestock (particularly cows). One of the conditions is that 70% or more of the acreage available for manure application is grass. The Netherlands authorities are also obliged to set up a monitoring network and to report the results of this network to the European Commission. The 300 farms participating in the monitoring represent a sample taken from the approximately 27,000 Netherlands farms benefiting from individual
derogations. The network is part of the National Programme for Monitoring the Effectiveness of the Minerals Policy (LMM).
Key words: Nitrates Directive, derogation decision, European Commission, LMM, agricultural practice, water quality, reporting obligation
Rapport in het kort
Landbouwpraktijk en waterkwaliteit op landbouwbedrijven aangemeld voor derogatie Beschrijving van de meetnetopzet voor de periode 2006-2009 en de inhoud van de
rapportages vanaf 2008
Het RIVM en het LEI hebben in 2006 in Nederland een monitoringnetwerk opgezet dat de gevolgen meet als landbouwbedrijven mogen afwijken (derogatie) van de Europese
gebruiksnorm voor dierlijke mest. Het meetnet volgt driehonderd landbouwbedrijven die zich hebben aangemeld voor derogatie. Het legt de gevolgen vast voor de landbouwpraktijk en de waterkwaliteit. In dit rapport is de opzet van het monitoringnetwerk beschreven, evenals de wijze waarop vanaf 2008 over de resultaten zal worden gerapporteerd. Het rapport geeft onder andere aan wanneer welke cijfers beschikbaar zijn, en welke rekenmethoden gebruikt zullen worden om onder andere de bemesting en gewasopbrengst te berekenen.
De Europese Nitraatrichtlijn verplicht lidstaten het stikstofgebruik via dierlijke mest te beperken tot maximaal 170 kg per hectare. Een lidstaat kan de Europese Commissie vragen hiervan onder voorwaarden af te wijken.
Nederland heeft in december 2005 toestemming gekregen om vanaf 2006 tot en met 2009 onder voorwaarden af te mogen wijken van de gestelde norm. Dit betekent dat
landbouwbedrijven 250 kilo stikstof per hectare mogen toedienen via dierlijke mest afkomstig van graasdieren (vooral koeien). Een van die voorwaarden is dat minimaal 70 procent van het totale areaal grasland is. Daarnaast is de Nederlandse overheid verplicht een monitoringnetwerk in te richten en de Commissie over de resultaten daarvan te
rapporteren.
De driehonderd deelnemers die worden gevolgd, zijn een steekproef van de circa 27.000 Nederlandse landbouwbedrijven die zich hebben aangemeld voor derogatie. Het netwerk is een onderdeel van het Landelijk Meetnet effecten Mestbeleid (LMM). Trefwoorden: Nitraatrichtlijn, derogatiebeschikking, Europese Commissie, LMM, landbouwpraktijk, waterkwaliteit, rapportageverplichting
Foreword
On behalf of the Ministry of Housing, Spatial Planning and the Environment (VROM) and the Ministry of Agriculture, Nature and Food Quality (LNV), the National Institute of Public Health and the Environment (RIVM) has compiled this report together with institutes of the Wageningen University & Research Centre (WUR), namely the Agricultural Economics Research Institute (LEI), Alterra and Plant Research International (PRI).
The Dutch government appointed the project group EU Monitoring in order to satisfy its reporting obligations to the European Commission with respect to the derogation decision of 8 December 2005. This project group, in which the Ministries of VROM and LNV are represented, has drawn up a project plan (26 October 2006). In this project plan the obligations with respect to the monitoring and reporting are further detailed and the intended realisation of this is described. Five aspects must be included in the reports to the European Commission:
A. Percentages of grassland farms, animals and agricultural land, in each municipality that falls under an individual derogation (Article 8 of the derogation decision);
B. Monitoring data from soil water, streams and shallow groundwater (Article 10, para 1); C. Results of inspection and enforcement (Article 10, para 1);
D. Synthesis of trends (Article 10, para 2);
E. Report about fertilisation and yield per soil type and crop (Article 10, para 4).
This report describes the reporting of aspects B and E. Aspects A, C and D will be reported separately to the European Commission.
RIVM and LEI are involved in this reporting due to their responsibility for the derogation monitoring network and the interpretation of the data. The other WUR institutes (Alterra and PRI) are co
responsible for the calculation of the fertilisation, crop yield, nutrient surpluses and leaching with respect to providing evidence for the derogation.
The Ministry of LNV has asked the Expert Committee Fertilisers Act (CDM)1 to assess the content of
the report and to ensure consistency with the methodology of the scientific basis for the derogation. This task has been delegated by CDM to the WOD and is safeguarded by the input of the co-authors from the WUR institutes Alterra and PRI.
A draft version of this report was also discussed in the supervisory committee of the National Programme for Monitoring the Effectiveness of the Minerals Policy, of which the derogation monitoring network is a part. The authors would like to thank the members of the supervisory committee of the National Programme for Monitoring the Effectiveness of the Minerals Policy for their input. Finally a word of thanks to Heleen van Genderen, Arnoud de Klijne, Julika Vermolen and Ruth de Wijs for their comments and editing of the Dutch version of the report and Dave Thomas for translating the main part of this report.
Dico Fraters, Ton van Leeuwen, Joan Reijs, Leo Boumans, Frans Aarts, Co Daatselaar, Gerben Doornewaard, Wim de Hoop, Jaap Schröder, Gerard Velthof and Manon Zwart 20 June 2007
1 The CDM is an independent scientific committee that advises the Ministry of LNV about scientific
underpinning of regulations, standards and fixed calculation factors laid down in the Fertilisers Act. Many of the activities are carried out by Working Groups such as the Werkgroep Onderbouwing Derogatie [Scientific Working Group Derogation] (WOD).
Contents
Summary 11 Samenvatting 13 1. Introduction 15
1.1 Background 15
1.2 Design of the monitoring network 16
1.3 Measurement of leaching and run-off on farms 18 1.4 Determination of fertilisation and crop yield 19
1.5 Determining the evolution in nutrient surplus and leaching 20 1.6 Content of this report 21
2. Design of the derogation monitoring network 23 2.1 Design and realisation of the random sample 23 2.2 Monitoring of the farm characteristics 24 2.3 Monitoring of the water quality 26 2.4 Recording of other information 31 2.5 Calculation methods 31
3. Content of the reports 2008–2010 37 3.1 General 37
3.2 The abridged contents 39 References 41
Appendix 1 The derogation decision, relevant articles about monitoring and reporting 44
Appendix 2 Further explanation of the selection and recruitment of participants for the monitoring network 46
Summary
The Nitrates Directive obliges Member States to limit the use of livestock manure to a maximum of 170 kg of nitrogen per hectare. A Member State may request the European Commission to deviate from this obligation under certain conditions (derogation). In December 2005 the Commission granted the Netherlands a derogation for the 2006-2009 period. Farms with 70% or more of grassland may, under express conditions, apply 250 kg of nitrogen per hectare to their land in the form of manure from grazing livestock. In
reciprocation, the Netherlands authorities are obliged, for example, to set up a monitoring network in accordance with the requirements laid down in the derogation decision of the European Commission. In addition, the Netherlands authorities have to report to the European Commission on amounts of fertilisation and yield for the different soil types and crops, and also on water quality evolution based on monitoring and model-based calculations. The Netherlands will have to submit a derogation renewal request to the European
Commission for the 2010-2013 period.
In 2006 a new monitoring network was designed and set up to monitor the evolution in agricultural practice and water quality as a consequence of derogation. This network
comprises 300 farms benefiting from individual derogation. The new monitoring network is set up as an enlargement of the National Programme for Monitoring the Effectiveness of the Minerals Policy (LMM). This means that all 300 selected farms also participate in the Farm Accountancy Data Network of the Agricultural Economics Research Institute (LEI-BIN). The participating farms are selected using a stratified random sampling method. The available monitoring capacity is –as far as possible– distributed over area, farm type (dairy farms and other grassland farms) and farm size by stratification. This way, the sample should fulfil the condition of being representative of each soil type (clay, peat, sandy and sandy loessial soils), fertilisation practices and crop rotation. It has been decided to select more farms in the sand region than in the clay, peat and loess region, because the derogation decision requires that: ‘A reinforced water monitoring shall address agricultural catchments in sandy soils.’ The data on agricultural practice are recorded via LEI-BIN, while the National Institute for Public Health and the Environment (RIVM) is responsible for and attends to the monitoring of nitrogen and phosphorus concentrations in groundwater and surface waters on farms from autumn 2006 onwards. The data will be processed and interpreted in cooperation with
agricultural and soil scientists from the Wageningen University and Research Centre (WUR), namely, Alterra, Plant Research International (PRI) and the Animal Science Group (ASG). For this purpose, tools will be applied that calculate the limits to the use of manure and mineral fertiliser, thus providing a scientific basis for the Netherlands derogation request in 2005 or to underpin a request in the future.
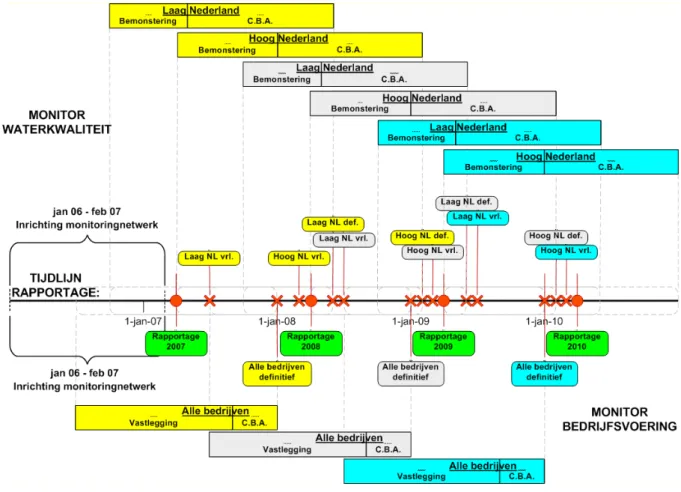
The first monitoring results will be reported in 2008 (see Figure A), with concern for data on agricultural practice and water quality in 2006. Provisional data on water quality for 2007 will also be reported. In 2008, it will not be possible to report on the relationship between water quality and agricultural practice. Water quality data for 2006 relate to agricultural practices in 2005 and preceding years. The effects of the derogation on water quality will be seen, at the earliest, in the data for 2007. The definitive 2007 data will be reported in 2009. This report describes design and set-up of the monitoring network, as well as the content and layout of the annual reports from 2008 onwards containing results of the monitoring.
Figure A: Activities planned by RIVM (Monitor Water Quality) and LEI (Monitor Agricultural Practice) for the derogation monitor. Data shown by colour codes: yellow ( ) for 1st derogation year (2006), grey ( ) for 2nd derogation year (2007), and blue ( ) for 3rd derogation year (2008). C.P.A. = data Control, Process and Analysis.
The time line shows the points in time for reporting to the European Commission and the dates when data become available. Two areas distinguished for water-quality monitoring are the Low Netherlands (Low NL) and the High Netherlands (High NL), see section 2.3. Data on agricultural practice and water quality, shown in colour bars, will be paired. CPA for water quality monitoring encompasses checking and validation of measurement data, collection of GIS and weather data, and performance of statistical analysis to correct for variation in weather and sample composition. CPA for the
agricultural practice monitor encompasses checking and processing data, and the calculation of yield and nutrient balances on the soil surface.
Samenvatting
De Nitraatrichtlijn verplicht lidstaten het stikstofgebruik via dierlijke mest te beperken tot maximaal 170 kg per ha. Een lidstaat kan de Europese Commissie vragen hier onder bepaalde voorwaarden van af te mogen wijken (derogatie). In december 2005 heeft de Europese
Commissie aan Nederland een derogatiebeschikking afgegeven voor de periode 2006-2009. Hiermee mogen landbouwbedrijven met een aandeel grasland van minimaal 70% van het totale areaal, onder voorwaarden, per hectare tot 250 kilogram stikstof toedienen via dierlijke mest welke afkomstig is van graasdieren. Hiertegenover staat dat de Nederlandse overheid verplicht is ondermeer een monitoringnetwerk in te richten dat voldoet aan de in de
derogatiebeschikking opgenomen eisen. Tevens dient jaarlijks aan de Europese Commissie te worden gerapporteerd over bemesting en opbrengsten per gewas-bodemcombinatie en over de ontwikkeling van de waterkwaliteit op basis van zowel metingen als modelberekeningen. Voor de periode 2010-2013 zal Nederland een hernieuwd derogatieverzoek moeten indienen bij de Europese Commissie.
In 2006 is een nieuw monitoringnetwerk ingericht voor het volgen van de ontwikkeling van de landbouwpraktijk en waterkwaliteit als gevolg van de derogatie. Dit meetnet omvat 300 landbouwbedrijven die zich hebben aangemeld voor derogatie. Het nieuwe
monitoringnetwerk is ingericht door uitbreiding van het Landelijk Meetnet effecten Mestbeleid. Dit betekent dat alle 300 geselecteerde bedrijven ook deelnemen aan het Bedrijven-Informatienet van het Landbouw Economisch Instituut (LEI-BIN). Het deelnemersbestand is op basis van een gestratificeerde steekproef samengesteld. Via
stratificatie is de beschikbare monitoringscapaciteit zo goed mogelijk gespreid over gebied, bedrijfstype (melkveebedrijven versus andere graslandbedrijven) en bedrijfsomvang. Op deze manier is invulling gegeven aan de eis representatief te zijn voor alle bodemtypen (klei-, veen-, zand-, en zandige lössgronden), bemestingspraktijken en bouwplannen. Wel is
gekozen voor een oververtegenwoordiging van landbouwbedrijven in de zandregio, omdat de derogatiebeschikking dat eist: ‘in stroomgebieden met landbouw op zandgrond wordt de monitoring van de waterkwaliteit verscherpt’. De gegevens over de landbouwpraktijk zullen worden vastgelegd via het LEI-BIN. Het Rijksinstituut voor Volksgezondheid en Milieu (RIVM) draagt zorg voor de monitor van de stikstof- en fosforconcentraties in het bovenste grondwater en het oppervlaktewater op de bedrijven vanaf najaar 2006. De gegevens zullen worden bewerkt en geduid samen met gewas- en bodemkundigen van de WUR-instituten Alterra en Plant Research International (PRI) en de Animal Science Group (ASG). Hiervoor zullen in principe berekeningsmethodieken worden toegepast die ook gebruikt zijn bij de onderbouwing van de derogatie 2006-2009.
De eerste resultaten zullen in 2008 worden gerapporteerd, zie Figuur A. Dit betreft de gegevens over de landbouwpraktijk en de waterkwaliteit in 2006. Tevens zullen de
voorlopige cijfers over de waterkwaliteit voor 2007 worden opgenomen in het rapport. Het zal niet mogelijk zijn om in het rapport dat verschijnt in 2008 een relatie te leggen tussen landbouwpraktijk en waterkwaliteit. De gerapporteerde waterkwaliteitsgegevens voor 2006 zijn beïnvloed door de landbouwpraktijk in 2005 en de jaren ervoor. De effecten van de derogatie op de waterkwaliteit zullen op zijn vroegst in meetjaar 2007 zichtbaar worden. De definitieve cijfers van 2007 worden gerapporteerd in 2009.
In het onderhavige rapport zijn de opzet van het monitoringnetwerk, de realisatie hiervan in 2006 en wijze waarop vanaf 2008 over de resultaten zal worden gerapporteerd vastgelegd.
Figuur A: Planning van activiteiten door RIVM (Monitor Waterkwaliteit) en LEI (Monitor Bedrijfsvoering) ten behoeve van de monitoring van derogatiebedrijven. De kleurcoden betekenen: geel ( ) 1e jaar van de derogatie (2006), grijs ( ) 2e jaar van de derogatie (2007) en blauw ( ) 3e jaar van de derogatie (2008). C.B.A. = Controle, Bewerking en Analyse.
Op de tijdlijn is zichtbaar op welk tijdstip gerapporteerd moet worden en wanneer gegevens beschikbaar komen voor rapportage. Bij de Monitor Waterkwaliteit is onderscheid gemaakt tussen Hoog Nederland (Hoog NL) en Laag Nederland (Laag NL), zie paragraaf 2.3. De gegevens voor bedrijfsvoering en waterkwaliteit weergegeven met balken met dezelfde kleur zullen worden gekoppeld. C.B.A. bij de Monitor Waterkwaliteit betreft de controle en validatie van meetgegevens, verzamelen van GIS- en weersgegevens en het uitvoeren van weers- en steekproefcorrecties. Bij de Monitor Bedrijfsvoering betreft C.B.A. de controle en bewerking van vastgelegde gegevens en berekening van gewasopbrengst en
1.
Introduction
1.1
Background
In October 2003, the European Court of Justice decreed that the Netherlands had not correctly implemented the Nitrate Directive. The Netherlands was obliged to prescribe application standards to farms and to limit the use of nitrogen in livestock manure to a maximum of 170 kilogram nitrogen per hectare. A higher livestock manure application rate would only be possible if the European Commission were to grant the Netherlands a
derogation for this.
The Netherlands has requested a derogation from the European Commission (EC) for farms with predominantly grassland. In December 2005, the European Commission issued the Netherlands with a definitive derogation decision under which farms with at least 70% of the total area as grassland, were allowed to apply up to 250 kg nitrogen per hectare in the form of livestock manure that originates from grazing livestock (EU, 2005). The derogation decision covers the years 2006–2009. Consequently, the Dutch government is obliged to collect a wide range of data about the effects of the derogation and to report these to the European Commission. For the period 2010–2013 the Netherlands will once again have to submit a request for derogation to the European Commission.
One of the requirements of the derogation decision, see Appendix 1, concerns the setting up of a monitoring network for the sampling of groundwater, soil water, drainage water and streams on farms benefiting from individual derogations (Article 8 of the decision, para 2). The monitoring network must provide data about the nitrate and phosphorous concentration in the water that leaves the root zone and ends up in the groundwater and surface water system (Article 8, para 4). This monitoring network, that covers at least 300 farms, should be representative for all types of soil (clay, peat, sandy, and sandy loessial), fertilisation
practices and crop rotation (Article 8, para 2). The network should, however, reinforce the water quality monitor on sandy soils (Article 8, para 5). The composition of the monitoring network should remain unchanged (Article 8, para 2) during the period to which the decision applies (2006–2009). During the negotiations with the European Commission it was agreed that the design of this monitoring network would tie in with the existing National Programme for Monitoring the Effectiveness of the Minerals Policy (LMM), under which the water quality and operational management of farms selected for this purpose has been monitored since 1992 (Fraters and Boumans, 2005). It was also agreed that participants in the LMM, who satisfy the conditions, could be regarded as participants in the monitoring network for the derogation. Accordingly the monitoring network for the derogation has become part of the LMM.
Besides the requirement to monitor, there is the requirement to report the evolution in the water quality. The report should be based on the monitoring of the leaching of the root zone, the surface water quality and the groundwater quality, as well as model-based calculations (Article 10, para 1). Also for the different types of soils and crops, a report has to be
submitted each year about the fertilisation and yield on grassland farms on which derogation is permitted, to provide the European Commission with an understanding of the management on these farms and the degree to which this has been optimised (Article 10, para 4).
1.2
Design of the monitoring network
The monitoring network must be designed such that it satisfies the requirements of the European Commission, as stipulated in the derogation decision of December 2005, see Appendix 1.
The setting up of the network and the reporting of the results is based on the division of the Netherlands into regions, as made for the Nitrate Directive Action Programme and the fertilisation legislation. In reporting a distinction is made between a clay-peat region and a sand-loess region. In formal terms the loess region can be viewed as a separate region, as different nitrogen application standards apply for some crops. Yet, this differentiation was not chosen, as this region covers a much lower acreage of agricultural land than the other regions. The acreage of agricultural land in the loess region amounts to about 1.5% of the 2,000,000 ha of agricultural land, whereas the agricultural land in the sand region amounts to 47% and in the clay-peat region almost 52%.
The network covers the prescribed number of 300 farms who have registered an individual derogation (Article 8, para 2). The decision states: ‘farms benefiting from individual derogations’. The Fertilisers Act states, however, that farms that wish to be eligible for a derogation must report this to Dienst Regelingen [Regulations Service] (DR) of the Ministry of Agriculture, Nature and Food Quality (LNV) each year prior to the year for which the application is being made. Such an application does not mean that a derogation will be granted for these farms. DR can only inspect the conditions attached to derogation during the year for which derogation has been requested and the year following this. The inspection takes place on the basis of data supplied by the farms and by random administrative and on-farm inspections. The selected 300 on-farms will, in principle, participate in the network throughout the entire period 2006–2009 (Article 8, para 2). As the farms must apply for the derogation each year, participants in the monitoring network may be excluded over the course of time because they are no longer eligible for derogation or no longer want to apply for this. It is also possible that participants end up falling outside of the sampling boundaries due to extreme changes in the farm set up. In both cases new similar farms will be selected and recruited, so that the required number of 300 participants remains constant through the entire period.
The first measurement year was 2006. In this year the operational management of the complete group of 300 farms were recorded. The operational management will not show effects on water quality on the farms before winter 2006/2007 (The Low Netherlands2) or summer and autumn (The High Netherlands2). The difference in the time when the data become available is caused by differences in the sampling methods that arise from
differences in hydrological characteristics between The High and The Low Netherlands, see section 1.3. The water quality measured in that period is not only influenced by the farming practice in the previous year but also by the practice in the years before this. The extent to which this is the case is, for example, dependent on the level and variation in the precipitation surplus in the years prior to the measurement.
2 The Low Netherlands is understood to be the clay and peat regions, and those soils in the sand region that via ditches, whether or not in combination with drainage pipes or channels, are drained. The High Netherlands is understood to be the other sand and loess soils.
The selection approach chosen is a stratified random sample. This means that in advance, a number of groups (strata) with a desired number of participants per group are determined. This allows the available monitoring capacity to be spread as well as possible over the stratification variables: area, farm type and farm size. This stratification is applied to satisfy the requirement to be representative for all soil types (clay, peat, sand, and sandy loess soils), fertilisation practices and crop rotations (Article 8, para 2). However an over-representation of farms in the sand region was chosen, by including twice as many farms from this region in the monitoring network than for other regions, because the derogation decision required this: ‘in catchments areas with agriculture on sandy soil the monitoring of water quality will be reinforced’ (Article 8, para 5).
By including a group of grassland farms other than dairy farms in the derogation monitoring network, an effort has been made to realise a monitoring network that is representative for all soil types, fertilisation practices and crop rotations, in accordance with Article 8 of the Decision.
The recruitment of participants from separate strata (partial populations of farms from the same body of groundwater, farm category and size class), allowed a greater degree of
reliability than for a non-stratified random sample of the same size. Additionally stratification helps to safeguard the representativity. It gives the possibility to select a replacement farm that is similar in terms of location (body of groundwater), farm type and farm size when one of the selected farmers can no longer participate.
Although in the report only the clay-peat region and the sand-loess region are distinguished, for the compilation of the random sample a distinction in four main soil type regions (sand, clay, peat and loess) was used. Per region a distinction was made between on the one hand the bodies of groundwater, such as those distinguished in the Netherlands with the
implementation of the Water Framework Directive, and on the other hand two categories of grassland farms (specialised dairy farms, other grassland farms). Within these categories a further distinction was made according to four major classes based on the Netherlands Unit of Measurements (NGE). Subsequently farms that satisfied these criteria and had at least
10 hectares of cultivated land in use were selected. This last criterion was also applied in the LMM. Applying these criteria gives rise to a homogenous group of representative farms, as a result of which the trend in water quality can be better detected. First, the selection was focussed on farms that already participated in the LMM and therefore also in the Farm Accountancy Data Network of the Agricultural Economics Research Institute (LEI-BIN). Subsequently a selection took place within the group of BIN participants who did not yet participate in the LMM. Thereafter, farms were selected that did not yet participate in LEI-BIN but did make use of derogation, see also section 2.1 and Appendix 2.
As stated, all data on operational management, that were relevant for the derogation, were recorded for all 300 farms according to the BIN system (Poppe, 2004;
http://www.lei.wur.nl/nl/statistieken/binternet). These data are collected in such a way that a report could be published about fertilisation and crop yield of grassland farms and the model-based calculations could be carried out. This required a considerable expansion of the
recording of data within the BIN. Adjustments were also agreed upon with the Werkgroep Onderbouwing Derogatie [Working Group Scientific Evidence Derogation] (WOD). The water sampling on the farms is in accordance with the standard LMM systematics (Fraters et al., 2004). This sampling method is explained in section 1.3.
1.3
Measurement of leaching and run-off on farms
The derogation decision (EU, 2005) states that a report must be given about the evolution of the water quality based on, for example, the monitoring of the leaching from the root zone and about the surface water and groundwater quality (Article 10, para 1). For this, the monitoring of the quality of the ‘shallow groundwater, soil water, drainage water and
streams’ on farms that are part of the monitoring network must provide data about the nitrate and phosphorous concentration in the water that leaves the root zone and ends up in the groundwater and surface water system (Article 8, para 4).
Strategy for the water quality monitor
In the Netherlands, the groundwater level is often present just below the root zone, the average groundwater level in the sand region is about 1.5 metres below the surface. In the clay and peat region the groundwater levels are on average less deep. Only on the terminal moraines of the sand region and in the loess region is the groundwater level mostly deeper than five metres below the surface. Therefore in the majority of situations, the leaching from the root zone or the leaching into the groundwater can be measured by sampling the
uppermost metre of groundwater. In situations where the groundwater level is deeper (more than five metres below the surface) and the soil retains sufficient moisture (loess region), the soil moisture in the unsaturated zone below the root zone is sampled. Agricultural land use on terminal moraines is limited. Leaching in those areas is monitored, if possible, by sampling soil moisture.
The loading of the surface water with nitrogen (N) and phosphorous (P) takes place via run-off and via the groundwater in which case the travel times are usually long. In The High Netherlands only the leaching from the root zone is monitored by sampling the uppermost metre of the groundwater or of the soil water under the root zone. In The Low Netherlands, in areas drained via ditches, whether or not in combination with tile drains, the travel times are shorter. Here the loading of the surface water is visualised by sampling ditch water in
combination with the sampling of the uppermost metre of the groundwater or the water from the drainage pipes (tile drain water).
Number of measurements per farm
The groundwater is sampled at 16 measurement locations per farm, the drain water at
16 locations, the soil water also at 16 locations and the ditch water at 8 locations. The number of measurement locations is based on the results of previous research carried out in the sand region (Fraters et al., 1998; Boumans et al., 1997), in the clay region (Meinardi and Van den Eertwegh, 1997, 1995; Rozemeijer et al., 2006) and in the peat region (Van den Eertwegh and Van Beek, 2004; Van Beek et al., 2004; Fraters et al., 2002).
The sampling period and sampling frequency
In The Low Netherlands the sampling takes place in the winter. Here during the winter the precipitation surplus is largely transported via shallow groundwater flow to the surface water. On sand and loessial soils in The High Netherlands sampling can take place in both the summer and the winter. For technical reasons, water in the sand region is sampled in the summer and the loess region in the autumn. The sampling period (see section 3.1) has been chosen such that the measurements represent the leaching from the root zone, and provide as accurate a picture as possible of the agricultural practice in the previous year.
The groundwater and the soil water are sampled at least once per year on each farm. The annual precipitation surplus in the Netherlands is about 300 mm per year. This quantity of water spreads itself in a soil with a porosity of 0.3 (usual for sandy soil) over a layer of about 1 metre in the soil (saturated soil). The quality of the uppermost metre thereby gives a good picture of the annual leaching from the root zone and the loading of the groundwater. Other types of soil (clay, peat, loess) mostly have a greater porosity. In other words a sample from the uppermost metre will contain on average water from more than one year. A measuring frequency of once per year is therefore sufficient. Previous research has demonstrated that the variation in the nitrate concentration within one year, as well as the variation between
previous years, disappears if dilution effects and variations in the groundwater level are taken into account (Fraters et al., 1997).
From the start of the new sampling season, the frequency of the sampling of the drain water and ditch water will be increased for The Low Netherlands (1 October 2007) from two to three rounds per winter (current realised LMM sampling frequency) to about four rounds per winter (intended LMM sampling frequency) to realise a better spread over the leaching season. The intended LMM sampling frequency was based on research carried out by Meinardi and Van den Eertwegh at the start of the 1990s (Meinardi and Van den Eertwegh, 1997, 1995; Van den Eertwegh, 2002). The evaluation of the LMM programme in the clay areas in the period 1996–2002, led to the conclusion that there was no reason to change the existing relationship between the number of sampling rounds per farm (realised sampling frequency) and year, and the number of drains sampled per farm and per sampling round (Rozemeijer et al., 2006). The intensification emerges from the wish of the European
Commission for a higher sampling frequency. Four times per year concurs with the proposed sampling frequency for operational monitoring of vulnerable freatic groundwater that has a relatively fast and shallow discharge (EU, 2006).
1.4
Determination of fertilisation and crop yield
According to the derogation decision (EU, 2005) the report should include details on
fertilisation and crop yield (Article 10, para 4). This article states (see Appendix 1): ‘In order to provide elements regarding management in grassland farms, for which a derogation applies, and the achieved level of optimisation of management, a report on fertilisation and yield shall be prepared annually for the different soil types and crops by the competent authority and submitted to the Commission.’ This report can and shall only be based on the data originating from the 300 farms in the monitoring network that are recorded by LEI-BIN. For other farms that registered for derogation, not enough data are known to be able to estimate the crop yields.
In the report two groups of crops (grass and other feed crops) and two types of soil (clay and peat and respectively sand and loess) will be distinguished resulting in a total of four crop-soil combinations.
To determine the total level of fertilisation, the quantity and sort of all fertilisers applied (inorganic fertiliser, livestock manure and other organic fertilisers) are registered in BIN. Besides quantity and sort, it is also recorded ‘when’ (time) and ‘where’ (on which crop-soil combination) the fertiliser was applied. If available, the quantities of nitrogen and phosphate in organic manure samples are recorded. Where these contents are not measured, standard levels per product are used to calculate the quantity of minerals applied. On many livestock farms some of the livestock manure is excreted directly on the land during grazing. To
estimate the quantities of manure and minerals deposited via grazing, the grazing system per animal category is followed within BIN. For this the number of grazing hours per day is recorded in the case of limited grazing, with which the quantity of grazing manure produced can be estimated for each desired period in the grazing system.
To obtain a good insight into the level of optimisation achieved in the grassland management, the N and P applications at crop and farm level will also be compared with the legally
permitted usage limits.
Determining the crop yields on grassland farms involves complex calculations, as hardly any removal of crop from the farm takes place and a large part of the nutrient flows on the farm are internal. Additionally, a large part of the grass is not harvested but is consumed directly by the livestock during grazing. This means that the crop yield cannot be calculated directly from recorded facts, but must be derived from these. This derivation takes place on the basis of a method described by Aarts et al. (2005). Section 2.5.3 describes how this method will be applied. The basic assumption of this calculation is that the energy requirement (in VEM, feed units milk) of the total livestock population must be covered by the sum of the feed produced on the farm and the feed purchased from outside. This method also offers the possibility to calculate the production of manure on the farm, based on the uptake and assimilation of N and P in milk and meat.
1.5
Determining the evolution in nutrient surplus and
leaching
The derogation decision (EU, 2005) states that the report must include details about the evolution of the water quality not only based on monitoring but also on model-based
calculations (Article 10, para 1). It is also stated that ‘Survey and continuous nutrient analysis shall provide data on local land use, crop rotations and agricultural practices on farms
benefiting from individual derogations. Those data can be used for model-based calculations of the magnitude of nitrate leaching and phosphorus losses from fields where up to 250 kg nitrogen per hectare per year in manure from grazing livestock is applied’ (Article 8, para 3). Nitrate concentrations in the uppermost groundwater, in particular, are not only affected by fertilisation, but also by variations in the precipitation surplus (Boumans et al., 1997). A statistical model has been developed for the analysis of the effect of the variations in the precipitation surplus on the nitrate concentration in the uppermost layer of the groundwater (Boumans et al., 2001, 1997). This method also corrects for changes in the composition of the group of participating farms, the random sample (Fraters et al., 2004). Sometimes participants have to be replaced over the course of the programme (see section 1.2) or changes in the acreage of the participating farms takes place. As a result of this the ratio between the soil types and/or drainage classes can change over the course of the programme. The soil type (sand, clay, peat) and the drainage class (poor, moderate, good drainage) affect the
relationship between the nitrogen surplus and the nitrate concentration measured. A change in the nitrate concentration could therefore be caused by a change in the composition of the group of participating farms or changes in the acreage. The correction is carried out to determine if this is the case. That is why in reports both the annual average nitrate
concentration measured per main soil type region and the nitrate concentration corrected for weather and random sample are included (see, for example, Fraters et al., 2004).
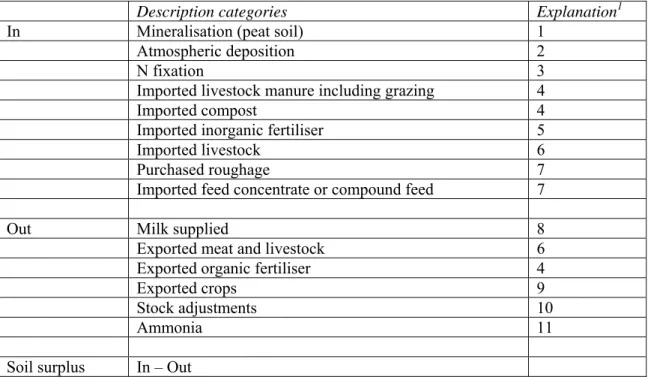
The evolution in corrected water quality will be related to the evolution of nutrient surpluses on the farms in the monitoring network. For this analysis, soil surpluses (kg N and P per ha)
will be calculated with a method that is derived from the method used by the WOD (Schröder et al., 2007, 2004). This implies that, in addition to the imported quantities of N and P in organic and inorganic fertilisers and the exported quantities of N and P in crops, import categories such as mineralisation of organic matter in the soil, nitrogen fixation by
papilionaceae and atmospheric deposition are taken into account. This calculation of soil surpluses assumes an equilibrium situation. It is assumed that in the longer term, the import of organic nitrogen in the form of crop residues and organic fertiliser is equal to the annual breakdown. An exception to this rule is made for peat soils where an import category for mineralisation is included. For these soils it is known that net mineralisation takes place as a consequence of the groundwater level management that is necessary to be able to use these soils for agricultural purposes. Unlike Schröder et al. (2007, 2004) a balance method is used. How this method will be applied is described in section 2.5.2. With the model no losses or concentrations are calculated for nitrogen or phosphorous. The N and P surpluses calculated are viewed as an indicator for N and P loss.
1.6
Content of this report
This is the first of the four annual reports about the results of the derogation monitoring network. This report is limited to a description of the monitoring network, the progress in the setting up of this in 2006 and the design and content of the reports in the yeas 2008 to 2010, as well as a general description of the measurement and calculation methods to be used and the models to be applied. No measurement results are being reported yet as the measurement results for 2006 will only become available during the course of 2007. Besides the
description of the design of the network in chapter 2, the contents of future reports with the measurement results are described in chapter 3.
2.
Design of the derogation monitoring network
2.1
Design and realisation of the random sample
The monitoring network for the derogation is part of the National Programme for Monitoring the Effectiveness of the Minerals Policy (LMM), as described in section 1.2. The selection and recruitment of the 300 farms (the random sample) that have applied for derogation is similar to that of other participants in the LMM.
For each of the four main soil type regions a stratified random sample was set up. Farms eligible for inclusion in the derogation monitoring network were assigned to groups. First, the farms were stratified according to groundwater body, as distinguished in the Netherlands with the implementation of the Water Framework Directive (Verhagen et al., 2006). Also a
distinction was made between dairy farms and other grassland farms. The third and final stratification variable was the size of the farm, for which four size classes were distinguished. See Appendix 2 for a more detailed explanation of the stratification variables.
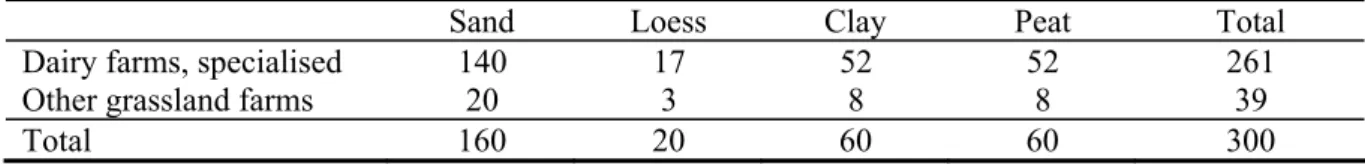
If a selected farm can no longer participate, a replacement farm is selected that is similar to the dropped-out farm in terms of location (groundwater body), farm type and farm size. The number of dairy and other grassland farms participating in the derogation network is stated in Table 2.1. The numbers are given per main soil type region. A total of 261 dairy farms and 39 other grassland farms have been included in the network.
Table 2.1: Number of dairy and other grassland farms per main soil type region.
Sand Loess Clay Peat Total
Dairy farms, specialised 140 17 52 52 261 Other grassland farms 20 3 8 8 39
Total 160 20 60 60 300
The realised distribution of the selected and recruited farms within the four main soil type regions for both categories of farm can be seen in Figure 2.1. In some areas there are few if any derogation farms. These are areas in which:
1. arable and/or horticulture dominate the land use (the peat areas in the north-east of the Netherlands, the south-western coastal area and the Flevopolder and
Noordoostpolder in the central part of the Netherlands);
2. extensive nature areas are situated (the Veluwe and the Utrechtse Heuvelrug in the central part of the Netherlands);
3. there is urbanisation, for example the Randstad conurbation in the west part of the Netherlands.
Figure 2.1 Location of the 300 grassland farms participating in the derogation monitoring network in each of the main soil type regions in 2006. The four main soil type regions are sand, loess, clay and peat. Two types of derogation farm are distinguished, dairy farms (O) and other grassland farms (Δ).
2.2
Monitoring of the farm characteristics
LEI-BIN is responsible for the monitoring of the agricultural practice. BIN is a stratified random sample of about 1500 farms and horticultural enterprises for which a detailed set of financial-economic and environmental data are maintained. The BIN is representative for almost 95% of the total agricultural production in the Netherlands (Poppe, 2004).
About 45 fulltime LEI employees are responsible for collecting and recording data on operational management in BIN. They process all of the invoices of the participating farms. They also stocktake initial and end supplies and additional data such as the crop rotation,
grazing system and the composition of the livestock population. Participants receive a report from LEI that mainly contains annual totals (such as a profit and loss account and a balance). Apart from financial flows many physical flows are registered and therefore inconsistencies are elaborately checked during the processing of data for researchers or participants.
Most of the data in BIN are converted into annual totals corrected for stock adjustments. The feed concentrate use per year therefore emerges from the sum of all purchases between two balance dates minus all sales plus the starting stock minus the end stock. The use of fertilisers is known not just on an annual basis but also on a growing season basis that runs from the moment that the prior crop was harvested until the harvest of the current crop.
As stated in section 1.2, the set of operational data that LEI records from participants in the monitoring network has been considerably extended. Below, an overview is given of the data that will become available per farm per year over the period 2006 to 2009 from the records of the BIN.
For all participants in this monitoring network the developments with respect to the area cultivated, the crop rotation and the livestock population will be monitored. The crop rotation plan is specified at the level of crops/crop groups for which nitrogen application standards have been established in the fertilisation legislation. Besides the area, the soil type per crop is also recorded.
Also the actual application of nutrients via inorganic fertiliser, livestock manure and other organic fertilisers is registered per crop-soil combination. For the application of organic manure not only the type and quantity is recorded per application but also the time and the content of nutrients, if sampled. Nutrient contents are calculated normatively when they are not sampled.
Livestock manure can be applied mechanically but also via grazing. To calculate the quantity of grazing manure, the grazing periods for all categories of grazing animals are recorded in days and, in case of limited grazing, the number of grazing hours per day. Furthermore, for grassland farms the mowing percentage is known and, if available, results from silage analyses are collected.
Manure production of all grazing livestock is calculated through the use of the standards described in (Dienst Regelingen, 2006). To do so, for all categories the number of present animals are recorded. On dairy farms not only the number of animals is registered but also the quantity of milk produced and the urea concentrations measured in the tank milk are monitored in order to calculate the manure production. For farms with housed livestock (factory farming), the manure production, according to the fertiliser legislation, is calculated on the basis of all input and output flows (the housing balance method). The nitrogen
excretions calculated are corrected for gaseous nitrogen emissions dependent on the housing systems used on the farm.
2.3
Monitoring of the water quality
2.3.1 General
Sampling at farms
Each year sampling of the groundwater, drain water or soil moisture takes place on each of the 300 farms participating in the derogation monitoring network, see Figures 2.2 and 2.3. On the participating farms in The Low Netherlands2 the surface water is sampled.
Figure: 2.2 Sampling of the uppermost metre of the groundwater on peat soil (left) and soil moisture sampling on loess soil (right).
Figure: 2.3 Sampling of water from drainage pipes (drain water), left with measuring beaker at a tile drain that empties out above ditch water level, right with lance and hose pump at a drainage pipe that empties below ditch water level.
The period of water quality sampling is stated per main soil type region in Table 2.2. The number of farms to be sampled per year and the phasing of this are shown in Table 2.3.
Table 2.2: Sampling periods for the water quality per main soil type region per programme. Samplings associated with the agricultural practice data for one year.
month Oct
1 Nov1 Dec Jan Feb March Apr y Ma June July Aug Sept Oct Nov Dec Sand, total Sand low NL Loess 2 Clay Peat
[1] The exact starting date depends on the start of the drainage season (discharge of water through the drainage pipes). Under the current guideline this starts no later than 1 December.
[2] Non-standard period for the sampling in autumn 2006; due to the setting up activities the sampling will continue until March 2007.
Table 2.3: Number of derogation farms to be sampled per programme per main soil type region in the period 2006–2009.
Sand – Loess Clay – Peat Sand
Year
All farms Drained Loess Clay Peat 2005/2006 126 1 12 2 20 17 2 16 2
2006/2007 160 25 20 60 60
2007/2008 160 25 20 60 60
2008/2009 160 25 20 60 60
1 The selection and recruitment had not yet been completed at the end of the sampling period in 2006. 2 At the start of the sampling, in the autumn of 2005, it was not yet known which farms would apply for
derogation. Chemical analyses
The chemical analyses of the water samples were carried out at an accredited laboratory of RIVM. Table 2.4 gives an overview of the methods used for the different components.
Table 2.4: Components analysed with analysis method and detection limit.
Component Analysis method 1 Detection limit
Nitrate (NO3-N) IC 0.31 mg l-1
Total Nitrogen (N) CFA 0.2 mg l-1 Total Phosphate (P) Q-ICP-MS 0.06 mg l-1 1 Q-ICP-MS : Quadrupole inductively coupled plasma mass spectrometry.
IC : Ion chromatography.
2.3.2 The sand-loess region
Standard sampling
The groundwater sampling on the derogation farms in the sand region takes place in the period April – September, and in the loess region in the period October – December. In these periods each farm is sampled once. On each farm, samples are taken from boreholes made at 16 locations. The number of locations per plot depends on the size of the plot. Within the plot the locations are chosen randomly. Selection and positioning take place according to a
protocol3. The uppermost metre of groundwater is sampled using the open core hole method4. In the field the groundwater level and nitrate concentration (Nitrachek-method5) are
determined. The water samples are filtered6, conserved7 and stored in a cool, dark place for transport to the laboratory8. In the laboratory two mixed samples are made (eight samples per mixed sample) and analysed for nitrate, total nitrogen and total phosphorous.
Soil samples are taken on the farms where the groundwater is located at a depth of more than five metres below the surface. A sample is taken at each of the 16 locations9. The sampling depth is 1.5 to 3.0 m below the surface. In the field, besides a soil sample per location two mixed samples are put together. Each mixed sample contains material from eight locations. In the loess region this is the standard sampling method, as the groundwater levels are usually deeper than five metres below the surface here. The soil samples are stored in a dark, cool place for transport to the laboratory8. The soil samples are centrifuged in the laboratory. The soil moisture from the individual samples is analysed for nitrate and that of the mixed samples for total nitrogen and total phosphorous as well.
The additional sampling in the low-lying areas
On the farms with drains and ditches in the sand region, additional drain and ditch water is sampled during the period October – April. On each farm, sixteen drainage pipes are selected for sampling. The number of drainage pipes to be sampled per plot depends on the size of the plot. Within the plot the drains are selected according to the protocol3.
At each farm two types of ditches sample are distinguished. In principle, there are two ditch types, farm ditches and local ditches. Farm ditches only discharge water that originates from
3 Bepaling van de ligging van de bemonsteringspunten. [Determining the location of the sampling points]. SOP number LVM-BW-P618. Bilthoven, National Institute of Public Health and the Environment (RIVM).
4 Grondwaterbemonstering met een bemonsteringslans en slangenpomp op zand-, klei- of veengronden [Groundwater sampling with a sampling lance and hose pump on sandy, clay or peat soils]. SOP number LVM-BW-P435. Bilthoven, National Institute of Public Health and the Environment (RIVM).
5 Het meten van de nitraatconcentratie in een waterige oplossing m.b.v. een nitrachek-reflectometer (type 404) [The measurement of the nitrate concentration in an aqueous solution with the aid of a nitracheck-reflectometer (type 404)]. SOP number LVM-BW-P110. Bilthoven, National Institute of Public Health and the Environment (RIVM).
6 Grondwaterbemonstering met een bemonsteringslans en slangenpomp op zand-, klei- of veengronden [Filtering of groundwater or ditch water using a filter bed holder and a 0.45 µm membrane filter]. SOP number LVM-BW-P434. Bilthoven, National Institute of Public Health and the Environment (RIVM).
7 Methode voor het conserveren van watermonsters door het toevoegen van een zuur [Method for conserving water samples by adding an acid]. SOP number LVM-BW-P416. Bilthoven, National Institute of Public Health and the Environment (RIVM).
8 Het tijdelijk opslaan en transporteren van monsters [The temporary storage and transport of samples]. SOP number LVM-BW-P414. Bilthoven, National Institute of Public Health and the Environment (RIVM). 9 Grondbemonstering met een Edelmanboor ten behoeve van bodemvochtanalyses [Soil sampling with an Edelman hand-drill for the purpose of soil water analyses]. SOP number LVM-BW-P433. Bilthoven, National Institute of Public Health and the Environment (RIVM).
the farm. Local ditches discharge water from elsewhere; the water that leaves the farm is therefore a mixture. If farm ditches are present, then samples are taken downstream (where the water leaves the farm or the ditch) in four of these ditches. Further in four local ditches samples are taken downstream to gain an impression of the local stream water quality. If there are no farm ditches then samples are taken both upstream and downstream from four local ditches. This provides an impression of the local water quality and the effect of the farm on this. The ditch water sampling types are therefore farm ditch, local ditch upstream and local ditch downstream. The selection of the locations for the ditch water sampling is protocolled3. The selection is aimed at gaining an impression of the effect of the farm on ditch water quality and excluding effects external to the farm as much as possible. Each winter, drain water and ditch water are measured four times on each farm. Water samples originating from drainage pipes that discharge above ditch water level are obtained by capturing the flowing water in a measuring beaker. In case of drainage pipes that
discharge below the water, a hose or shortened sampling lance is stuck into the drainage pipe, and after a rest period the water is pumped out of the pipe10. The ditch water samples are taken with a measuring beaker attached to a stick or ‘fishing rod’11. The sampling is spread over the winter, and samples are taken on one or two occasions in the period October – December and two to three times in the period January – April. In principle, the interval between samples is 4 weeks. The start of the sampling season is determined by the time the drains start to flow.
Water samples are stored in a cool, dry place for transport to the laboratory7. In the laboratory one mixed sample is prepared the next day from the drain water samples and two from the ditch water samples (one per ditch sampling type). The individual drain water and ditch water samples are analysed for nitrate and that from the mixed samples for total nitrogen and total phosphorous as well.
Additionally a groundwater sampling is performed on these farms in the period November – March. The actual start of the sampling season is determined by the time that the drains start to flow. The sampling strategy and method are identical to that carried out in the summer.
2.3.3 The clay region
In the clay region a distinction is made between farms on which the soil is drained with drainage pipes and farms where that is not the case. If less than 25% of a farm's acreage is drained with drainage pipes or if less than 16 drains can be sampled then the farm is considered not to be drained. The sampling strategy on drained farms differs from that on non-drained farms.
Drained farms
On the drained farms, drain water and ditch water are sampled in the period October – April10,11. On each farm 16 drainage pipes are selected for sampling. The number of drainage pipes to be sampled per plot depends on the size of the plot. Within the plot the drains are selected on the basis of a protocol3. On each farm two types of ditch sample are
distinguished. For each type of ditch sample, four sampling locations are selected. The
10 Monsterneming van drainwater [Sampling of tile drain water]. SOP number LVM-BW-P432. Bilthoven, National Institute of Public Health and the Environment (RIVM).
11 Monsterneming van oppervlakte-/slootwater met een maatbeker [Taking samples from surface water or ditch water with a measuring beaker]. SOP number LVM-BW-P431. Bilthoven, National Institute of Public Health and the Environment (RIVM).
selection is protocolled3 and is aimed at gaining an impression of the effect of the farm on ditch water quality and excluding effects external to the farm as much as possible.
Each winter, drain water and ditch water samples are taken four times from each farm as described in the previous section10,11. The sampling is spread over the winter, and samples are taken on one or two occasions in the period October – December and two to three times in the period January – April. In principle, the interval between samples is four weeks. The start of the sampling season is determined by the time the drains start to flow.
Water samples are stored in a cool, dry place for transport to the laboratory7. In the laboratory a mixed sample is prepared on the following day for the drain water samples, and two of the ditch water samples (one per type of ditch sampled). The individual drain water and ditch water samples are analysed for nitrate and that from the mixed samples for total nitrogen and total phosphorous as well.
Non-drained farms
On non-drained farms the uppermost metre of the groundwater and ditch water is sampled in the period November – March.4,12. The sampling is carried out twice, the first time in the period November – December and the second time in the period February – March.
The sampling of the groundwater is similar to that in the sand region. However instead of the open borehole method, the closed borehole method is normally used4. In the field the nitrate concentration is determined (Nitrachek-method5) at each of the 16 locations. The water samples are filtered6, conserved7 and stored in a cool, dark place for transport to the laboratory8. In the laboratory two mixed samples are prepared (eight samples per mixed sample) and analysed for nitrate, total nitrogen and total phosphorous.
The ditch water sampling is similar to that of the drained farms, two types of ditch samples each with four locations. However the sampling takes place with a sampling lance12 and
water samples are filtered directly in the field6 and analysed for nitrate (Nitrachek-method5). As well as being filtered the individual samples are also conserved7 and stored in a cool, dark place for transport to the laboratory8. In the laboratory two mixed samples are prepared from these ditch water samples (one per ditch sample type). The mixed samples are analysed for nitrate, total nitrogen and total phosphorous.
2.3.4 The peat region
In the peat region the uppermost metre of groundwater is sampled once on all farms in the period November – April. During this sampling, the ditch water is also sampled. In addition to this a ditch water sampling is carried out on a further three occasions. The ditch water sampling takes place on one or two occasions in the period November – December and on two or three occasions in the period January – April.
The sampling of the groundwater is similar to that in the sand and clay regions. However instead of an open or closed borehole method a reservoir tube method is usually used4. In the field the nitrate concentration (Nitrachek method) is determined at each of the 16 locations5). The water samples are filtered6, conserved7 and stored in a cool, dark place for transport to
12 Slootwater- of oppervlaktewaterbemonstering met een aangepaste bemonsteringslans en slangenpomp [Sampling ditch water or surface water with a modified sampling lance or hose pump]. SOP number LVM-BW-P430. National Institute of Public Health and the Environment (RIVM)
the laboratory8. In the laboratory two mixed samples are prepared (eight samples per mixed sample) and analysed for nitrate, total nitrogen and total phosphorous.
The ditch water sampling that is carried out at the same time as the groundwater sampling is similar to that of the non-drained farms in the clay region. The sampling therefore takes place with a sampling lance12. There are always two types of ditch sample each with four
locations. Water samples are analysed directly in the field for nitrate (Nitrachek method5). The individual samples are filtered6, conserved7 and stored in a cool, dark place for transport to the laboratory8. In the laboratory two mixed samples are prepared from these ditch water samples (one per ditch sample type). The mixed samples are analysed for nitrate, total nitrogen and total phosphorous.
The additional ditch water samples are taken at the same locations as the sampling carried out at the same time as the groundwater sampling. However, the sampling method is not the same but is rather the method used on drained farms in the clay region. Sampling is therefore done with a fishing rod and measuring beaker11. No analyses take place in the field and the
samples are stored in a cool, dry place for transport to the laboratory8 but not filtered and conserved. In the laboratory two mixed samples are prepared on the following day (eight samples per mixed sample) and analysed for nitrate, total nitrogen and total phosphorous.
2.4
Recording of other information
In addition to the data collected on the derogation farms, precipitation and evaporation data are collected and the soil type and groundwater regimes class distribution on the farms are also recorded.
The precipitation and evaporation data originate from the Royal Netherlands Meteorological Institute (KNMI, De Bilt). The precipitation data are ten-day average values per KNMI weather district. The Netherlands has 15 weather districts. The evaporation data are also ten-day average values but are only available for the 15 principle stations.
The information about soil type and groundwater regime class (Gt) originate from soil and Gt maps of the Netherlands (Alterra, Wageningen) that are both available on a scale of 1:50,000 and 1:250,000. The location of the plots of the participating farms are digitally recorded. By combining the digital information about the plot location and the soil and Gt maps, the soil and Gt distribution per farm can be determined.
2.5
Calculation methods
2.5.1 Calculation methods for fertilisation and crop yield
The yield on grassland farms in the monitoring network is determined indirectly by means of a feed balance according to the method described by Aarts et al. (2005). This method is also used to calculate the N production in livestock manure. The method consists of the steps summarised in Table 2.5 for nitrogen (N) and is explained in the rest of this section. For the calculations in 2008 and the years thereafter the most recent data per year will be used.
Table 2.5: Schematic representation of crop yield and fertilisation calculation on grassland farms
Explanation
Energy requirement livestock population
(kVEM year-1) 1
Minus kVEM year-1 supplementary feed x N:VEM N supplementary feed 2, 3
Minus kVEM year-1 other feed crops x N:VEM N other feed crops + 3, 4
Net kVEM from grassland 3, 5
Net kVEM from fresh grass x N:VEM N fresh grass + Net kVEM from grass silage x N:VEM N grass silage +
total N uptake livestock
population =
Summation N in supplementary feed -
N in lost feed crops - 5
gross N yield farm = Summation N in milk and meat - 6
N in gaseous losses - 7
N in livestock manure = Summation
1The numbers refer to the numbers in the explanatory notes below.
Explanatory notes:
1. The requirement for feed energy (kVEM) is calculated using the numbers of animals recorded in BIN and the requirement per animal. Requirements for dairy cows and young stock are based on the values used by Tamminga et al., (2004, see for example Table 3). Grazing time is based on the data recorded in BIN.
2. The supplementary feed consumed, calculated as weight x VEM content is subtracted from the total energy requirement. Consumption is corrected for stock differences: Consumption = initial stock + purchases – final stock.
- Feed concentrate: VEM content and weight via feed supplier.
- Wet by-products: VEM content via feed standards (see, for example, CVB, 2003), weight via feed supplier.
- Purchased roughage and stock adjustments own roughage: VEM content via sampling or feed standards (see, for example, CVB, 2003). Weight via supplier or via estimate. - Milk products for rearing of claves + milk from own farm fed to calves. VEM content via
feed standards (see, for example, CVB, 2003) and weights via supplier.
3. The quantity of VEM from supplementary feed consumed is then corrected per feed sort for ensilage and feeding losses (see, for example, Aarts et al., 2005).
4. The yields (in kVEM) of other feed crops are subtracted from the remaining
requirements. Other feed crops are silage maize, mangolds, lucerne, maize cob silage (MCS), and grain crops used for Whole Plant Silage (WPS). After correction for conservation and feeding losses (see, for example, Aarts et al., 2005), the VEM content is calculated via feed standards (see, for example, CVB, 2003). The farmer of the BIN farm estimates the yield of these crops.
5. The feed requirement that remains must have been supplied by the grassland. The mowing percentage is used to determine what proportion of the yield is ingested as fresh grass through grazing and what is ingested as silage grass. The net grass yield, that is the sum of the fresh grass and silage grass, is corrected for conservation and feeding losses and is then assumed to equal the remaining feed requirement. After dividing by the total hectares of grassland the VEM yield per ha is obtained. The VEM yield per ha is converted into dry matter, and subsequently dry matter into N and P. If present, use is made of farm-specific analysis results, otherwise annual averages are used. N and P contents from fresh grass are estimated on the basis of N and P contents in the silage grass.
6. Number of animals x weight x species-specific N and P content in meat (see, for example, Beukeboom, 1996) and the quantity of N (weight x farm-specific N content) and P (weight x standard P content) in supplied milk, the milk that is consumed by young stock on the farm is thus not included.
7. This concerns the collective loss of ammonia-N from inorganic fertiliser and from manure from the housing, from the storage, during grazing and during mechanical application (see, for example, Van Dijk et al., 2004). The emission from the housing and storage is calculated as a function of the livestock species, housing system and grazing system (see, for example, Oenema et al., 2000), the emission during grazing as a percentage of the N total applied as grazing manure (see, for example, Schröder et al., 2005).
This calculation is carried out in the same manner for P, with the exception of the post-gaseous losses.
The manure production is also calculated using this method (see Table 2.5, ‘N in livestock manure’). The production calculated in this manner will be compared with the standard manure production calculated in BIN.
The total fertilisation per crop-soil combination is calculated on the basis of data recorded in the BIN (see section 1.4).
2.5.2 Calculation method for soil surpluses
For the calculation of the soil surpluses for nitrogen (N) and phosphorous (P) a method is used that has been derived from the method used by the WOD (Schröder et al., 2007, 2004). The calculation of the soil surplus on the derogation farms is performed at farm level. Unlike Schröder et al. (2007, 2004) a balance method is used. The balance between the use of
organic manure and the removal of crops is quantified by summing all imports and exports of nutrients at farm level. This calculation method is used for both N and P and is shown in Table 2.6. The most recent data will be used for the calculation each year, analogous to the method used by Schröder et al. (2007, 2004).