Contact: Dr. Ir. M.J.W. van de Laar
Centre of Infectious Diseases Epidemiology Soahiv@rivm.nl
RIVM report 441100022/2005
HIV and Sexually Transmitted Infections in the Netherlands in 2004
An update: November 2005
MJW van de Laar, IM de Boer, FDH Koedijk, ELM Op de Coul
This investigation has been performed by order and for the account of Ministry of Health, Welfare and Sports, within the framework of the project Epidemiology and surveillance of HIV and STI.
Report prepared by:
The Surveillance Unit of STI and HIV/AIDS, Centre of Infectious Diseases Epidemiology, National Institute for Public Health and the Environment, with special thanks to Maaike van Veen, Michel Wagemans, Maartje Harbers and Marie-José Veldman.
In collaboration with:
HIV Monitoring Foundation & HIV treatment centres STI sentinel surveillance network
ISIS laboratory surveillance at the National Institute for Public Health and the Environment ISIS/Osiris - Inspectorate of Health
Rapport in het kort
HIV and seksueel overdraagbare aandoeningen in Nederland in 2004. Update: november 2005
De toename van seksueel overdraagbare aandoeningen (SOA) is in 2004 weer verder doorgezet, ondanks een stabilisatie in 2003. Dit betreft zowel het aantal consulten als het aantal SOA bij heteroseksuelen en mannen die seks hebben met mannen (MSM). In 2004, is in de landelijke registratie van nieuwe HIV diagnoses alleen het aantal bij MSM toegenomen. In deze groep zijn de afgelopen jaren verschillende SOA tegelijkertijd toegenomen. Dit duidt op toenemend onveilig seksueel gedrag bij MSM. Alertheid is nodig om verdere toename van SOA en HIV te voorkomen maar ook zijn innovatieve methoden in preventie en interventie nodig.
Per juni 2005 zijn 10619 personen met HIV geregistreerd; 938 in 2004. MSM vormen hierin nog steeds de grootste groep. Het aandeel van heteroseksuelen steeg de laatste jaren, maar is gedaald in 2004. In het SOA peilstation nam het aantal gevallen van Chlamydia toe met 19%, gonorroe met 12%. Ook nam het aantal syfilis en HIV verder toe, vooral bij MSM. In 2000-2004 is het aantal syfilis gevallen bij MSM meer dan verdrievoudigd. 14% van alle gonorroe, Chlamydia en syfilis in MSM wordt gezien bij HIV positieven. Ook is in 2004 de resistentie tegen
ciprofloxacine bij gonorroe verder toegenomen tot 15%. De epidemie van LGV bij MSM heeft tot intensivering van surveillance geleid en sinds januari 2004 zijn 160 gevallen gerapporteerd. LGV gevallen zijn nu ook in andere Europese landen, de VS en Canada gevonden. In Nederland lijkt LGV nog maar langzaam toe te nemen.
Abstract
HIV and Sexually Transmitted Infections in the Netherlands in 2004. An update: November 2005
The increasing trend of Sexually Transmitted Infections (STI) has continued further in 2004, despite a slight levelling off in 2003. The rise was observed both in the number of consultations and STI among heterosexuals and men having sex with men (MSM). In 2004, the number of new HIV diagnoses in the national HIV registry only increased among MSM. Serious epidemics of STI have occurred simultaneously in this group recently. The increase of HIV and STI suggest an increase of sexual risk behaviour among MSM. Alertness and innovative prevention and intervention methods are required to prevent a further spread of STI and HIV.
As of June 2005, a total of 10619 HIV cases were reported in the Netherlands; 938 diagnoses in 2004. MSM still account for the majority of the cases. The number of heterosexually acquired infections declined for the first time in 2004. In the STI sentinel surveillance network, the number of chlamydial cases increased by 19%, that of gonorrhoea by 12%. Also, diagnoses of syphilis and HIV continued to rise in 2004. In 2000-2004, the number of syphilis cases among MSM has more than tripled. 14% of all chlamydial cases, gonorrhoea and syphilis cases among MSM were seen in HIV positives. Furthermore, in 2004 the percentage of ciprofloxacin resistance in gonococci has further increased to 15%. Enhanced surveillance of LGV was started in a response to an outbreak of LGV among MSM. Since January 2004, 160 cases had been reported. LGV has now been reported by other European countries, the USA and Canada as well. In the Netherlands, the number of LGV cases seem to rise slowly.
Preface
This report presents the annual surveillance data and a review of the epidemiology of sexually transmitted infections (STI) and HIV/AIDS in the Netherlands.
In this report we have aimed to produce an overview of recent trends and current developments in the field of STI and HIV/AIDS. We do not pretend to cover STI and HIV/AIDS in great depth but focus on the issues relevant for the current status of HIV and STI in the Netherlands with
commentaries and interpretation of the data. Detailed data supplements are provided in the appendices.
We hope that this report will contribute to a better understanding of the distribution and determinants of STI and HIV/AIDS in the Netherlands and also to improved effectiveness of prevention measures. The information is made accessible for policy makers, researchers in the HIV/AIDS field and anyone with an interest in HIV/AIDS and STI in the Netherlands. More information on HIV/AIDS and STI in the Netherlands is available at www.soahiv.nl and
www.hiv-monitoring.nl.
A copy of this report can also be downloaded in PDF format from www.soahiv.nl.
Acknowledgements
We gratefully acknowledge the collaboration with physicians, public health doctors and nurses, microbiologists, epidemiologists, dermatologists, behavioural scientists, prevention workers and other professionals working in the field of STI and HIV/AIDS. We would like to thank
organisations for their continuing collaboration: HIV Monitoring Foundation (HMF), STI sentinel surveillance network, STI clinics and public health services, SOA AIDS Nederland, GGD
Nederland, Rutgers Nisso group, NIGZ, HIV Vereniging and Schorerstichting.
Further information
Any comment or suggestions that would improve the usefulness of this report are appreciated and should be sent to soahiv@rivm.nl.
Contents
SAMENVATTING---11
SUMMARY---13
1. INTRODUCTION --- 15
2. DIAGNOSED CASES OF HIV AND AIDS --- 19
2.1 HIV CASES--- 19
2.2 NEW HIV DIAGNOSES IN 2004 --- 24
2.3 AIDS CASES AND AIDS RELATED DEATHS--- 25
3. FOCUS ON RISK GROUPS --- 27
3.1 YOUNG PEOPLE--- 27
3.2 MEN WHO HAVE SEX WITH MEN--- 28
3.3 MIGRANT POPULATIONS--- 29
3.4 INJECTING DRUG USERS--- 32
3.5 COMMERCIAL SEX WORKERS AND CLIENTS--- 33
3.6 STI CLINIC ATTENDEES AND OTHER TEST SITES--- 34
4. GENERAL POPULATION--- 37
4.1 BLOOD DONORS--- 37
4.2 PREGNANT WOMEN--- 38
5. HIV INCIDENCE--- 41
6. INTERNATIONAL TRENDS OF HIV/AIDS --- 43
7. STI CLINIC ATTENDEES --- 49
7.1 RECENT TRENDS--- 49
7.2 DETERMINANTS OF ATTENDEES--- 51
8. GENITAL CHLAMYDIAL INFECTION --- 53
8.1 RECENT TRENDS--- 53
8.2 DETERMINANTS OF INFECTION--- 54
8.3 LABORATORY SURVEILLANCE--- 55
8.4 INTERNATIONAL TRENDS OF GENITAL CHLAMYDIAL INFECTION--- 57
9. GONORRHOEA --- 59
9.1 RECENT TRENDS--- 59
9.2 DETERMINANTS OF INFECTION--- 60
9.3 LABORATORY SURVEILLANCE--- 61
9.4 ANTIBIOTIC RESISTANCE IN THE NETHERLANDS--- 62
9.5 INTERNATIONAL TRENDS OF GONORRHOEA--- 64
10. SYPHILIS --- 67
10.1 RECENT TRENDS--- 67
10.2 DETERMINANTS OF INFECTION--- 68
10.3 INTERNATIONAL TRENDS OF SYPHILIS--- 69
11. HEPATITIS B --- 71
11.1 RECENT TRENDS--- 71
11.3 CHRONIC HEPATITIS B --- 72
11.4 MOLECULAR EPIDEMIOLOGY OF HBV --- 74
11.5 INTERNATIONAL TRENDS OF HEPATITIS B --- 74
12. GENITAL WARTS --- 77
12.1 RECENT TRENDS--- 77
12.2 DETERMINANTS OF INFECTION--- 78
12.3 INTERNATIONAL TREND OF GENITAL WARTS--- 78
13. GENITAL HERPES --- 81
13.1 RECENT TRENDS--- 81
13.2 DETERMINANTS OF INFECTION--- 82
13.3 INTERNATIONAL TREND OF GENITAL HERPES--- 82
14. LYMPHOGRANULOMA VENEREUM--- 85
14.1 OUTBREAK OF LGV --- 85
14.2 CURRENT STATUS OF THE LGV OUTBREAK--- 85
15. CONCURRENT STI AND HIV --- 87
15.1 KNOWN HIV INFECTED INDIVIDUALS--- 87
15.2 NEWLY DIAGNOSED HIV INFECTIONS--- 88
16. FOCUS ON YOUNG PEOPLE, MIGRANT POPULATIONS, MSM --- 89
16.1 YOUNG PEOPLE (16-24 YEARS)--- 89
16.2 MIGRANT POPULATIONS--- 91
16.3 MEN WHO HAVE SEX WITH MEN--- 92
17. GENERAL CONCLUSION AND RECOMMENDATIONS --- 95
REFERENCES --- 99
APPENDIX A: SOURCES OF STI AND HIV/AIDS SURVEILLANCE IN THE NETHERLANDS---109
APPENDIX B: METHODS OF SURVEILLANCE---111
APPENDIX C: TABLES AND FIGURES HIV/AIDS SURVEILLANCE--- 117
APPENDIX D: TABLES AND FIGURES STI SURVEILLANCE--- 129
APPENDIX E: HIV MONITORING FOUNDATION--- 145
APPENDIX F: STI SENTINEL SURVEILLANCE NETWORK---151
Samenvatting
HIV/AIDS
In juni 2005 waren in totaal 10619 personen met HIV in Nederland geregistreerd. Eind 2003 waren er naar schatting in Nederland tussen de 16000 en 23000 HIV geïnfecteerden. Mannen die seks hebben met mannen (MSM) vormden de grootste groep (52%), al daalde hun aandeel tussen 1993 en 2001. In 2004 nam het aandeel MSM opnieuw toe. Het aandeel van heteroseksueel
geïnfecteerden steeg in de laatste jaren, maar daalt voor het eerst in 2004. Van de 938 personen die in 2004 met HIV zijn gediagnosticeerd, is 49% homo/biseksueel en 40% heteroseksueel. De groep injecterende druggebruikers blijft klein (1%). Het merendeel van de niet-Nederlandse
heteroseksuelen is in het buitenland geïnfecteerd: in Afrika ten zuiden van de Sahara en in mindere mate in Latijns-Amerika en het Caribische gebied.
De hoogste HIV prevalentie in Nederland wordt gezien bij MSM (0-32%) en injecterende
druggebruikers (0-26%). De HIV prevalentie onder heteroseksueel geïnfecteerden varieert van 0 tot 1,8%. In 2004 is de screening van HIV bij zwangere vrouwen geïmplementeerd. De HIV
prevalentie was 0,06% in de eerste helft van 2004.
Seksueel overdraagbare aandoeningen
In 2003 is de SOA surveillance in Nederland veranderd door de implementatie van het SOA peilstation. De vergelijking met de SOA cijfers van voorgaande jaren wordt hierdoor bemoeilijkt zodat de resultaten met de nodige voorzichtigheid dienen te worden geïnterpreteerd.
De toename van SOA is in 2004 weer verder doorgezet, ondanks een stabilisatie in 2003. Dit betreft zowel het aantal consulten als het aantal SOA bij heteroseksuelen en MSM. In 2004 nam het aantal gevallen van Chlamydia toe met 19% en gonorroe met 12%. Ook nam het aantal gevallen van syfilis, HIV, virale SOA verder toe. De meeste gevallen van syfilis (86% van infecties bij mannen) werden gevonden bij MSM. Het aantal gevallen in MSM is in 2000-2004 meer dan
verdrievoudigd; de toename wordt vooral gezien in steden, zoals Amsterdam, Rotterdam, Den Haag, Utrecht, Groningen en Twente.
Vrouwen jonger dan 25 jaar lopen het grootste risico op Chlamydia of gonorroe; twee derde van hen is jonger dan 25 jaar. Gonorroe wordt, in vergelijking met Chlamydia, vaker gerapporteerd in
stedelijke gebieden, bij MSM en bij patiënten met een eerdere SOA. Etnische minderheden (o.a. afkomstig uit Suriname, de Nederlandse Antillen en Aruba) lopen relatief meer risico op Chlamydia of gonorroe. In 2004 bleek dat de resistentie tegen ciprofloxacine bij gonorroe verder was
toegenomen. In Amsterdam werd deze resistentie in 2002-2003, voor het eerst, vaker gezien bij MSM dan bij heteroseksuelen.
Ook de virale SOA zijn in 2004 verder toegenomen. De incidentie van acute hepatitis B in de aangifte is ongeveer gelijk gebleven; alleen het relatieve aandeel van MSM is enigszins
toegenomen. Genitale wratten waren de meest voorkomende virale SOA gediagnosticeerd in het SOA peilstation.
De epidemie van LGV bij – overwegend HIV positieve - MSM heeft tot intensivering van surveillance geleid en sinds januari 2004 zijn 160 gevallen gerapporteerd. LGV gevallen worden nu ook gevonden in andere Europese landen, de VS en Canada. In Nederland lijkt LGV nog maar langzaam toe te nemen; de meeste gevallen worden gevonden in Amsterdam. Het klinisch beeld is soms moeilijk herkenbaar waardoor de diagnose kan worden gemist. Het werkelijke aantal gevallen van LGV zal vermoedelijk hoger liggen dan het hier gerapporteerde aantal.
Simultane SOA en HIV
Bekend HIV positieve personen nemen een belangrijk deel van de SOA voor hun rekening: 14% van alle gonorroe, Chlamydia en syfilis in MSM werd gevonden bij bekend HIV positieven. In 71%, respectievelijk 40% van de Chlamydia en gonorroe gevallen betrof dit een anorectale infectie. Het seksuele risicogedrag bij MSM is onverminderd hoog met een reëel risico op verdere verspreiding van SOA en HIV. Deze groep is van belang voor de volksgezondheid omdat op dit moment
meerdere epidemieën van SOA (syfilis, LGV, resistente gonorroe en HIV), tegelijkertijd voorkomen in deze groep.
Continue alertheid en innovatieve methoden in preventie en interventie zijn nodig om verdere verspreiding van SOA en HIV te voorkomen.
Summary
HIV/AIDS
As of June 2005, a cumulative total of 10619 HIV cases had been reported in the Netherlands. By the end of 2003, an estimated 16000 to 23000 people were living with HIV/AIDS in the
Netherlands. Men who have sex with men (MSM) still account for the majority of the registered cases (52%), although the proportion has decreased between 1993 and 2001. In 2004, the proportion of MSM increased again. The number of heterosexually acquired infections has increased in recent years but declined for the first time in 2004. Of the 938 new HIV diagnoses in 2004, MSM
accounted for 49% and heterosexuals for 40%. The proportion of IDUs remains fairly small, 1%. The majority of the non-Dutch heterosexuals acquired the HIV infection abroad; in sub-Saharan Africa and to a lesser extent in Latin America and the Caribbean.
HIV prevalence in the Netherlands is highest among MSM (0-32%) and IDUs (0-26%). HIV prevalence among heterosexuals varies from 0 to 1.8%. In 2004, national screening of HIV in pregnant women was implemented in the Netherlands. The HIV prevalence was 0.06% in the first half of 2004.
Sexually Transmitted Infections
In 2003, STI surveillance in the Netherlands was converted into an STI sentinel surveillance network. The resultant lack of comparable data hampered comparison of data, so results should be interpreted with caution.
The increasing trend of STI has continued further in 2004, despite a slight levelling off in 2003. The rise was observed both in the number of consultations and STI among heterosexuals and MSM. The number of genital chlamydial infection increased by 19% and gonorrhoea increased by 12%.
Furthermore, diagnoses of syphilis, HIV and viral STI continued to increase in 2004. MSM
accounted for 86% of diagnoses of syphilis in men. The number of syphilis cases in MSM has more than tripled in 2000-2004; the rise was mainly seen in cities, like Amsterdam, Rotterdam, The Hague, Utrecht, Groningen and Twente region.
Women younger than 25 years of age are at highest risk of acquiring genital chlamydial infection or gonorrhoea; two-thirds of those were younger than 25 years. Compared with genital chlamydial infection, gonorrhoea tends to be a more concentrated disease with higher rates in urban areas, among MSM and individuals with a prior STI. Specific ethnic minorities (for example, those from Surinam, Netherlands Antilles and Aruba) are at high risk for both genital chlamydial infection and gonorrhoea. In 2004, the percentage of ciprofloxacin resistance in gonococci seemed to have further increased. In 2002-2003, observed resistance in Amsterdam was for the first time higher in MSM than in heterosexuals.
Between 2003 and 2004, the number of diagnosed viral STI further increased. The incidence of notified cases of acute hepatitis B infections remained the same; only the proportion of MSM
slightly increased. Genital warts were the most common viral STI, seen in the STI sentinel surveillance network in 2004.
Enhanced surveillance of LGV was started in a response to an outbreak of LGV among
predominantly HIV positive MSM. Since January 2004, 160 cases had been reported. LGV has now been reported by other European countries, the USA and Canada as well. In the Netherlands, the number of LGV cases seem to rise slowly and the majority is reported from Amsterdam. As clinical signs are easily missed, the number of LGV cases reported here represents probably a minimum estimate of disease occurrence.
Concurrent STI and HIV
Known HIV infected individuals account for an important part of STI: 14% of all cases of gonorrhoea, genital chlamydial infection and syphilis in MSM are seen in known HIV infected MSM. Among these, anorectal infections were seen in 71% of the diagnoses of chlamydia and in 40% of gonorrhoea. Unsafe sex practices are on-going in MSM with a potential risk of a further spread of STI and HIV. MSM form a major public health concern because various epidemics (e.g., syphilis, LGV, resistant gonorrhoea and HIV) occur simultaneously in this group.
Permanent alertness and innovative prevention and intervention methods will be needed to prevent a further spread of STI and HIV.
1.
Introduction
This report summarizes national surveillance data for HIV/AIDS and STI in the Netherlands. It is prepared by the STI/HIV Surveillance Unit (SU) of the National Institute for Public Health and the Environment (RIVM). The core task of the SU is to monitor trends in STI and HIV in the Netherlands and to identify determinants of infection to provide insight in the occurrence of these diseases. The SU collaborates with numerous partners in the field of STI and HIV to collect data for surveillance, e.g. STI clinics, public health services, the HIV Monitoring Foundation (HMF), public health laboratories and other health care providers.
Available data on HIV and STI from surveys, national registries and cohort studies are compiled in this report and provide an overview of the current status of HIV and STI in the Netherlands. Preliminary data have been presented at the annual expert meeting on the surveillance of STI and HIV. The objective of the expert meeting is to review the current trends in STI and HIV in the Netherlands and to identify gaps in our knowledge. Based on this evaluation, modifications in current surveillance activities or new surveillance initiatives are suggested to the steering committee of STI and HIV/AIDS surveillance. The steering committee reviews the suggestions and advises the Ministry of VWS to improve the response to the actual HIV and STI situation in the Netherlands. Recommendations for 2005 included the implementation of a national
surveillance of resistance in gonococci as well as the design for behavioural surveillance among sub-groups, e.g. STI clinic attendees, men having sex with men (MSM), HIV positives, ethnic minorities etc. Finally, a feasibility study was suggested to investigate the contribution of recently acquired HIV infections among newly diagnosed HIV infections.
The information is made accessible for policy makers, researchers in the HIV/AIDS field and anyone with an interest in HIV/AIDS and STI in the Netherlands. More information on
HIV/AIDS and STI in the Netherlands is available at www.soahiv.nl and www.hiv-monitoring.nl.
In part A the results of HIV surveillance are described and in part B the results of STI
surveillance. In appendix C and D detailed tables and figures are presented. Sources and methods of STI and HIV surveillance are described in appendix A and B.
Limitations of data
The data on the STI sentinel surveillance network for 2004 are not completed yet, due to technical problems to extract data from the newly implemented (in April 2004) patient registry at the STI clinic in Amsterdam. Preliminary data on Amsterdam are included in the SOAP database but data on various parameters are still missing (prior STI, prior HIV test, ethnicity, intravenous drug use). NA Amsterdam: indicates that data for Amsterdam STI clinic were not available.
2.
Diagnosed cases of HIV and AIDS
Key points
− A cumulative total of 10619 HIV cases had been reported in the Netherlands up to June 2005. The number of people living with HIV in 2003 is estimated at 16000-23000.
− In 2004, 938 new HIV cases were diagnosed (2.6 new diagnoses/day).
− In 2004, HIV diagnoses only increased among MSM. Similar increases had been reported in various European countries from 2002 onwards.
− In 2004, MSM accounted for 49% of the new HIV diagnoses; heterosexuals 40%, IDUs 1%. − The increase of HIV diagnoses in heterosexuals, as observed over the past years, levelled off in
2003/2004.
− HIV prevalence in the Netherlands was highest among MSM (0-32%) and IDUs (1-26%). HIV prevalence among heterosexuals was low (0–1.4%).
− HIV prevalence among pregnant women in the Netherlands was 0.06% in the first half of 2004. − As of end 2004, a cumulative total of 6591 AIDS cases and 4150 AIDS deaths were reported.
2.1
HIV cases
0 200 400 600 800 1000 1200 <1985 1985 1986 1987 1988 1989 1990 1991 1992 1993 1994 1995 1996 1997 1998 1999 2000 2001 2002 2003 2004 2005 0 2000 4000 6000 8000 10000 12000Footnote: only HIV patients with a known date of diagnosis are included; 2005: cases registered by June 1st (not complete)
Figure 1: Number of HIV cases (right axis: cumulative), by year of HIV diagnosis
In June 2005, a cumulative total of 10619 HIV cases had been registered by HIV treatment centres in the national database of the HIV Monitoring Foundation (HMF)1 [www.hiv-monitoring.nl]. In 2004, 938 new cases of HIV were diagnosed (Figure 1). Of all registered cases, 8215 (77%) were
men and 2404 (23%) were women. Ninety eight percent of the individuals were infected with HIV-1, 0.5% with HIV-2 and 1% with HIV-1 and HIV-2.
Geographical differences
Forty three percent of all HIV infected individuals were seen in treatment centres in Amsterdam (Table C.1). Rates of HIV infections per 100000 inhabitants in 2004 are shown for each province in Figure 2.
The province of North Holland has the highest HIV rate (10.9/100000), followed by the province of Utrecht (8.6/100000). In 2004, the number of HIV diagnoses outside Amsterdam (in particular in Utrecht and Rotterdam) increased whereas in Amsterdam, the number of HIV diagnoses remained stable more or less and slightly decreased (Figure 3).
Figure 2: Number of HIV diagnoses in 2004 per 100000 inhabitants; calculations based on HIV infections diagnosed in the various HIV treatment centres in each province
0 100 200 300 400 500 600 700 <1986 1986 1987 1988 1989 1990 1991 1992 1993 1994 1995 1996 1997 1998 1999 2000 2001 2002 2003 2004 Amsterdam outside Amsterdam
Figure 3: Number of new HIV diagnoses in Amsterdam and outside Amsterdam, by year of HIV diagnosis 0 50 100 150 200 250 300 350 400 450 500 <1985 1985 1986 1987 1988 1989 1990 1991 1992 1993 1994 1995 1996 1997 1998 1999 2000 2001 2002 2003 2004 MSM Hetero IDU Blood(contacts) MTCT
Needle stick injury Unknown
Footnote: MTCT= mother to child
Figure 4: Number of HIV cases, by year of HIV diagnosis and transmission risk group
Transmission risk groups
Until 2000, the most frequently reported transmission route for HIV infection was male-to-male sexual contact. Thereafter, the number of HIV infections among heterosexuals increased up to the
same level as MSM. In 2004, however, the absolute number of HIV infections among MSM
increased again and exceeded the number of infections among heterosexuals; (table C.8) (Figure 4). In 2004, HIV diagnoses only increased among MSM (Figure 4). Diagnoses among heterosexual men remained stable (Figure 5).
0 50 100 150 200 250 300 350 400 450 500 <1985 1985 1986 1987 1988 1989 1990 1991 1992 1993 1994 1995 1996 1997 1998 1999 2000 2001 2002 2003 2004 MSM heterosexual men heterosexual women
Figure 5: Number of HIV cases by year of HIV diagnosis and gender and MSM
Only five percent of the HIV infections were diagnosed in IDUs. Individuals with risk through blood (products) accounted for 1% of the infections (Table C.2). No likely route of transmission could be identified in 7% of the HIV cases.
Overall, more than half (57%) of the HIV infected individuals originated from the Netherlands. The proportion of Dutch HIV infected individuals gradually decreased from 70% until 1992 to
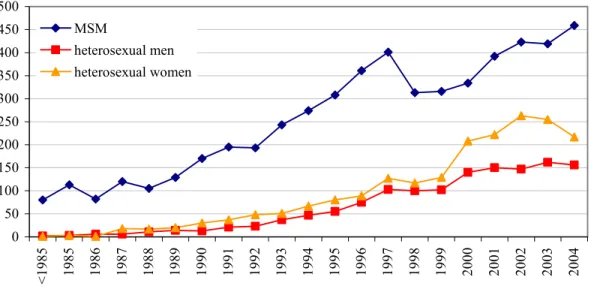
approximately 50% in 2000-2003. In 2004, the proportion of Dutch individuals slightly increased again. The largest non-Dutch group consisted of sub-Saharan Africans (SSA), e.g. 17% of the HIV cases. The second largest non-Dutch group (11%) comprised individuals from the Caribbean and Latin America, predominantly Surinamese and Antilleans (67%). Most HIV infected men originated from the Netherlands (65%), whereas the largest non-Dutch group among women were those from sub-Saharan Africa (44%) (Figure 6).
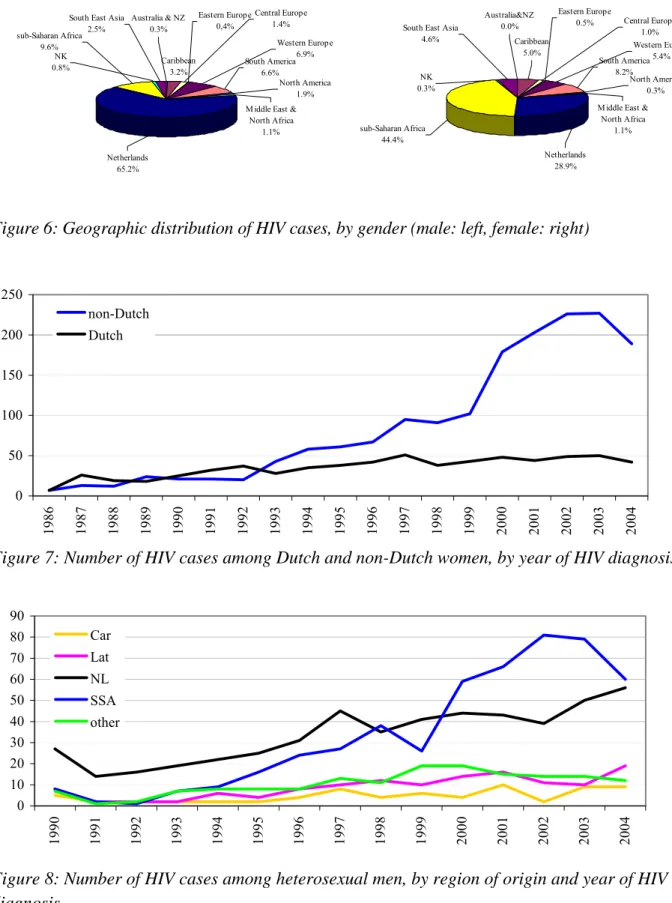
Figure 6: Geographic distribution of HIV cases, by gender (male: left, female: right) 0 50 100 150 200 250 1986 1987 1988 1989 1990 1991 1992 1993 1994 1995 1996 1997 1998 1999 2000 2001 2002 2003 2004 non-Dutch Dutch
Figure 7: Number of HIV cases among Dutch and non-Dutch women, by year of HIV diagnosis
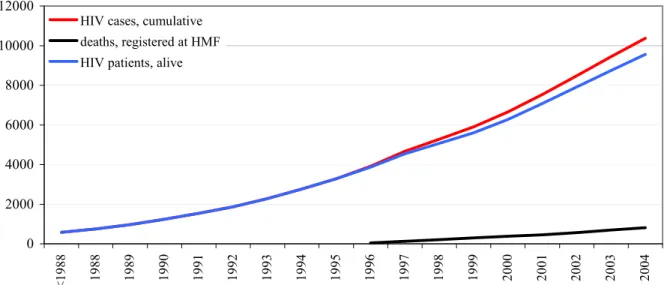
0 10 20 30 40 50 60 70 80 90 1990 1991 1992 1993 1994 1995 1996 1997 1998 1999 2000 2001 2002 2003 2004 Car Lat NL SSA other
Figure 8: Number of HIV cases among heterosexual men, by region of origin and year of HIV diagnosis Eastern Europe 0,4% Western Europe 6.9% North America 1.9% M iddle East &
North Africa 1.1% Netherlands 65.2% NK 0.8%
South East Asia 2.5% sub-Saharan Africa 9.6% Central Europe 1.4% Australia & NZ 0.3% South America 6.6% Caribbean 3.2% Caribbean 5.0% Eastern Europe 0.5% Western Europe 5.4% North America 0.3% M iddle East &
North Africa 1.1% Netherlands 28.9% NK 0.3% South East Asia
4.6% sub-Saharan Africa 44.4% Central Europe 1.0% Australia&NZ 0.0% South America 8.2%
Over time, the number of new diagnoses among Dutch women remained stable: less than 50 cases per year (Figure 7). The number of non-Dutch women significantly increased over time (61% in 1996; 82% in 2004, p<0.0001, chi-square test), due to an increase of women from sub-Saharan Africa (33% in 1996; 60% in 2002; 55% in 2004). The proportions of women from other regions did not change significantly over time. A similar trend was observed for heterosexual men from SSA between 1999 and 2002. In contrast to women, the number of Dutch men slightly increased after 2002 (Figure 8).
The majority of MSM originated from the Netherlands (74%) (Table 1). Other frequently reported regions were Western Europe (8%), Latin America (6%), the Caribbean (3%) and South (East) Asia (3%). Most IDUs were from the Netherlands (67%), other Western European countries (18%), and Latin America (4%). Most HIV infected individuals were between 24 and 49 years of age at diagnosis (78%). Men had a median age of 36 years, whereas women were significantly younger: 30 years. This did not change over time. In general, non-Dutch individuals were younger than Dutch (Table C.6).
Table 1: Number of HIV cases, by transmission risk group and region of origin
Region of origin MSM (%) Heterosexual (%) IDU (%)
The Netherlands Western Europe Central Europe Eastern Europe Sub-Saharan Africa Caribbean Latin America North America
North Africa & Middle East Australia & Pacific
South (East) Asia
Not reported/not known
4113 (74%) 424 (8%) 59 (1%) 21 (0.4%) 71 (1%) 147 (3%) 331 (6%) 134 (2%) 29 (0.5%) 17 (0.3%) 153 (3%) 43 (0.8%) 1025 (30%) 106 (3%) 55 (2%) 11 (0.3%) 1539 (44%) 193 (6%) 327 (9%) 7 (0.2%) 54 (2%) 1 (0%) 132 (4%) 7 (0.2%) 376 (67%) 99 (18%) 8 (1%) 10 (2%) 6 (1%) 5 (1%) 22 (4%) 6 (1%) 13 (2%) 1 (0.2%) 10 (2%) 7 (1%) Total 5556 3465 563
Footnote: MSM: men having sex with men; IDU: injecting drug user
2.2
New HIV diagnoses in 2004
Of the 938 new HIV diagnose, 707 (75%) were male and 231 (25%) were female. Of those, 89% were infected sexually: 40% through heterosexual contact and 49% through MSM. Of all men, 65% acquired the infection through sex with men. Of all women, 94% acquired the infection through heterosexual contact. Of all heterosexual cases, 58% were female. Injecting drug use accounted for 1% (n=9) of the new diagnoses and risk through blood (products) for 0.4% (n=4). For 9%, the transmission risk group was undetermined (Table C.10).
In 2004, 30% of the cases were diagnosed in Amsterdam (2003: 38%) and 43% (2003: 33%) in Rotterdam, The Hague and Utrecht (Table C.11). Of the newly diagnosed cases, 54% came from the Netherlands, 23% from sub-Saharan Africa, 12% from Latin America and the Caribbean (Table C.12). Seventy six percent of the cases diagnosed in 2004 were between 24 and 49 years of age. Twenty two cases (2%) were identified among teenagers (15-19 years). The median age at diagnosis in 2004 was 36 years and differed per risk group: the median age in MSM was 39 years, in
heterosexuals 33 years and in IDUs 36 years (Table C.13-16).
2.3
AIDS cases and AIDS related deaths
0 100 200 300 400 500 600 1983 1984 1985 1986 1987 1988 1989 1990 1991 1992 1993 1994 1995 1996 1997 1998 1999 2000 2001 2002 2003 2004 Deaths AIDS cases
Footnote: the low value in 1999 is caused by the change in data sources of AIDS cases (sources: AIDS registration Health Inspectorate <2000, HIV Monitoring Foundation >2000)
Figure 9: Number of AIDS cases and AIDS related deaths
By June 2005, a cumulative total of 6648 AIDS cases was registered in the Netherlands (Table C.17-18). The annual incidence of AIDS cases peaked in 1995, and declined sharply over the subsequent four years (Figure 9). Since 1999, the rate of decline had slowed and the curve stabilised at 250-290 cases per year. The decline of AIDS cases is mainly due to the availability of highly active antiretroviral therapy (HAART), which slowed progression from HIV to AIDS.2
The proportion of reported AIDS cases in MSM declined from 77% in 1988 to 43% in 2004. Conversely, the proportion of heterosexual AIDS cases increased from 6% in 1988 to 44% in 2002 and declined to 39% in 2004. The proportion of IDUs with AIDS fluctuated over the years between 2-14%. Overall, in 4% of the AIDS cases the route of transmission remained unknown (Table C.18). The median age at AIDS diagnosis in 2004 was 40 years; men were older than women, respectively
41 and 37 years. On average, Dutch individuals were older at AIDS diagnosis than individuals of African origin: 43 and 37 years (Table C.19-20).
The number of AIDS related deaths showed a similar trend (Figure 9). Between 1983 and 2004, a cumulative total of 4150 individuals died because of HIV/AIDS; 85 died in 2004. HAART had a major effect on AIDS related deaths3 and, as a consequence, the number of people living with HIV and AIDS increased. The estimated numbers of HIV- and AIDS patients alive are over 9550 and 2400, respectively (Figure 10, Figure 11).
0 2000 4000 6000 8000 10000 12000 < 198 8 198 8 198 9 199 0 199 1 199 2 199 3 199 4 199 5 199 6 199 7 199 8 199 9 200 0 200 1 200 2 200 3 200 4
HIV cases, cumulative deaths, registered at HMF HIV patients, alive
* based on individuals with a known year of HIV diagnosis (see also: national report HMF, 2005).
Figure 10: Cumulative number of HIV cases, deaths, and HIV patients alive, by calendar year
0 1000 2000 3000 4000 5000 6000 7000 <1 98 7 19 88 19 89 19 90 19 91 19 92 19 93 19 94 19 95 19 96 19 97 19 98 19 99 20 00 20 01 20 02 20 03 20 04
AIDS cases, cumulative AIDS deaths, cumulative AIDS patients, alive
Figure 11: Cumulative number of AIDS cases, AIDS deaths, and AIDS patients alive, by calendar year
3.
Focus on risk groups
3.1
Young people
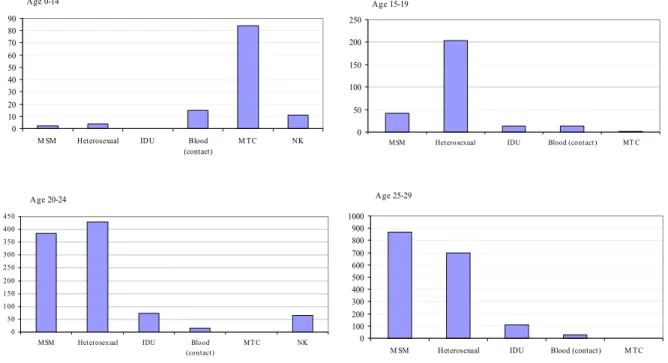
Of all registered HIV cases, 320 (3%) were teenagers (10-19 years), 966 (10%) were young adults (20-24 years) and 1832 (18%) were individuals aged 25-29 years. The distribution of the
transmission risk groups differed per age group. Children aged 0-15 most often acquired the infection from their mother. Among teenagers aged 15-19, the majority is infected through heterosexual contact; while among individuals above 20 years sex between men became increasingly important (Figure 12).
Footnote:MTC=mother to child; NK: not known
Figure 12: Number of HIV infected individuals, by age group and transmission risk group
Sixty three percent of the children < 15 years were Dutch and 26% were from sub-Saharan Africa. Of children aged 15-19, 59% were from sub-Saharan Africa. Young adults
(20-29 years) were from the Netherlands (40%), sub-Saharan Africa (28%) and Latin America/Caribbean (14%). Age 0-14 0 10 20 30 40 50 60 70 80 90
M SM Heterosexual IDU Blood (contact) M TC NK Age 15-19 0 50 100 150 200 250
MSM Heterosexual IDU Blood (contact) MT C
Age 20-24 0 50 100 150 200 250 300 350 400 450
MSM Heterosexual IDU Blood (contact) MT C NK Age 25-29 0 100 200 300 400 500 600 700 800 900 1000
3.2
Men who have sex with men
The majority of HIV infected MSM is Dutch (74%) (Table 1). The absolute number of Dutch MSM increased from 125 in 1990 to 356 in 2004 (Figure 13). The number of MSM from Latin America/Caribbean also showed an increasing trend until 2002 and then seemed to drop. For 69% of the MSM, the country of infection was known (Table C.23). The majority of the MSM (89%) were infected in the Netherlands; 97% among Dutch MSM and 59% among non-Dutch.
Figure 13: Numbers of HIV infected MSM from the Netherlands (left) and other geographic regions (right), by year of diagnosis
Of all MSM, 8% is younger than 25 years at HIV diagnosis (Table C.5). Ten percent is 50 years or older. MSM are, in general, younger at HIV diagnosis than heterosexual men (Table 2, Table 3). MSM from the Caribbean and Latin-America are the youngest: 32 years. The oldest are MSM from the Netherlands: 37 years. Over time, age at HIV diagnosis has increased considerably (Figure C.6). For Dutch MSM, the age increased from 32 in 1985 to 40 years in 2004. In 2000, 30% of the MSM were diagnosed at age ≥ 40. In 2004, this percentage increased up to 44% (Table C.24).
Table 2: Median age (years) of MSM population, by region of origin
Region of origin Total (age/IQR)
The Netherlands Western Europe Sub-Saharan Africa Caribbean
Latin America South (East) Asia
37.2 (31.4-44.1) 33.0 (28.1-39.3) 33.2 (27.6-38.5) 31.9 (27.0-37.6) 31.8 (27.1-37.0) 33.2 (28.4-39.4) Footnote: IQR= interquartile range
0 5 10 15 20 25 30 35 40 45 50 1990 1991 1992 1993 1994 1995 1996 1997 1998 1999 2000 2001 2002 2003 2004 W estern Europe the Caribbean & LA sub-Sahara Africa South (East) Asia
0 50 100 150 200 250 300 350 400 1990 1991 1992 1993 1994 1995 1996 1997 1998 1999 2000 2001 2002 2003 2004 NL
Heterosexual 17% Blood (products) 1% IDU 6% other/NK 6% MSM 69% MSM 32% Heterosexual 58% other/NK 6% IDU 4% Blood (products) 0% MSM 39% Heterosexual 49% other/NK 9% Blood (products) 1% IDU 2% MSM 4% Heterosexual 83% Blood (products) 2% other/NK 10% MTC 1% Netherlands Surinam Netherlands Antilles, Aruba sub-Saharan Africa
3.3
Migrant populations
Of all registered HIV patients, 42% were born abroad and half of them were infected through heterosexual contact. The majority (41%) of the migrants originated from sub-Saharan Africa, 25% from Latin America/Caribbean, 15% from Western Europe, and 7% from South (East) Asia.
Figure 14 shows the distribution of transmission risk groups among HIV patients for different regions of origin. The largest risk group among the Dutch population was MSM (68%), while MSM only accounted for 4% of the infections among Africans. The proportions of MSM among individuals from Surinam and the Netherlands Antilles were 31% and 39%, respectively.
Footnote MTC: mother to child; IDU: injecting drug use; MSM: men having sex with men; NK: not known
Figure 14: HIV infected individuals, by transmission risk group and region of origin
Country of infection
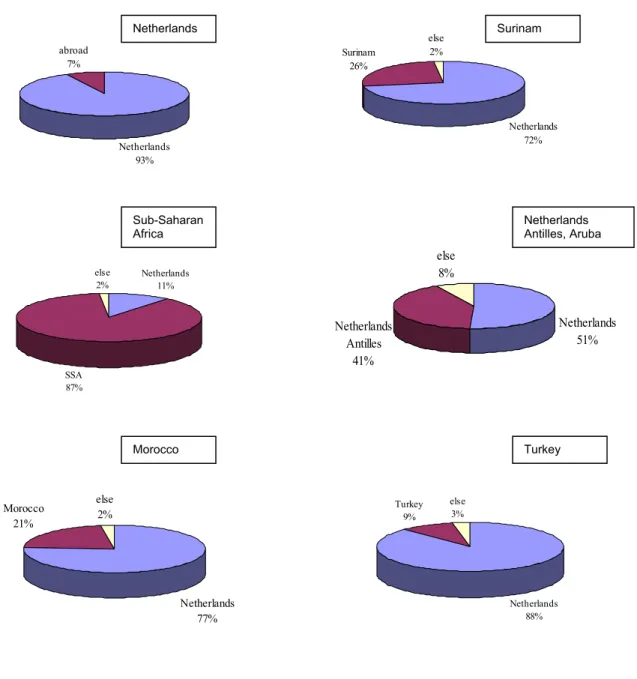
Eighty-seven percent of the individuals from sub-Saharan Africa, for whom the country of infection is known (73%), were infected in SSA. Among Surinamese individuals, only 26% were infected in Surinam and 72% in the Netherlands (Figure 15). Forty-one percent of the individuals from the Netherlands Antilles/Aruba were infected in their region of origin. Most people from Turkey and Morocco reported to be infected in the Netherlands (see also: report HMF, 2005).1
Netherlands 93% abroad 7% Netherlands 11% SSA 87% else 2% Netherlands 72% Surinam 26% else 2% Netherlands 51% Netherlands Antilles 41% else 8% Netherlands 77% Morocco 21% else 2% Netherlands 88% Turkey 9% else 3%
Figure 15: HIV patients, by country of birth (textbox) and country of infection
For HIV patients from Surinam or the Netherlands Antilles, the country of infection differed between risk groups: MSM from Surinam or the Antilles and heterosexuals from Surinam more often acquired the infection in the Netherlands; whereas heterosexuals from Antilles/ Aruba more often became infected in the country of origin (Figure 16).
Netherlands Surinam Sub-Saharan Africa Netherlands Antilles, Aruba Morocco Turkey
Figure 16: HIV infected from Surinam (left) and the Netherlands Antilles/Aruba (right), by transmission risk group and country of infection
Age at diagnosis
Among heterosexual women, African women were the youngest at diagnosis (median age: 28.5 years). Dutch and West European women were the oldest: 32 years. Among heterosexual men, Asian men were the oldest: 45 years and African the youngest: 34 years (Table 3).
The median age at diagnosis was stable over time for heterosexuals from sub-Saharan Africa, and Latin America/Caribbean (Figure C.5). The median age of Dutch heterosexuals increased from 28 years in 1992 to 41 years in 2004 (Figure C.6).
Table 3: Median age (years) of heterosexual population, by region of origin and gender
Region of origin Male (age/IQR) Female (age/IQR) Total (age/IQR) The Netherlands
Western Europe Sub-Saharan Africa Caribbean
Latin America South (East) Asia
40.6 (33.1-49.5) 36.2 (32.8-45.6) 33.6 (28.4-38.5) 36.2 (30.4-43.8) 37.5 (32.7-46.6) 45.3 (37.1-50.1) 31.7 (26.0-41.7) 31.7 (28.9-40.5) 28.5 (23.8-34.0) 30.8 (24.9-38.1) 31.3 (26.9-38.0) 30.7 (27.4-35.3) 35.9 (28.9-46.0) 34.8 (30.2-43.1) 30.4 (24.9-35.8) 33.0 (27.1-40.0) 34.1 (28.5-41.6) 32.5 (28.1-39.8) Footnote: IQR= interquartile range
Additional anonymous unlinked HIV surveys
Sub-Saharan Africans, Surinamese and Antilleans form relatively large migrant populations in the Netherlands. However, little is known about these groups and the determinants of risk behaviour in the country of origin. To obtain more insight in risk behaviour, ‘intermixing’ (sexual contact between various ethnic groups), and the potential to further spread of HIV, anonymous unlinked surveys were conducted in these populations.
In 2002, the RIVM started HIV surveys among Surinamese, Antilleans and sub-Saharan Africans. At least 200 participants of each ethnic subgroup were included in a survey. Locations for
recruitment (e.g. festivals, churches, sports events, and community centres) were determined in the course of social mapping together with migrant organizations and the local municipal health service. 0% 10% 20% 30% 40% 50% 60% 70% 80% 90% MSM Heterosexual country of origin Netherlands Else 0% 10% 20% 30% 40% 50% 60% 70% 80% MSM Heterosexual country of origin Netherlands Else
Between 2002 and 2004, two surveys were conducted in Rotterdam and Amsterdam, in collaboration with the local public health services.4,5 Results are summarized in Table 4.
Table 4: HIV prevalence and risk behaviour amongst migrants
Region Year of
survey
HIV prevalence Condom use V steady partner Condom use V casual partner Condom use V casual partner in country of origin Surinamese Rotterdam 2002/2003 0.5% [0-1.5%] 9% 43% 77% Surinamese Amsterdam 2003/2004 0.6% [0-1.8%] 15% 53% 65% Antilleans/ Arubans Rotterdam 2002/2003 0.5% [0-1.7%] 9% 36% 26% Antilleans/ Arubans Amsterdam 2003/2004 0.6% [0-1.6%] 9% 44% 67% Cape Verdians Ghanese Rotterdam Amsterdam 2002/2004 2003/2004 1.0% [0-2.7%] 0.6% [ 0-1.7%] 12% 26% 51% 57% 81% 42%
V Condom use: last 6 months always used condoms
HIV prevalence rates were adjusted by using statistical simulations by means of Monte Carlo techniques, for more information.4,5
3.4
Injecting drug users
Between 1994 and 2003, 16 surveys among IDUs were conducted in the Netherlands. The primary objectives were to monitor HIV prevalence and risk behaviour to assess the potential for further spread of HIV. IDUs were enlisted through health care institutions, supplemented by recruitment at street and detainment sites. The study population is made up of IDUs who use hard drugs regularly. Respondents were asked to give a saliva sample for HIV antibody testing and a questionnaire on demographics and risk behaviours.6
Approximately, 3500 IDUs participated in the surveys in various cities in the Netherlands. HIV prevalence ranged from 0.5 to 26% (Table 4). The highest prevalence rates were found in Amsterdam (26%) and Heerlen (South Limburg, 22%). HIV prevalence remained stable in all cities except for Heerlen (1994:11%, 1996; 16%, 1998/99: 22%).
In the six months preceding the survey, a considerable proportion of the IDUs had borrowed syringes or needles from someone else (11-30% of current injectors) and not always used condoms with steady partners (76-96%), casual partners (39-73%) or clients (13-50%).
The percentage of IDUs reporting recent borrowing of drug equipment decreased in all cities where repeated surveys were conducted.6,7
Table 5: HIV prevalence and risk behaviour amongst IDUs
Region Year of survey HIV prevalence Borrowing I Condom use V steady partner Condom use V casual partner Condom use V clients Amsterdam 1996 1998 26% 26% 18% 12% 24% 15% 60% 53% 70% 71% Rotterdam 1994 1997 2002/2003 12% 9% 10% 18% 10% 8% 9% 16% 15% 53% 46% 57% 80% 69% 68% South LimburgII 1994 1996 1999 10% 12% 14% 19% 17% 10% 14% 13% 11% 39% 61% 51% 87% 83% 75% Utrecht 1996 5% 17% 16% 55% 83% Arnhem 1991/1992 1995/1996 1997 2% 2% 1% 42% 39% 16% na 10% 4% na 49% 47% 60% 79% 78% Groningen 1997/1998 1% 11% 11% 43% 76% BrabantIII 1999 5% 17% 12% 39% 83% The Hague 2000 2% 21% 16% 27% 60% TwenteIV 2000 3% 30% 8% 32% 50%
Footnote: IDU: ever injected drugs and using hard drugs at least once a week (i.e. heroine, cocaine products, amphetamine or methadone) in the six months prior to recruitment I. Percentage of IDUs that borrowed used syringes or needles in the last six months. II. Percentage of IDUs infected with HIV in Maastricht: 8% (1994), 3% (1996), 5% (1999); in Heerlen: 11% (1994), 17% (1996) en 22% (1999). III. Eindhoven, Helmond, Den Bosch. IV. Almelo, Hengelo, Enschede. V. Condom use: last 6 months always used condoms. NA= not available
3.5
Commercial sex workers and clients
Commercial sex workers (CSW) have many sexual contacts, and their clients can form a bridge to the general population. The anonymous unlinked HIV surveys were also targeted at these risk groups. The main purpose was to investigate HIV prevalence, sexual risk behaviour with clients and non-commercial partners, and the mobility of CSW. The first CSW surveys were conducted in Rotterdam (2002) and Amsterdam (2003/2004). In Rotterdam, 110 CSW were recruited in the streetwalkers’ district or in clubs and brothels.4 In Amsterdam, 255 CSW in the street-based- and window prostitution were included, and in a relief centre for drug-using CSW.5 Results from the surveys are summarized in Table 6.
In 2004, a pilot among 52 clients of CSW was carried out in Amsterdam to assess the feasibility of an HIV survey in this group. None of the clients were HIV infected. Clients regularly used
condoms with CSW (82%). However, condom use with steady and casual partners was relatively low. The fieldwork of this pilot appeared to be very time-consuming and labour-intensive.5 These results, combined with the HIV prevalence among CSW (7%) suggest a potential risk for
Table 6: HIV prevalence and risk behaviour amongst CSW in Rotterdam and Amsterdam
Region HIV prevalence * Condom use V
clients Condom use V steady partner Condom use V casual partner Rotterdam (2002/2003) Total population CSW 7.2% [2.8-12.0%] 88% 15% 25% Street-based CSW 12.3% [5.2-21.0%] 84% 15% 33% Establishment-based CSW 1.9% [0.0-5.9%] 92% 15% 17% Amsterdam (2003/2004) Total population CSW 6.5% [3.7-9.9%] 79% 10% 40% Female CSW 3.1% [0.6-6.3%] 94% 10% 36% Drug using CSW 11.3% [3.8-20.8%] 40% 0% 25% Transgender CSW 17.1% [3.4-31.0%] 70% 17% 64%
V Condom use: last 6 months always used condoms
HIV prevalence rates were adjusted by using statistical simulations by means of Monte Carlo techniques.4,5
3.6
STI clinic attendees and other test sites
Visitors of STI clinics are, in general, at higher risk of HIV infection. HIV testing is recommended whenever a person is examined for or diagnosed with an STI.
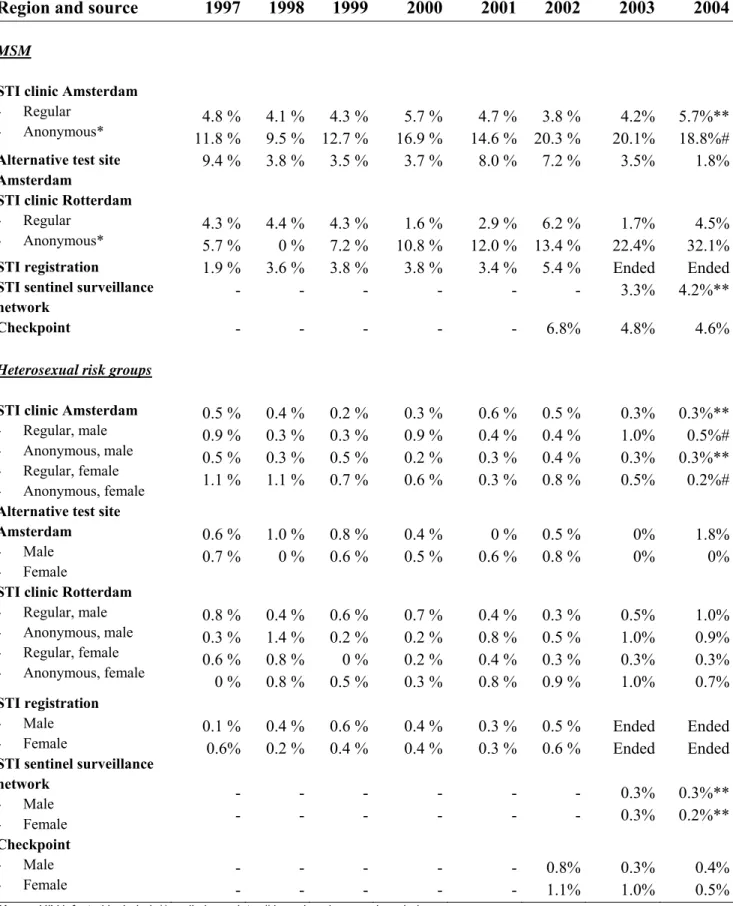
Table 7 provides an overview of trends in HIV positive test results obtained from surveys at STI clinics in Amsterdam and Rotterdam, the former STI registration (until 2003), and the STI sentinel surveillance network (from 2003).8-10
Among MSM, HIV prevalence rates varied between 0 and 32% (Table 7). HIV prevalence in the anonymous surveys is higher than that in regular HIV tests by name. In the anonymous survey among MSM in Amsterdam, an increase of HIV prevalence was observed over time (up to 20% in 2003). The increase, however, was mainly caused by known HIV positive MSM attending the STI clinic.
At the alternative test site of the MHS in Amsterdam, HIV prevalence among MSM varied between 4 and 9%. There was no significant trend overtime.11 At ‘Checkpoint’, a one-hour HIV
testing facility in Amsterdam that started in June 2002, the HIV prevalence among MSM was 4.6% in 2004, which is similar to the prevalence at the regular screening at the STI clinic (4.2%).
Approximately, 1000 HIV tests were done at Checkpoint in 2004.12 Checkpoint is staffed by the HIV association Netherlands (HIV Vereniging Nederland) and focuses on MSM. The rapid procedure may persuade those at high risk who refrain from or postpone HIV testing because of the one-week waiting period after the conventional HIV test. In 2004, 69% of the visitors give ‘rapidity of the test result’ as the main reason to visit Checkpoint. For more information:
www.hivnet.org.
Table 7: HIV prevalence among STI clinic attendees and other test sites
Region and source 1997 1998 1999 2000 2001 2002 2003 2004
MSM
STI clinic Amsterdam
- Regular
- Anonymous* 11.8 % 4.8 % 4.1 %9.5 % 12.7 %4.3 % 16.9 %5.7 % 14.6 %4.7 % 20.3 % 3.8 % 20.1%4.2% 5.7%**18.8%#
Alternative test site Amsterdam
9.4 % 3.8 % 3.5 % 3.7 % 8.0 % 7.2 % 3.5% 1.8%
STI clinic Rotterdam
- Regular
- Anonymous* 4.3 % 5.7 % 4.4 %0 % 4.3 %7.2 % 10.8 %1.6 % 12.0 %2.9 % 13.4 % 6.2 % 22.4%1.7% 32.1%4.5%
STI registration
STI sentinel surveillance network 1.9 % - 3.6 % -3.8 % -3.8 % -3.4 % -5.4 % - Ended 3.3% Ended 4.2%** Checkpoint - - - 6.8% 4.8% 4.6%
Heterosexual risk groups
STI clinic Amsterdam
- Regular, male - Anonymous, male - Regular, female - Anonymous, female 0.5 % 0.9 % 0.5 % 1.1 % 0.4 % 0.3 % 0.3 % 1.1 % 0.2 % 0.3 % 0.5 % 0.7 % 0.3 % 0.9 % 0.2 % 0.6 % 0.6 % 0.4 % 0.3 % 0.3 % 0.5 % 0.4 % 0.4 % 0.8 % 0.3% 1.0% 0.3% 0.5% 0.3%** 0.5%# 0.3%** 0.2%#
Alternative test site Amsterdam - Male - Female 0.6 % 0.7 % 1.0 % 0 % 0.8 % 0.6 % 0.4 % 0.5 % 0 % 0.6 % 0.5 % 0.8 % 0% 0% 1.8% 0%
STI clinic Rotterdam
- Regular, male - Anonymous, male - Regular, female - Anonymous, female 0.8 % 0.3 % 0.6 % 0 % 0.4 % 1.4 % 0.8 % 0.8 % 0.6 % 0.2 % 0 % 0.5 % 0.7 % 0.2 % 0.2 % 0.3 % 0.4 % 0.8 % 0.4 % 0.8 % 0.3 % 0.5 % 0.3 % 0.9 % 0.5% 1.0% 0.3% 1.0% 1.0% 0.9% 0.3% 0.7% STI registration - Male - Female
STI sentinel surveillance network - Male - Female 0.1 % 0.6% - - 0.4 % 0.2 % -0.6 % 0.4 % -0.4 % 0.4 % -0.3 % 0.3 % -0.5 % 0.6 % - - Ended Ended 0.3% 0.3% Ended Ended 0.3%** 0.2%** Checkpoint - Male - Female - - -- -- -- -- 0.8% 1.1% 0.3%1.0% 0.4%0.5% * Known HIV infected included, ** preliminary data, # based on 1 research period
4.
General population
In the Netherlands, the only nationwide ongoing serosurveillance is that of blood donors and pregnant women. These populations are often studied to identify HIV trends in populations at low and moderate risk of HIV infection.
4.1
Blood donors
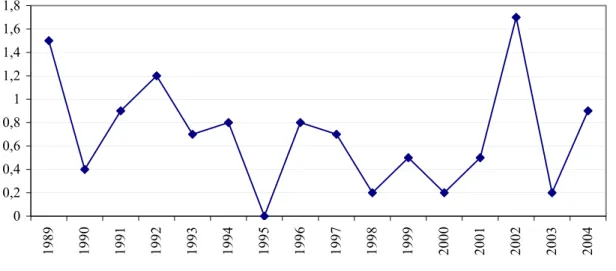
In 2004, 503008 blood donors were registered in the Netherlands. The overall prevalence and incidence of HIV antibodies have been low in that year: new donors: 0.0 per 105 donors
(prevalence), regular donors: 0.9 per 105 donor years (incidence). No marked trend over time was observed (Figure 17, Figure 18).
0 2 4 6 8 10 12 14 16 1989 1990 1991 1992 1993 1994 1995 1996 1997 1998 1999 2000 2001 2002 2003 2004
Source: C. van der Poel, personal communication, Stichting Sanquin Bloedvoorziening, Amsterdam
0 0,2 0,4 0,6 0,8 1 1,2 1,4 1,6 1,8 1989 1990 1991 1992 1993 1994 1995 1996 1997 1998 1999 2000 2001 2002 2003 2004
Source: C. van der Poel, personal communication, Stichting Sanquin Bloedvoorziening, Amsterdam
Figure 18: HIV incidence (per 105 donor years) among regular blood donors in the Netherlands
4.2
Pregnant women
Since 1988, pregnant women in Amsterdam are tested for HIV in a sentinel surveillance study.8
Until 2002, HIV prevalence was slightly increasing; the last few years mainly due to an increase of known HIV positive women becoming pregnant (Figure 19). In 2004, HIV prevalence was 1.1% (19/1752) which is comparable with 2003 (1.2%; 24/1952) and slightly lower than 2002 (1.4%, 26/1912).
Since 2003, all pregnant women in Amsterdam are offered an HIV test. In 2004,
13111 women were tested (0.2% refused). Twenty six women were HIV positive (0.2%). Of these, 13 knew their HIV positive serostatus; 17 had a non-Dutch origin (65%) (14 sub-Saharan Africa, 1 Surinam/Antilles, 2 Turkey and 2 unknown).11
Since January 2004, standard screening for HIV is offered to all pregnant women in the Netherlands (opting out method). The HIV test is offered as part of the prenatal screening. The Healthcare Insurance Board (College voor Zorgverzekeringen, CVZ) is collecting the information on HIV test results from the regional vaccination bureaus.
In the first six months of 2004, approximately 95000 women were tested for HIV. Of those women, 60 were HIV positive (HIV prevalence: 0.06%). The highest prevalence was observed in Amsterdam: 0.17% (9/5385) (Figure 20). The results of the second half of 2004 are not available yet.
0 500 1000 1500 2000 2500 1988 1989 1990 1991 1992 1993 1994 1995 1996 1997 1998 1999 2000 2001 2002 2003 2004 0 0,002 0,004 0,006 0,008 0,01 0,012 0,014 0,016 number of HIV tests HIV prevalence HIV prevalence (new diagnoses)
Figure 19: HIV prevalence (%) and number of tests among pregnant women in Amsterdam (sentinel study) 0 0,02 0,04 0,06 0,08 0,1 0,12 0,14 0,16 0,18 Limburg Noord-Nederland Noord-Brabant Zeeland Zuid-Holland Amsterdam Rotterdam Gelderland Overijssel/Flevoland Utrecht/Noord-Holland
Source: preliminary data regional vaccination bureaus; M. Witteveen personal communication, CVZ
Figure 20: HIV prevalence (%) among pregnant women in the Netherlands (first 6 months 2004), by geographic region
5.
HIV incidence
The yearly HIV incidences among MSM and drug users are obtained from the Amsterdam Cohort Studies (ACS) of HIV/AIDS. The study population consists of MSM and drug users living in Amsterdam and surroundings. The first enrolment of MSM took place in 1984 including men aged 18-65 years. From June 1995, recruitment was focused on young (≤30 years) MSM. For more details13: www.amsterdamcohortstudies.org.
The HIV incidence among MSM in the ACS in 2004 was estimated at 1.4 per 100 person-years (PY). The last decade, the HIV incidence is relatively stable in the range of 0-2 per 100 PY (Figure 21).14 0 1 2 3 4 5 6 7 19 85 19 86 19 87 19 88 19 89 19 90 19 91 19 92 19 93 19 94 19 95 19 96 19 97 19 98 19 99 20 00 20 01 20 02 20 03 20 04
Source: A. van der Bij, personal communication, Municipal Health Service, Amsterdam
Figure 21: Yearly HIV incidence among MSM (30 years or younger at entry) in ACS
The first enrolment of IDUs in the ACS took place between 1985-1990. From 1998, recruitment was focused on young drug users (≤30 years). From 1999, no HIV infections were found among IDUs. Among all drug users (including non-injecting), one HIV infection was found in 2001 and one in 2002. In 2003 and 2004, no drug users were tested HIV positive (Figure 22).14
0 1 2 3 4 5 6 7 8 9 10 1985 1986 1987 1988 1989 1990 1991 1992 1993 1994 1995 1996 1997 1998 1999 2000 2001 2002 2003 2004
Drug users, total Injecting drug users
Source: A. van der Bij, personal communication, Municipal Health Service, Amsterdam
6.
International trends of HIV/AIDS
Europe
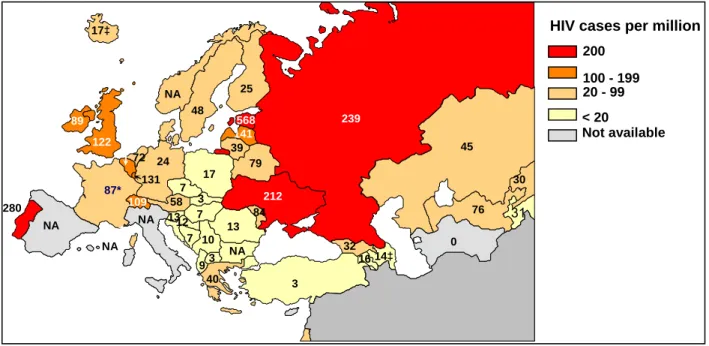
In Europe, rates of new HIV diagnoses vary greatly between countries. The numbers of HIV cases reported in Western and Central Europe are low compared to Eastern Europe. In the Netherlands, HIV prevalence among adults is estimated at 0.2%, which is comparable to the HIV prevalence in other Western and Central European countries. The widespread use of HAART resulted in a substantial decline in numbers of AIDS cases and AIDS related deaths in Europe. As a consequence, after 1998 the number of people living with HIV/AIDS continued to rise.
Heterosexual contact is now the most frequent route of HIV transmission in most Western countries, but sex between men (MSM) remains predominant in Denmark, Germany, Greece and the Netherlands.15 The rise in heterosexually acquired HIV cases, as observed for many years in Belgium, UK, Denmark, Germany, Greece, Norway, Sweden, and in the Netherlands is largely due to an increasing share of migrants from sub-Saharan Africa.
After a long period of continuing decline, HIV infections among MSM increased again from 2002 onwards in various countries (e.g. Belgium, Denmark, Germany, Portugal, and Switzerland). Increases in risky sexual behaviour in a highly prevalent HIV population, together with rising trends in STI, may have lead to an expansion of HIV transmission among MSM.
In most Western European countries, steady declines in HIV prevalence among injecting drug users (IDUs) occurred throughout the 1990s, reflecting the success in past prevention interventions. Also in Eastern Europe, after several years of rapid spread of HIV among IDUs, the number of new diagnoses is now declining. However, the situation in the East remains alarming due to the fast increasing number of people living with HIV, including large numbers of young people.15 These people can potentially transmit HIV to their sex partners and indeed, the number of
heterosexual infections is rising in Eastern Europe. Reporting rates were the highest in Estonia, the Russian Federation and Ukraine.16 In Eastern Europe, the HIV prevalence among adults is
estimated at 0.8%.17
Other regions
HIV prevalence is highest in sub-Saharan Africa with an estimated prevalence in adults of 7.4%. In some (mainly Southern) countries the HIV prevalence is over 35% (e.g. Swaziland). An estimated 25 million people are living with HIV/AIDS in sub-Saharan Africa, which is almost two-thirds of all people living with HIV. There appears to be stabilization in HIV prevalence rates, but this is mainly due to a rise in AIDS deaths and a continued increase in new infections. Adult prevalence
in countries in central and eastern Africa is ranging from 4% to 13%.16,17 The major transmission route in sub-Saharan Africa is heterosexual contact.
In Asia, the epidemic is expanding rapidly with sharp increases in China, Indonesia and Vietnam. The epidemic remains largely concentrated in IDUs, sex workers (and clients) and MSM. Some countries, such as Thailand and Cambodia, have been successful in fighting the HIV epidemic. India has the largest number of people living with HIV in Asia: over 5 million.
In the Caribbean, high HIV prevalence rates (>3%) were observed in the Bahamas, Haiti, Trinidad and Tobago. The Caribbean epidemic is mainly heterosexually, and in many places concentrated among sex workers. However, it is also spreading to the general population. Highest prevalence was found in Haiti: 5.6%.
The epidemic in Latin America is concentrated among populations at high risk of HIV infection: IDUs and MSM. Large differences within countries have been observed, as in Brazil, where national prevalence is below 1%. However, in certain cities 60% of the IDUs are HIV infected. In Central America, HIV is spreading predominantly through sex (both heterosexual and MSM).17
Figure 23: HIV infections newly diagnosed in Europe in 2004, per million population (source: EuroHIV, 2005)
HIV cases per million
200 100 - 199 20 - 99 < 20 Not available 9 16 58 14‡ 79 7 NA 12 7 54 568 25 87* 32 24 40 7 17‡ 89 48 45 30 141 39 131 3 43 84 72 NA 17 280 13 239 14 3 13 48 109 31 3 212 122 76 10 NA NA NA NA 100‡ 0
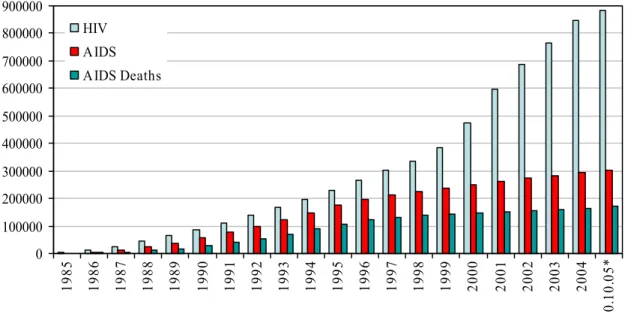
Figure 24: Cumulative number of reported HIV, AIDS and AIDS deaths in all of WHO/Europe countries per year (source: WHO Europe, 2005)*
* preliminary and incomplete data 0 100000 200000 300000 400000 500000 600000 700000 800000 900000 19 85 19 86 19 87 19 88 19 89 19 90 19 91 19 92 19 93 19 94 19 95 19 96 19 97 19 98 19 99 20 00 20 01 20 02 20 03 20 04 10 .10. 05 * HIV AIDS AIDS Deaths
7.
STI clinic attendees
Key points
− In 2004, 49701 new consultations were registered in the STI sentinel surveillance network. − In 2004, the number of consultations increased by 17% compared with 2003.
− Characteristics of clinic attendees were as follows: young (38% below 25), Dutch origin (80%), proportion of MSM (28%) and commercial sex workers (10%), 18% had a history of STI and 63% was not previously tested for HIV.
NB. Limitations of data: data from the Amsterdam STI clinic are preliminary and incomplete. Data on ethnicity, history of STI, prior HIV testing, intravenous drug use and reason for consultation (among other presence of symptoms) are missing. For this reason, national comparison for these variables with 2003 is hampered.
NA Amsterdam = data not available for STI clinic Amsterdam.
7.1
Recent trends
In 2004, 49701 new consultations (increase of 17%) were registered within the STI sentinel surveillance network; 26534 (53%) among men, 23138 (47%) among women and 29 (0.1%) among transgenders (Table D.1). Forty-two percent of these were reported by the STI clinic in Amsterdam. 45% of the attendees had an STI examination, 53% had both an STI examination and an HIV test and 2% only had an HIV test (Figure 25).
HIV test STI examination Both
No test
No test and no diagnosis
Figure 25: Consultations by STI examination, HIV test or both, 2004
The most common reported reason for consultation (Table D.10, NA Amsterdam) was risk behaviour (29% of all reported reasons), followed by symptoms (26%) and a new sexual
relationship (12%). Other reasons for consultations were uncertainty, anxiety or concern (9%), risk behaviour and symptoms of partner (5%), notification by (ex)partner or social worker (4%), (periodic) screening (4%), hepatitis B vaccination (4%), HIV test (2%), else (2%) or condom failure (1%) (Figure 26). STI clinic attendees were on average young: 38% is younger than 25 years of age. The age distribution differed by gender with thehighest peak among 20-24 years (21%) for men (followed by 25-29: 21% and 30-34: 17%) and among 20-24 years (39%) for women (followed by 25-29: 23% and 15-19: 13%) (Table D.3). About 80% of the clinic attendees were from Dutch origin (2003: 74%); this was the same for women and men. Other groups
originated from Surinam (3%), sub-Saharan Africa (2%), Asia (2%), Eastern Europe (2%), other European countries (3%), the Netherlands Antilles (2%), Latin America (1%), Morocco and other North African countries (1%), Turkey (1%) and other (1%) (table D.4). Furthermore, a total of 152 different foreign countries were reported (NA Amsterdam).
Figure 26: Reasons of consultation by STI examination, HIV test or both, 2004 (GGD Amsterdam does not report reason for visit and is not included)
Over the past years the number of consultations has risen continuously (Figure 27). This increase overwhelmed the capacity of most STI clinics and public health services; and this may have affected the trend in consultations. In January 2003, the surveillance system has been changed into the STI sentinel surveillance network. The resultant lack of comparable data hampered proper comparison of data with years before 2003, so results should be interpreted with caution. See limitations of surveillance data (Appendix B).
0 5 10 15 20 25 30 35 40 Sympt oms New re latio nshi p Risk behavi our Risk b ehav iour pa rtner Partn er H IV po sitive Notif icatio n Contr ol/tre atme nt HBV v accin ation Inform ation Else HIV test Anx iety Cond om fa ilure Sexu al viol ence No n-hiv decl aratio n or vi sa Childw ish or pregn ancy Stick or bi te inci dent Unkn own HIV ST I BOT H
0 10000 20000 30000 40000 50000 60000 1995 1996 1997 1998 1999 2000 2001 2002 2003 2004
Footnote: 1995-2002: STI registration; 2000*: STI clinic of Erasmus Medical Centre Rotterdam was included; 2003**: Implementation of STI sentinel surveillance network
Figure 27: Number of consultations in the STI registration (STI clinics and public health services) and the STI sentinel surveillance network, 1995-2004
7.2
Determinants of attendees
Of all male attendees, 28% (n=7382) reported sex with men (Table D.5). Of all female attendees, 10% (n=2234) worked as a CSW the past 6 months and 4% (n= 1165) of all men reported visiting CSW the past 6 months (table D.6). Recent injecting drug use (past 6 months, NA Amsterdam) was reported by 0.2% of the attendees (n=66) and these data were missing for 2% (Table D.7). On average, 18% (n=5057) of the attendees (NA Amsterdam) reported a history of STI (gonorrhoea, infectious syphilis or genital chlamydial infection); 20% of all males and 16% of all females.
Of the attendees, 63% (n=18064, NA Amsterdam) was never tested for HIV antibodies. 30% (n=8685) was previously tested HIV negative (32% men, 29% women) and 1.2% (n=342) was previously tested HIV positive (2.2% men, 0.2% women) (Table D.8). In 2003, 1.9% tested HIV positive. Because of the probable underreporting, the real number of HIV infected individuals attending STI clinics is likely to be larger than the number reported here. More than half of the attendees who were never tested for HIV (56%) were tested in the present consultation.
8.
Genital chlamydial infection
Key points
− Genital chlamydial infection was the most common diagnosis (n=4470) made in the STI sentinel surveillance network in the Netherlands in 2004.
− Diagnoses of genital chlamydial infection increased by 19% between 2003 and 2004.
− Individuals younger than 25 years of age were at highest risk for genital chlamydial infection, in particular women.
8.1
Recent trends
In 2004, 4470 diagnoses of genital chlamydial infection were made (2389 in men and 2081 in women) in the STI sentinel surveillance network (Table D.11a). The number of diagnoses increased with 19% compared with 2003 (n=3741); in men 16%, in women 25%. From 2002 to 2003, there was no increase in diagnoses of chlamydia. In MSM, 52% of the infections were anorectal and 46% urethral. In women, 5% of the diagnoses were anorectal (Table D.11b). Genital chlamydial infection was the most common diagnosis. Rates of diagnoses were fairly unevenly distributed across the Netherlands (range: 11 – 272 per 100000) with the lowest rates being seen in the region Brabant, the Northern provinces, and the middle of Gelderland (Figure 28).
Figure 28: Rates of diagnoses of genital chlamydial infection by region, STI sentinel surveillance network, the Netherlands, 2004
The highest percentage of diagnosis was among men and women aged 20-24 (M: 27%, F: 46%); for women followed by those aged 15-19 (22%) and for men aged 25-29 (23%). The number of infections declined rapidly in women above 25 years (table D.12).
Over the past five years, the number of diagnoses of genital chlamydial infection has increased consistently, by 53% (2000-2004); the increase was greater for women (64%) than for men (44%) (Figure 29). 0 500 1000 1500 2000 2500 3000 2000 2001 2002 2003* 2004 N um ber of diagno se s men women
Footnote: 2000-2002 STI registration (including STI clinic Amsterdam); 2003* Implementation of the STI sentinel surveillance network
Figure 29: Number of genital chlamydial infections by sex, 2000-2004
8.2
Determinants of infection
Among men, 29% (n=686) of the genital chlamydial infections were diagnosed in MSM. This percentage of MSM was fairly small compared with that in gonorrhoea (60%) and early syphilis (86%) (Table D.14). Among men, 3% of the infections were diagnosed in men who had recent (past 6 months) contact with CSW, whereas in women 7% of the chlamydial infections were diagnosed in CSW (Table D.15). About 72% of the diagnoses in men (NA Amsterdam) were made in Dutch males, 78% in Dutch females. The highest percentage of diagnosis was made in men from Surinam, the Netherlands Antilles and Aruba (12%); this percentage was 10% for women (Table D.13).
In 1% (n=33) of the cases of chlamydial infection (NA Amsterdam) the diagnosis was made in individuals who reported a prior positive HIV test. (i.e. known HIV infected); in 2003 4% (n=150). 69% of the individuals diagnosed with chlamydial infection were never tested for HIV before (Table D.17). A history of gonorrhoea, infectious syphilis or chlamydial infection was reported by 20% of the individuals (NA Amsterdam)diagnosed with genital chlamydial infection: 24% for