CONSTRUCTION OF REGIONAL
TRADE-LINKED SUPPLY AND USE
TABLES FOR THE EU28
Description of the methodology
Mark Thissen, Olga Ivanova, Giovanni Mandras and Trond
Husby
Contents
1
INTRODUCTION
6
2
NATIONAL TRADE LINKED SUPPLY AND USE TABLES
8
2.1 Overview of available data sources 8
2.1.1 National Supply and Use tables from Eurostat 9
2.1.2 National accounts data from Eurostat 10
2.1.3 Data for the rest of the world from OECD 11
2.1.4 International trade data 12
2.2 Updating Eurostat Supply and Use tables for EU28 to 2013 14
2.2.1 Upscaling Eurostat Supply and Use tables using national accounts data 14
2.2.2 Balancing Supply and Use tables for 2013 15
2.3 Preparing the data of the rest of the world 17
2.3.1 Upscaling and balancing OECD Supply and Use tables to 2013 using national
accounts data 17
2.3.2 Consistent disaggregation of Supply and Use Tables for 2013 to NACE Rev2
sectoral and commodity classification 17
2.4 Linking Supply and Use tables with inter-national trade flows 19
2.4.1 Adjusting the trade flows from BACI database for re-exports 19 2.4.2 Using nonlinear programming to find the trade flows between the
countries 20
3
REGIONALIZATION OF COUNTRY LEVEL SUPPLY AND USE
TABLES
22
3.1 Overview of regional-level data for EU28 22
1.1. Deriving inter-regional trade flows 29
3.1.1 Distribution Probabilities 31
3.1.2 Trade assignment Models 31
1 Introduction
Economic development is interregional in nature. Physical and technological proximity determined by inter-regional and national cross-border interactions in trade, investments and knowledge are important determinants of economic growth. However, quantitative policy research analysing regional development in Europe taking interregional interactions into account and such as proposed in the regional smart specialization strategy (McCann and Ortega-Argilés, 2012) has been hampered by data deficiencies.
Existing data on inter-regional trade are incomplete and based on data points which are far in the past. Moreover, they cannot be used for modelling purposes since they are estimated themselves using behavioural equations. In addition, they are often based on outdated methodologies are out of line with the structure and empirical evidence underlying the model. Instead, interregional trade flows should be estimated based on the state of the art methodology and developed in such a way that the data can subsequently be used in economic, econometric and spatial CGE analysis.
We implement a methodology for estimating a system of regional supply and use tables consistent with interregional trade data. Trade in goods and services will be derived from freight transport data, airline data on flights and business travel data taking transhipment locations into account. The methodology is centred on the probability of trade flows and is developed to fit the information available, without pre-imposing any geographical structure on the data. The method extends the approach proposed in Thissen et al. (2013) and it is in line with ‘parameter-free’ universal methodologies as proposed by Simini et al. (2012), making it possible to analyse the importance of transhipment locations (hubs) in regional trade and linking up transport costs to inter-regional trade flows.
In this paper we describe the methodology used to regionalize the supply and Use tables for the EU28 and how we subsequently construct a multiregional product by product IO table. The product by product IO table is constructed on the 2 digit based classification of industries (NACE 2.0) used in the national accounts of Eurostat. In a first step the national supply and use tables are disaggregated into regional supply and use tables based on regional statistics that can be obtained from Eurostat. These “regionalized” supply and use tables, however, are not disaggregated with respect to the interregional and international trade. The interregional and international trade in goods is determined in a second step based on regional transport flows of goods. Interregional trade in services is derived by business trips between regions. The estimation methodology simultaneously estimates the trade and transport flows between regions where different modalities have been taken into account for the transport flows.
Figure 1 represents the main steps in the construction of the Multi-Regional Input-Output (MRIO) table for EU28 at NUTS2 level. The first chapter describes the first two steps towards the construction of the consistent inter-regional MRIO table for EU28, including the update of the existing Eurostat Supply and Use tables in NACE Rev2 classification to the year 2013 and creating trade-linked country-level Supply and Use tables for EU28 and the rest of the world. The second chapter describes the third step, while the creation of an IO table is discussed in chapter 3. The fourth chapter discusses the importance of the used methodology to estimate the regional trade data if compared to existing gravity based estimation methods.
Figure 1 Schematic data flows for the construction of the inter-regional trade data:
STEP 4: Create a system of inter-regional IO tables for EU28 at
NUTS2 2010 level in NACE Rev2 classification according to the
chosen sectoral classification used in RHOMOLO
STEP 3: Disaggregate the set of inter-country Supply and Use
tables for EU28 to the level of NUTS2 2010
Use regional level data on production and consumption in order to disaggregate the national SUTs into the regional SUTs and link them with
the trade flows of goods and services.
The regional production and consumption is linked with the inter-regional trade flows that are consistent with the inter-national trade flows . The inter-regional trade flows are constructed based on the prior
information on freight and passenger transport trips and using the nonlinear programming techniques.
STEP 2: Create trade-linked set of national Supply and Use
tables for EU28 in NACE Rev2
National Supply and use tables should be linked with trade flows of goods and services based on BACI and UN datasets
The following steps should be taken: (1) correct SUTs for consumption abroad, re-exports and re-imports, (2) link the countries with trade flows
taking into account bi-lateral trade and transport margins, (3) international trade in transport services should be linked to transport
margins
STEP 1: Construction of Supply and Use tables for EU28 in NACE
Rev2 for 2013
Start from Eurostat data for 2011 (for HR other solution should be
2 National Trade linked
Supply and Use Tables
We have to create a set of national supply and use tables that are internally consistent. That is all tables should be trade linked with consistent import and export trade flows between the countries. We start with an overview of available sources of SUTs and IO table that are used. Subsequently we turn to the adjustments that that have to be made to be create an internally consistent international system of SUTs.
2.1 Overview of available data sources
Main data sources for the construction of trade-linked Supply and Use tables covering EU28 countries separately as well as the rest of the world include:
1. Data on Supply and Use tables (SUTs) or Input-Output tables (IOs) of the individual countries
2. National accounts data that is used to update SUTs and IOs to the year 2013 3. International trade data for both goods and services
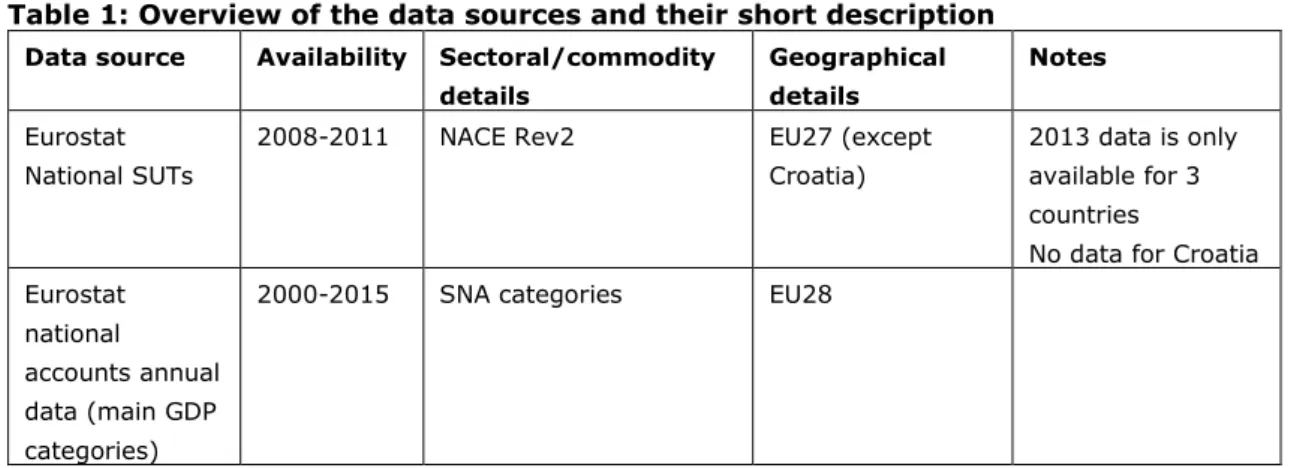
Table 1 below gives an overview of the available data sources used for the construction of the national level trade-linked Supply and Use tables (SUTs). The SUTs and national accounts were collected from Eurostat and OECD publicly accessible databases. International trade data were collected from the BACI database of CEPII and UN trade in services database. Access to the BACI database requires subscription to UN COMTRADE as it is based on this data.
SUTs for EU28 countries in the NACE Revision 2 classification of economic activities1 are
available for different years and are all updated to 2013 using time-series data from national accounts. The SUTs are linked with the international trade flows based on the trade patters from BACI and UN trade in services databases.
Table 1: Overview of the data sources and their short description Data source Availability Sectoral/commodity
details Geographical details Notes Eurostat National SUTs
2008-2011 NACE Rev2 EU27 (except Croatia)
2013 data is only available for 3 countries
No data for Croatia Eurostat
national accounts annual data (main GDP categories)
2000-2015 SNA categories EU28
1 Please see the following document for a description of the NACE classification in economic activities:
https://ec.europa.eu/eurostat/statistics-explained/index.php/Glossary:Statistical_classification_of_economic_activities_in_the_European_Community_( NACE)
Eurostat national accounts annual data (detailed sectoral split)
2000-2013 90 NACE Rev2 economic sectors
EU28 Some of the
sectors are the aggregates of the sub-sectors BACI international reconciled bi-lateral commodity trade dataset 2008-2014 HS07 232 countries of the world Represents the reconciled version of UN COMTRADE dataset prepared by CEPII for DG Trade
Trade flows are represented in volumes and in values STAN database national IO tables
1995-2011 34 sectors/commodities Croatia and other 63 countries of the world including rest of the world
There is also inter-country IO tables available from OECD that link all countries with trade of goods and services UN trade in services database 2000-2014 184 types of EBOPS Items (types of services) 260 countries of the world This database is not reconciled and has relatively a lot of missing values
2.1.1 National Supply and Use tables from Eurostat
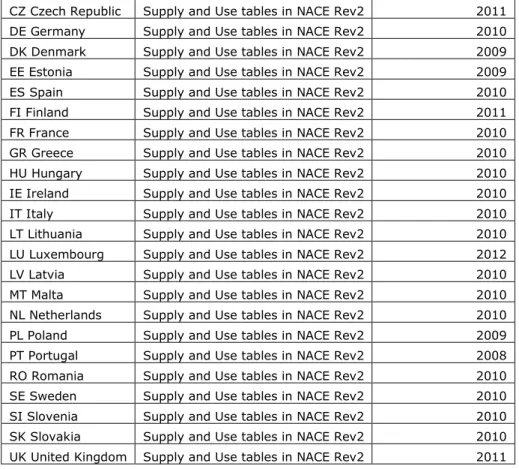
Eurostat provides Supply and Use tables for all EU28 member states except for Croatia2. These
tables are produced using NACE Rev2 sectoral and commodity classification and available for various years. The latest year of availability for each of EU28 countries is presented in the table below. Countries with the most recent data (that is the data for 2011 and 2012) are Czech Republic, Finland, Luxembourg and United Kingdom. Supply and Use tables from Eurostat are unbalanced for many countries after updating, they include exports and re-imports and, in some cases, the fixed capital formation column contains negative elements. We need a consistent set of trade linked SUTs before we can start the regionalisation. In a first step we therefore make the SUTs consistent after which we will continue with the linking of the SUTs by international trade flows.
The fact that the SUTs from Eurostat are not available for the year 2013 for any of the EU28 countries means that we would need to use growth rates based on the national accounts data in order to project the tables to 2013.
Table 2: Overview of data availability for Supply and Use tables in NACE Rev2 at Eurostat
Country Data type Last available year
AT Austria Supply and Use tables in NACE Rev2 2010 BE Belgium Supply and Use tables in NACE Rev2 2010 BG Bulgaria Supply and Use tables in NACE Rev2 2010 CY Cyprus Supply and Use tables in NACE Rev2 2009
CZ Czech Republic Supply and Use tables in NACE Rev2 2011 DE Germany Supply and Use tables in NACE Rev2 2010 DK Denmark Supply and Use tables in NACE Rev2 2009 EE Estonia Supply and Use tables in NACE Rev2 2009 ES Spain Supply and Use tables in NACE Rev2 2010 FI Finland Supply and Use tables in NACE Rev2 2011 FR France Supply and Use tables in NACE Rev2 2010 GR Greece Supply and Use tables in NACE Rev2 2010 HU Hungary Supply and Use tables in NACE Rev2 2010 IE Ireland Supply and Use tables in NACE Rev2 2010 IT Italy Supply and Use tables in NACE Rev2 2010 LT Lithuania Supply and Use tables in NACE Rev2 2010 LU Luxembourg Supply and Use tables in NACE Rev2 2012 LV Latvia Supply and Use tables in NACE Rev2 2010 MT Malta Supply and Use tables in NACE Rev2 2010 NL Netherlands Supply and Use tables in NACE Rev2 2010 PL Poland Supply and Use tables in NACE Rev2 2009 PT Portugal Supply and Use tables in NACE Rev2 2008 RO Romania Supply and Use tables in NACE Rev2 2010 SE Sweden Supply and Use tables in NACE Rev2 2010 SI Slovenia Supply and Use tables in NACE Rev2 2010 SK Slovakia Supply and Use tables in NACE Rev2 2010 UK United Kingdom Supply and Use tables in NACE Rev2 2011
2.1.2 National accounts data from Eurostat
For the period 2005 to 2014 Eurostat provides national accounts of all EU28 countries covering many of the same elements as the national Supply and Use tables. This includes all elements of final consumption (final consumption of households, final consumption of NPISH, final consumption of government, fixed capital formation and changes in inventories), exports and imports. The data is however not split between the economic sectors but could still be used to create homogenous growth rates for the respective parts of the SUTs. Table 3 below presents the full list of national accounts data elements provided by Eurostat and used to project the SUTs to the year 2013.
Table 3: The list of national accounts elements B1GQ Gross domestic product at market prices B1G Value added, gross
P3 Final consumption expenditure
P3_S13 Final consumption expenditure of general government P31_S13 Individual consumption expenditure of general government P32_S13 Collective consumption expenditure of general government P31_S14_S15 Household and NPISH final consumption expenditure P31_S14 Final consumption expenditure of households P31_S15 Final consumption expenditure of NPISH P41 Actual individual consumption
P5G Gross capital formation P51G Gross fixed capital formation
P52_P53 Changes in inventories and acquisitions less disposals of valuables P52 Changes in inventories
P53 Acquisitions less disposals of valuables P6 Exports of goods and services
P61 Exports of goods P62 Exports of services
P71 Imports of goods P72 Imports of services
B11 External balance of goods and services B111 External balance - Goods
B112 External balance - Services D1 Compensation of employees D11 Wages and salaries
D12 Employers' social contributions
B2A3G Operating surplus and mixed income, gross D2X3 Taxes on production and imports less subsidies D2 Taxes on production and imports
D3 Subsidies
D21X31 Taxes less subsidies on products D21 Taxes on products
D31 Subsidies on products
YA1 Statistical discrepancy (production approach) YA0 Statistical discrepancy (expenditure approach) YA2 Statistical discrepancy (income approach)
P3_P5 Final consumption expenditure and gross capital formation
P3_P6 Final consumption expenditure, gross capital formation and exports of goods and services
Besides the aggregated national accounts data, Eurostat also provides detailed sectoral data for the period 2005-2014 in NACE Rev2 classification (the same 64 sectors as used in SUTs). This data includes:
• Gross value added • Wages
• Output
• Net operate surplus
• Net taxes minus subsidies on production
These data were also used in order to construct growth rates capturing changes in the economic structure of the EU28 countries and update the sectoral detail of the SUTs to the year 2013.
2.1.3 Data for the rest of the world from OECD
Supply and use tables for non-European countries come from the OECD world-wide Input-Output database for 2011. These SUTs are derived from IO tables and hence have diagonal supply tables.
The sectoral classification chosen by OECD for its input-output database is slightly different from NACE Rev2 and includes 34 economic sectors presented in the table below.
Table 4 List of the sectors/commodities used in OECD Input-Output database 1 TTL_C01T05: Agriculture, hunting, forestry and fishing
2 TTL_C10T14: Mining and quarrying
3 TTL_C15T16: Food products, beverages and tobacco 4 TTL_C17T19: Textiles, textile products, leather and footwear 5 TTL_C20: Wood and products of wood and cork
6 TTL_C21T22: Pulp, paper, paper products, printing and publishing 7 TTL_C23: Coke, refined petroleum products and nuclear fuel 8 TTL_C24: Chemicals and chemical products
9 TTL_C25: Rubber and plastics products 10 TTL_C26: Other non-metallic mineral products 11 TTL_C27: Basic metals
12 TTL_C28: Fabricated metal products 13 TTL_C29: Machinery and equipment, nec
14 TTL_C30T33X: Computer, Electronic and optical equipment 15 TTL_C31: Electrical machinery and apparatus, nec
16 TTL_C34: Motor vehicles, trailers and semi-trailers 17 TTL_C35: Other transport equipment
18 TTL_C36T37: Manufacturing nec; recycling 19 TTL_C40T41: Electricity, gas and water supply 20 TTL_C45: Construction
21 TTL_C50T52: Wholesale and retail trade; repairs 22 TTL_C55: Hotels and restaurants
23 TTL_C60T63: Transport and storage 24 TTL_C64: Post and telecommunications 25 TTL_C65T67: Financial intermediation 26 TTL_C70: Real estate activities
27 TTL_C71: Renting of machinery and equipment 28 TTL_C72: Computer and related activities 29 TTL_C73T74: R&D and other business activities
30 TTL_C75: Public administration and defence; compulsory social security 31 TTL_C80: Education
32 TTL_C85: Health and social work
33 TTL_C90T93: Other community, social and personal services 34 TTL_C95: Private households with employed persons
The OECD input-output database covers the whole world and includes the data on 62 separate countries and the rest of the world is aggregated in one remaining rest of the world region.
Besides the data on the input-output tables for various countries of the world and the rest of the world region, OECD provides time-series data for the aggregated elements of the national accounts of 42 of the countries presented in its input-output database which make it possible to project IO tables for different years.
2.1.4 International trade data
The international trade in goods data was taken from the BACI international trade database which which reconciles UN data and covers more than 200 countries and 5,000 products, between 1994 and 2014. The Trade in Services was taken from the UN trade in services database Database on annual bilateral services trade flows for 199 countries from 1985 to 2011 that follow the guidelines from the associated UN trade in services report (http://unstats.un.org/u n s d / s t a t c o m / d o c 0 4 / t r a d e - i n -services.pdf). The Table below presents the sectoral coverage of the trade in services database.
Table 5 List of the types of services in UN trade in services database
1 Transportation 5 Insurance services
1.1 Sea transport 5.1 Life insurance and pension funding
1.1.1 Passenger 5.2 Freight insurance
1.1.2 Freight 5.3 Other direct insurance
1.1.3 Other 5.4 Reinsurance
1.2 Air transport 5.5 Auxiliary services
1.2.1 Passenger 6 Financial services
1.2.2 Freight 7 Computer and information services
1.2.3 Other 7.1 Computer services
1.3 Other transport 7.2 Information services
1.3.1 Passenger 7.2.1 News agency services
1.3.2 Freight 7.2.2 Other information provision services
1.3.3 Other 8 Royalties and license fees
1.4 Other transport of which: Space transport 8.1 Franchises and similar rights 1.5 Other transport of which: Rail transport 8.2 Other royalties and license fees
1.5.2 Freight 9.1 Merchanting and other trade-related services
1.5.3 Other 9.1.1 Merchanting
1.6 Other transport of which: Road transport 9.1.2 Other trade-related services
1.6.1 Passenger 9.2 Operational leasing services
1.6.2 Freight 9.3 Miscellaneous business, professional, and technical services
1.6.3 Other 9.3.1 Legal, accounting, management
consulting, and public relations 1.7 Other transport of which: Inland waterway
transport
9.3.1.1 Legal services
1.7.1 Passenger 9.3.1.2 Accounting, auditing, bookkeeping, and tax consulting services
1.7.2 Freight 9.3.1.3 Business and management consulting and public relations services
1.7.3 Other 9.3.2 Advertising, market research, and public opinion polling
1.8 Other transport of which: Pipeline transport and electricity transmission
9.3.3 Research and development 1.9 Other transport of which: Other supporting and
auxiliary transport services
9.3.4 Architectural, engineering, and other technical services
2 Travel 9.3.5 Agricultural, mining, and on-site
processing services
2.1 Business travel 9.3.5.1 Waste treatment and depollution 2.1.1 Expenditure by seasonal and border workers 9.3.5.2 Agricultural, mining, and other on-site
processing services
2.1.2 Other 9.3.6 Other business services
2.2 Personal travel 9.3.7 Services between related enterprises, n.i.e.
2.2.1 Health-related expenditure 10 Personal, cultural, and recreational services 2.2.2 Education-related expenditure 10.1 Audio-visual and related services
2.2.3 Other 10.2 Other personal, cultural, and recreational services
3 Communications services 10.2.1 Education services 3.1 Postal and courier services 10.2.2 Health services
3.1.1 Postal services 10.2.3 Other
3.1.2 Courier services 11 Government services, n.i.e. 3.2 Telecommunications services 11.1 Embassies and consulates 4 Construction services 11.2 Military units and agencies 4.1 Construction abroad 11.3 Other government services 4.2 Construction in the compiling economy
2.2 Updating Eurostat Supply and Use tables for EU28 to
2013
Before upscaling the Eurostat Supply and Use table to the year 2013, it is necessary to check the data for strange values and inconsistencies. Only after we have consistent and correct tables we can link the trade flows between the Eurostat table for Europe and the OECD tables.
2.2.1 Upscaling Eurostat Supply and Use tables using national accounts
data
The following checks have been performed:
1. Check that for all EU28 countries there is data available from SUTs on wages, fixed capita formation and net operative surplus. For some EU counties this types of data is missing and we need to create for them the missing data using the EU average data on sector-specific ratios.
2. Check for the mismatch between supply and use from SUTs for a specific product group. In case of such mismatch the corresponding rows and columns of SUTs have been removed.
3. Check for the negative values in fixed capital formation column of the use table and replace the negative values with the positive ones on the basis of EU average ratios of fixed capital formation to total supply.
In order to simplify the trade linking of the SUTs of various EU28 countries we move the data for ‘Direct purchases abroad by residents’ to the households’ consumption column of the use table and the data for ‘Purchases on the domestic territory by non-residents’ to the exports column of the use table. We use the structure of respectively households’ consumption and exports in order to split the values between different commodity groups.
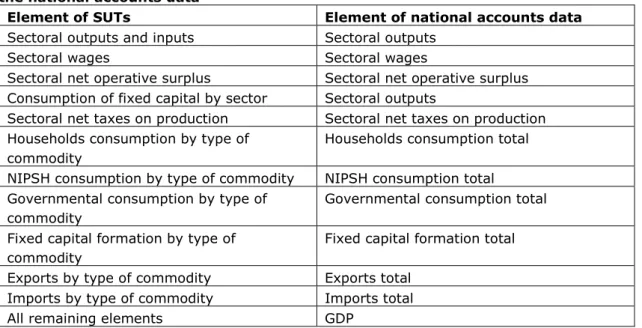
Various elements of the cleaned SUTs from Eurostat have been further scaled up with the different elements of the national accounts data. The table below presents the correspondence between the elements of SUTs and the growth rates between the last available year and 2013 from the national accounts.
Table 6 Correspondence between the elements of SUTs and growth rates based on the national accounts data
Element of SUTs Element of national accounts data
Sectoral outputs and inputs Sectoral outputs
Sectoral wages Sectoral wages
Sectoral net operative surplus Sectoral net operative surplus Consumption of fixed capital by sector Sectoral outputs
Sectoral net taxes on production Sectoral net taxes on production Households consumption by type of
commodity
Households consumption total
NIPSH consumption by type of commodity NIPSH consumption total Governmental consumption by type of
commodity
Governmental consumption total
Fixed capital formation by type of commodity
Fixed capital formation total
Exports by type of commodity Exports total Imports by type of commodity Imports total
2.2.2 Balancing Supply and Use tables for 2013
Both the initial SUTs from Eurostat as well as the SUTs with the growth rates to the year 2013 are unbalanced. This means that supply and demand for particular types of commodities are not equal and that zero profit condition does not hold for the economic sectors. For the use in the project and the RHOMOLO model SUTs for EU28 countries should be consistent and balanced. For the balancing of SUTs we use the nonlinear programming method where we minimize the measure of distance between the initial updated SUTs and the resulting balanced SUTs under a set of constraints.
The set of constraints includes the following:
1. Supply is equal demand for all commodities 2. Zero profit condition holds for all economic sectors
3. GDP calculated from the SUTs is consistent with the Eurostat data from 2013
4. Transport and trade margins are balanced (sum of positive elements of the column is equal to the sum of negative elements of the column)
5. There are no re-exports (output time EU-average export rate is not lower than the exports)
6. There are no re-imports (total consumption is lower than the imports)
7. Net taxes on consumption commodities cannot be larger than 90% of the value of the total consumption
8. Zero elements of the SUTs should stay equal to zero
9. The variation of the results of the nonlinear programming problem should not exceed 25% of the initial value of the SUTs. This restriction is implemented via introduction of lower and upper boundaries for the outputs of the nonlinear programming problem.
The full formulation of the nonlinear programming problem is presented below. The nonlinear programming problem is solved separately for each country of EU28.
Indexes are defined as:
• cnt index for the countries
• s index for the economic sectors • p index for the commodities • c index for columns of SUTs • r index for rows of SUTs • 'P7' Imports CIF
• 'P118' Trade and transport margins • 'D21_M_D31' Taxes less subsidies on products • 'P6' Exports FOB
• fdem Subset of final demand categories • vadded_f Subset for value added categories
Variables are defined as:
• SUP_vcnt,r,c supply table
• USE_vcnt,r,c use table
Parameters are defined as:
• SUPcnt,r,c initial data for supply table
Finally, equations are defined as:
• Supply is equal to demand for all commodities:
, , , ,
_
cnt p c_
cnt p c cSUP v
cUSE v
=
∑
∑
(1)• Zero profit condition holds for all the economic sectors:
, , , ,
_
cnt r s_
cnt r sr r
SUP v
=
USE v
∑
∑
(2)• GDP calculated from SUTs should be consistent with the GDP reported by Eurostat for 2013:
2013 , , , , , ,' 21_ _ 31'
,
_
cnt p s ,_
cnt p p_
cnt p D M Dp s p s p
GDP
=
∑
SUP v
−
∑
USE v
+
∑
USE v
(3)• No re-exports, the domestic output times the EU28 average share that goes to exports should not be lower than exports of the country:
, , , ,' 7'
_
cnt p s(1
_
p)
_
cnt p P sSUP v
Dom cons
SUP v
⋅ −
≥
∑
(4)• No re-imports, the value of net total consumption in the country is not lower than the imports of the country:
, , , , , ,' 118' , ,' 7'
_
cnt p s_
cnt p c_
cnt p P_
cnt p Ps c fdem
USE v
USE v
SUP v
SUP v
∈
+
−
≥
∑
∑
(5)• The value of total consumption per type of commodity times 0.9 is not lower than the value of the transport and trade margins plus the net taxes on consumption:
(
)
(
)
, ,' 118' , ,' 118' , , , , , ,' 118' _ 0 , ,' 118' _ 0 , ,' 21_ _ 31'_
_
_
0.9
_
_
cnt p P cnt p P cnt p s cnt p c cnt p P SUP v s c fdem cnt p P SUP v cnt p D M DUSE v
USE v
SUP v
SUP v
SUP v
∂ ≤ ∈ ≥
+
−
⋅
≥
+
∑
∑
(6)• The optimization function is the entropy function that measures the distance between the initial called SUTs and the outcome of the nonlinear programming program:
, , , , , , , , , , , , , , , , , , , , _ ,
(
_
) log(
(
_
) /
(
))
(
_
) log(
(
_
) /
(
))
(
_
) log(
(
_
) /
(
))
min
cnt p s cnt p s cnt p s p s cnt p c cnt p c cnt p c p c cnt r s cnt r s cnt r s r vadded f sabs USE v
abs USE v
abs USE
abs USE v
abs USE v
abs USE
abs SUP v
abs SUP v
abs SUP
∈
⋅
+
⋅
+
⋅
→
∑
∑
∑
(7)2.3 Preparing the data of the rest of the world
2.3.1 Upscaling and balancing OECD Supply and Use tables to 2013 using
national accounts data
The data from OECD is provided in the form of IO tables for on 62 separate countries (all EU28 member states are presented as well) and one aggregated rest of the world region. The latest database of the OECD is constructed for the year 2011 and should be scaled up to the year 2013 for the use in the project. National accounts data from OECD is not as detailed as the one from Eurostat and we can only use the growth rates for the GDP as a whole in order to scale the data to 2013. The data from OECD contains some strange values that need to be removed and modified and there are many missing values in the value-added part of the IO table. The strange values include for example the negatives for fixed capital formation, exports and imports. The missing parts of the value-added include consumption of fixed capital and net operative surplus by economic sector.
In the same way as in case of the Eurostat tables we move the data for ‘Direct purchases abroad by residents’ to the households’ consumption column of the use table and the data for ‘Purchases on the domestic territory by non-residents’ to the exports column of the use table. We use the structure of respectively consumption of the final consumer (there is only one category in the OECD IO tables) and exports in order to split the values between different commodity groups.
The initial OECD IO tables are unbalanced and include re-exports and re-imports for some countries. These re-exports and re-imports should be removed and IO tables should be balanced before we can proceed with the trade linking procedure.
In order to balance the OECD IO tables we make use of the nonlinear programming techniques and formulate the following system of equations:
1. Supply is equal demand for each commodity
2. No re-exports: total domestic output times 0.9 should be not lower than the total exports per type of commodity
3. No re-imports: the total consumption in basic prices should be not lower than the total imports per type of commodity
4. The elements of the IO table (with the exception of changes in inventories, exports and imports) should not deviate with more than 5% from the initial scaled up to 2013 version of the IO tables.
The distance from the initial scaled up to 2013 version of IO tables and the outcomes of the nonlinear programming problem measured as the entropy function is minimized under the system of equations presented above.
2.3.2 Consistent disaggregation of Supply and Use Tables for 2013 to
NACE Rev2 sectoral and commodity classification
In order to be able to use the OECD data in the trade linking procedure we need to disaggregate the OECD IO tables to the level of details of the Eurostat SUTs that is to the level of details of NACE Rev2 sectoral and commodity classification. This is done using the mapping that we have prepared between the OECD and Eurostat classifications. The OECD classification is quite similar to the NACE Rev1 and we have made use of the mappings between NACE Rev1 and Rev2 that are available from Eurostat-RAMON (http://ec.europa.eu/eurostat/ramon ).
In order to disaggregate the OECD IO tables to the format and sectoral/commodity classification of the Eurostat SUTs we have taken the following steps:
1. For each OECD country identify a ‘similar’ EU28 country which economic sectoral and technological (sectoral inputs) structure will be used for disaggregation.
2. Construct Supply and Use tables on the basis of OECD IO tables where the supply is diagonal. For the construction of use tables we make use of transport and trade margins and net taxes ratios from the ‘similar’ EU28 country in order to go from producer/basic to consumer prices (IO tables are given in producer/basic prices and need to be translated into consumer prices using information on transport and trade margins and net taxes).
3. Disaggregate different parts of the constructed OECD SUTs using the data from Eurostat SUTs taking into account the inconsistencies. If there is no data from Eurostat SUTs available, the disaggregation is done proportionally between the number of sectors and commodities that are mapped to the OECD aggregated commodity/sector groups.
4. Solve the nonlinear programming problem that includes equations and optimization function described in section 2.2 in combination with the restrictions that ensure that the disaggregate OECD SUTs sum up to the initial balanced OECD IO tables with the exception of changes in inventories element of the IO tables. In making the correct relationships one should take into account that the use table is in consumer prices and the IO table in in the basic prices. The layers of trade and transport margins and net taxes on consumptions should be used in the equations in order to ensure the consistency.
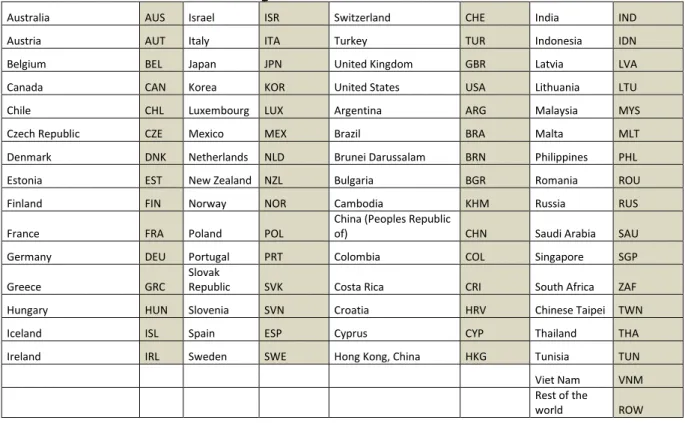
The outcome of this procedure is the set of SUTs for all the countries and rest of the world regions of the OECD dataset.
Table 7 The list of countries in the global OECD IO database
Australia AUS Israel ISR Switzerland CHE India IND
Austria AUT Italy ITA Turkey TUR Indonesia IDN
Belgium BEL Japan JPN United Kingdom GBR Latvia LVA
Canada CAN Korea KOR United States USA Lithuania LTU
Chile CHL Luxembourg LUX Argentina ARG Malaysia MYS
Czech Republic CZE Mexico MEX Brazil BRA Malta MLT
Denmark DNK Netherlands NLD Brunei Darussalam BRN Philippines PHL
Estonia EST New Zealand NZL Bulgaria BGR Romania ROU
Finland FIN Norway NOR Cambodia KHM Russia RUS
France FRA Poland POL China (Peoples Republic of) CHN Saudi Arabia SAU
Germany DEU Portugal PRT Colombia COL Singapore SGP
Greece GRC Slovak Republic SVK Costa Rica CRI South Africa ZAF Hungary HUN Slovenia SVN Croatia HRV Chinese Taipei TWN
Iceland ISL Spain ESP Cyprus CYP Thailand THA
Ireland IRL Sweden SWE Hong Kong, China HKG Tunisia TUN Viet Nam VNM Rest of the
world ROW
2.4 Linking Supply and Use tables with inter-national
trade flows
2.4.1 Adjusting the trade flows from BACI database for re-exports
The BACI and UN trade in services datasets provide us with the necessary data on the international trade flows in both goods and services in 2013. One of the difficulties of using the BACI dataset is the treatment of re-exports and re-imports in it. For the construction of BACI CEPII has used all the available data on re-exports and re-imports from UN COMTRADE (this has been verified in the personal communications with the colleagues at CEPII). Unfortunately such data was available for many non-European countries but not the EU28 countries including the typical re-export countries such as the Netherlands, the UK, Luxemburg and Belgium.
This means that the BACI trade flows should be adjusted for the re-exports and re-imports in cases of the EU28 countries and not in case of non-European countries. At the previous steps of the data analysis we have been adjusting the SUTs and IO tables for exports and re-imports which has resulted in the values of re-exports and re-re-imports being calculated per country and per type of good and service. The adjustment procedure that has been implemented can be described as follows:
1. Calculate the trade flows that correspond to the re-exports of the country cntt by allocating them to the correct origin and destination countries cnt and cntt respectively following the patterns of incoming and outgoing trade flows of the country cntt. The following formula calculates the re-exports of country cntt that actually represent the trade between the countries cnt and cnttt:
, , , , , , , , , , , ,
Re_
Reexp
cnt cntt p cntt cnttt p cnt cntt cnttt p cntt p cntttt cntt p cntt cntttt p cntttt cnttttTrade
Trade
flows
orts
Trade
Trade
= −
⋅
⋅
∑
∑
(8)2. The initial value of trade between the countries is increased with the value of the additional trade flows that represent the re-exports of the EU28 countries:
, , , ,
Re_
, , ,cnt cntt p cnt cntt p cnt cnttt cntt p cnttt
Trade
=
Trade
+
∑
flows
(9) This adjusted value of trade flows is used for the calculation of the trade shares and trade flows consistent with the values in the SUTs.Before starting the trade-linking procedure we should make sure that the global values of exports and imports are consistent, that is if there are exports of particular good or service from one of the countries of the world than there should also exist imports of this good or service by one of the countries. The checks show that this is not the case for some types of services, which means that their values of exports/imports in the SUTs should be put to zero in order to avoid inconsistencies in the trade linking procedure.
We have also found the following inconsistencies between the international trade data, data on bi-lateral trade and transport margins (based on BACI) and the data on exports and imports from the SUTs:
1. There is data on exports or imports in the SUTs but there is no corresponding trade flows data: in this case we have used the data on exports or imports of other countries in order to split the SUTs data between possible origins and destinations and this way create the data on the missing trade flows.
2. There is data on trade flows but there is no corresponding data on exports or imports in the SUTs: in this case we have removed the data on trade flows as for us the leading (or priority) data is the data from the SUTs.
3. There is data on trade flows for goods but there is no corresponding data on bi-lateral trade and transport margins: in this case we have created the trade and transport margins between these origin and destination countries as the average of the existing trade and transport margin data for other types of goods traded between these two countries.
2.4.2 Using nonlinear programming to find the trade flows between the
countries
The following nonlinear programming problem has been solved in order to create the trade flows between the EU28 and other non-European countries of the world. The trade system is a closed one and covers the whole world.
Sets are defined as:
• TTmargin trade and transport margins •
Variables are defined as:
• Trade_v cnt,cntt,p inter-national trade
• TT_margin_v cnt, cntt,p inter-national trade and transport margins
• Exports_v cnt,p total country exports
• Imports_v cnt,p total country imports
• Inventories_v cnt,p changes in inventories
Equations are defined as:
• Exports of the country are equal to the sum of outgoing trade flows in FOB prices:
, , ,
_
cnt p_
cnt cntt p cnttExports v
=
∑
Trade v
(10) • Imports of the country are equal to the sum of incoming trade flows in CIF prices (thatis including trade and transport margins):
(
)
, , , , ,
Im
_
cnt p cntt cnt p1
_ arg _
cntt cnt p cnttports v
=
∑
Trade
⋅ +
TT m
in v
(11)• The total international trade in transport and trade related services is equal to the total value of the inter-national trade and transport margins:
, , , , , ,
, , arg , ,
_
_
cnt cntt p cnt cntt p cnt cntt p cnt cntt p TTm∈ in
Trade
cnt cntt pTrade
TT marign v
=
⋅
• Minimized the distance (measured as entropy) between the initial estimates of the trade flows based on international trade data (BACI and UN trade in services) and the outcomes of the nonlinear programming problem:
(
)
, , , , , ,
, ,
_
cnt cntt plog
_
cnt cntt p/
cnt cntt pmin
cnt cntt p
Trade v
⋅
Trade v
Trade
→
3 Regionalization of
country level Supply
and Use Tables
3.1 Overview of regional-level data for EU28
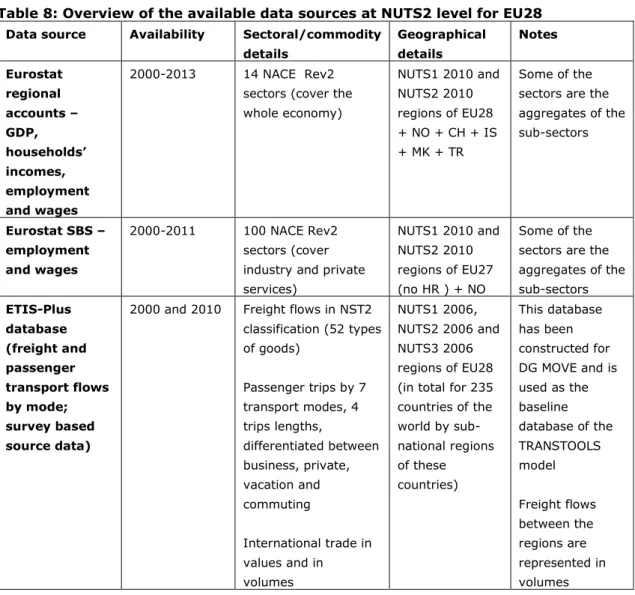
The regionalization of the national level Supply and Use tables makes use of several statistics available from Eurostat and other publicly available data sources. These used data sources are presented in Table 8 below.
Table 8: Overview of the available data sources at NUTS2 level for EU28 Data source Availability Sectoral/commodity
details Geographical details Notes Eurostat regional accounts – GDP, households’ incomes, employment and wages 2000-2013 14 NACE Rev2 sectors (cover the whole economy) NUTS1 2010 and NUTS2 2010 regions of EU28 + NO + CH + IS + MK + TR Some of the sectors are the aggregates of the sub-sectors Eurostat SBS – employment and wages 2000-2011 100 NACE Rev2 sectors (cover industry and private services) NUTS1 2010 and NUTS2 2010 regions of EU27 (no HR ) + NO Some of the sectors are the aggregates of the sub-sectors ETIS-Plus database (freight and passenger transport flows by mode; survey based source data)
2000 and 2010 Freight flows in NST2 classification (52 types of goods) Passenger trips by 7 transport modes, 4 trips lengths, differentiated between business, private, vacation and commuting International trade in values and in volumes NUTS1 2006, NUTS2 2006 and NUTS3 2006 regions of EU28 (in total for 235 countries of the world by sub-national regions of these countries) This database has been constructed for DG MOVE and is used as the baseline database of the TRANSTOOLS model Freight flows between the regions are represented in volumes
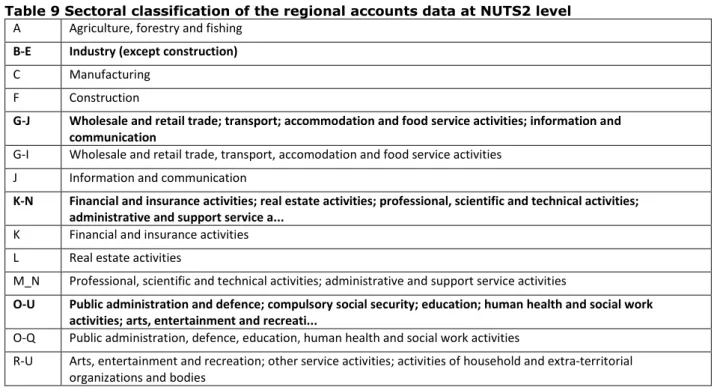
Data from regional accounts consists of the information on wages and employment by NACE Rev2 economic sectors according to the classification presented in Table 9. This sectoral level of detail is not very detailed but covers the whole of the economy. Regional accounts data does not have any missing values and hence is fully complete.
Table 9 Sectoral classification of the regional accounts data at NUTS2 level A Agriculture, forestry and fishing
B-E Industry (except construction) C Manufacturing
F Construction
G-J Wholesale and retail trade; transport; accommodation and food service activities; information and communication
G-I Wholesale and retail trade, transport, accomodation and food service activities J Information and communication
K-N Financial and insurance activities; real estate activities; professional, scientific and technical activities; administrative and support service a...
K Financial and insurance activities L Real estate activities
M_N Professional, scientific and technical activities; administrative and support service activities
O-U Public administration and defence; compulsory social security; education; human health and social work activities; arts, entertainment and recreati...
O-Q Public administration, defence, education, human health and social work activities
R-U Arts, entertainment and recreation; other service activities; activities of household and extra-territorial organizations and bodies
Another set of sectoral data at the NUTS2 regional level provided by Eurostat are the Structural Business Statistics (SBS) dataset. This dataset provides much more sectoral details at NACE Rev2 classification for the private part of the economic sectors and includes information on both wages and employment. The level of sectoral details is presented at Table 10. The SBS dataset has some missing values for some regions and sectors that we have imputed using the data on regions with similar levels of GDP per capita. In several cases we used SBS data from earlier years to fill in gaps. The share of missing values in the SBS dataset is less than 1% of all observations.
In order to be able to regionalize the 65 NACE Rev2 sectors of the Supply and Use tables we have chosen to combine the data from SBS and regional accounts. SBS data is used for the regionalization of private economic sectors and regional accounts dataset is used for regionalization of agriculture, forestry and fishery as well as public economic sectors.
Table 10 Sectoral details of the Structural Business Statistics data from Eurostat B Mining and quarrying C23 Manufacture of other
non-metallic mineral products F42 Civil engineering G473 Retail sale of automotive fuel in specialised stores J61 Telecommunications B05 Mining of coal and lignite C24 Manufacture of basic metals F43 Specialised construction
activities G474 Retail sale of information and communication equipment in specialised stores
J62 Computer programming, consultancy and related activities
B06 Extraction of crude petroleum
and natural gas C25 Manufacture of fabricated metal products, except machinery and equipment
G Wholesale and retail trade; repair of motor vehicles and motorcycles
G475 Retail sale of other household equipment in specialised stores
J63 Information service activities
B07 Mining of metal ores C26 Manufacture of computer,
electronic and optical products G45 Wholesale and retail trade and repair of motor vehicles and motorcycles
G476 Retail sale of cultural and recreation goods in specialised stores
L Real estate activities
B08 Other mining and quarrying C27 Manufacture of electrical
equipment G451 Sale of motor vehicles G477 Retail sale of other goods in specialised stores L68 Real estate activities B09 Mining support service
activities C28 Manufacture of machinery and equipment n.e.c. G452 Maintenance and repair of motor vehicles G478 Retail sale via stalls and markets M Professional, scientific and technical activities C Manufacturing C29 Manufacture of motor vehicles,
trailers and semi-trailers G453 Sale of motor vehicle parts and accessories G479 Retail trade not in stores, stalls or markets M69 Legal and accounting activities C10 Manufacture of food products C30 Manufacture of other transport
equipment G454 Sale, maintenance and repair of motorcycles and related parts and accessories
H Transportation and storage M70 Activities of head offices; management
consultancy activities C11 Manufacture of beverages C31 Manufacture of furniture G46 Wholesale trade, except
of motor vehicles and motorcycles
H49 Land transport and
transport via pipelines M71 Architectural and engineering activities; technical testing and analysis
C12 Manufacture of tobacco
products C32 Other manufacturing G461 Wholesale on a fee or contract basis H50 Water transport M72 Scientific research and development C13 Manufacture of textiles C33 Repair and installation of
machinery and equipment G462 Wholesale of agricultural raw materials and live animals
H51 Air transport M73 Advertising and market research
C14 Manufacture of wearing
apparel D Electricity, gas, steam and air conditioning supply G463 Wholesale of food, beverages and tobacco H52 Warehousing and support activities for transportation M74 Other professional, scientific and technical activities
C15 Manufacture of leather and
C16 Manufacture of wood and of products of wood and cork, except furniture; manufacture of articles of straw and plaiting materials
E Water supply; sewerage, waste management and remediation activities
G465 Wholesale of information and communication equipment
I Accommodation and food
service activities N Administrative and support service activities
C17 Manufacture of paper and
paper products E36 Water collection, treatment and supply G466 Wholesale of other machinery, equipment and supplies
I55 Accommodation N77 Rental and leasing activities C18 Printing and reproduction of
recorded media E37 Sewerage G467 Other specialised wholesale I56 Food and beverage service activities N78 Employment activities C19 Manufacture of coke and
refined petroleum products E38 Waste collection, treatment and disposal activities; materials recovery
G469 Non-specialised wholesale
trade J Information and communication N79 Travel agency, tour operator reservation service and related activities C20 Manufacture of chemicals and
chemical products E39 Remediation activities and other waste management services G47 Retail trade, except of motor vehicles and motorcycles
J58 Publishing activities N80 Security and investigation activities C21 Manufacture of basic
pharmaceutical products and pharmaceutical preparations
F Construction G471 Retail sale in
non-specialised stores J59 Motion picture, video and television programme production, sound recording and music publishing activities
N81 Services to buildings and landscape activities
C22 Manufacture of rubber and
plastic products F41 Construction of buildings G472 Retail sale of food, beverages and tobacco in specialised stores
J60 Programming and
broadcasting activities N82 Office administrative, office support and other business support activities
In order to disaggregate EU28 Supply and Use (SUTs) tables from the national to regional NUTS2 level we use the regional-level indicators specific for each element of the Supply and Use tables. In some cases these indicators are Eurostat data such as regional sectoral wages and regional GDP whereas in other cases the indicators are derived on the basis of other regionalized elements of the SUTs. Table 11 presents the mapping between the indicators used for regionalization and the separate elements of the SUTs. Unfortunately, there is not always a direct proxy available for the regionalization of the different columns or rows in the SUTs. In those case we used an available indirect proxy derived from economic theory. Please note that a proxy like “Total regional intermediate inputs by type of good/service” can only be determined after the sector columns for the regions have been regionalized.
Table 11 Mapping between the elements of national-level Supply and Use tables and the regional data at NUTS2 level from Eurostat
Element of the national –level Supply and Use tables
Data at the regional NUTS2 level from Eurostat used for regionalization/disaggregation
Derived indicator used for regionalization/disaggregation
Intermediate
demand/sectoral inputs
Wage sum by region and sector GDP based on national capital share and total regional GDP data
Sectoral outputs Wage sum by region and sector GDP based on national capital share and total regional GDP data
Final consumption expenditure of
households and NPISH
Households’ income Not applicable
Final consumption expenditure of NPISH
Households’ income Not applicable
Final consumption expenditure of government
Households’ income Not applicable
Gross fixed capital formation
Not available Total regional intermediate inputs by type of good/service
Taxes less subsidies on products
Not available Total regional production for region use by type of good/service
Trade and transport margins
Not available Total regional consumption by type of good/service
Compensation of employees
Wage sum by region and sector GDP based on national capital share and total regional GDP data
Other net taxes on production
Wage sum by region and sector GDP based on national capital share and total regional GDP data
Consumption of fixed capital
Wage sum by region and sector GDP based on national capital share and total regional GDP data
Operating surplus net Wage sum by region and sector GDP based on national capital share and total regional GDP data
Changes in inventories and valuables
Not available Total regional consumption by type of good/service
l r r l k k S
I
X
Y
I
∈= ⋅
∑
where
X
ris the element of regional SUTs of regionr
,Y
l is the corresponding element of the national SUTs of countryl
,I
r is the used indicator,S
l is the set of NUTS2 regions of countryl
, indexesr k
,
are used for regions and indexl
is used for countries. The disaggregation formulas are used for all elements of the SUTs except for the changes in inventories and valuables.Table 12 below presents various categories of Eurostat Supply and Use tables and their corresponding codes that are important for the regionalization. These codes are used in the formula for the derivation of regional-level changes in inventories and valuables.
Table 12 Sub-Category of the Supply and Use tables with Eurostat codes
Name of the SUTs category
Code
Final consumption expenditure by households
P3_S14
Final consumption expenditure by non-profit organisations serving households (NPISH)
P3_S15
Final consumption expenditure by government
P3_S13
Gross fixed capital formation
P51
Changes in inventories and valuables
P52_P53
Gross capital formation
P5
Exports FOB
P6
Compensation of employees
D1
Other net taxes on production
D29_M_D39
Consumption of fixed capital
K1
Operating surplus, net
B2N_B3N
Imports CIF
P7
Trade and transport margins
P118
Taxes less subsidies on products
D21_M_D31
Net trade of a region with the rest of the country
T1
On the regional level we introduced one extra column in the use table. This column are the region and product specific net trade of the region with the rest of the country. This regional- level net trade at product level
p
is calculated as:, 1 , , , 3_ 13 , 3_ 14
, 3_ 15 , 51 , 6 , 52_ 53
p T p c p s p P S p P S
c s
p P S p P p P p P P
USE
SUP
USE
USE
USE
USE
USE
USE
USE
=
−
−
−
−
−
−
−
∑
∑
1.1.
Deriving inter-regional trade flows
In order to determine the interregional trade between NUTS2 regions and between NUTS2 regions and the rest of the world we use a newly developed estimation technique. We determine the trade between nuts2 regions given data on freight transport and regionalized supply and use tables for the European NUTS2 regions. The methodology is based on linear and non-linear optimization techniques. The methodology consists of two independent steps. In the first step we determine the probability matrices of trade between regions using 0, 1, 2, 3 or 4 transshipment locations. In the second step these probability matrices are used to estimate the trade between the regions where we minimize the estimate for value per ton shipped in a country and the data on ton goods leaving a region.
The end result is a regional trade matrix that is not only consistent with the regional supply and use tables, but also stays as close as possible to the main European transport data. The associated transport matrix estimated simultaneously with the trade flows represent the complete chain of multimodal transport (5 modes) with endogenously determined transshipment locations from a region where the product\service is produced to a region where the product\service is consumed.
The estimation of the inter-regional trade flows is schematically presented in Figure 2. In Figure 2 we see that the estimation methodology of the regional trade consists of two main parts: the calculation of different probabilities of trade between regions and associated information like ton-kilometers transported and the estimation of these trade flows based on these probabilities. All data is used in gams data files (gdx) for matter of convenience since all programs have been written in gams.
Trade in services is estimated in a comparable way to the trade in goods. However, now business travel is used as a proxy for trade relations ships. Also business travelers use multiple modes and these stopovers are therefore taken into account like transshipments for the transport of goods.
Figure 2: Procedure followed to estimate regional trade
Collect needed data:
Freight data, production, consumptio, distances, loading and unloading tons, ton-kilometers
Add up the different trandsport Modes
Calculate the Probabilities for trade, unloading transshipment and kilometers transported from transhipment loaction
Save the Output of the probabilities in a in GDX
Load Data from GDX and include consumption and production
Solve de Trade assignment model (NLP)
3.1.1 Distribution Probabilities
In order to calculate all possible trade destinations for different number of transshipment transport of the goods we need probability matrices for goods using different amounts of transshipment
τ
. We consider up to 5 transshipments. The basis is the probability matrix, , ,p r s
τ
χ
without transshipment that is derived from the freight matrixF
p r s, , as follows. , , 0, , , , , ' ' p r s p r s p r s sF
F
χ
=
∑
(14)Where
r
ands
are origin and destination nuts2 regions.Using the
ξ
r s, Distance matrix in km from regionr
to regions
we can also determine the following associated distanceζ
0, , ,p r rfor non-transshipment trade.0, , , 0, , , , 0, , ,
1
p r r s p r s r s p r rζ
χ
ξ
ψ
=
=
∑
(15)Where
ψ
τ, , ,p r s is the probability matrix of trade of productp
from regionr
that will be transshipped in regions
and that is usingτ
transshipment locations.Using this information we can determine the probability of trade using one or multiple transshipment locations. The following set of equations therefore determines the needed probabilities and distances.
1, , , ' ' , ' 0, , , ' 0, , ', 1, , , ' ' , ' 0, , , ' 0, , ', , 1, , , ' ' , ' 0, , , ' 0, , ', 0, , , ' p r s r r r r s p r r p r s p r r s r r r s p r r p r s r s p r r s r r r s p r r p r s p r r
χ
χ
χ
ζ
χ
χ
ξ
ψ
χ
χ
χ
≠ ≠ ≠ ≠ ≠ ≠=
=
=
=
∑
∑
∑
(16)There is one more condition on
r
'
that is left out of the above equation. This condition is that ifr
'
is in a different country thanr
, thenr
is also in a different country thans
. In a comparable way all parameters for the different number of transshipment trade are determined.We also need the probabilities of a good leaving a region for every transshipment route and we also need the kilometers of these good leaving that region. These probabilities can be easily calculated from the probabilities of transshipment summing up in different points of the transport chain.
3.1.2 Trade assignment Models
Let us have regions
r
,s
, countriesl
,k
and productsp
. Trade is estimated to minimize the error on the data available. The objective function is a weighted minimization of the quadratic relative and absolute error. ProductionX
p r, is the sum over the trade matrix in producer prices, while consumptionC
p s, in consumer prices is the sum over the trade added with the trade and transport margins. TradeΗ
p r s, , can be transported usingτ
[
0,...,4
]
transshipment locations. Notice that the model cannot be solved for all products separately since they are dependent on each other with respect to data on total loading, unloading and ton kilometers. It is assumed that the value per ton transported for a good is comparable in neighboring regions. Therefore a weighted error is specified according to equation 1.5 below, whereξ
is the average distance between all regions. The errors in the estimation are described asε
with the name of the variable the error is related to. Thus,εν
is the error related to the value per ton estimate.The Trade Estimation Model