Keuzes in Kaart 2013-2017 Een analyse van tien verkiezingsprogra
mma’
s
Dit is een uitgave van:
Centraal Planbureau (CPB)
Postbus 80510 | 2508 GM Den Haag (070) 338 33 80 | www.cpb.nl | info@cpb.nl
Planbureau voor de Leefomgeving (PBL) Postbus 30314 | 2500 GH Den Haag (070) 328 87 00| www.pbl.nl | info@pbl.nl
Gedrukt door: De Swart BV
Postbus 53184 | 2505 AD Den Haag (070) 308 21 21 | www.kds.nl | info@kds.nl
Foto omslag: GPD | Stephanie Versteeg
Augustus 2012 | ISBN 978-90-5833-559-3 De verkiezingsprogramma’s 2012 laten zien welke keuzes
politieke partijen maken voor de jaren 2013-2017.
De programma’s tonen aan dat er echt iets te kiezen valt voor de komende kabinetsperiode. Hoe gaan we na de economische crisis de overheidsfinanciën weer op orde brengen en hoe snel? Verhogen we de AOW-leeftijd en beperken we de aftrek van de hypotheekrente, of juist niet? Hoe verminderen we de filedruk? Willen we klimaatverandering aanpakken en zo ja, hoe dan? Is het de moeite waarde om meer geld uit te geven aan onderwijs of innovatie? Hoeveel trekken we uit voor natuur? Hoe kunnen we de woningmarkt beter laten functio-neren? Hoe gaan we om met de stijging van de kosten van de zorg?
In de aanloop naar de verkiezingen van 12 september 2012 hebben tien politieke partijen - VVD, PvdA, PVV, CDA, SP, D66, GroenLinks, ChristenUnie, SGP, DPK - gevraagd om een analyse van hun verkiezingsprogramma’s. Het CPB heeft de economi-sche effecten geanalyseerd, het PBL de effecten op milieu.
Planbureau voor de Leefomgeving
VVD, PvdA, PVV,
CDA, SP, D66, GL,
ChrU, SGP, DPK
Effecten op
economie
en milieu
Keuzes in Kaart
2013-2017
Charted Choices
2013-2017
English translation of
chapter 2, the headlines
1
2
The outlines of the election
manifestos
Please note: this is a translation of Chapter 2 of the book Charted
Choices 2013–2017, which contains the main findings, compared
to the baseline, as described in CPB’s forecast of the Dutch
economy up to 2017 that was published in June 2012.
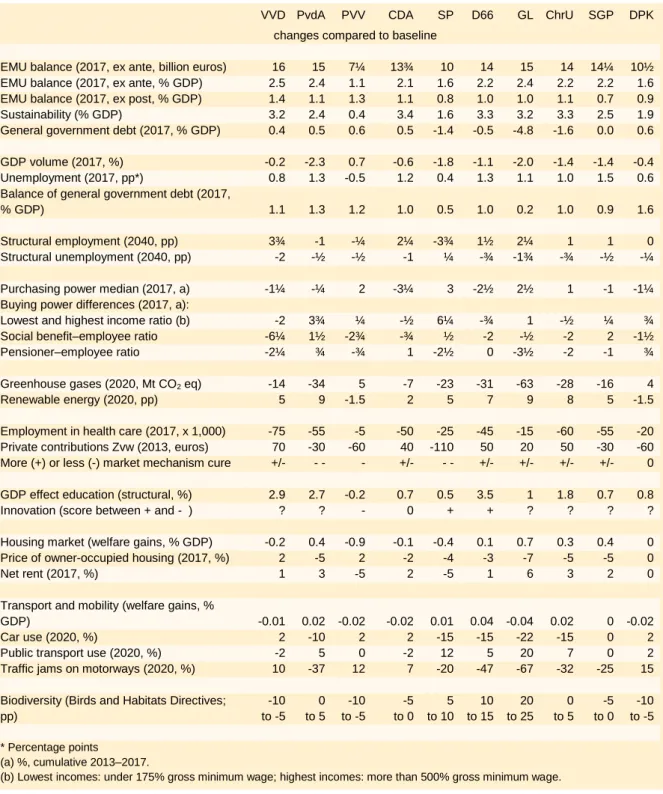
What is the outline of the plans of the political parties, and what are the implications of these plans? Table 2.1 provides a general overview, which is further elaborated in this chapter.
Table 2.1 Summary table
VVD PvdA PVV CDA SP D66 GL ChrU SGP DPK changes compared to baseline
EMU balance (2017, ex ante, billion euros) 16 15 7¼ 13¾ 10 14 15 14 14¼ 10½ EMU balance (2017, ex ante, % GDP) 2.5 2.4 1.1 2.1 1.6 2.2 2.4 2.2 2.2 1.6 EMU balance (2017, ex post, % GDP) 1.4 1.1 1.3 1.1 0.8 1.0 1.0 1.1 0.7 0.9 Sustainability (% GDP) 3.2 2.4 0.4 3.4 1.6 3.3 3.2 3.3 2.5 1.9 General government debt (2017, % GDP) 0.4 0.5 0.6 0.5 -1.4 -0.5 -4.8 -1.6 0.0 0.6
GDP volume (2017, %) -0.2 -2.3 0.7 -0.6 -1.8 -1.1 -2.0 -1.4 -1.4 -0.4 Unemployment (2017, pp*) 0.8 1.3 -0.5 1.2 0.4 1.3 1.1 1.0 1.5 0.6 Balance of general government debt (2017,
% GDP) 1.1 1.3 1.2 1.0 0.5 1.0 0.2 1.0 0.9 1.6
Structural employment (2040, pp) 3¾ -1 -¼ 2¼ -3¾ 1½ 2¼ 1 1 0 Structural unemployment (2040, pp) -2 -½ -½ -1 ¼ -¾ -1¾ -¾ -½ -¼
Purchasing power median (2017, a) -1¼ -¼ 2 -3¼ 3 -2½ 2½ 1 -1 -1¼ Buying power differences (2017, a):
Lowest and highest income ratio (b) -2 3¾ ¼ -½ 6¼ -¾ 1 -½ ¼ ¾ Social benefit–employee ratio -6¼ 1½ -2¾ -¾ ½ -2 -½ -2 2 -1½ Pensioner–employee ratio -2¼ ¾ -¾ 1 -2½ 0 -3½ -2 -1 ¾ Greenhouse gases (2020, Mt CO2 eq) -14 -34 5 -7 -23 -31 -63 -28 -16 4
Renewable energy (2020, pp) 5 9 -1.5 2 5 7 9 8 5 -1.5
Employment in health care (2017, x 1,000) -75 -55 -5 -50 -25 -45 -15 -60 -55 -20 Private contributions Zvw (2013, euros) 70 -30 -60 40 -110 50 20 50 -30 -60 More (+) or less (-) market mechanism cure +/- - - - +/- - - +/- +/- +/- +/- 0
GDP effect education (structural, %) 2.9 2.7 -0.2 0.7 0.5 3.5 1 1.8 0.7 0.8 Innovation (score between + and - ) ? ? - 0 + + ? ? ? ?
Housing market (welfare gains, % GDP) -0.2 0.4 -0.9 -0.1 -0.4 0.1 0.7 0.3 0.4 0 Price of owner-occupied housing (2017, %) 2 -5 2 -2 -4 -3 -7 -5 -5 0 Net rent (2017, %) 1 3 -5 2 -5 1 6 3 2 0
Transport and mobility (welfare gains, %
GDP) -0.01 0.02 -0.02 -0.02 0.01 0.04 -0.04 0.02 0 -0.02 Car use (2020, %) 2 -10 2 2 -15 -15 -22 -15 0 2 Public transport use (2020, %) -2 5 0 -2 12 5 20 7 0 2 Traffic jams on motorways (2020, %) 10 -37 12 7 -20 -47 -67 -32 -25 15
Biodiversity (Birds and Habitats Directives; pp) -10 to -5 0 to 5 -10 to -5 -5 to 0 5 to 10 10 to 15 20 to 25 0 to 5 -5 to 0 -10 to -5 * Percentage points (a) %, cumulative 2013–2017.
(b) Lowest incomes: under 175% gross minimum wage; highest incomes: more than 500% gross minimum wage.
All political parties aim to decrease the budget deficit by 2017 compared with the baseline. The budget deficit reduction ranges from 7¼ billion euros for PVV to 16 billion euros for the VVD. Expressed as a percentage of GDP, this is equivalent to a 1.1% to 2.5% reduction, respectively. These are the ex ante effects, not taking into account the macroeconomic impact of the package of measures.
3
Deficit-reducing measures are a dampener on short-term and medium term economic growth, reducing tax income and increasing the number of social benefits to be paid out. The
ex post effects do take these impacts into account. In that case, the deficit reduction ranges
from 0.7% GDP for the SGP to 1.4% GDP for the VVD, compared with the deficit of 2.6% GDP by 2017 in the baseline. The effect on general government debt, expressed as a percentage of GDP, depends not only on this reduction in deficit between 2013 and 2017, but also on GDP development during this period. For most parties, the change in general government debt is negligible compared with the 74.2% GDP by 2017 in the baseline. The GroenLinks package has the highest impact, with rising inflation, causing the general government debt quote to decrease by 4.8% GDP. On the other side of the spectre, the PVV and DPK would cause an increase in general government debt by 0.6% GDP.
For some measures, the effect decreases after 2017 (e.g. the wage freeze for civil servants, because salary increases for civil servants can lag behind market rates temporarily but not structurally). Conversely, the effect of other measures increases after 2017 (e.g. raising the statutory retirement age). The sustainability indicator considers the impacts on the budget in as well as after 2017. For the PVV, the sustainability effect is smaller than the ex ante effect in 2017; for the SP it is stable, and for all other parties it is larger. The sustainability effect ranges from 0.4% GDP for the PVV to 3.4% GDP for the CDA. In the baseline, the
sustainability gap amounts to 1.1% GDP by 2017.
In most cases, the packages dampen GDP in 2017 compared with the baseline. The PvdA package has the largest negative impact (-2.3%), whereas the VVD package leaves GDP virtually unchanged, and the PVV package has a positive effect of 0.7%. The impact on
unemployment in 2017 ranges from a 1.5% increase for the SGP to a 0.5% decrease for the
PVV, compared with 5¼% in the baseline. The current account balance of payments (9¼% GDP in the baseline) increases for all parties, ranging from 0.2% GDP for GroenLinks to 1.6% GDP for the DPK.
The packages have a varying effect on purchasing power in 2017 (the cumulative impact of changes in the years 2013 through 2017). The bandwidth is a 3% increase for the SP to a 3¼% decrease for the CDA, compared with a cumulative -½% decrease in the baseline. Moreover, the packages have a different effect on different groups. For example, with the SP package, the purchasing power of the lowest incomes increases over the entire period by 6¼% more than that of the highest incomes, compared with the baseline. On the other side of the spectre, the VVD package causes the purchasing power of the lowest incomes to lag behind that of the highest incomes by 2%. The purchasing power of social benefit recipients lags behind that of the employed by 6.25% if the VVD package were to be implemented. In contrast, under implementation of the packages of the PvdA, SP and SGP, the purchasing power of social benefit recipients would develop more positively than that of the employed. Purchasing power of pensioners would lag behind that of the employed by 3½% if the GroenLinks package were to be implemented. However, for the CDA, DPK and PvdA, the purchasing power of pensioners would develop more positively than that of the employed.
The party manifestos have varying structural effects on employment and unemployment, with the results for some parties deviating from the employment effects in 2017. Structural is defined as 'by 2040'. However, most of the effects are realised well before 2040. Some measures do not have a structural effect until around 2040, such as those related to the housing market and retirement. Regarding tax measures, most of the structural effects on employment are assumed to be achieved by 2025.
On one side of the spectre, in particular the tax measures of the VVD, CDA and GroenLinks would lead to higher employment and lower unemployment. This also applies to the D66 packages, although to a lesser extent. On the other side of the spectre, measures in the SP package (in particular the tax measures) would lead to a higher marginal tax rate, and therefore to lower employment and more unemployment. Employment also decreases for the PvdA and PVV, but structural unemployment simultaneously decreases.
By 2040, the statutory retirement age of is in accordance with the baseline for eight of the ten parties, namely 68 years and 6 months. The VVD increases the statutory retirement age by over 1 year to 69 years and 9 months. The PVV decreases the statutory retirement age to 65. The PvdA allows people flexibility in choosing their statutory retirement age. The SP, in particular, introduces a flanking policy that would result in decreasing employment.
Measures proposed by the VVD, PvdA, CDA, SP, D66, GroenLinks, ChristenUnie and SGP, would decrease emission levels of greenhouse gases. The largest decrease would be achieved with the GroenLinks package. The PVV and DPK measures, however, would cause an increase in these emissions. For parties that realise emission reductions, the main contributor is the increase in renewable energy, forcing down the use of fossil energy. The largest increase in renewable energy is achieved with the packages of the PvdA and GroenLinks, followed by the ChristenUnie and D66. The packages of measures of these parties would more than achieve the EU target of 14% by 2020. The packages of the VVD, SP and SGP would be sufficient to reach the EU target, but packages of the PVV, CDA and DPK would not.
Regarding health care, the analysis had to be limited to budgetary effects of the intended measures (i.e. the costs). The effects of the measures on people's health are extremely difficult or even impossible to quantify in a reliable manner and therefore were not considered. The parties' packages differ widely in how and to which degree they intend to cut back health care costs. The impact of the parties' measures on health care employment also varies. In the baseline, health care employment increases by 140,000 persons. All of the parties achieve a lower result, with decreases ranging from 75,000 persons for the VVD to 5,000 for the party with the least incisive interventions in health care (PVV).
Parties have different opinions on the desirability of private contributions in the Health care Insurance Act. The SP, DPK, PVV, PvdA and SGP all decrease the private contributions, compared with the baseline, whereas CDA, ChristenUnie, D66, VVD and GroenLinks increase these contributions. Adjustments range from a decrease of 110 euros (SP) to an increase of 90 euros (GroenLinks). GroenLinks, PvdA, SGP and D66 would implement an
income-5
dependent policy excess. The VVD, D66 and SGP would implement, on top of a policy excess, also a percentage of private payments, according to which a certain percentage of the invoice is to be paid by the insured. The effects of this non-refundable part of the medical expenses are larger because people must also contribute to any follow-up treatments.
All parties except the CDA turn the AWBZ (Exceptional Medical Expenses Act) into a social service with regional implementation. This allows for tailoring health care requirements to individual circumstances. On the downside, this means differences may arise in the amount of health care between regions and possibly between health care providers. The CDA maintains the insurance form, with the only adjustment of paying out in vouchers rather than in kind.
In curative health care, the VVD, PVV, CDA, D66, GroenLinks, ChristenUnie, SGP and DPK continue the regulated market mechanism. However, the VVD, PVV, CDA, D66, GroenLinks, ChristenUnie and SGP in addition insist on 'locking the door' in order to enforce a lower growth path for health care expenses. These parties aim to use the MBI (Macro Control Instrument) and the specialist budget to further decrease the volume growth in hospital care, from 2½% to 2%, up to 2017. The PvdA and SP advocate a drastic change in the health care system, with health care becoming a social service, steering health care supply
according to tight budgeting. This would make health care cheaper, but may lead to the return of waiting list problems.
Six of the ten parties (GroenLinks, D66, PvdA, ChristenUnie, SGP and VVD), on balance, increase expenditure on education. Educational policies of the D66, VVD and PvdA would realise a large positive effect, in the long run, in terms of GDP percentage. The ChristenUnie would realise a lower effect, as it directs only limited resources towards promising
institutional measures. Of the ten parties, GroenLinks increases expenditure on education the most, but its investments in promising institutional measures are relatively limited. The DPK realises a positive total effect by focusing on performance-related funding. The
educational measures of the SGP, CDA and SP eventually would lead to smaller positive effects on GDP. The PVV realises a small negative total effect, in the long term. Regarding
innovation, the SP and D66 focus on promising measures; the SP through a limited decrease
in the WBSO (Research and Development Act) budget, and D66 by abolishing the innovation box. CDA's innovation policy was assessed to be neutral, as this party leaves the existing policy virtually unchanged. The PVV aims to realise maximum spending cuts in innovation policy, thus abolishing a number of effective policy instruments, including the WBSO. This will be detrimental to prosperity in the long term. The expected prosperity effect of the proposals by the other parties (VVD, PvdA, GroenLinks, ChristenUnie, SGP and DPK), on balance, is unknown.
In respect of the housing market, the PvdA, GroenLinks, ChristenUnie, SGP and, to a lesser extent, D66 will improve the effectiveness of the housing market for both buyers and tenants, thus increasing prosperity. These parties all limit tax deductibility of mortgage interest to some extent. They simultaneously reduce rationing in the rental market. The PvdA, CDA, GroenLinks, ChristenUnie and SGP replace the current home valuation system
with a system that determines the maximum reasonable rent at 4.5% of the home's WOZ value (Property Valuation Tax). The parties that would decrease the effectiveness of the housing market all decrease the appeal of rental property exploitation, causing a decrease in the supply of rental homes and an increase in rationing in the rental market.
The transport and mobility gains that the parties realise by 2020 are within a very close range. Travel time gains are compensated by a prosperity loss due to less car use. The PvdA, SP, D66, GroenLinks and ChristenUnie, compared to the other parties, would realise large travel time gains, as well as a relatively large loss due to a decrease in the use of cars and public transportation. This is due to the proposed introduction of road pricing, which would dramatically decrease motorway traffic jams, but also would cause people more often to decide against travelling. The changes in transport and mobility gains are smaller for the VVD, PVV, CDA, SGP and DPK.
Parties clearly make different choices regarding nature policy. The package of measures by GroenLinks would benefit biodiversity the most. This is achieved by spending most money on purchasing and preparing new nature areas as well as on managing them. Here, ambitions of D66 and SP are more modest, with lower improvements to biodiversity as a consequence. Where the SP prioritises the National Ecological Network (EHS), both GroenLinks and D66 also pay additional attention to those species included in the Birds and Habitats Directives that have their habitats outside the EHS. Biodiversity increases by a few percentage points for PvdA and ChristenUnie. This is mainly due to additional focus on nature outside the EHS. The SGP and CDA introduce spending cuts related to the expansion and development of nature areas, but do direct resources towards temporary recovery management and the problem of desiccation. For these parties, on balance, biodiversity will decrease by a few percentage points. The VVD, PVV and DPK introduce the largest spending cuts on nature, and as a result biodiversity would decline the most.
2.1
General government budget
All parties aim to decrease the general government deficit by 2017. This is apparent from the improvement of the ex ante EMU balance compared with the baseline. Ex ante refers to the fact that the impacts of the measures on the economy – and the ensuing effect on the EMU balance – have not been factored in (see Section 2.3). Net spending cuts in general
government expenditure, for all parties, contribute to the desired deficit reduction, although the cost side shows a mixed result.
For five parties (DPK, PvdA, PVV, SP and GroenLinks), the general government deficit will increase further in 2013, compared with the baseline, and for the PVV this continues in to 2014. For two parties (D66 and SGP), the general government deficit remains unchanged, compared to the baseline. The other three parties (VVD, CDA and ChristenUnie) start reducing the deficit as early as in 2013.
7
Figure 2.1 Budgetary choices: net expenditures and cost changes (2017, billion euros in 2012 prices, compared to the baseline)
Public administration Social security
Health care Education
Household expenses Company expenses
The VVD achieves the highest improvement to the ex ante EMU balance by 2017, namely by 16 billion euros. The improvement is the lowest for the PVV, with 7¼ billion euros. Many of the parties also intend to implement measures that will not fully show their budgetary effect until after 2017; for example, because of a lengthy implementation process. In addition, the savings related to certain measures sometimes increase as the population ages. Whenever measures cost or yield more or less after 2017, this was factored into the calculation of the sustainability of public finances in the long term (see Section 2.6).
-2.0 -1.5 -1.0 -0.5 0.0
VVD PvdA PVV CDA SP D66 GL ChrU SGP DPK bln euros -9 -8 -7 -6 -5 -4 -3 -2 -1 0
VVD PvdA PVV CDA SP D66 GL ChrU SGP DPK bln euros -9 -8 -7 -6 -5 -4 -3 -2 -1 0
VVD PvdA PVV CDA SP D66 GL ChrU SGP DPK
bln euros -2 -1 0 1 2 3
VVD PvdA PVV CDA SP D66 GL ChrU SGP DPK bln euros -9 -8 -7 -6 -5 -4 -3 -2 -1 0 1 2
VVD PvdA PVV CDA SP D66 GL ChrU SGP DPK bln euros -4 -3 -2 -1 0 1 2 3 4 5 6 7 8
VVD PvdA PVV CDA SP D66 GL ChrU SGP DPK bln euros
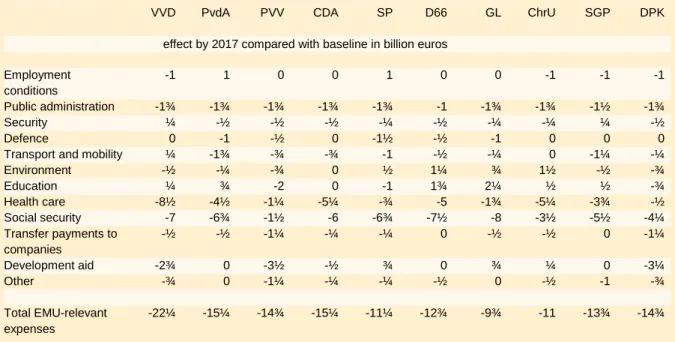
How do parties intend to achieve their improvement of the EMU balance by 2017? Figure 2.1 provides an overview of the key items. This concerns the net expense categories of public administration, social security, health care and education, and changes to household and company expenses. Regarding expenses, a negative result indicates a net spending cut; for changes to these expenses, it indicates a cost reduction.
All parties, on balance, implement spending cuts. Spending cuts by the VVD are greatest with 22¼ billion euros, and by GroenLinks they are the smallest with 9¾ billion euros. Four parties (in descending order: GroenLinks, ChristenUnie, D66, SGP) choose to increase EMU-relevant expenses compared with the baseline. The six other parties (in descending order: PVV, VVD, DPK, CDA, SP and PvdA) aim to decrease these expenses.
Four parties achieve a spending cut via further diminution in conditions of employment in
the public sector (ChristenUnie, DPK, VVD and SGP). Two parties choose to increase
expenditure in this field, compared with the baseline (PvdA and SP).
All parties implement spending cuts on public administration. Eight of the ten parties choose the largest economisation deemed possible by CPB for the next cabinet term (for an explanation of the feasibility of spending cuts in public administration, see Section 14.1 of the Dutch report). Only SGP and D66 remain below this ceiling.
All parties except the VVD and SGP also want to spend less on security; generally by cutting administrative costs. For five parties (VVD, CDA, ChristenUnie, SGP and DPK), on balance, expenditures on defence remain unchanged. The SP implements the largest spending cuts, namely 1½ billion euros.
The VVD is the only party to increase the spending on transport and mobility. The ChristenUnie keeps expenses at the existing level, while all other parties choose to
implement spending cuts in this respect. The PvdA implements the largest spending cuts on transport and mobility (1¾ billion euros).
Of the parties, the ChristenUnie spends the most on the environment compared to the baseline, namely 1½ billion euros. D66, GroenLinks and the SP also increase spending on the environment. The PVV and DPK intend to implement the largest spending cuts on the
environment (¾ billion euros). Apart from this, most parties implement their environmental policy through cost measures. The difference in expenses, therefore, is not conclusive
regarding the full focus of a party's environmental policy.
Seven parties intend to spend more on education. GroenLinks increases spending the most (2¼ billion euros). Of the three parties that intend to reduce spending, compared to the baseline, the PVV cuts the most on education costs (2 billion euros).
9
All parties intend to spend less on health care by 2017 than indicated in the baseline. Spending cuts by the VVD are the largest with 8½ billion euros, and by DPK the lowest with ½ billion euros. Here, there is a real choice to be made between parties, as the differences are not limited to the size of the spending cuts. Parties also have widely differing opinions on the optimal structure of the health care system. Some parties intend to realise cost savings by reducing the insured health care package and creating consumer incentives. Others opt for budgeting. Section 2.8 further specifies these differences.
All parties save billions on social security. GroenLinks spends 8 billion euros less compared with the baseline. However, this is mainly achieved by abolishing the health care allowance and using the money thus saved for decreasing health insurance premiums. In terms of the EMU balance, this measure has a neutral result. The PvdA and SP also take this measure. The PVV makes the least changes in spending on social security (1½ billion euros). The PVV intends to lower the national retirement age compared to the baseline, by sticking to the current eligibility age of 65. The SP chooses a slower rate of raising the retirement age than in the baseline, and spares people on a low income. Most other parties intend to increase the national retirement age at a faster pace than in the baseline.
The PVV and DPK intend to implement the largest spending cuts on development aid, followed closely by the VVD. In contrast, the SP, GroenLinks and the ChristenUnie all raise expenditures on development aid. Not a single party, on balance, spends more on transfer
payments to companies compared with the baseline (e.g. including subsidies paid to
NGOs).
Table 2.2 Public spending
VVD PvdA PVV CDA SP D66 GL ChrU SGP DPK
effect by 2017 compared with baseline in billion euros
Employment conditions -1 1 0 0 1 0 0 -1 -1 -1 Public administration -1¾ -1¾ -1¾ -1¾ -1¾ -1 -1¾ -1¾ -1½ -1¾ Security ¼ -½ -½ -½ -¼ -½ -¼ -¼ ¼ -½ Defence 0 -1 -½ 0 -1½ -½ -1 0 0 0 Transport and mobility ¼ -1¾ -¾ -¾ -1 -½ -¼ 0 -1¼ -¼ Environment -½ -¼ -¾ 0 ½ 1¼ ¾ 1½ -½ -¾ Education ¼ ¾ -2 0 -1 1¾ 2¼ ½ ½ -¾ Health care -8½ -4½ -1¼ -5¼ -¾ -5 -1¾ -5¼ -3¾ -½ Social security -7 -6¾ -1½ -6 -6¾ -7½ -8 -3½ -5½ -4¼ Transfer payments to companies -½ -½ -1¼ -¼ -¼ 0 -½ -½ 0 -1¼ Development aid -2¾ 0 -3½ -½ ¾ 0 ¾ ¼ 0 -3¼ Other -¾ 0 -1¼ -¼ -¼ -½ 0 -½ -1 -¾ Total EMU-relevant expenses -22¼ -15¼ -14¾ -15¼ -11¼ -12¾ -9¾ -11 -13¾ -14¾
The baseline indicates a decrease in public sector employment. The parties add to this decrease to varying degrees; from 5,000 civil servants under GroenLinks to 65,000 under the PVV. The number of health care employees also decreases compared to baseline, ranging from 5,000 under the PVV to 75,000 under the VVD. The baseline indicates an increase in health care employment of a total of 140,000 jobs between 2012 and 2017. The manifestos of the political parties partly dampen this increase.
Table 2.3 Employment in the public sector and health care
Level Baseline VVD PvdA PVV CDA SP D66 GL ChrU SGP DPK
2012 2013– 2017
effect by 2017 in work years x 1,000 compared to baseline
Public sector 1048 -40 -35 -30 -65 -30 -40 -15 -5 -15 -15 -45 Health care 967 140 -75 -55 -5 -50 -25 -45 -15 -60 -55 -20 Total 2015 100 -110 -85 -70 -80 -65 -60 -20 -75 -70 -65
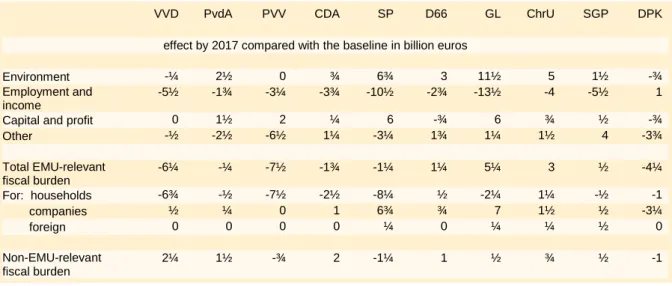
Table 2.4 includes the development in fiscal burden. Six parties reduce the EMU-relevant fiscal burden, with the PVV and VVD in the lead. The largest increase in fiscal burden is planned by GroenLinks. Both the ChristenUnie and D66 increase the fiscal burden for households, whereas this decreases in the manifestos of the other parties. GroenLinks and the SP intend to implement the largest increase in the fiscal burden for companies.
The fiscal burden related to the environment decrease under the DPK, and remains virtually unchanged under the VVD and PVV. All other parties show an increase in this area. The highest increase is that by GroenLinks, namely 11½ billion euros, but this party also proposes the largest decrease in the fiscal burden on employment and income. Apart from the DPK, the other parties also implement decreases in this category.
Table 2.4 Development in fiscal burden
VVD PvdA PVV CDA SP D66 GL ChrU SGP DPK
effect by 2017 compared with the baseline in billion euros
Environment -¼ 2½ 0 ¾ 6¾ 3 11½ 5 1½ -¾ Employment and
income
-5½ -1¾ -3¼ -3¾ -10½ -2¾ -13½ -4 -5½ 1
Capital and profit 0 1½ 2 ¼ 6 -¾ 6 ¾ ½ -¾ Other -½ -2½ -6½ 1¼ -3¼ 1¾ 1¼ 1½ 4 -3¾ Total EMU-relevant fiscal burden -6¼ -¼ -7½ -1¾ -1¼ 1¼ 5¼ 3 ½ -4¼ For: households -6¾ -½ -7½ -2½ -8¼ ½ -2¼ 1¼ -½ -1 companies ½ ¼ 0 1 6¾ ¾ 7 1½ ½ -3¼ foreign 0 0 0 0 ¼ 0 ¼ ¼ ½ 0 Non-EMU-relevant fiscal burden 2¼ 1½ -¾ 2 -1¼ 1 ½ ¾ ½ -1
11
The fiscal burden on capital and profit remains virtually unchanged in the VVD proposal. Under D66 and DPK, it decreases, while in the other parties' manifestos it increases. In the category other (VAT, excise duties), the ratio between increase and decrease is fifty-fifty. The largest decrease in this category is achieved in PVV's manifesto. This party opts for a decrease in VAT compared to the baseline, as do the DPK, SP and PvdA.
2.2
Macroeconomic impacts
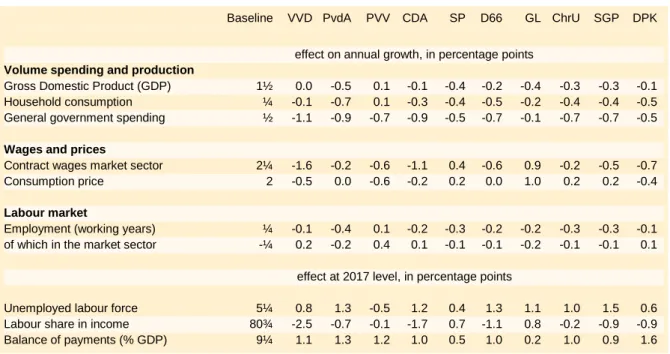
The various parties' packages have different impacts on the economy. All measures were analysed using the SAFFIER macro-econometric model that was also used to analyse the 2013 Budget Agreement.1 Table 2.5 shows the macroeconomic impacts for the 2013–2017
period. The first column describes the June 2012 baseline. The other columns show the outcome per party package. The top rows indicate the effects on the average annual growth rate of the relevant variable during the 2013–2017 period. If a variable’s annual growth rate is 0.5 percentage point lower, then by 2017 the result will be approximately 2.5% lower than in the baseline. The bottom rows show the difference in levels by 2017.
Table 2.5 Macroeconomic effects 2013–2017, compared to the baseline
Baseline VVD PvdA PVV CDA SP D66 GL ChrU SGP DPK
effect on annual growth, in percentage points
Volume spending and production
Gross Domestic Product (GDP) 1½ 0.0 -0.5 0.1 -0.1 -0.4 -0.2 -0.4 -0.3 -0.3 -0.1 Household consumption ¼ -0.1 -0.7 0.1 -0.3 -0.4 -0.5 -0.2 -0.4 -0.4 -0.5 General government spending ½ -1.1 -0.9 -0.7 -0.9 -0.5 -0.7 -0.1 -0.7 -0.7 -0.5
Wages and prices
Contract wages market sector 2¼ -1.6 -0.2 -0.6 -1.1 0.4 -0.6 0.9 -0.2 -0.5 -0.7 Consumption price 2 -0.5 0.0 -0.6 -0.2 0.2 0.0 1.0 0.2 0.2 -0.4
Labour market
Employment (working years) ¼ -0.1 -0.4 0.1 -0.2 -0.3 -0.2 -0.2 -0.3 -0.3 -0.1 of which in the market sector -¼ 0.2 -0.2 0.4 0.1 -0.1 -0.1 -0.2 -0.1 -0.1 0.1
effect at 2017 level, in percentage points
Unemployed labour force 5¼ 0.8 1.3 -0.5 1.2 0.4 1.3 1.1 1.0 1.5 0.6 Labour share in income 80¾ -2.5 -0.7 -0.1 -1.7 0.7 -1.1 0.8 -0.2 -0.9 -0.9 Balance of payments (% GDP) 9¼ 1.1 1.3 1.2 1.0 0.5 1.0 0.2 1.0 0.9 1.6
All parties intend to lower the EMU-relevant expenses compared to the baseline. The extent to which general government spending, such as on health care, education and public
administration, is reduced varies between parties. GroenLinks proposes the lowest spending cuts in this respect and the VVD the highest. In all other respects, the parties reduce transfer payments, such as the number of social benefits or the amount paid per social benefit, allowances and development aid. There are also shifts on the income side. Some parties
1
Please rrefer to CPB, 2010, SAFFIER II, 1 model for the Dutch economy in 2 versions for 3 applications, CPB Document 217 (all available only in Dutch)
reduce the EMU-relevant fiscal burden, with the PVV reducing the most, whereas other parties opt to increase the financial burden with GroenLinks in the lead.
Apart from in the PVV proposal, all party manifestos present lower household
consumption than in the baseline. The measures regarding transfer payments and fiscal
burdens play a role in this respect, as well as employment development. There may also be an impact from the development of actual wages, but these are sometimes also compensated by the fiscal burden development. In the PvdA proposal, consumption decreases the most due to a combination of less employment and lower actual wages. In the PVV proposal, consumption in fact rises due to higher employment growth and a reduced fiscal burden. In most party manifestos, the Gross Domestic Product (GDP) increases less than in the baseline. The impact on GDP is largest in the PvdA proposal. The VVD proposal would achieves a GDP virtually equal to that in the baseline, whereas the PVV would realise growth in GDP compared to the baseline.
The labour supply also changes in the various packages of measures; both with respect to the numbers of people in employment or those looking for work and the average number of contractual working hours per person. The policy effects on the labour supply are described in Section 2.5 (tax measures, social security). The analysis further factors in cyclical effects of changes to unemployment and actual wages. The number of people willing to work increases the most under GroenLinks and decreases under the PVV and ChristenUnie. The part-time factor (number of persons per work year) increases in particular under the SP and
GroenLinks, and to a lesser extent also under the PvdA. Employment in both health care and the public sector decreases for all parties compared to the baseline. The decrease is the smallest under GroenLinks (by 20,000 work years) and largest under the VVD (by 110,000).
Unemployment
13
In the medium term (up to 2017), the combination of more labour supply and less
employment in the public sector will drive up unemployment. Adjustment processes in the labour market take time. In the long term, additional labour supply or lower employment in the public sector will not have an impact on the equilibrium unemployment.
For almost all parties, unemployment will increase, compared to the baseline. The extent of this increase depends on labour supply and employment in the public sector and also on the impact on other economic factors. The PVV package would actually decrease unemployment. This is mainly achieved by a reduced fiscal burden, allowing for more economic growth than in the baseline.
Most packages would result in lower contract wages. This is due to an increase in unemployment, a slowing down of the economic growth, and, under some of the party packages, to lower prices. In the proposal by the VVD in particular, and to a lesser extent also in those by the CDA and D66, this effect is amplified by a lower replacement rate (the
disposable income ratio between the working population and social benefit recipients). Increases in fiscal burden in a few party manifestos will drive up wages as well as prices. This is particularly the case for GroenLinks. The labour-income quote decreases the most under the VVD proposal, due to lower contract wages. Conversely, under the SP and GroenLinks, this quote rises due to higher wages.
The current account balance further increases for all parties. A key explanation for this increase is the higher export balance, sometimes due to more exports based on improving the competitive position, and sometimes due to less imports based on a lower GDP. Furthermore, in particular PVV, DPK and VVD decrease the budget spent on international development aid. This also increases the current account balance.
Balance of Payment
2.3
General government deficit and general government debt
Because of the impact of the packages on the economy, the EMU balance improvement in 2017 will be lower than the initial impulses (the ex ante amounts in Section 2.1). The effects of the impact on the EMU balance are the positive compensatory effects. Many of the measures proposed by the parties would have negative compensatory effects. Spending cuts, particularly those related to the number of civil servants and employment in health care have relatively large negative compensatory effects. In the first place, income tax would decrease, expenditure on unemployment benefits would increase and household consumption would decrease, in turn reducing VAT revenue. Reduction in international transfer payments (development aid) hardly has any positive compensatory effects. This is based on the assumption that these lower transfer payments have no impact on the domestic economy. The positive compensatory effects vary per measure and may also increase or decrease in the course of time.2
Many of the packages include major shifts between the categories related to expenditure and fiscal burden. As the positive compensatory measures vary per measure, the result of these shifts would not necessarily be a neutral one. For example, decreasing development aid expenditure and increasing civil servant salaries both by one billion euros would have a neutral effect on the ex ante EMU balance, but would have positive compensatory effects. A similar effect may be achieved through changes in fiscal burdens.
The positive compensatory effects of some of the measures may be expected to decrease over time. Some of the effects on unemployment are only temporary, as these result in labour market adjustments. Other measures do have permanent effects, such as a
structurally higher employment and/or lower equilibrium unemployment. Naturally, these effects have been factored into the sustainability analysis.
For most parties, the compensatory effects for 2017 amount to -40% to -55% of the ex ante volume of their packages of measures. This is in keeping with the analysis of the 2013 Budget Agreement. The variation in the compensatory effects is due to, for instance, the extent to which the proposed measures influence employment in the public sector or the expenditure on development aid. The PVV proposal would achieves positive compensatory effects by 2017, as almost half of the ex ante amount consists of spending cuts on
development aid. Furthermore, the PVV shifts the fiscal burden towards taxes with relatively small negative compensatory effects.
2
See CPB memorandum of 31 May 2012 'Further information election manifestos calculation review' (in Dutch) for the analysis of some policy variations with SAFFIER.
15
Improvement in EMU balance
Changes compared to the baseline, 2017, % of GDP
Table 2.6 General government deficit and general government debt by 2017
VVD PvdA PVV CDA SP D66 GL ChrU SGP DPK
EMU balance (% GDP, baseline) -2.6 -2.6 -2.6 -2.6 -2.6 -2.6 -2.6 -2.6 -2.6 -2.6 Ex ante effect of package (% GDP) 2.5 2.4 1.1 2.1 1.6 2.2 2.4 2.2 2.2 1.6 Positive compensatory effects (% GDP) -1.0 -1.3 0.2 -1.0 -0.8 -1.2 -1.4 -1.1 -1.5 -0.7 EMU balance including effect of package
(% GDP) -1.1 -1.5 -1.3 -1.5 -1.8 -1.6 -1.6 -1.5 -1.9 -1.6
EMU debt (% GDP, baseline) 74.1 74.1 74.1 74.1 74.1 74.1 74.1 74.1 74.1 74.1 Effect of package 0.4 0.5 0.6 0.5 -1.4 -0.5 -4.8 -1.6 0.0 0.6 EMU debt including effect of package
(% GDP) 74.5 74.6 74.7 74.6 72.7 73.7 69.4 72.5 74.2 74.7
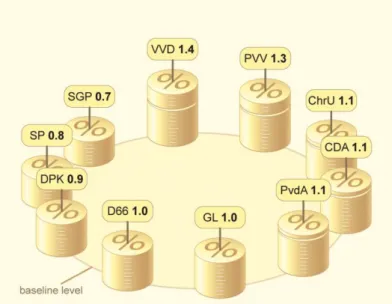
All parties improve the EMU balance by 2017 compared with that in the baseline, but all of them also have a remaining deficit by 2017. The EMU balance ranges from -1.1% GDP for the VVD to -1.9% for the SGP. The EMU balance graphic and figure 2.2 show the development of the EMU balance for the 2013–2017 period. In spite of improving the EMU balance, for a number of party proposals, the debt quota (as a % GDP) is higher than in the baseline. This is due to the denominator effect; for many parties, the nominal GDP turns out lower than in the baseline.
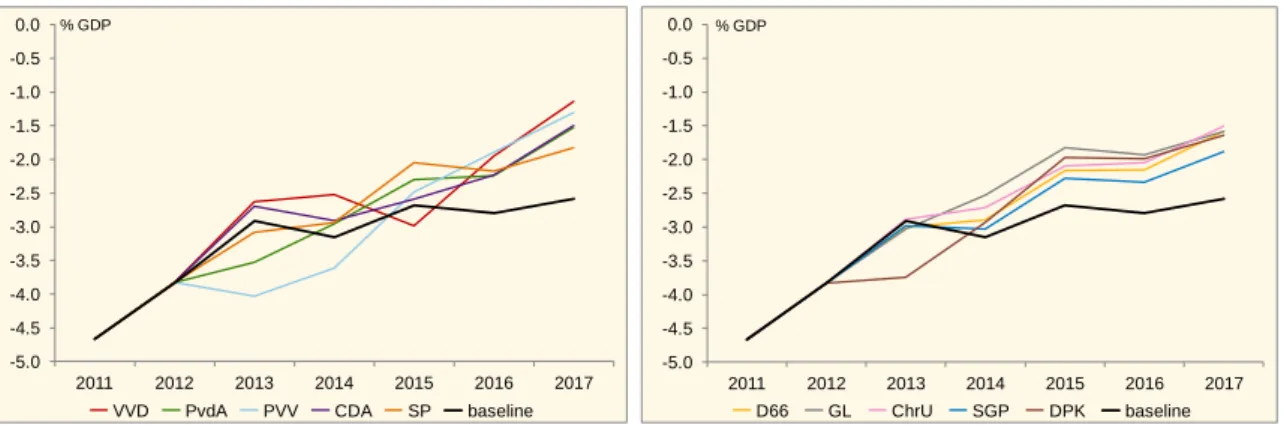
Figure 2.2 EMU balance 2011–2017 (in % GDP)
2.4
Purchasing power effects
The purchasing power figures relate to the income of employees, civil servants, social benefit recipients and pensioners, but not to that of the self-employed or students.
The increase in rents has been factored in as a generic pricing measure. This means that the effects of this measure have not been specified according to income category. Environmental taxes, VAT increases and road pricing affect purchasing power via inflation. The purchasing
power development as a whole is the most favourable for the plans by GroenLinks, the PVV
and SP, and the least favourable for the CDA manifesto (Table 2.7). Purchasing power development for all households is strongly influenced by the development of actual wages. The actual wage development is the most favourable for the SP manifesto with an additional 0.2% per year extra compared with the baseline, followed by the PVV and GroenLinks. The VVD, with -1.1% per year, achieves the largest actual wage deterioration, preceded by the CDA with -1% and D66 with -0.6%. Ultimately, the VVD does achieve a stronger purchasing power than the CDA and D66, because the VVD returns more money to households, in particular through an increase in working tax credit.
Implementation of the VVD proposal would create the largest gap between employees and
social benefit recipients: the latter group would gain 1½% less, per year, in particular due
to the lowering of disability benefits and the linking of income support benefits to inflation rather than to wage development for a number of years. The proposals by three parties would improve purchasing power development for social benefit recipients more than for the working population, namely those by the PvdA, SP and SGP. For the PvdA and SP, this is mainly caused by introducing an income-dependent health care premium. For the SGP, this is due to the capacity tax credit, causing minimum social benefits to rise compared with the situation in the baseline.
-5.0 -4.5 -4.0 -3.5 -3.0 -2.5 -2.0 -1.5 -1.0 -0.5 0.0 2011 2012 2013 2014 2015 2016 2017 % GDP
VVD PvdA PVV CDA SP baseline
-5.0 -4.5 -4.0 -3.5 -3.0 -2.5 -2.0 -1.5 -1.0 -0.5 0.0 2011 2012 2013 2014 2015 2016 2017 % GDP D66 GL ChrU SGP DPK baseline
17
Purchasing power households
Per income group, cumulative changes compared to the baseline, 2017, in % Income categories (% of statutory minimum wage)
The gap between the lowest and highest incomes, taken over all income categories, is the largest for the SP, under which proposal the lowest incomes receive an annual increase that is 1¼% higher than that of the highest incomes. This is mainly due to the strong
redistributing effects of introducing the income-dependent health care premium. Also in the manifestos of the PvdA, GroenLinks and DPK do the lowest incomes increase by more than the highest incomes. The PvdA and GroenLinks also introduce an income-dependent health care premium, but here the redistributing effect is less strong than under the SP proposal. The manifestos of the VVD and CDA present smaller increases for the lowest incomes than for the highest incomes. In the case of the VVD, this is mainly due to the increase in the working tax credit, which benefits only employees, combined with spending cuts that affect social benefit recipients. In the CDA manifesto, the introduction of a flat rate tax with a top rate has a favourable effect on the highest incomes.
In most party proposals, the development of the purchasing power of pensioners lags behind that of employees. For GroenLinks, with ¾%, this gap is the largest, due to the introduction of maximum income limits on the purchasing power supplement for state pensions (MKOB) and for state pension partner allowance. In the D66 and DPK manifestos, the purchasing power of pensioners is on a par with that of employees, while in the PvdA and CDA manifestos, their purchasing power develops more favourably than that of employees. In the case of the PvdA, this is due to an increase in tax credits for senior citizens. In the
CDA's case, the introduction of the flat tax rate with a top rate is more favourable for pensioners, as the MKOB is gradually decreased in the context of flat rate taxation, whereas for employees it is the working tax credit – which is significantly higher – that is gradually decreased.
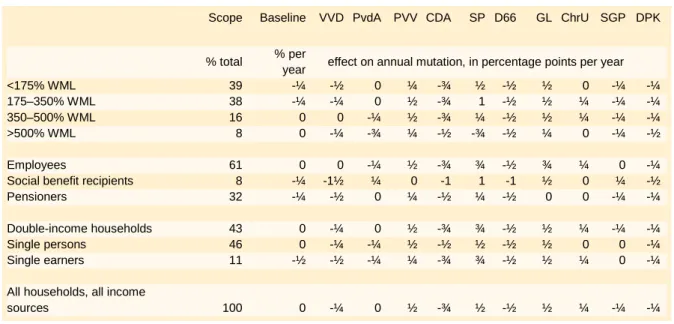
Table 2.7 Ex-post purchasing power, average over the 2013–2017 period
Scope Baseline VVD PvdA PVV CDA SP D66 GL ChrU SGP DPK
% total % per
year effect on annual mutation, in percentage points per year <175% WML 39 -¼ -½ 0 ¼ -¾ ½ -½ ½ 0 -¼ -¼ 175–350% WML 38 -¼ -¼ 0 ½ -¾ 1 -½ ½ ¼ -¼ -¼ 350–500% WML 16 0 0 -¼ ½ -¾ ¼ -½ ½ ¼ -¼ -¼ >500% WML 8 0 -¼ -¾ ¼ -½ -¾ -½ ¼ 0 -¼ -½
Employees 61 0 0 -¼ ½ -¾ ¾ -½ ¾ ¼ 0 -¼ Social benefit recipients 8 -¼ -1½ ¼ 0 -1 1 -1 ½ 0 ¼ -½ Pensioners 32 -¼ -½ 0 ¼ -½ ¼ -½ 0 0 -¼ -¼
Double-income households 43 0 -¼ 0 ½ -¾ ¾ -½ ½ ¼ -¼ -¼ Single persons 46 0 -¼ -¼ ½ -½ ½ -½ ½ 0 0 -¼ Single earners 11 -½ -½ -¼ ¼ -¾ ¾ -½ ½ ¼ 0 -¼
All households, all income
sources 100 0 -¼ 0 ½ -¾ ½ -½ ½ ¼ -¼ -¼
The differences between types of households (double income, single persons and single earners) are limited between the party proposals, with a maximum difference of ¼ % per year. All parties take measures that are relevant to purchasing power, but are not factored into the static purchasing power. For example, some measures do not fit the term static purchasing power, such as increasing the statutory retirement age or limiting the Witteveen framework3. Limiting the Witteveen framework would result in lower pension premiums
(conducive to more purchasing power), but also would mean less pension accrual (ultimately unfavourable to purchasing power). Some measures have not been factored in, because it is not possible to determine which households would benefit and to what extent, or because the relevant group is not included in the purchasing power table, such as the self-employed and the students. Examples include increasing the administrative fees of the Courts and limiting the self-employed tax credit. Limiting the Witteveen framework is generally the largest measure that has not been factored into the static purchasing power figures. For all party proposals, the effect of these missing measures on purchasing power, on balance, will be negative. GroenLinks has the most negative results, followed by the SP and ChristenUnie. The DPK and SGP have the least number of measures that have not been factored into the static purchasing power.
19
2.5
Structural employment effects
The party manifestos have varying impacts on structural employment and
unemployment. Here, 'structural' is defined as 'by 2040'. Most parties would reach
equilibrium unemployment by 2025 (CDA, ChristenUnie, D66, DPK, SP, VVD, SGP and PVV). GroenLinks and the PvdA reach this equilibrium at a slightly later point, because the negative effects of their housing market measures take longer to manifest themselves. The structural employment effects are also achieved by 2025 by the parties that do not plan to adjust the tax deductibility of mortgage rates and the statutory retirement age (CDA, D66 and DPK). Most parties achieve the structural employment effects later due to the time line of the above-mentioned measures.
Structural employment
Changes compared with the baseline, 2040, in percentage points
The party proposals regarding employment protection vary, and therefore, so do the effects of their plans on labour productivity. The CDA, D66, SGP and GroenLinks do not intend to take any measures that would lead to changes in employment protection,
compared to the baseline. The PVV, SP and DPK raise the level of employment protection for employees under permanent contract.
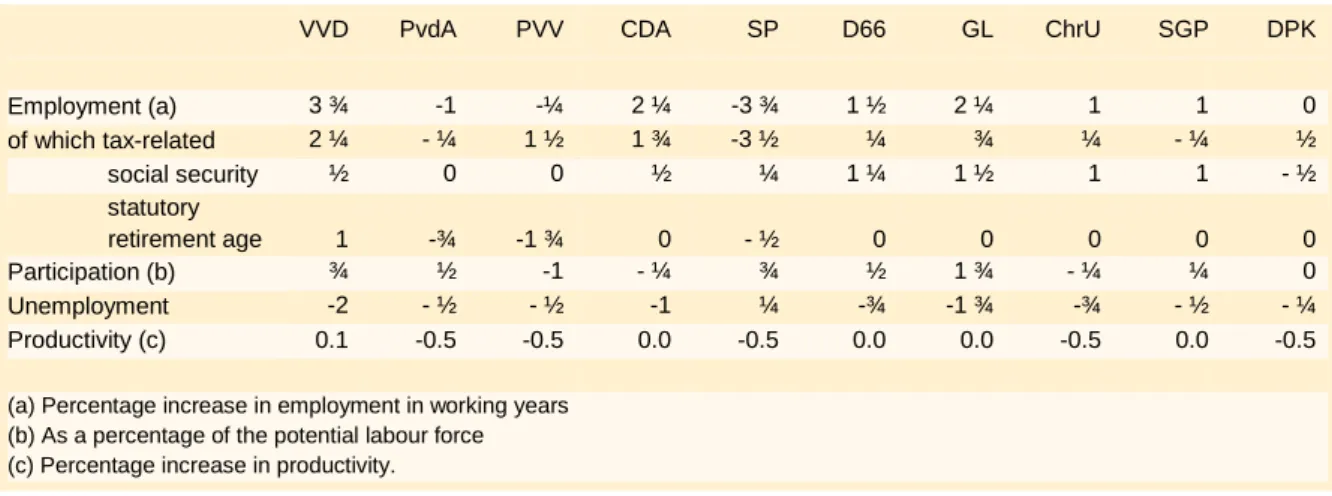
Table 2.8 Overview of the labour market
VVD PvdA PVV CDA SP D66 GL ChrU SGP DPK
Employment (a) 3 ¾ -1 -¼ 2 ¼ -3 ¾ 1 ½ 2 ¼ 1 1 0 of which tax-related 2 ¼ - ¼ 1 ½ 1 ¾ -3 ½ ¼ ¾ ¼ - ¼ ½ social security ½ 0 0 ½ ¼ 1 ¼ 1 ½ 1 1 - ½ statutory retirement age 1 -¾ -1 ¾ 0 - ½ 0 0 0 0 0 Participation (b) ¾ ½ -1 - ¼ ¾ ½ 1 ¾ - ¼ ¼ 0 Unemployment -2 - ½ - ½ -1 ¼ -¾ -1 ¾ -¾ - ½ - ¼ Productivity (c) 0.1 -0.5 -0.5 0.0 -0.5 0.0 0.0 -0.5 0.0 -0.5
(a) Percentage increase in employment in working years (b) As a percentage of the potential labour force (c) Percentage increase in productivity.
This is achieved by fully reversing the adjustments to the redundancy system in the baseline. It will be more difficult for employers to dismiss employees who have been with the
company for a long time, and companies therefore are expected to be reluctant to hire staff. This reduces mobility and labour market flow, and hinders the optimum match between people and jobs. Ultimately, this would have a negative effect on productivity (see the 'productivity' row in Table 2.8). The measures proposed by the VVD are focused on further relaxing of the redundancy system, which would lead to slightly higher productivity. The ChristenUnie introduces a longer notice period. During this notice period, both employer and employee must make an effort to find alternative employment for the employee. This
proposal increases the employment protection level for permanent contracts compared with the baseline. The PvdA opts for a single redundancy route with a preventative audit by a committee of employees and employers. Each employee would be entitled to severance pay upon redundancy. This severance pay is maximised. This proposal also increases the employment protection level for permanent contracts compared with the baseline.
The measures that parties propose regarding social security affect employment and
unemployment (see the 'social security' and 'unemployment' rows in Table 2.8). The VVD,
CDA, D66, GroenLinks and SGP limit the maximum duration of the unemployment benefit. This limitation would be an incentive for the unemployed to find a job quicker, and to more often accept a less attractive job. Furthermore, the limitation has a depressing effect on wages, as it deteriorates the position of employees in negotiations. This measure will decrease unemployment and increase employment. In the PvdA proposal, employers are financially responsible for the first six months of the unemployment benefit. This is a form of partial premium differentiation. In this way, employers would be more aware of the social costs they cause when staff is made redundant, which in turn would lead to lower
unemployment. The VVD and ChristenUnie lower accrual of the unemployment benefit to 0.5 and 0.75 months, respectively, per year of employment, decreasing the unemployment benefit volume.
All parties, except for the SP, limit inflow into Wajong (young disabled persons regulation) to fully and permanently disabled young people. This means more people will stay in the labour process, leading to more employment. Many parties, with the exception of the PVV, SP
21
and GroenLinks, limit the inflow into the WSW (the Dutch sheltered employment act). Limitation of the WSW would cause a certain share of persons involved to withdraw from the labour market, thus decreasing employment. The extent to which this happens, varies between party manifestos. In proposals by the PvdA, D66 and SGP, social work places and protected employment will be continued. The PvdA, SP, D66 and GroenLinks introduce quota for companies for the number of persons with an occupational handicap that they must employ. This measure would stimulate employment for the occupationally handicapped. However, it would also create higher costs for companies, which means fewer jobs would be created. This in turn would in fact decrease employment among the non-occupationally handicapped labour force. The CDA would introduce such a quota only for the public sector. Policies regarding the Wajong, WSW and quota for the occupationally handicapped leads to either the creation or removal of jobs with a lower productivity than that of the average employee. In part, this is due to the fact that the employees involved are less productive, but also because the construction of protected employment compromises effectiveness. Changes to employment that involve such measures, therefore, are a very minor factor in the long-term sustainability of public finance.
Various parties propose measures that affect the amount paid in social benefits. The VVD, CDA, SGP and DPK link benefits temporarily to the wages in the public sector. This means lowering the benefits, which is a financial incentive for social benefit recipients to accept a job. This measure will decrease unemployment and increase employment (in Table 2.8 this is listed in the 'tax-related' and 'unemployment' rows). The baseline implies a decrease in the social minimum due to gradual decrease in double tax credits. GroenLinks postpones a short-term decrease, but aligns with the baseline in the long short-term. The SP does not fully decrease the double tax credit, thus causing an increase in the social minimum. This measure will increase unemployment and decrease employment.
With the exception of the ChristenUnie, all parties take measures to adjust the statutory
retirement age. The manifestos differ in the moment at which the adjusted statutory
retirement age would become effective, but for the structural effect on employment, only the long-term effect is relevant (see the 'Statutory retirement age' row in Table 2.8). By 2040, the statutory retirement age will be in accordance with the 2013 Budget Agreement for eight of the ten parties, which means it will be set at the age of 68 years and 6 months. The VVD, however, raises the statutory retirement age to 69 years and 9 months, by 2040. The PVV lowers the statutory retirement age to 65. The PvdA allows people flexibility in choosing the age at which they retire. On average, this would cause employees to make use of their state pension at an younger age, thus decreasing employment. Furthermore, the SP in particular introduces a flanking policy which results in a decrease in employment. The CDA, D66 and GroenLinks also introduce flanking policies; however, this would have only a minor effect on employment and unemployment.
All parties propose measures relating to taxes and income-dependent regulations. Through changes to the average and marginal burden on labour, these affect employment (see the 'tax-related' row in Table 2.8). The PvdA, SP and GroenLinks decrease the nominal health care premium. This is financed by abolishing the health care allowance and the
introduction of an income-dependent health care premium for incomes from the statutory minimum wage level (WML) onwards. On balance, this increases the marginal burden, resulting in lower employment. The VVD, PvdA, GroenLinks, D66, ChristenUnie and SGP all lower the income tax rates, whereas the CDA proposes a flat rate tax. Many parties (VVD, PvdA, PVV, SP, D66, GroenLinks and ChristenUnie) increase the working tax credit. GroenLinks increases the income-dependency for the working tax credit. This would stimulate the labour supply in number of persons, while decreasing unemployment. By reversing the freeze on income levels in the tax brackets, this also applies to the PVV proposal. Moreover, the PvdA, D66, GroenLinks, ChristenUnie and SGP propose changes to the tax rates and the working tax credit to compensate the limitation of the tax deductibility of mortgage interest. Although the SP also limits the mortgage interest deductibility and increases the working tax credit, it also raises tax rates. Furthermore, the ChristenUnie and SGP base the tax system more on households, increasing child allowance and the child-related budget. The latter of the two measures increases the tax burden on the second earner in a household. This causes labour supply and employment to decrease.
Various parties propose measures relating to VAT and environmental tax, resulting in a higher or lower fiscal burden on companies or families (see 'tax-related' row in Table 2.8). The PvdA, PVV, SP and DPK intend to lower VAT rates. The resulting decrease in fiscal burden leads to more employment. D66, GroenLinks and the ChristenUnie make an upward adjustment to tax rates and environmental tax, with higher fiscal burden and less
employment as a result. The PvdA, D66, GroenLinks and ChristenUnie decrease the fiscal burden on employers by lowering the unemployment premiums. Finally, the SP, PVV, PvdA and GroenLinks raise taxation on banks. The SP, PVV and GroenLinks also limit deductibility of participation interest in the company tax, with the SP also raising the company tax rate to 30%. The increase in company tax and bank tax lead to a higher fiscal burden on companies with a resulting downward effect on employment.
2.6
Sustainability of public finance
With the aging of the population, the tax and premium revenues decrease, while expenditure on health care and social security increases. The difference between government revenue and general government spending over a long time horizon is known as the sustainability of public finance. If current policies remain unchanged, the sustainability gap will amount to 7 billion euros. All parties propose measures for both short- and long-term improvement in the government budget. The CDA, D66, ChristenUnie, VVD and GroenLinks focus on improving sustainability by more than 20 billion euros, while the PVV would achieve less than 7 billion euros.
With the exception of the PVV, all parties achieve a positive the sustainability balance by 2017. This means that they intend to earmark funds to finance future decreases in fiscal burden or for increases in expenditure, for example on health care. The CDA proposal is the most extensive in this respect. As indicated in Chapter 1, the sustainability calculation
23
plus the increase in costs due to the aging of the population. During the past few years, the actual increase in health care was well above that figure, and when leaving the policy unchanged, health care costs will continue to grow significantly in the future.
The improvement in sustainability is achieved in widely varying ways by the parties. The primary factor in sustainability is improving the EMU balance by 2017. Most spending cuts that will be implemented by 2017 will also in the long term lead to lower general
government costs. The same applies to measures related to expenditure and taxation as well as to revenue from premiums. All parties focus on improving the EMU balance by 2017.
Improvement in sustainability
Changes compared to the baseline, 2017, % of GDP
The change in structural employment would result in either a large positive or negative compensatory effect on sustainability. An increase in employment, such as achieved by the VVD, CDA, D66, ChristenUnie, GroenLinks, SGP and DPK, would generate additional tax revenue and achieve lower expenditure on social security, thus resulting in improved sustainability. The reverse, of course, is also true. For the packages of measures proposed by the SP, PvdA and PVV, the decrease in employment would result in a larger sustainability deficit.
A number of measures improve sustainability by means of spending cuts on the future increase in expenses that is related to the aging population. In particular, this concerns pensions (including state pensions) and health care. The VVD and D66 focus on further reduction in the AOW state pension. This is achieve by the VVD by a further increase in the statutory retirement age to 69¾ years old by 2040, and for D66 by a decrease in the AOW state pension itself. In contrast, other parties soften the intended raise of the statutory retirement age. The PvdA wants flexibility in retirement age. The SP proposes more
in the statutory retirement age. The PVV is the only party aiming to return to the statutory retirement age of 65.
Some parties limit the tax benefits for supplementary pensions. GroenLinks and the SP aim to limit deductibility to an income of approximately 50,000 euros (one and half times the average income). D66, the PVV and ChristenUnie also limit deductibility, but set a higher income limit. Another way to limit deductibility would be via the rate at which pension premiums can be deducted. The SP and PvdA aim to maximise this rate at 42%.
The elderly make more use of health care than younger generations; thus, the aging of the population will lead to an increase in health care expenses. Conversely, spending cuts in health care not only would lead to an improvement in the EMU balance by 2017, but long-term cost saving would also be about one and a half times greater. All parties cut back on health care, but to widely varying extents and in different manners (see Section 2.8 for an extensive explanation). Spending cut proposed by the VVD amount to 8 billion euros, with a focus on long-term health care. Health care is spared from spending cuts as much as possible by the SP, DPK and PVV.
Also regarding other measures, the effects on public finance are particularly noticeable in the long term. This applies, for example, to measures regarding the housing market. GroenLinks, the PvdA, SP, SGP, ChristenUnie and D66 propose supplementary limitation on the tax deductibility of mortgage interest. In contrast, the PVV plans to reverse the intended limitation on mortgage interest deduction. For a number of measures in the field of social security (e.g. Work and Income Based on Capacity to Work Act (WIA)), the environment (MAUT road tax and the sustainable energy incentive, SDE+), and education (social lending system), the structural yield also would exceed the 2017 yield. In contrast, reducing the salaries of civil servants only would have a short-term rather than long-term impact. This applies to the additional reduction planned for 2014 (by the VVD, ChristenUnie, SGP and DPK) as well as to a reversal of the 2013 reduction (by the PvdA and SP).
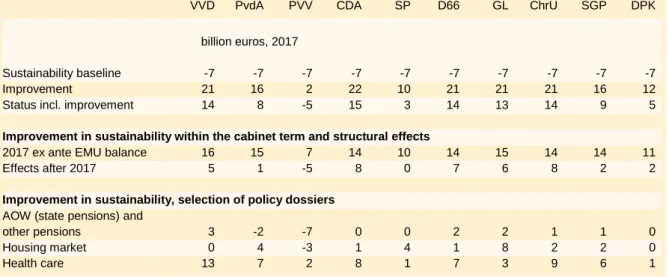
Table 2.9 Sustainability
VVD PvdA PVV CDA SP D66 GL ChrU SGP DPK
billion euros, 2017
Sustainability baseline -7 -7 -7 -7 -7 -7 -7 -7 -7 -7 Improvement 21 16 2 22 10 21 21 21 16 12 Status incl. improvement 14 8 -5 15 3 14 13 14 9 5
Improvement in sustainability within the cabinet term and structural effects
2017 ex ante EMU balance 16 15 7 14 10 14 15 14 14 11 Effects after 2017 5 1 -5 8 0 7 6 8 2 2
Improvement in sustainability, selection of policy dossiers
AOW (state pensions) and
other pensions 3 -2 -7 0 0 2 2 1 1 0 Housing market 0 4 -3 1 4 1 8 2 2 0
25
Sustainability would improve the most following the proposals by the CDA, ChristenUnie, D66, VVD and GroenLinks. The CDA and VVD significantly improve the 2017 EMU balance, with severe spending cuts in health care, and by achieving an increase in employment. The ChristenUnie and D66 both achieve most of their sustainability gains through measures in social security and health care. GroenLinks focuses strongly on measures regarding the housing market, the environment and social security, but uses a large part of the resulting revenue for lowering income tax. The PvdA and SGP achieve their sustainability gains as early as in 2017, cut back on health care but spare AOW state pensions (PvdA) or increase the working tax discount (SGP). The DPK achieves structural gains via the above-mentioned WIA Act. In the SP package of measures, the sustainability gain equals the improvement in the EMU balance by 2017. The PVV achieves the lowest sustainability gain, in particular by reversing both the statutory retirement age and housing market measures in the baseline.
2.7
Energy and climate
Renewable energy
All parties – with the exception of the PVV and DPK – choose to increase spending in the policy focused on increasing the share of renewable energy (Table 2.10). The largest increase in renewable energy would be achieved with the packages of the PvdA and GroenLinks, followed by the ChristenUnie and D66 .
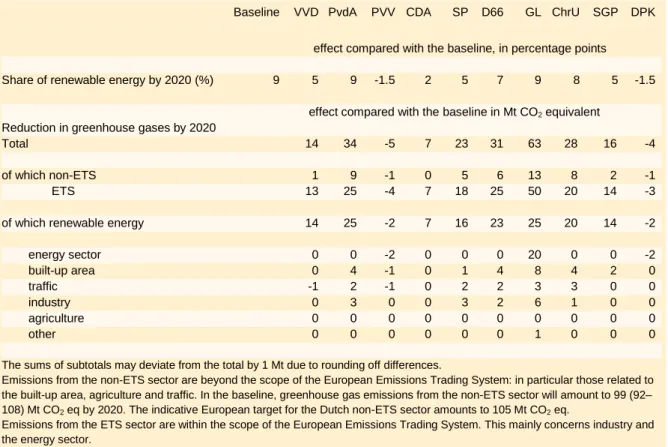
Table 2.10 Renewable energy and greenhouse gas reduction
Baseline VVD PvdA PVV CDA SP D66 GL ChrU SGP DPK
effect compared with the baseline, in percentage points
Share of renewable energy by 2020 (%) 9 5 9 -1.5 2 5 7 9 8 5 -1.5
effect compared with the baseline in Mt CO2 equivalent
Reduction in greenhouse gases by 2020
Total 14 34 -5 7 23 31 63 28 16 -4
of which non-ETS 1 9 -1 0 5 6 13 8 2 -1 ETS 13 25 -4 7 18 25 50 20 14 -3
of which renewable energy 14 25 -2 7 16 23 25 20 14 -2
energy sector 0 0 -2 0 0 0 20 0 0 -2 built-up area 0 4 -1 0 1 4 8 4 2 0 traffic -1 2 -1 0 2 2 3 3 0 0 industry 0 3 0 0 3 2 6 1 0 0 agriculture 0 0 0 0 0 0 0 0 0 0 other 0 0 0 0 0 0 1 0 0 0
The sums of subtotals may deviate from the total by 1 Mt due to rounding off differences.
Emissions from the non-ETS sector are beyond the scope of the European Emissions Trading System: in particular those related to the built-up area, agriculture and traffic. In the baseline, greenhouse gas emissions from the non-ETS sector will amount to 99 (92– 108) Mt CO2 eq by 2020. The indicative European target for the Dutch non-ETS sector amounts to 105 Mt CO2 eq.
Emissions from the ETS sector are within the scope of the European Emissions Trading System. This mainly concerns industry and the energy sector.
The packages of measures proposed by these parties would more than achieve the EU target of 14% by 2020. The packages of the VVD, SP and SGP would be sufficient to achieve the EU target, but those of the PVV, CDA and DPK would not. For the PVV and DPK, the share of renewable would decrease because these parties do not leave the subsidy scheme SDE+ (Sustainable Energy Incentive) open to new projects.
The CDA, SP, D66 and ChristenUnie aim to increase renewable energy by extending the current SDE+. The VVD, PvdA, GroenLinks and SGP choose to impose smart obligations to energy suppliers or providers to prevent windfall profits.
All parties, except the PVV and DPK, allocate more space to land-based wind-farms – one of the cheaper options – thus increasing capacity to 6,000 MW by 2020. The biomass share in coal-fired power plants increases for all parties, except the PVV and DKP. By 2020, for the SGP, this percentage will increase to 10%; for the VVD, CDA, SP and ChristenUnie to 20%; and for the PvdA, D66 and GroenLinks to 30%. In addition, the PvdA, CDA, SP, D66,
GroenLinks and SGP intend to introduce more extensive options for exemption on energy tax on solar energy generated by private citizens. Furthermore, for the PvdA, GroenLinks and ChristenUnie, the share of bio fuel in both petrol and diesel will increase from 10% to 14% by 2020. The greenhouse gas reductions resulting from this measure would lead to a larger reduction in the Netherlands than would be the case at a global level. This is due to the fact that greenhouse gas emissions from bio fuel production are released elsewhere in the world.
Greenhouse gases
The measures proposed by the VVD, PvdA, CDA, SP, D66, GroenLinks, ChristenUnie and SGP would reduce greenhouse gas emission levels. The largest reduction would be achieved with the GroenLinks package. The PVV and DPK packages of measures, on the other hand, would lead to increased greenhouse gas emission levels.
For the parties that would realising emission reductions, this is mainly achieved by the increase in renewable energy, which forces down the use of fossil energy. In addition, GroenLinks plans to introduce a tax on the use of coal that is so high that power production in coal-fired power plants is ceased. This would lead to a 20 Mt reduction in greenhouse gas emissions from the energy sector.
For all parties, the largest emission effects would occur in the ETS sectors (the sectors within the scope of the European trading system for greenhouse gas emission rights: power plants, refineries and most of the industrial sector). This would mainly be due to the increase in renewable energy, and would not alter the total EU emissions from ETS companies.
GroenLinks, the ChristenUnie, PvdA, SP and D66 also achieve significant emission reductions in the non-ETS sectors (more than 5 Mt). These reductions mainly result from energy saving measures in the built-up area and traffic-related measures, including road pricing. Also in the non-ETS sector, the largest reductions would be achieved by GroenLinks.
27
Renewable energy
Changes compared to the baseline, 2020, in percentage points
The extent to which the packages of measures lead to changes in expenditure ranges from -2.3 billion euros (PVV) to 5.4 billion euros (ChristenUnie) (see Table 2.11). For the
ChristenUnie, GroenLinks, SP and D66, the number of tax increases are the main cause of the increase in fiscal burden. In addition, the PvdA, SP, D66, GroenLinks and ChristenUnie link taxes on traffic and transport to the number of kilometres driven.
Table 2.11 Extent of the package of measures related to energy and climate (2020)
VVD PvdA PVV CDA SP D66 GL ChrU SGP DPK
effect compared to the baseline, in billion euros
Total 0.3 2.4 -2.3 0.5 3.6 3.6 5.2 5.4 1.2 -1.7 of which taxes -0.5 -0.1 -0.8 0.0 2.6 2.1 2.4 3.4 0.3 -1.0
Amounts exclude traffic and transport taxes
2.8
Health care
With health care, the analysis had to be limited to the budgetary effects of the proposed measures, namely the costs. The benefits of health care – the effects of the measures on people's health – remain completely out of the picture. The reason for this is that it is very difficult, if not impossible, to quantify the effects on health in a responsible manner.