Anna van Buerenplein 1 2595 DA Den Haag P.O. Box 96800 2509 JE The Hague The Netherlands www.tno.nl T +31 88 866 00 00 TNO report TNO 2018 R10919v2
Inputs and considerations for estimating large
scale uptake of electric vehicles in the Dutch
passenger car fleet up to 2030
Date 31 August 2018
Author(s) René van Gijlswijk, Emiel van Eijk, Elisah van Kempen, Norbert Ligterink, Evie Cox
Copy no 2018-STL-RAP-100316311v2 Number of pages 61
Number of appendices 1
Sponsor Planbureau voor de Leefomgeving Bezuidenhoutseweg 30
2594 AV DEN HAAG
Project name Ontwikkelingen praktijkverbruik en samenstelling personenwagenpark
Project number 060.35097
All rights reserved.
No part of this publication may be reproduced and/or published by print, photoprint, microfilm or any other means without the previous written consent of TNO.
In case this report was drafted on instructions, the rights and obligations of contracting parties are subject to either the General Terms and Conditions for commissions to TNO, or the relevant agreement concluded between the contracting parties. Submitting the report for inspection to parties who have a direct interest is permitted.
Samenvatting
Het Planbureau voor de Leefomgeving (PBL) heeft de taak om de effecten van het Nationale Klimaatakkoord te evalueren. Een belangrijk deel van de
CO2-reducerende maatregelen heeft betrekking op de verduurzaming van het
personenwagenpark. Het zuiniger maken van auto’s met verbrandingsmotor en de ingroei van nulemissievoertuigen, waaronder batterij-elektrische voertuigen, zouden in 2030 tot een vermindering van de (directe) CO2-emissie moeten leiden.
Een snelle ingroei van elektrische voertuigen zal niet vanzelf gaan, maar wordt in vele bronnen wel min of meer als een gegeven beschouwd. In dit rapport is zoveel mogelijk op basis van feiten nagegaan wat de randvoorwaarden zijn voor
grootschalige uitrol van elektrische voertuigen (EV’s), en is een bandbreedte berekend waarbinnen de grootte van de Nederlandse EV-vloot waarschijnlijk zal liggen in 2030. Dit kan als basis dienen voor schattingen of scenarioanalyses waarin het effect van CO2-reducerende beleidsmaatregelen wordt beoordeeld.
Wagenpark
De aanschaf van personenauto’s wordt voor meer dan de helft gedaan door zakelijke klanten: leasemaatschappijen, bedrijven. Hierbij is ook private lease meegeteld. De meeste van deze auto’s komen na enkele jaren op de
tweedehandsmarkt. Er is een flinke mismatch tussen het aanbod van deze gemiddeld wat grotere voertuigen, veelal met een dieselmotor, en de vraag van particulieren naar kleinere benzinevoertuigen die een niet te hoge aanschafprijs hebben. Daarom worden op grote schaal auto’s geëxporteerd en geïmporteerd. Als geen aanvullende maatregelen worden genomen, zullen mogelijk veel EV’s, die vooralsnog in de hogere segmenten vallen, worden geëxporteerd bij gebrek aan vraag.
De jaarkilometrages variëren sterk van voertuig tot voertuig, verder wordt met zakelijke auto’s gemiddeld meer gereden. De meeste EV’s worden zakelijk gekocht, en hiermee worden op dit moment significant minder kilometers gemaakt dan met zakelijke auto’s op benzine of diesel, behalve in het E-segment (Tesla). Kennelijk worden vooral voertuigen vervangen die weinig kilometers maken. Dat heeft invloed op de CO2-winst van de vervanging.
Een analyse van de restwaardeontwikkeling van elektrische voertuigen leert dat kleine en middelgrote EV’s sneller in waarde dalen dan vergelijkbare
benzinevoertuigen, en grote EV’s langzamer, uitgedrukt in procenten van de nieuwprijs, met correctie voor de kilometerstand. Dat kan te maken hebben met de bruikbaarheid tweedehands; grote EV’s hebben meestal meer actieradius. Door de snelle ontwikkelingen in nieuwe EV’s zal de bruikbaarheid van
tweedehands voertuigen over een aantal jaar ook toenemen, waardoor mogelijk de restwaarde stabieler zal blijven.
Dit rapport bevat feitelijke achtergrondinformatie en inzichten over
randvoorwaarden voor de grootschalige uitrol van elektrische voertuigen. Het dient als input voor een door PBL te maken schatting van de ontwikkeling van het elektrische wagenpark in Nederland tot 2030.
De autonome vervanging van conventionele auto’s door elektrische voertuigen gaat zelfs met een hoog marktaandeel niet snel. De gemiddelde levensduur van
personenauto’s is 18 jaar. Het is goed om te benadrukken dat ongeveer een derde van de voertuigen die in 2030 rondrijdt, al verkocht is, hier of in het buitenland.
Ontwikkelingen in de wereld en Europa
Kijkend naar de wereldmarkt, valt op dat in de top 10 landen waar de meeste EV’s verkocht worden, stimuleringsmaatregelen van kracht zijn. China dwingt zelfs een percentage elektrische voertuigen af bij fabrikanten. In totaal rijden er wereldwijd ca. 3 miljoen EV’s rond, waarvan ruim 800.000 in Europa (2017).
Qua laadinfrastructuur zijn we in Nederland ver: er is een publiek laadpunt voor elke 3 EV’s, veel meer dan in andere landen.
De accuproductie zou een limiterende factor kunnen vormen: de kobaltwinning moet vertienvoudigen in 2030 om aan de (geprojecteerde) wereldvraag van accu’s te kunnen voldoen. Dat geldt ook voor de batterijproductie zelf. Gezien de aangekondigde accufabrieken in China zal de productiecapaciteit in enkele jaren verdubbelen.
Beleid
De invloed van CO2-beleid op Europees niveau is veelvormig. Vanuit fabrikanten
geredeneerd kan de norm, die nog niet definitief is, gehaald worden met een mix van batterij-elektrische auto’s, plug-in hybrides en conventionele voertuigen die zuiniger zijn gemaakt. De reductiewaarden waarover gesproken wordt variëren tussen 30% (het voorstel van de Europese Commissie) en 50% (standpunt van de ENVI-commissie van het Europees Parlement) ten opzichte van 2021. 30% kan misschien gehaald worden louter door conventionele auto’s zuiniger te maken. Analyses duiden erop dat dit tegen geringe meerkosten kan die binnen ongeveer 5 jaar worden terugverdiend door de bespaarde brandstofkosten. Voor verdere reductie zijn wel elektrische voertuigen nodig. In elk geval zal een deel van de norm gehaald worden door reductie van de uitstoot van het niet-elektrische deel van de vloot. Voor de grootste effectiviteit is het belangrijk om verbeteringen aan
conventionele voertuigen onderdeel te laten zijn van beleid op het gebied van CO2-reductie van personenauto’s.
De reductie-eisen gelden ten opzichte van het gemiddelde op de WLTP-testcyclus in 2021. Dat betekent dat des te hoger de WLTP-waarde op dat peilmoment, des te hoger de normwaardes zullen zijn. In dit systeem zit een motivatie om de declared WLTP-waarden zo hoog mogelijk te zetten. Of hierop wordt ingezet, en zo ja in welke mate, zal pas later zichtbaar worden.
Wat verder nog speelt, is dat er een groot verschil is tussen normverbruik en praktijkverbruik, en dus ook tussen CO2-uitstoot volgens de test en in de praktijk.
Dit verschil groeide van jaar tot jaar, maar is wel gestabiliseerd de laatste jaren. Het moet worden bezien of verdere verbeteringen aan auto’s in de praktijk evenveel reductie geven als in de folder. De afstand tussen norm en praktijk is bij plug-in hybrides nog een stuk groter, waardoor ze in de praktijk nauwelijks minder CO2
uitstoten dan een vergelijkbare diesel. Door de lage normuitstoot kunnen plug-ins wel op papier bijdragen aan de CO2-reductie: ongeveer de helft van dat van een
Nederland is niet het enige land dat stimuleringsbeleid voor zuinige voertuigen en nulemissievoertuigen voorbereidt als onderdeel van hun bijdrage aan het
Parijsakkoord. Daardoor kan de beschikbaarheid van elektrische auto’s onder druk komen te staan.
Randvoorwaarden
Als alleen rationele argumenten meetellen, zullen bedrijven de aankoopbeslissing voor EV’s waarschijnlijk nemen op basis van gebruikskosten (TCO) per kilometer over een periode van enkele jaren. Particulieren die zelf nieuw kopen zullen voornamelijk letten op de aanschafprijs. Elektrische voertuigen hebben op dit moment hogere aanschafprijzen maar lagere gebruikskosten. Dat betekent dat een langere horizon de kostenberekening gunstiger uit laat vallen voor een EV. Voor hogere jaarkilometrages geldt dat ook. Verder geldt dat bij grote auto’s met een hoger brandstofverbruik de extra aanschafkosten eerder zijn terugverdiend. Grootschalige marktintroductie zal beginnen bij grote zakelijke auto’s, vervolgen met kleinere zakelijke auto’s, grote privaat aangeschafte auto’s, en tot slot kleinere privé-auto’s. Naast aanschafprijs en gebruikskosten (mede bepaald door de prijs van elektriciteit) speelt ook de beschikbaarheid van laadinfrastructuur een rol.
Optimistische en pessimistische scenario’s voor ingroei elektrische voertuigen
Op basis van de totale gebruikskosten is voor zakelijk en privé, voor vijf marktsegmenten en voor vier jaarkilometrage-groepen van ieder 25% van de rijders in een marktsegment bepaald op welk moment een EV voor deze groep aantrekkelijk wordt qua gebruikskosten over 4 jaar. Er wordt ervan uitgegaan dat alle EV’s in de vloot blijven: geen export, geen sloop.
De verkoopcurve zou er dan, zonder extra beleid, met maximale beschikbaarheid van voertuigen, zo uitzien:
Dat betekent dat in 2030 bij geen nieuw beleid in het gunstigste geval zo’n 65% van de nieuwverkopen EV’s zijn. Opgeteld over de jaren 2018-2030 zouden er dan in 2030 maximaal ca. 2,8 miljoen EV’s rond zouden kunnen rijden. Het grootste deel is zakelijk, en valt in het C- en D-segment.
Voor kleine auto’s valt de rekensom niet snel gunstig uit, ook al omdat er gemiddeld relatief weinig kilometers mee gemaakt worden.
Overigens zijn plug-in hybrides niet meegenomen in deze berekening. In het algemeen maken de hogere kilometerkosten plug-ins minder gunstig dan batterij-elektrische voertuigen, en zal de rol ervan beperkt blijven bij ongewijzigd beleid. Er liggen flink wat aannames onder de curve van het berekende maximale marktaandeel. Omdat de TCO’s van EV’s en conventionele auto’s vaak slechts enkele centen per km uit elkaar liggen, is de gevoeligheid voor een aantal
aannames groot. Deze aannames zijn de prijsontwikkeling van EV’s, de vraag of de prijsdaling van accu’s ten goede komt aan de accugrootte of aan een lagere aanschafprijs, de elektriciteitsprijs en de brandstofprijs. Bijvoorbeeld, indien er niet vanuit wordt gegaan dat iedereen tegen thuistarief kan laden, maar alleen aan een publieke laadpaal, zakt het marktaandeel van 65% naar 57% in 2030.
Een conservatievere variant is berekend waarbij: 1) particulieren wachten met aanschaf tot de aanschafprijs van een EV lager is (in plaats van de TCO), en 2) zakelijk beslissers pas EV’s aanschaffen bij een 10% lagere TCO, en particulieren pas EV’s aanschaffen bij een 10% lagere aanschafprijs. Bij deze variant is het verkoopaandeel 41% in 2030, en het geschatte aantal EV’s in 2030 onder de anderhalf miljoen.
Voor een 30%-reductiedoelstelling in 2030 hebben fabrikanten waarschijnlijk geen nulemissievoertuigen of plug-in hybrides nodig. Indien we ervan uitgaan dat zij kiezen voor het verder benutten van al gedane investeringen in conventionele technologie, ervan uitgaan dat de huidige verkopen van EV’s gedreven zijn door stimuleringsmaatregelen, en ervan uitgaan dat deze verdwijnen na 2021, dan kan de aanwas van de EV-vloot in Nederland stagneren.
Scenarioanalyse met verschillende beleidsmatige stimuleringsmaatregelen kan uitwijzen welk effect kan worden bereikt met welke middelen. Het meeste potentieel zal liggen in het voorkomen van export door een betere match tussen zakelijke nieuwverkoop en privé-tweedehandsaanschaf, het stimuleren van lange-termijngedrag bij particulieren, verlagen van de financieringsdrempel, en het overbruggen van een klein kostenverschil voor een grote groep middelgrote voertuigen. Gezien de naar elkaar toe bewegende gebruikskosten van EV’s en conventionele auto’s, de verschillende groottes van de marktsegmenten en de jaarkilometrageverdeling van de personenautovloot, is het voor het bereiken van een groot vlootaandeel EV’s belangrijk om het moment van stimuleren zo te kiezen dat een grote groep met een relatief kleine investering enkele jaren eerder over de streep getrokken kan worden.
Contents
Samenvatting ... 2
1 Introduction ... 8
2 Historical fleet development ... 10
2.1 Introduction ... 10
2.2 Market segmentation ... 10
2.3 Business cars and private cars ... 10
2.4 Import and export ... 12
2.5 Annual mileages and vehicle use ... 16
2.6 Vehicle lifespan and turn-over rates ... 19
2.7 EV catalogue price... 20
2.8 Second hand electric vehicles ... 22
3 International state-of-play ... 25
3.1 World market ... 25
3.2 European market ... 26
3.3 Announced electric vehicle models ... 30
3.4 International studies... 31
3.5 Manufacturing capacities ... 33
4 European CO2 policies and the influence on the fleet composition ... 36
4.1 Introduction ... 36
4.2 ICE technology developments and the ‘gap’ ... 36
4.3 Transition to WLTP and the CO2 targets ... 39
4.4 Impact of 30% or 40% reduction target on European EV sales ... 39
4.5 Possible role of PHEV ... 41
4.6 Pull on BEV’s for air-quality and national targets from Paris Agreement ... 42
4.7 Conclusions: contribution of BEV and PHEV to meet CO2 targets ... 43
5 Necessary requirements for EV uptake... 44
5.1 Introduction ... 44
5.2 Purchase costs and total cost of ownership ... 44
5.3 Electric vehicles in Dutch usage ... 45
5.4 Charging infrastructure and network capacity ... 46
5.5 Tax effects ... 47
5.6 Other considerations: pushing, not pulling ... 48
6 Estimate of upper and lower bounds of EV influx based on mileage, segmentation and TCO ... 50
6.1 Dutch influx of EV according segmentation and ownership ... 50
6.2 Inputs ... 51
6.3 Limitations ... 52
6.4 TCO “tipping point” per segment: no-policy upper boundary ... 52
6.5 TCO “tipping point” per segment: sensitivity analysis ... 53
6.6 Conclusions ... 55
8 References ... 58
9 Signature ... 60
Appendices
1
Introduction
The composition of the Dutch fleet in 2030 will depend on many factors. These are the autonomous fleet development, real-world CO2 emissions of vehicles, the
international market, European targets and the necessary requirement for electric vehicles (EV) uptake. Together, these factors will determine the European influx of EV. Whether the available EV will be sold in the Netherlands may depend on Dutch policy, in the light of European and worldwide developments.
In this report, we elaborate on each of these factors to support PBL in their task to evaluate the effect of the National Climate- and Energy Agreement. Much attention in the Climate agreement negotiations goes to the sales of new vehicles and the fraction of electric vehicles in the total sales. These two elements are not enough to estimate the fleet and the reduction in CO2 emissions. Three more elements must
be taken into account in this analysis. First, combustion engine vehicles will remain dominant in the fleet well beyond 2030 and their emission performance will play an important role for many decades. Second, if the sales of new vehicles do not match the majority of the Dutch passenger car fleet, i.e., small private-owned petrol cars, these EVs will be exported rapidly, like is the case with other business vehicles. Third, the availability of electric vehicles is of importance, also in the lower market segments, for the variety of use. It is assumed that European targets will drive the uptake of EV production. However, that does not automatically imply that European targets will ensure EVs to be available in the Netherlands and so for all market segments.
This report provides the background information on the necessary conditions needed to ensure that EV uptake in the Netherlands is sustainable. Up till now, it seems mainly luxury EVs in business use are sponsored with public funds. The fact that 40% of the total Dutch EVs sold belong to a market segment that makes up 5% of the sales volume, means the current situation with EVs has very little relation with a broad uptake of EVs in the Dutch fleet, replacing conventional vehicles in many different uses and ownerships. Many people pay 10,000 Euros or less for their car, which is a small fraction of the vehicle costs often taken as example for the success of EV sales.
The study examines the current situation and the potential for change. The renewal rate and the typical fleet composition is starting position. This is set against the trends and developments, the conditions, and the driving forces to show the bandwidth of developments in the different market segments and usages. This report does not come to a single conclusion. The different chapters show the issues concerning the uptake of EV from different angles. The current situation is very uncertain and prognoses are difficult to make. There are however many constraints which will limit the change from the current situation. With less than 0.4% electric vehicles in the total fleet, it is too early to claim that the sale and use of electric vehicles will definitely take off in the next few years.
With uncertainty on the intake of electric vehicles, the conventional vehicles will play an important role in three manners: First, as a viable alternative for EV for
consumers. Second, in their impact on the CO2 emissions from transport well
CO2 emission, these targets can be met by a certain ratio of EVs and (improved)
conventional vehicles. Hence, the study places the uptake of EVs against the development of conventional vehicle technology.
The results of the study are accumulated in uptake scenarios in the last chapter for the different market segments, which place the current development in perspective. It will be hard to compete with the standard low-cost compact car which hinders the broad uptake and retention of EVs in the Dutch fleet.
2
Historical fleet development
2.1 Introduction
There is a large variety in vehicle types and vehicle ownership situations. Private car use is generally related to older and smaller cars, with limited resale prices. These vehicles make up a large part of the Dutch fleet. For years already there is a mismatch in composition between the new car sales and the private car fleet, which is compensated by large numbers of cars being imported and exported. Hence, the influx of new electric vehicles does not naturally result in a similar fraction of EVs in the total fleet over time. Making electric vehicles land into the second hand (private) car fleet may be the biggest challenge to achieve electrification of the Dutch fleet. This chapter provides some insight in the mismatch of fleet segments.
The current vehicle fleet was analyzed, based on RDW vehicle data of November 2017 and June 2018.1 Only two forms of ownership are distinguished: business and private. Private-lease vehicles are included in the business sector.
2.2 Market segmentation
The consumer market for cars can be segregated in classes of vehicles with a different pricetag. These price based segments correlate partially with size and other characteristics in terms of functionality and luxury. In this chapter, trends are analysed solely from a price perspective. The distinguished segments are
presented in Table 2.1. From paragraph 2.8 onwards in the report, functionality and luxury are considered as well, employing a segmentation which correlates better with the (not formally defined) market segmentation commonly used by the industry. Table 2.1: Passenger car segmentation on the basis of catalogue prices
Segment Price range
I 0 – 15,000
II 15,000 – 25,000
III 25,000 – 35,000
IV 35,000 – 50,000
V 50,000 +
2.3 Business cars and private cars
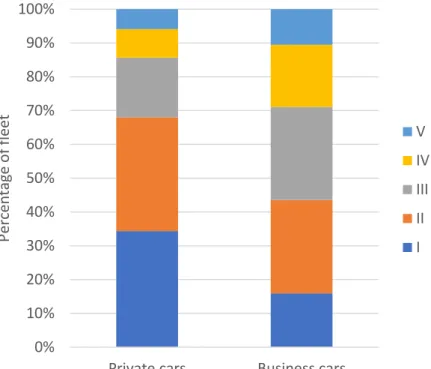
Figure 2.1 shows the distribution of cars over market segments, for the business car fleet as well as the private car fleet. There is a substantial difference in segment sizes between the two. The higher market segments are more prevalent in business cars and newer vehicles. Contrary, segments I and II together make up almost 70% of the vehicles in private use, but around 42% for business cars. Since more than half of the newly purchased cars are business cars, the amount of new cars in segments I and II does not suffice to supply the second hand market with vehicles aged four to ten years, later on. The lacking vehicles are imported.
Electric vehicles, however, are bought mainly by businesses at the moment, and they fit predominantly in the higher market segments, for which the second hand market is limited. The mismatch between business and private use manifests itself in age, fuel, and market segments. To retain electric vehicles in the Netherlands, it is important that EV sales in the business sector (and private sector) match well with the second hand market demands in terms of share among the segments. In the current situation the retention of electric vehicles is not obvious.
Figure 2.1: The market segment distribution based on the type of ownership as registered by RDW.
Since 2008, the surcharge on income tax for employee benefit of the private use of company cars (“bijtelling”) is lower for vehicles with low CO2-emissions. Since this
only affects business users, this regulation has increased the uptake of hybrid and electric business cars. Currently over 9% of business cars is a hybrid or (plug-in or full) electric vehicle, compared to less than 2% for privately owned cars, see Figure 2.2.
0%
10%
20%
30%
40%
50%
60%
70%
80%
90%
100%
Private cars
Business cars
P
erce
n
tage
o
f
fleet
V
IV
III
II
I
Figure 2.2: Share of drivetrain/fuel in private car and company car fleet.
The mismatch in drivetrain between the new business vehicles and the older private owner vehicles also causes the extensive import and export of passenger cars. This is related to the difference in road tax and fuel levels between petrol and diesel.
2.4 Import and export
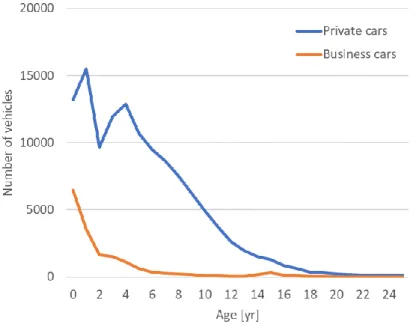
Business cars are commonly exported within the first 4-8 years, see Figure 2.3. It is not to be expected that electric cars from the business fleet are naturally retained in the Netherlands more than diesel or hybrid cars from the business fleet, without additional measures. As long as benefits such as reduced income tax surcharge apply, the vehicles are retained. Consequently, a large incentive for business owned EVs will have an effect of about one third of the effect that stimulation of privately owned EVs will have. The latter mostly remain in the Netherlands for their entire lifespan of (on average) 18 years.
0%
10%
20%
30%
40%
50%
60%
70%
80%
90%
100%
Private cars
Business cars
P
erce
n
tage
o
f
fleet
Figure 2.3: Annual import and export of vehicles in relation to their age (RDW; annual average in the period Jan. 2013 – Nov. 2017; the exported vehicles aged four years are traced back mainly from business use). Business cars are exported predominantly after four years, while private owned cars are exported from eight years till the end of the useful lifespan. Export is about 40% of the total sales, import is slightly less.
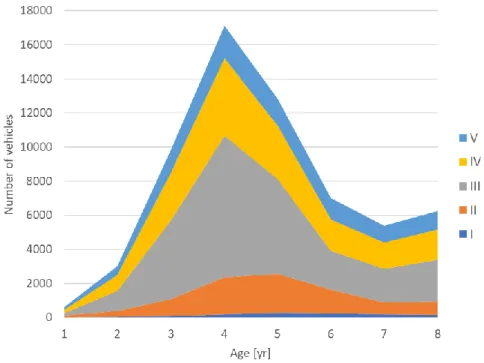
A closer look at the exported business vehicles in Figure 2.4 shows that segment III is dominant in the export. Most of these vehicles are exported after around 4 years. The number of vehicles is lower in the higher segments, but still export is
significant, considering the size of the segments.
Export of company cars with a new price of below € 25,000 (segment I and II) is limited.
Figure 2.4: The age at export for business cars, for different segments.
The current import of electric vehicles is also limited, and the ones imported seem to be utilized as business cars. If private cars are imported at a given age, there is no market for electric cars yet that fills this share.
The market segment shares of imported private vehicles can be seen in Figure 2.5. There is a clear pattern from young cars in lower segments to older cars in the higher segments. The latter is very likely related to the avoidance of high, CO2
emission related purchase tax (BPM). The former shows the need and lack of affordable cars in the Netherlands.
Figure 2.5: Imported vehicles for private use, across market segments and age.
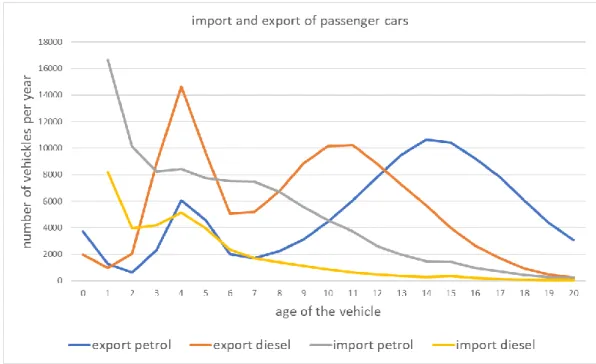
Figure 2.6 shows the annual number of imported vehicles (average since 2015). The renewal by import is mainly accomplished by private cars with a wide age range.
Figure 2.6: The average annual import in the period 2015-2018 for private and business use, differentiated to age.
2.5 Annual mileages and vehicle use
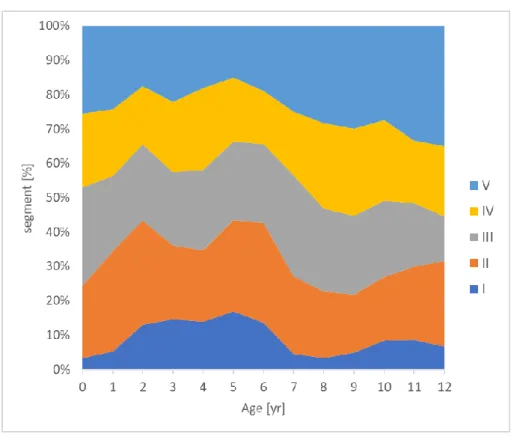
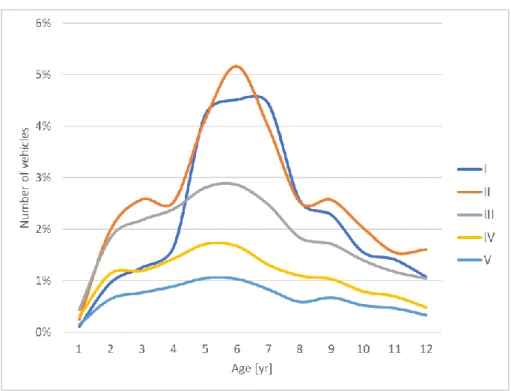
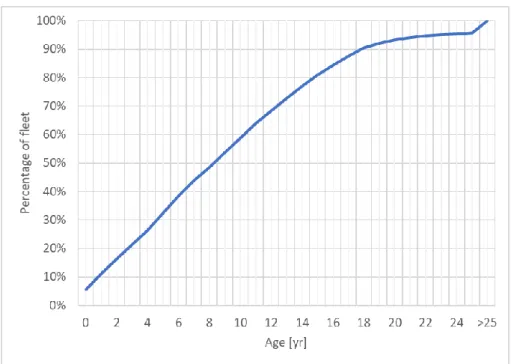
Due to the import and export the market segments distributions vary with age. As shown in Figure 2.7, the least expensive segments I and II make up less than 30% of the new vehicles, but double in seven years to the majority of the total Dutch fleet.
Figure 2.8 shows the same data, presented as a percentage of the total fleet.
Figure 2.8: Fraction of the fleet in the different segments over the years
To establish the influence of segment distribution, import and export on the CO2 emissions, an important factor is the mileage of these vehicles.
Diesel vehicles clearly cover higher annual mileages than petrol vehicles, but the annual mileages exhibit a rather small dependence on the market segment, see Table 2.2. Only with age the annual mileages drop.2 For the total fleet the average annual mileage is around 13,000 km/ann. The annual mileage about halves for the group of vehicles of ten years and older.3
Table 2.2: Annual mileages [km/ann] of vehicles for different fuels, ownership and market segments, average for the first four years of use.
Fuel Segment Private Business
Petrol I 12100 18500 [km/ann] II 13400 20100 III 15400 23900 IV 16800 24100 V 17000 22100 Diesel I 23200 23600 [km/ann] II 27100 26700 III 29700 31600 IV 28300 30700 V 27600 34300
2 TNO 2016 R11872 Nederlandse wagenparksamenstelling 2016 3 Source CBS
In the total cost of ownership of new vehicles the mileage plays a minor role, with these mileages. For the group where the cost per kilometre may play a larger role, i.e., private owners, the price of the vehicle is also less, both by a shift in segment as well as in age.
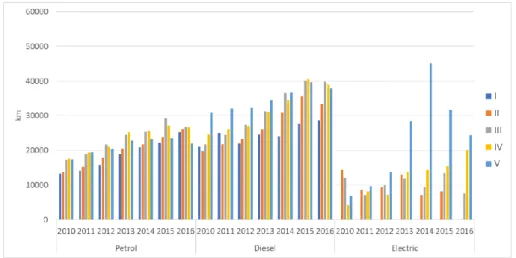
Another aspect to EV penetration and effectiveness of EV for CO2 reduction is the
replacement in the annual mileages by electric kilometres. It appears at the moment that in particular vehicles that are used only mildly (low mileages) seem to be replaced by EV. This limits the contribution to the total mobility, and the potential CO2 emission benefits. The effect is illustrated for business cars and private cars
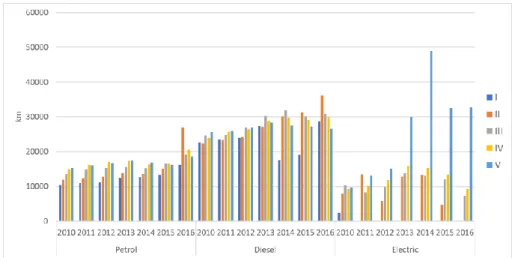
in Figure 2.9 and Figure 2.10.
Figure 2.9: Annual mileages of business cars, per fuel and age. Note that EVs are much more expensive than ICEVs of similar size and luxury and therefore fall in higher catalogue price segments.
Figure 2.10: Annual mileages of private cars, per fuel and age. Note that EVs are much more expensive than ICEVs of similar size and luxury and therefore fall in higher catalogue price segments.
2.6 Vehicle lifespan and turn-over rates
It must be understood that up to 2040 and beyond the Netherlands will have a substantial fraction of combustion engine cars, contributing to the CO2 emissions.
This can already be clearly deducted by looking at the current age distribution of the vehicle fleet (Figure 2.11). The average age has been increasing steadily over the years, so the current fleet will lead to low estimates of the average age of vehicles in 2030 and beyond. The age distribution will lead to slightly different conclusions with respect to the uptake of EV in the fleet than the new sales would. With an annual influx of more than 500,000 vehicles and a total fleet of 8,000,000 vehicles, it could be concluded that the lifespan is sixteen years. In reality, EV may be follow the trend of cars in the segments III to V, and could be exported, being too
expensive for private owners. The turnover rates of these vehicles will limit their impact on the average Dutch fleet. On the other hand, there are many private owners who own a vehicle for five years or longer.4 These people may consider an EV vehicle as the next vehicle in 2025 or beyond.
Also in this respect the private owners in the segments I and II will form an inert group not easily susceptible for the current stimulation and taxation policies which seem to cater mainly for the business use in the higher market segments.
Figure 2.11: The age distribution of the Dutch fleet.
A share of 31,6% of the vehicles are older than 12 years, which means that about a third of the vehicles present in the 2030 fleet will have been sold already (in the Netherlands or abroad), as the average age increases.
2.7 EV catalogue price
As explained in paragraph 2.2, market segments are defined by the catalogue price in this report. Even compact and small EV have substantially higher prices than similarly sized conventional vehicle models. Based on catalogue prices, EVs in the Netherlands are evenly distributed over the segments III, IV, and V (see Figure 2.12). For petrol cars, for which EVs should be the main competitors given their current electric range, this is only 40% of the vehicles.
Figure 2.12: Vehicle segmentation for petrol (B), diesel (D) and EV (E) on the basis of the catalogue price. EV’s are much more expensive than ICEVs of similar size and luxury and therefore fall in higher catalogue price segments. This is a nuance to the nevertheless valid observation that EV sales in the Netherlands are dominated by midsize and luxury segment vehicles and limited in the segments of compact and sub-compact vehicles.
It can be argued that the higher catalogue price of EV is compensated by lower running costs. But with a registration office of individual debts (BKR) private owners may be reluctant to paid up-front for lower running costs, to break even after four years or longer, depending on the annual mileage.
Comparing the catalogue prices of EV with the fleet average, it is clear that EV are sold in two groups: C- and D-segment and in the high end of the E-segment (see Figure 2.11). In particular these vehicles are uncommon in the Dutch fleet. This niche market is unlikely to match with private ownership. Half the normal Dutch fleet, including lease, has a catalogue price below 24,000 Euros, close to the lowest current price of any EV.
Figure 2.13: The distribution of 5.5 million known catalogue prices of all registered vehicles and all registered EVs, both normalized to 100%. About 40% of the EVs have a catalogue price above 75,000 Euros.
2.8 Second hand electric vehicles
By analysing the second hand market of electric vehicles, the residual value can be determined. For this analysis, all second hand vehicles (> 1.000 kilometres) offered on autowereld.nl (as of August 2, 2018) were analysed. In contrast to the analyses in the previous sections each model was assigned to a market segment A-E, as listed in Appendix 1. This was done in a similar way as the list published by AutoRAI5 for ICEVs. Conventional vehicles on the list and equally classified electric vehicles in appendix 1 should have a similar size/luxury level.
In Table 2.3 it can be seen that in total 649 second hand EVs are available. The majority of vehicles available is situated in the C segment (compact family car). Outliers can be explained by luxury options.
Table 2.3: Second hand price range of EVs
Class Minimum price Average price Maximum price Number of class
A € 4,500 € 15,214 € 29,850 108 B € 9,450 € 18,832 € 35,699 154 C € 5,450 € 30,086 € 52,880 267 D € 16,900 € 16,900 € 16,900 1 E € 37,490 € 63,997 € 154,950 119 5 https://autorai.nl/duidelijkheid-over-autosegmenten/
Analysis reveals that resale value of second-hand full electric vehicles can be explained by the vehicle age and the kilometres driven. Figure 2.14 and Figure 2.15 show:
• The (exponential) relation between residual value (as a factor of the original price) and the years since registration.
• The (logarithmic) relation between residual value (as a factor of the new price) and the kilometres driven. This implies that after a steep decline the line indicating the residual value flattens.
• By these variables 65% of the change in residual value can be explained (Adjusted R2 = 0,65; p-value<0,001), which can be considered a reasonably
good fit of the model.
o According to this model; keeping kilometres constant will result in a 3% decrease in price when comparing vehicles of 1 year and 2 year old respectively. When comparing vehicles with a vehicle age of 4 years and 5 years, the price of the latter vehicle will on average be 9% lower.
o According to this model; keeping the vehicle’s age constant will result in a 5% price decrease when comparing vehicles that drove 20.000 versus 40.000 kilometres. When comparing vehicles that drove 80.000 and 100.000 respectively the price decrease between the former and the latter will only be 1%.
Figure 2.14: Residual value of EV as a function of its age.
Figure 2.15: Residual value of EV as function of its mileage.
An overview of prices, compared to the catalogue prices yield a substantial reduction of the resale value of the EV, as shown in Table 2.4. Note that the data are uncertain, and can only be used as an indication of a limited market.
Table 2.4: Residual price of EV as function of the age, for different market segments. With the amount of available data, there is a large uncertainty in the averages reported here.
age in years segment 1 2 3 4 5 6 7 8 9 A 89% 80% 52% 51% 51% 36% 33% 30% (45%) B 89% 84% 71% 60% 50% 48% - - - C 105% 85% 67% 56% 48% 38% 29% 34% D - - - - 21% E 92% 78% 72% 57% 47% 49% - - - y = -0,141ln(x) + 2,0419 R² = 0,4677 0 0,2 0,4 0,6 0,8 1 - 50.000 100.000 150.000 200.000 250.000 300.000 Valu e re lat ed to n ew v alu e (f ra ctio n ) Kilometers
Residual value related to new price
-kilometers
3
International state-of-play
3.1 World market
3.1.1 Electric vehicle sales
Today the largest electric passenger car stock is present in China: 40%. The total world stock of EVs surpassed 3 million in 2017, as shown in Figure 3.1.
Sales are over 1 million in 2017, for which China is responsible for 50%. Market shares are highest in Norway (39%), Iceland (12%) and Sweden (6%) [IEA 2018].
Figure 3.1: Evolution of global electric passenger car stock (source: [IEA 2018], based on country submissions, ACEA 2018 and EAFO 2018)
EV deployment has mostly driven by policy so far, as the main markets by volume (China) and sales share (Norway) have the strongest policy push [taken from IEA 2018].
3.1.2 Incentives
All countries in the top-10 of highest EV sales have a range of policies to promote the uptake of electric cars. Also, a reduction of benefits (Netherlands, Denmark) has led to an immediate decrease of uptake. It appears therefore that most uptake is incentive driven so far.
The country with the largest EV fleet (in numbers), China, mandates car manufacturers to produce a certain share of electric vehicles. A credit trading mechanism allows some exchange among manufacturers. EVs produced have to comply to minimum range (100 km for BEV, 50 km for PHEV) and efficiency standards. China targets 12% EV credits in 2020. As some EVs can get a rating of higher than one point, the actual sales may be lower than 12% [IEA 2018].
The United States is currently reviewing its greenhouse gas emission standards. The EPA determined that the standards set during the previous administration were too stringent. The 2012 standards would induce approximately 5% PHEV sales according to EPA. The state of California vows to stick with stricter rules, which are in design similar to the Chinese mandate system.
Norway is the country with the highest sales share of EVs, 39% in 2017 according to EV Norway (www.elbil.no). The incentives have been restricted somewhat in 2017 and 2018, and consist of:
- Exemption from road tax
- Exemption from 25% VAT on purchase - Exemption from 25% VAT on lease - Exemption on purchase/import taxes - 40% reduced company car tax - 50% price reduction on ferries
- Zero re-registration tax for used ZEVs
- Access to bus lanes (in Oslo requires carpooling during rush hours) - Free municipal parking (cities can decide since 2017)
Furthermore, the Government of Norway has financed and established at least two fast charging stations on every 50 km of main road in Norway (except Finnmark and Lofoten at the moment).
3.1.3 Developments until 2030
The Model S of Tesla overtaking the luxury models of Porsche, Daimler, and BMW in sales is often taken as an example for the developments of the coming years. The suggestion is made that the traditional manufacturers are being outpaced by the “new players” on the market. But the fact is that the large volumes are in other market segments, in particular those of vehicles priced between 8,000 and 20,000 Euros (the A- and B-segments). For these market segments factories churn out vehicles at 100,000 or more per year to run a profit. The industry has matured from the days of Henry Ford, becoming more and more (cost) efficient on the way, and involves a large network of suppliers. Therefore, it is much more difficult, but not impossible, for new EV manufacturers to play a role in the lower market segments. If a new player enters this market, it may come from an unexpected direction but with large financial backing to set up the cost effective manufacturing lines.
3.2 European market
3.2.1 EV sales volumes and charging points
Figure 3.2 shows the sales numbers of full battery electric vehicles and plug-in hybrid electric vehicles in Europe, as derived from the European Alternative Fuel Observatory.
Figure 3.2: EV sales in Europe [EAFO 2018]. Data until May 2018. Ytd=year to date; e=linearly extrapolated for the entire year.
Figure 3.3: EV fleet in Europe [based on EAFO 2018]. Data until May 2018. Ytd=year to date; e=linearly extrapolated for the entire year.
The EV share in the European vehicle fleet would be just over 0.5% by the end of this year, if sales progress linearly during 2018.
Per May 2018, almost 140,000 charging positions are present in Europe, of which 15% fast chargers. A quarter of the charging positions are located in the
Netherlands, although the number of fast chargers is limited to approximately 800 at the moment.
Figure 3.4: Number of charging positions in the EU28 and the Netherlands as of May 2018 [based on EAFO 2018]
Considering the number of BEVs plus PHEVs in the fleet, this corresponds to one charging position for every 7.5 EV in Europe. In the Netherlands the relative ratio of charging infrastructure is slightly better: 3 EVs for each charging position. Note that home chargers are not taken into account.
3.2.2 Incentives in European countries
Apart from the proposed CO2 emission standards on a European Union level of
30% reduction in 2030, most countries in and around the EU have formulated policies to encourage EV uptake.
Table 3.1: Incentives for EVs in Europe [EAFO 2018] Countries Pu rc h ase Su b si d ie s R e gi str ation Tax B e n e fi ts Own e rsh ip Tax B e n e fi ts Co m p an y Tax B e n e fi ts VA T B e n e fi ts Oth e r Fi n an ci al B e n e fi ts Loc al In ce n tiv e s In fr astr u ctu re In ce n tiv e s Austria √ √ √ √ √ √ Belgium √ √ √ √ Bulgaria Croatia √ Cyprus √ √ Czech Republic √ √ Denmark √ √ √ √ √ Estonia Finland √ √ √ √ France √ √ √ √ √ Germany √ √ √ √ √ Greece √ √ √ Hungary √ √ √ √ Iceland √ √ √ √ √ Ireland √ √ √ √ √ √ Italy √ √ √ Latvia √ √ √ Liechtenstein √ Lithuania √ √ Luxembourg √ √ √ Malta √ √ √ √ √ √ Netherlands √ √ √ Norway √ √ √ √ √ √ √ Poland Portugal √ √ √ √ √ Romania √ √ √ √ Slovakia √ √ √ Slovenia √ √ √ Spain √ √ √ √ √ √ Sweden √ √ √ Switzerland √ √ Turkey √ United Kingdom √ √ √ √ √ √ 3.2.3 Developments until 2030
A number of countries have large ambitions to meet Paris Agreement targets and may upgrade the incentives to meet them. So the incentives listed above will be
updated. With the increase in wind and solar energy, the need for buffering can be met partially with charging strategies for electric cars. Hence, there may be other motives to have a substantial amount of electric vehicles entering the market. The focus on biomass does not have the same issues with the need of buffering for robustness.
3.3 Announced electric vehicle models
For the coming years car manufacturers have announced to launch several new EV’s. In the table below these are summarized. A few observations can be made:
• The most new models are expected to be introduced in 2019. Any introductions after 2020 are not announced yet or unknown.
• The maximum range of the announced vehicles equals 500 kilometres. • The expected minimum resale values show that announced vehicles mainly
can be categorized as higher segment vehicles. . Tabel 3.2: - Announced EV models (Source: ev-database.nl)
Brand Type Announced/
Concept Year of introduction Expected minimum resale value Range
Audi e-tron quattro Concept later in 2018 € 82.500 400
Audi e-tron sportback Concept 2019 € 85.000 400
BMW iX3 Concept 2020 € 70.000 350
Faraday6 Future FF91 Announced 2018 Unknown Unknown
Ford7 Several models Announced 2020 Unknown 480
Huyndai Kona Electric 40 kWh Announced 2019 € 35.000 250 Hyundai Kona Electric 64 kwh Announced Later in 2018 € 39.150 390
Jaguar8 I-Pace Announced 2019 Unknown 500
Kia Niro EV mid range Announced later in 2018 € 35.000 230 Kia Niro EV long range Announced later in 2018 € 40.000 370 Lucid
Motors
Air Concept 2019 € 75.000 375
Mercedes EQC Concept 2019 € 70.000 350
Nissan leaf E-plus Announced 2019 € 40.000 350
Porsche Taycan Mission E Concept 2019 € 150.000 450
Tesla Model 3 Announced 2019 € 38.000 370
Tesla Model 3 Long range Announced 2019 € 50.000 490
Tesla Model 3 Long range dual motor
Announced 2019 € 55.000 460
Tesla Model 3 Long range performance
Announced 2019 € 70.000 450
Tesla9 Model Y Announced 2020 Unknown Unknown
Volkswagen I.D. Concept 2019 € 35.000 375
Volvo10 Announced 2019 € 34.116 400 6 Newmotion.nl 7 Businessinsider.nl 8 Newmotion.nl 9 Businessinsider.nl 10 Businessinsider.nl
3.4 International studies
3.4.1 JRC report on EV sales
JRC published some initial results of the impact that a technology transition scenario may have on the evolution of the EU passenger car fleet, and how this influences the fleet emissions and energy use. This was done by linking two models developed by JRC: 1) Powertrain technology transition market agent model (PTT-MAM) and 2) DIONE fleet impact model.
1. PTT-MAM-model
The PTT-MAM-model is a system dynamics model that studies the interaction between market agents in the automotive sector, with respect to the uptake of new powertrain technologies on passenger cars and vans, up to 2050. The agents are manufacturers, infrastructure providers and maintenance companies, authorities and end users.
With the model, key ‘levers’ can be identified that influence the adoption rate of new technologies, both on supply and demand side.
2. DIONE model
With the DIONE fleet impact model, scenarios of future European road vehicle fleet compositions can be analysed. This includes vehicle efficiency development, activity patterns, WTW greenhouse gas emissions and energy consumption up to 2050. It can be run for EU28, but also for specific countries.
It uses widely used emission factors from COPERT and it can model the energy consumption of each vehicle type separately.
The new registration composition and fleet composition from PTT-MAM are input to DIONE.
The baseline calculated assumes oil price development as in EC 2013, an EV learning rate of 10%11, no more EV subsidies after 2015 and passenger car CO2 targets of 70 g/km in 2025 and 41 g/km in 2050.
The technology transition scenario assumes 50% higher oil price increases, 20% EV learning rate, EV purchase subsidy of 25% of the price penalty in 2020-2025 and targets for passenger cars of 56 g CO2/km in 2025 and 27 g CO2/km in 2050.
New market registrations are driven by user ‘willingness to consider’ plus the relative attractiveness of a powertrain.
11 The assumption that each doubling of cumulative production of EVs leads to a cost reduction of
Figure 3.5: Powertrain fleet composition transition (source: [Harrison 2016])
In the baseline scenario, plug-in hybrids and BEVs have a fleet share of one third in 2050, while sales contribution is about 50% by that time. In the technology transition scenario, the conventional vehicle fleet share in 2050 is 40%, although sales has dropped to 14%. The small difference is partly related to the assumed strong increase in GDP, which induces a larger fleet and distance driven.
Because of the slow turnover speed of vehicles (long life span) and the resulting limited cumulative effect of a small sales percentage on the fleet in 2050, the timing of the uptake curve is of large importance for the fleet composition. In a similar way, the cumulative CO2 emission is dependent on this timing [UBA 2017b].
3.4.2 JRC report on the possible influence of EU CO2 car legislation on transport emissions
[Thiel 2016b] concludes that a 70 g/km target in 2030 would decrease the total EU transport emissions of CO2 already by 5%. Assuming a learning rate of 10% in EV
technology, deployment of EVs is a viable option to attain these reductions. In case of 70 g/km, more than one quarter of the passenger car transport demand is covered by EVs by 2030. Total system costs increase by less than 1%.
The learning curve has a large influence, meaning that policies should be robust to achieve reductions at lowest costs. A learning rate of 12.5% for example pushes EV deployment enough to end up below 70 g/km without additional system costs, according to the report.
3.4.3 Ricardo report on the impact of post-2020 CO2 regulations
In the Ricardo report [Hill 2018] it is concluded that, if passenger car and van CO2
targets would be set in both 2025 and 2030, the greenhouse gas emissions over the period until 2030 are 18% lower than in the case a target is set only in 2030. In terms of TCO, the benefits for the perspective of the first user are greater in a 30% reduction scenario than in a 40% or 50% reduction scenario. The higher scenarios are of more benefit to second users: the annual fuel cost reduction of efficient vehicles is enjoyed while only paying a fraction of the additional purchase cost that the first owner had. This means that stimulating low-emission vehicles can have a levelling effect on the automobility costs across income groups, in the long term. The stronger the increase in energy prices, the larger the levelling effect will be by 2030.
A scenario with a declining share of diesel vehicles in Europe was assessed as well. Hill concludes that even the high ambition (-50%) CO2 targets can be achieved
cost-effectively by 2030. However, the effectiveness of CO2 reductions is estimated
18% lower, meaning that the real world emissions will not decrease as much as in the base scenario; less diesels means more petrol cars, which have, as stated in the report, a larger gap between WLTP and real world emissions. In general a potentially further increase in the gap between real world emissions and type approval emission values for petrol vehicles is a risk; it would reduce the effectiveness of the reduction policies.
3.4.4 Potsdam report on German vehicle sales composition in 2030 based on expert elicitation
[Krause 2016] assessed possible characteristics of the 2030 German new passenger fleet, based on elicitation of seven experts from six German Original Equipment Manufacturers (OEMs). The results were used to build relationships in a Bayesian Belief Network: a model to predict how future technology, economic and policy scenarios will influence model projections. The network predicts that the 2030 traditional, internal combustion engine vehicle will have lower user costs per
kilometre than plug-in hybrids or battery electric vehicles for most scenarios, and that internal combustion engine vehicles (ICEVs) will remain the dominant vehicle type in the 2030 German new fleet. Further CO2 reductions on ICEVs are not
economically viable from a user point of view, but can be viable for plug-ins and battery electric vehicles.
3.4.5 AECC/LAT report on sales composition
LAT evaluated a business as usual-scenario with respect to CO2-emissions of road traffic up to 2030, and the effect of a combination of improved vehicle technology, fuel and ICT measures.
The main conclusion is that reaching future CO2 targets for road transport does not
necessarily mean more advanced vehicle technology. It might be enough to use more sustainable fuels and moderate ICT implementation, such as adaptive cruise control, green driving, variable speed limits and urban traffic control.
According to LAT, a ‘low effort’ scenario would lead to a passenger car average CO2 emission of 92.3 g CO2/km (type approval, NEDC) in 2030. This includes
mostly market driven downsizing, and a mild increase in EVs. A high effort scenario reaches 56 g CO2/km (type approval, NEDC) in 2030 due to significant penetration
of PHEVs.
3.5 Manufacturing capacities
3.5.1 Battery manufacturing
A lot of effort is put in improving battery specifications, in terms of capacity per kg and per litre, power per kg and per litre and durability, while reducing the
manufacturing costs. Another challenge is to reduce the use of certain materials that have a high unit price. Cobalt is the most prevalent one. The demand of cobalt in other applications is relatively low, which means that the production has to step up to a large extent in order to keep up with projected EV sales and battery capacity increase per EV.
To have enough cobalt for 125 million light duty EVs worldwide in 203012 (40 times the amount of today), the cobalt production would have to grow by a factor of 10. Price surges such as the ones that occurred over the last few years may affect the declining battery price curve and generate uncertainty around EV uptake. This works the other way as well: when EV uptake is predictable, production capacity of cobalt can be increased accordingly, avoiding strong price fluctuations.
Lithium-ion chemistry is expected to remain the chemistry of choice for EV technology for many years to come. In the longer future, other lithium- and non-lithium-based chemistries are expected to gain ground [Meeus 2018].
In 2017, about 125 GWh of EV batteries was produced [Perkowski 2017, Cleantechnica.com 2018]. The production capacity is projected to be doubled to 250 GWh in 2020. Panasonic estimates a sixfold production of battery units in 2026 compared to 2017. Its own production volume is estimated 35 GWh in 2019. Most current EV manufacturers source cells from LG Chem, including Renault, and Nissan from 2019. Tesla uses Panasonic, and BYD produces its own batteries. Announced battery factories in China:
- Contemporary Amperex Technology: 24 GWh in 2020 (total by then: 88 GWh)
- BYD: 24 GWh in 2019 (total by then: 60 GWh)
- Eve Energy: 1.5 GWh in 2018 (total by then: 7.5 GWh) - Funeng Technology: 10 GWh being built now
- Guoxuan High-Tech: 4 GWh in 2018
Looking at the market, for a viable electric car a battery capacity of about 40 kWh is needed. The current battery production is only sufficient for a few percent of the worldwide sales volume of passenger cars. For large scale uptake, the battery production capacity needs to increase by a factor of 10 by 2030.
3.5.2 EV manufacturing
Announcements of EV models as well as projections of EV sales have been issued by many car manufacturers. Figure 3.6 shows an overview of these, taken from the IEA Global EV Outlook 2018.
12 The EV fleet size resulting from the IEA New Policies Scenario [IEA 2018], assuming existing
Figure 3.6: OEM announcements of electric cars [IEA 2018].
Reuters has analysed that global carmakers are planning to invest 90 billion dollars in electric vehicles [Reuters 2018]. This is at least 19bn in the USA, 21bn in China and 52bn in Germany. German and US automaker executives have said in interviews that the bulk of those investments are earmarked for China, where the government has enacted escalated EV quotas starting in 2019. In Europe, announcements by the industry have not always materialized in actions. Such announcements also play a role in economic affairs.
The actual increase of production capacity cannot be derived from this information. The projected number of sales in 2020 in the graph sums up to almost 11 million EVs. The battery production capacity is estimated to be double by then, amounting to 250 GWh. 2020 EVs will predominantly be vehicles in the larger size, more luxurious segments (compact family cars and higher), as will be explained in chapter 6. Assuming an average battery size for these vehicles of 60 kWh in 2020, a simple calculation shows that the joint ambition of the manufacturers outpaces the battery production capacity growth. 650 GWh would be needed to make the
announcements happen, even without the sales by manufacturers that did not quantify the 2020 sales numbers.
4
European CO
2policies and the influence on the
fleet composition
4.1 Introduction
The influence of CO2 policies on the potential CO2 benefits of the uptake of EVs has
many facets. First of all, the real emission level of conventional, internal combustion engine vehicles (ICEVs) does not correspond to, and has no fixed relation with, the type-approval CO2 values of the vehicles sold. This has an effect on the real world
emissions that set the reference point for 2030, as explained in paragraph 4.2. Furthermore, changes in the test procedure will lead to a change in the ratio between reported emission levels and real world emission levels for conventional vehicles, while flexibilities in the new procedure introduce an additional uncertainty about the 2030 target levels. This is elucidated in paragraph 4.3. Next,
manufacturers have multiple ways to reduce the CO2 emissions of their sales fleet
towards 2030, including reducing emissions from traditional, internal combustion engine vehicles (ICEVs). Furthermore, plug-in hybrid vehicles (PHEVs) can play a role in meeting the targets. The ‘mix’ of technologies employed will be dependent on the stringency of the policy target, as demonstrated in paragraph 4.4 and 4.5. Lastly, the uptake of EVs helps meeting air quality targets as well, which could generate an extra pull, which is described in paragraph 4.6.
4.2 ICE technology developments and the ‘gap’
EU CO2 emission targets can be at least partially met by decreasing the CO2
emissions per kilometre of gasoline and diesel powered vehicles. As widely
understood, in the real-world CO2 emission levels of passenger cars are higher than
on the New European Driving Cycle (NEDC) label. Actually, the gap between real-world emissions and NEDC type-approval emissions has increased in the last fifteen years. This has a number of causes:
• Manufacturers increasingly exploit the so-called ‘test flexibilities’, i.e.,
bandwidths and ambiguities in the prescribed test procedures and conditions, to achieve lower CO2 emission values on the type approval test without changing
the vehicle.
• The increased use in real-world driving of energy consuming auxiliaries such as air conditioning and day-time lighting, which are not switched on during the type approval test.
• the application of CO2-reducing technologies that yield higher reductions on the
type approval test than under real-world driving conditions.
As many of the advanced technologies described above are gradually being implemented, it can be concluded from the growing gap that the last cause is true for (most of) these technologies: the real world CO2 reduction is smaller than the
effect on the type approval value.
The latest state of play is described in [Van Gijlswijk 2018]. Figure 4.1 shows that the gap is between 40 and 50 g/km for both diesel and gasoline passenger cars sold in the Netherlands in 2017 (average: 46 g/km). In other words: the average real world emissions are 46 g/km higher than the average NEDC value.
The large deviation in the gap in 2015 can be explained from the peak in plug-in hybrid electric vehicles in that year. This is further explained in paragraph 4.5. The result is that strict targets will have limited effect. The current trend deviates only little from the earlier estimates dating back to 2010 [Ligterink 2010].
Another interesting conclusion that can be drawn from the graph, is that the average absolute CO2 emission value of cars sold in 2017 is quite a bit higher than
for those sold in 2016 or 2015. The reasons can probably be found in the cutback on fiscal advantages for plug-in hybrids, the announcement of the enforcement of the WLTP test cycle (see paragraph 4.3) and a trend towards heavier and larger cars as a result of increased economic prosperity.
Figure 4.1: Average real-world CO2 emissions versus the average type approval value of new
petrol and diesel cars, including plug-in hybrids, differentiated by the year of
introduction / registration in the Netherlands (2017 value is preliminary) [Van Gijlswijk 2018]
As can be derived from the graph as well, is that the gap does not seem to increase significantly over the last few years, besides the plug-in hybrid effect. Even though it is not known what the real world effect will be of taking further steps improvement of efficiency of the vehicle, it seems safe to say that both type approval and real world emission values will benefit. The two main ways to increase the efficiency of an internal combustion engine vehicle are to improve drivetrain efficiency or to improve vehicle parameters such as air drag (from which battery electric vehicles benefit even more).
There is a variety of technologies readily available, and applied to a part of the vehicles on the market today already. According to [ICCT 2016] the extent to which these technologies are needed by manufacturers to meet CO2 emission targets was
systematically overestimated, as have the final per-vehicle costs of meeting standards.
One reason for these overestimations is the reliance on industry surveys to estimate the costs and potential.
Technologies that are applied and can be further deployed: - Gasoline direct injection
- Continuously variable transmission or 6+ gears
- Single stage and two-stage turbocharging plus downsizing of the engine - Variable valve lift and timing / cam-profile switching
- 12V start stop system
- 48V belt starter-generator (mild hybrid) - Hybrid
- (Cooled) exhaust gas recirculation
- Two-stage and fully variable compression ratio - Miller/Atkinson cycle
- Low-friction design And the more generic measures:
- Rolling resistance reduction - Vehicle mass reduction - Aerodynamic drag reduction
At a certain point, the marginal costs of producing an ICEV having more of these technologies on board may surpass those of the marginal costs of producing an electric vehicle, from a manufacturer’s perspective. It is likely that manufacturers will in that case fill the remaining gap to the company’s emission target with electric vehicles.
ICCT has calculated the additional costs per vehicle (2014 model) as a function of the NEDC emission target. Assumed is that first all ICEV improving technologies are applied before electric vehicles are introduced. See Figure 4.2.
Figure 4.2: Total incremental cost of reducing the CO2 emissions of an average passenger car in
the EU (assuming full deployment of combustion engine technologies before transitioning to electric vehicles); taken from [ICCT 2016]
4.3 Transition to WLTP and the CO2 targets
From September 2017 onwards newly introduced models have to comply to the Worldwide Harmonised Light Vehicle Test Procedure (WLTP), which replaces the New European Driving Cycle (NEDC) as a type approval procedure. From September 2018, all newly sold vehicles have to comply. Until 2021, the CO2
emission will be communicated as calculated NEDC values. These may not be equal or related to the present NEDC values. The test cycle was replaced to be more representative for real driving conditions, and should allow for less flexibilities. As a consequence, the gap between WLTP and real world emissions should be reduced, compared to the gap between NEDC and real world.
The current target is 95 g CO2/km on the NEDC cycle. To move towards WLTP and
still be able to establish whether the sold vehicle fleet complies with the 2021 target, the European WLTP regulations contain procedures to convert WLTP CO2 test
values into ‘old’ NEDC values, using calculated, or partially measured, values. In 2021 every car will thus have a declared WLTP CO2 value as well as a calculated
or measured NEDC CO2 value. For all new vehicles that are sold in the EU in 2021,
the average WLTP and NEDC values are determined. On the basis of the average NEDC value the compliance to the 95 g/km-target is determined. The EC has proposed to determine the CO2 targets in 2025 and 2030 based on the ratio between the average WLTP and NEDC values. This means that the higher the WLTP value in 2021, the higher the future targets will be. With this system, there is a motivation for car manufacturers to set the declared WLTP values as high as possible, while in the meantime maintaining NEDC values, on average (calculated or measured) that do comply to the 2021 CO2 standards.
The CO2MPAS calculation tool to convert NEDC values to WLTP, also contains a motivation to present high WLTP-values as well as high calculated NEDC values. The tool is under regular evaluation. If NEDC values are higher than expected, it may be decided to adjust the effect of the tool to correct this, leading to an increased difference between WLTP and calculated NEDC values, which reduces the required effort to meet the future CO2 targets.
Without any control mechanism in place the manufacturers may increase the gap between the NEDC value and the WLTP value of the same car. The Commission has recently noted inflated WLTP values. It is doubtful if this was intentional from manufacturers, years ahead of the transition in 2021. But the fact that WLTP values are fluid is reason for concern. The possibility of flexibilities on the WLTP was already raised [Ligterink 2015]. Still there is little knowledge on the nature and the magnitude of the flexibilities on the WLTP. But given the fact that only a fraction of the current gap is explained, it is safe to assume there is an arsenal of flexibilities not covered in the WLTP [Ligterink 2016].
4.4 Impact of 30% or 40% reduction target on European EV sales
The simplest assumption is that 95 g/km is the ultimate target for conventional vehicles, and further reductions have to be filled in with electrification.
Consequently, 30% electric vehicles in the new sales are often assumed for 2030 to meet CO2 targets for 2030. The underlying reasoning seems rather limited.
In the Netherlands diesel cars in higher market segments with CO2 values of
90 g/km have been on sale since 2013. It may be safely assumed that energy efficiency of the combustion engine has not stopped since 2013. Furthermore, according to calculations of TNO as well as of the ICCT, 70 g CO2/km should be
possible for ICEVs, using technologies as the ones described in paragraph 4.2, with low additional net costs. This would mean that a target in the range of 30% (see WLTP considerations in the previous paragraph) might be achieved without EV influx at all. To the extent EVs are part of the mix in Europe towards 2030, the distribution among countries has implications for the Netherlands as well. The Netherlands has a relatively large share of small cars. This market may be used by manufacturers to sell compact cars to meet overall targets.
All in all, manufacturers’ strategies to meet the 2030 targets can be divided roughly in five elements:
1. Have a high starting value for the WLTP in 2021, i.e., maximize the NEDC-WLTP gap
2. Exploit the flexibilities on the WLTP after 2021 to reduce CO2 values with
limited real-world consequences
3. Apply fuel efficient technologies further on conventional and hybrid cars 4. Use a fraction of PHEVs to balance traditional vehicle sales
5. Use a fraction of EVs to balance traditional vehicle sales
Any car maker will make its own choices here. For high-end manufacturers it has already been observed that the PHEV plays a role in balancing the average CO2
figure. For the manufacturer active in the A- and B-segment, the 95 g/km has been less urgent, in particular with the NEDC test.
Only EVs to balance seems rather limited as strategy. So only in the best case 30% EV in the total European sales may be expected (if policy is the driver). More likely half of that fraction is used to meet European targets for 2025 (15%) and 2030 (30%). It is expected that on all of the five parts of the strategy the manufacturers may aim for at least 5% room for the 30% target, leaving 10% EVs as a low end value.
A shift towards 40% and higher targets
European member states who have large ambitions on reducing CO2 emissions are
generally more vocal than countries with other agendas and issues. The 30% target for the reduction from 2021 to 2030, proposed by the Commission, was met with an opposition from the more vocal countries, as it was not helping their ambitions, as they considered them in line with the Paris Agreement. Moreover, technical
feasibility and costs were no longer seen as insurmountable hurdles post-2020 for a broad roll-out of electric vehicles across Europe, replacing the sales of conventional cars to a large extent. In this atmosphere, targets of 40% and even 50% CO2
reduction from 2021 to 2030 were proposed. This would increase the need for electrification, and push the electric vehicles in all market segments and for all manufacturers. It may lead to some difficulties for manufacturers now planning to meet the 95 g/km target with mainly fuel efficient technologies on conventional cars, as they will have to change their strategy quickly. Some manufacturers may be wary from earlier, unsuccessful excursions in the field of electric cars as well. The European Commission has in the past been sensitive to arguments of
manufacturers concerning the long lead time of developments in the industry making it difficult to change strategy in short term.