Academic year 2020
Climate Variability and Its Impact on Crop Production in Amhara Region
Belete, Dereje Mengist
Promotor : Stijn Speelman
Thesis submitted in partial fulfilment of the requirements
for the joint academic degree of International Master of Science in Rural Development from Ghent University (Belgium), Agrocampus Ouest (France), Humboldt University of Berlin (Germany), Slovak University of Agriculture in Nitra (Slovakia), University of Pisa (Italy) and University of Córdoba (Spain) in
collaboration with Can Tho University (Vietnam), China Agricultural University (China), Escuela Superior Politécnica del Litoral (Ecuador), Nanjing Agricultural University (China), University of Agricultural Science Bengaluru (India), University of Pretoria (South-Africa) and University of Arkansas (United States
This thesis was elaborated and defended at Ghent University within the framework of the European Erasmus Mundus Joint Master Degree “International Master of Science in Rural Development " (Course N° 2015 - 1700 / 001 - 001)
Certification
This is an unpublished M.Sc. thesis and is not prepared for further distribution. The author and the promoter give the permission to use this thesis for consultation and to copy parts of it for personal use. Every other use is subject to the copyright laws, more specifically the source must be extensively specified when using results from this thesis.
The Promoter(s) The Author
Stijn Speelman Belete, Dereje Mengist
Thesis online access release
I hereby authorize the IMRD secretariat to make this thesis available online on the IMRD website The Author
Acknowledgments
First and foremost, each step of my educational career, and this research work has been achieved with the blessing of God. If words can express my gratefulness, I would like to thank the Almighty God who made it possible, to begin and finish this work successfully. I would like to express my deepest gratitude and sincere thanks to my promotor Professor Stijn Speelman and my tutor Juan Tur Cardona (Ghent University) for their immeasurable and priceless support, constructive criticism and devoting precious time in guiding, reading, as well as correcting of this research paper, without them this paper would not be in its present form. I thank them not only for their scholastic guidance but also for their hospitable, and encouragement, which enabled me to complete this thesis comfortably.
I must express my appreciation to all my instructors and staff member of the Department of Agricultural Economics, Bio-science Engineering Faculty at the University of Ghent for sharing their knowledge, materials, and unreserved cooperation during my MSc study. My deepest sense of gratitude and acknowledgment goes for the financial support I received from VLIR-UOS scholarship/Belgian government. Many thanks go to my families and friends for their unwavering support. The various phone calls and chats I have received give me always the strength to commit myself for better achievement in my work.
Table of Contents
Acknowledgments... 1
List of Figures ... III List of Tables ... IV Acronyms ... V Abstract ... VI 1. Introduction ... 1
1.1. Background of the Study ... 1
1.1. Problem Statement ... 2
1.2. The Objective of the Study ... 4
1.3. Significance of the Study ... 4
2. Literature Review... 5
2.1. Tools and Techniques of Climate Variability Analysis ... 5
2.2. Crop Production in Ethiopia ... 5
2.3. Climate Parameters and their Trends around the Globe ... 7
2.4. Climate Variability and Trend in Ethiopia... 7
2.5. Climate and Crop Yield Relationship ... 11
3. Methodology ... 14
3.1. Study Area ... 14
3.2. Data Source and Types ... 15
3.2.1. Climate Data ... 15
3.2.2. Crop Data ... 16
3.3. Method of Analysis ... 17
3.3.1. Rainfall and Temperature Variability ... 17
3.3.2. Rainfall and Temperature Trend Analysis ... 19
4. Result ... 22
4.1. Annual and Seasonal Rainfall Patterns and Variability ... 22
4.2. Annual Minimum and Maximum Temperature Variability ... 23
4.3. Rainfall Trend Analysis ... 23
4.4. Temperature Trend Analysis... 27
4.5. Descriptive Statistics for Crop Production ... 31
4.6. Crop Yield and Climate Variables Relationship ... 32
5. Discussion ... 35
5.1. Annual and Seasonal Rainfall Patterns and Variability ... 35
5.2. Annual Minimum and Maximum Temperature Variability ... 36
5.3. Rainfall Trend Analysis ... 36
5.4. Temperature Trend Analysis... 37
5.5. Climate Variables and Crop Yield Relationship ... 38
6. Conclusion ... 40
7. Recommendation ... 41
List of Figures
Figure 1. The Mean Annual Rainfall of the 17 Stations Between 2001-2008 ... 8 Figure 2. Annual Average Rainfall over the different regions of Ethiopia with Coefficient of Variability. ... 9 Figure 3. Average annual precipitation over Ethiopia for 1981–2015 climatology ... 10 Figure 4. Ethiopian Annual Cycle of Rainfall, 1970-2006: Northwest, West, and Southwestern ... 11 Figure 5. The Amhara Region and Location of The Weather Stations Used in The Study.... 14 Figure 6. Annual and Seasonal Rainfall Variation and Trends at Different Stations from 1987 to 2017 ... 27 Figure 7. Annual Minimum and Maximum Temperature Variation and Trends at Different Stations from 1987 to 2017 ... 30
List of Tables
Table 1. Total Area and Production of Grain Crops 2017/18, Meher Season ... 6 Table 2. Details of Weather Stations Used for the Study ... 16 Table 3. Details of Zonal Administration and Respective Weather Station Used for Crop Yield and Climate Variable Relationship Analysis ... 17 Table 4. Interpretation of PCI Results ... 18 Table 5. Annual and Seasonal Rainfall (mm), Coefficient of Variation, Precipitation Concentration Index (PCI), 1987-2017... 22 Table 6. Annual Mean Maximum and Minimum Temperature (°C) and Coefficient of Variation, 1987-2017 ... 23 Table 7. Mann–Kendall Rainfall Trend Analysis at Different Stations, 1987-2017 ... 24 Table 8. Mann–Kendall Annual Maximum and Minimum Trend Analysis 1987-2017. ... 28 Table 9. Summary of Teff and BarleyCrop Production in Amhara Region on Area Cultivated (1000 ha), Production (1000 Qt) and Yield (Qt/ha), 1997-2015 ... 31 Table 10. Regression Result for Crop Yield and Climate Variables ... 34
Acronyms
ANRS Amhara National Regional State
ATR Annual Total Rainfall CSA Central Statistical Agency CV Coefficient of Variation GDP Gross Domestic Product
IPCC Intergovernmental Panel on Climate Change MK Mann- Kendall
NMA National Meteorological Services Agency OLS Ordinary Least Square
PCI Precipitation Concentration Index
SNNP Southern Nation Nationality and People of Ethiopia
SSA Sub Sharan Africa
SSE Sen's Slope Estimator
TFPW Trend-Free Prewhitening Test VIF Variance Inflation Factor
Abstract
This study attempted to investigate climate variability and to understand the association of climate variables with crop yield in seven zones of the Amhara Region. Time series data on two climatic variables were obtained from the National Meteorological Agency of Ethiopia between 1987 and 2016. Crop production data of two major crops for the main cropping season (Meher) were collected for the period 1997-2015 from the Central Statistical Agency. The data were analyzed using different packages of RStudio Version 1.2.5 software. Coefficient of Variation and Precipitation Concentration Index were applied to analyze the variability in the seasonal and annual rainfall and temperature. Further, Modified Mann–Kendall trend analysis methods were used for the analysis of temperature and rainfall trends and ordinary least square regression has been applied to analyze climate variables impact on crop yield. The finding of this study shows that the rainfall in the region has irregular monthly distribution and less to moderate interannualvariability. Further, Belg rainfall showed more interannualvariability than
Kiremt rainfall whereas both interannualmaximum and minimum temperature showed less
variability in the region. The study also revealed that the annual and seasonal rainfall showed mixed upward and downward trends. The annual maximum temperature has significantly increased in all stations whereas, the annual minimum temperature showed a significant upward trend in only two stations. The impact of Kirmet and annual minimum on crop yield vary across different crops and zones the annual rainfall and maximum temperature have positively contributed to the growth of crop yield. Generally, the OLS analysis revealed that different crop varieties are affected by climate variables differently. Therefore, an intervention designed to adapt to the impact of climate variables on crop yield should be context oriented. Keywords Temperature, Rainfall, Crop Yield, Climate Variability, Amhara
1. Introduction
1.1. Background of the Study
Thermometer data showed a global temperature increase of nearly 1 °C over the past 150 years since the preindustrial period (Jones et al., 2010). It is further estimated that the average seasonal temperature will rise between 1°C and 2°C by 2050, with an average increase of 1.4°C (Rowhani et al., 2011). Moreover, according to the prediction by the Intergovernmental Panel on Climate Change (IPCC), there will be more hot and fewer cold temperature extremes in many parts of the world as global average temperatures increase both on daily and seasonal time scales (IPCC, 2014). The report also shows that susceptibility of human systems and ecosystems to current climate variability and climate-related extremes, such as heatwaves, droughts, floods, cyclones, and wildfires has increased. A study shows that worldwide due to climate change an additional 10-20% of the population will be at risk of hunger by 2050 (Workeneh et al., 2017). Climate change impact on developing countries would be severe in the future as the temperature continues to rise and precipitation becomes more unreliable (Ochieng et al., 2016). Unlike non-climatic factors such as access to farm inputs, land quality, tenure security, infrastructure which can be managed by farmers or the government, rainfall and temperature are not under direct control (Lemi, 2005; Alemayehu and Bewket, 2016). The impact of climatic variability on agricultural production is particularly severe in countries where rain-fed agriculture is the main source of livelihood (Joshi et al., 2011; Ochieng et al., 2016). Africa in this regard is expected to experience adverse climate change impacts, particularly as a result of an increase in temperatures and decreased and more erratic rainfall (Asfaw et al., 2018). As the amount of irrigated agricultural land is very low, agricultural production in Sub-Saharan Africa (SSA) depends on favorable weather conditions mainly during the rainy season (Dhakal et al., 2016). Moreover, Sub- Saharan African countries with primarily rural economies and low levels of livelihood diversification are at greater risk. In SSA a majority of the population depends on rain-fed agriculture and the capacities (technological, financial, political, and social) both at national and local levels to respond to climate calamities are low (Adamgbe and Ujoh, 2013). This combined with the already prevalent poverty and low economic development makes the consequences very substantial. For instance, a study in Kilimanjaro, Tanzania revealed that more than 80% of the economies of the households surveyed have been affected by rainfall variability, deteriorating the food security situation in the study area (Afifi et al., 2014).
Similar impacts on crop production are expected in Ethiopia (Alemayehu and Bewket, 2016), characterized by irregular rainfall patterns, where rainfall variability and associated droughts have historically been major causes of food shortages and famine (Bewket, 2009; Ayalew et al., 2012; Matewos 2019). While agriculture is the main basis of the economy which supports roughly 42% GDP is responsible for 85% of the employment, the sector is highly susceptible to climate variability and extremes (Conway and Schipper, 2011). Moreover, the influence of climate change on smallholder farmers is extreme and they own the largest share of agriculture land and production in Ethiopia. The situation is further exacerbated by the use of little modern agricultural inputs, traditional rain-fed farming, little surplus to sell in local markets, and low-level adaptation mechanisms (Matewos, 2019). Again, these factors reduce the adaptive capacity increasing the susceptibility of farmers to future climate change and climate-induced disasters, which adversely affect the functioning of the already fragile agriculture (Deressa et al.,2011).
Amhara regional state is one of the regions which has been frequently affected by drought, particularly agricultural drought (Bewket and Conway, 2007). Although the region constitutes more than 30% of total crop production of the country and 50% of the total area in the region is considered to arable land, irrigated agriculture is negligible in the Amhara regional state (Ayalew et al., 2012). Due to this, droughts often translate into food shortages and famines (Bewket and Conway, 2007). Bewket (2009) indicated that there is a strong association between cereal production and rainfall in the region, as a result, farmers are vulnerable to food- insecurity related to rainfall variability. However, irrespective of the huge climate variability in the region and its impact on the agricultural crop, the relationships between rainfall and temperature variability and agricultural production at the regional level have not been studied in detail. Hence, this study was conducted to assess the association between the crop yield and climate variables (rainfall and temperature) in Amhara Region, Ethiopia.
1.1. Problem Statement
Several papers on climate change in Ethiopia have given more emphasis on investigating the perception of farmers towards climate change and/or their adaptation to climate change in different parts the country (Conway and Schipper 2011; Deressa et al.,2011; Legesse et al., 2012; Debela et al., 2015; Belay et al., 2017; Esayas et al., 2019). Other authors examined climate variability, specifically the variation and the trend in both temperature and rainfall
(Gutu et al., 2012; Asfaw et al., 2018), while, some were limited to one parameter i.e. rainfall (Lemi, 2005; Segele and Lamb, 2005; Ayalew et al., 2012). Although most literature agreed on the increasing trend in the average monthly and annual temperatures throughout Ethiopia (Gutu et al., 2012; Debela et al., 2015; Workeneh et al., 2017; Asfaw et al., 2018), the findings on rainfall trends show different results.
Some studies that are conducted in different parts of Ethiopia found an inconsistent trend in the annual and seasonal rainfall over the past decades (Bewket, 2009; Ayalew et al., 2012; Gutu et al., 2012). However, Brown et al. (2017) found consistent monotonic rainfall distribution in different parts of Ethiopia. i.e. there have been declines in summer rainfall across central and eastern Ethiopia, conversely, northern Ethiopia has received increased summer period rainfall. Therefore, additional findings on rainfall trend analysis are needed to further complement these findings and condense the mix-up in the literature. This work attempted to examine the rainfall trend in the Amhara region and contribute to fill this gap in the literature. Moreover, this study considered both temperature and rainfall, unlike some other papers which only consider one climate parameter.
Apart from rainfall and temperature trend analysis, many authors (Lemi, 2005; Bewket, 2009; Legesse et al., 2012; Araya et al.,2015; Alemayehu and Bewket, 2016; Brown et al., 2017) have attempted to analyze the impact of rainfall and temperature variables on crop production at the national and regional scale. However, the rainfall and temperature data and the time covered by most studies are outdated. For instance, the following paper considers the period between 1954-1994, 1975-2003, 1980 – 2009 (Lemi, 2005; Bewket, 2009; Araya et al.,2015), as a result, there is a time gap between the studies that have been conducted and the current rainfall and temperature trend and its impact on crop yield. Hence, our study considered relatively recent period time intervals i.e. 1987-2017.
In addition to these, none of the above studies have employed econometric techniques with its assumptions to examine the effects of climate variables on crop yield in the context of the Amhara region and Ethiopia. As a result, these studies might have produced spurious results due to inaccurate model estimation. Therefore, our study employed ordinary least square regression econometric techniques and all the required assumptions that are compulsory to use the method were assessed. Furthermore, different crop varieties are affected by climate variables differently (Deressa et al., 2005; Sarker et al., 2012; Poudel and Shaw, 2016; Ochieng
et al., 2016), thus, crop variety-specific research is recommended to devise better policy implications (Sarker et al., 2012). Consequently, climate variables impact on specific crops (Teff and Barley) were investigated.
Moreover, some studies have treated the whole country as one basket despite the huge variation existing across regions and climatic zones (Lemi, 2005; Admassu, 2004). Further, it is highly recommended to conduct studies that are focused at the local or regional level as there is huge ecological and administrative division variation between different parts of the country (Lemi, 2005; Joshi et al., 2011). Therefore, taking into account the climate variation between different regions, this paper considered only one region and analysis of climate trends and the relationship between crop yield and climate variables were done for each zone of the Amhara region separately.
1.2. The Objective of the Study
This study aimed to analyze the variability and trend of rainfall and temperature at annual and seasonal time scales and examined the impacts of rainfall and temperature on crop yield in the Amhara region.
The specific objectives were
i) Examine annual and seasonal rainfall and temperature variability ii) Examine annual and seasonal rainfall and temperature trend
iii) Assess the relationship between rainfall and temperature variables and crop yield in the region
1.3. Significance of the Study
This study could serve as a bridge in providing some insight and knowledge about climate variability and the impact of climate variables on crop yield in Ethiopia in general and the Amhara region in particular. Moreover, the findings can be used as baseline information for researchers who want to make further investigation in this regard. Further, it could help the local governments to adopt an appropriate climate change adaptation mechanism to respond to the uncertain and variable rainfall and temperature. Finally, NGOs and policymakers could benefit from this research to initiate projects that can mitigate the impact of climate variables on crop production
2. Literature Review
2.1. Tools and Techniques of Climate Variability Analysis
Several methods have been designed to analyze the rainfall and temperature trend and variability. According to Asfaw et al. (2018) variability analysis involves the use of Coefficient of Variation (CV), percentage departure from the mean (Anomalies), and Precipitation Concentration Index (PCI), while trends can be estimated through different parametric and non-parametric tests only for consistent data. Among the non-parametric techniques, the Mann- Kendall (MK) test is the most commonly used test to assess monotonic trends (increasing or decreasing) in series of environmental data, climate data, or hydrological data (Asfaw et al.,2018). Hence, various studies employed the Mann–Kendall test to evaluate the presence of trends in both annual temperature and rainfall data (Abrha and Simhadri, 2015; Esayas et al.,2019). Further, the Sen's slope estimator (SSE) is used to estimate the magnitude of the trends in the time series data (Ayal and Leal Filho, 2017; Esayas et al.,2019).
Furthermore, depending on the objective of the research, simulation, and regression models can be used to estimate the effects of climate variables on crop productivity and yield (Joshi et al., 2011). Various studies used regression models to estimate climate variables impacts (Joshi et al., 2011; Adamgbe and Ujoh, 2013; Alemayehu and Bewket, 2016; Poudel and Shaw, 2016; Panda et al., 2019). Regression analysis is used to predict the effect of the independent variables upon the predicted variable, the variable that is influenced (Panda et al., 2019). For example, a multi-linear regression analysis can be used to assess the impact of climate variables precipitation and temperature on crop yields such as Maize, Rice, Wheat, and Millet (Poudel and Shaw, 2016). Bewket (2009) also used regression to examine relationships between monthly and seasonal rainfall and crop production. In addition to the use of the exact statistical method of analysis, it is recommended to consider more than 30 years to study the impact of climate variables on yields of the food crops (Joshi et al., 2011).
2.2. Crop Production in Ethiopia
Agriculture contributes a remarkable proportion to the gross domestic product (GDP) and 85% of the population is engaged in the sector (Abeje and Alemayeh, 2019). Crop production accounts for more than 65% of the agricultural GDP (Abeje and Alemayeh, 2019). Cereal production, in particular, constitutes 60, 80, 40, and 60% of rural employment, total cultivated land, a typical household food expenditure, and total caloric intake (Nigus et al., 2019). Pulses
are the second most important crop group next to cereals in terms of acreage, with total production estimated 1.5 million tons per year, which is 8.5 percent of total crop production (Taffesse et al., 2013). Oilseeds form the third most important crop group. However, cereals are the country's major food crops and significant determinants of Ethiopia's food security. The dominant cereals grown in Ethiopia are Teff (Eragrostis tef Zucc), Maize (Zea mays L.), Sorghum(Sorghum bicolor L.), Barley (Hordeum vulgare L.), Wheat (Triticum spp.) and Millet (Eleusine coracana L.) (Evangelista et al., 2013). Apart from cereals, Enset (Ensete
ventricosum Welw), and false banana are among roots and tubers which provide calorie
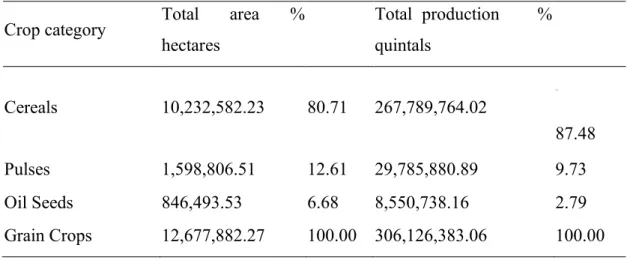
requirements in the Ethiopian diet (Abate et al., 2015). The CSA (2018) survey indicated that a total of 12.67 million hectares of the land area were covered with grain crops i.e. cereals, pulses, and oilseeds.
Table 1. Total Area and Production of Grain Crops 2017/18, Meher Season
Crop category Total area %
hectares Total production % quintals Cereals 10,232,582.23 80.71 267,789,764.02 87.48 Pulses 1,598,806.51 12.61 29,785,880.89 9.73 Oil Seeds 846,493.53 6.68 8,550,738.16 2.79 Grain Crops 12,677,882.27 100.00 306,126,383.06 100.00 Source: CSA (2018)
Out of the total grain crop area, 80.71% of hectares were under cereals. Teff, Maize, Sorghum, and Wheat took up 23.85%, 16.79%, 14.96%, and 13.38% hectares of the grain crop area, respectively (CSA, 2018). Teff is a native crop to Ethiopia and used primarily for making the traditional staple food called Injera. The north-central region of Ethiopia is a suitable range for Teff production (Evangelista et al., 2013). Maize is the second most common cereal grown and accounts for 36 % of all the grain production and its production is highest in the northwest region of the country (Evangelista et al., 2013). Whereas, the central and north-western border of Ethiopia is favorable for the production of Sorghum.
Though the country is one of the largest cereal producers in Africa, it is still a net importer to meet food demands (Abate et al., 2015). To boost crop production and productivity the government has set ambitious agricultural development programs and activities. The development and release of better crop varieties accompanied by complementary technologies, providing credit and extension services to foster the diffusion of better technologies, and improving the use of fertilizer are among the major actions taken by the government so far (Jaleta et al., 2018). For instance, the area covered by fertilizer used and the extent of area covered as a share of the total crop area has boosted from 6.74 to 8.18 million hectares from 2011 to 2015 (Shita et al., 2018). As a result, in the past decade crop productivity and production have shown progress, unlike the 90s where it remained low and variable in many regions of the country (Abate et al., 2015).
2.3. Climate Parameters and their Trends around the Globe
Temperature and precipitation pattern distribution are the most widely used climate variables to determine climate change and its effect on agriculture (Joshi et al., 2011). A study conducted in Nepal noted that rainfall patterns are characterized by erratic and fluctuating distribution during the study period (Dhakal et al., 2016). Poudel and Shaw (2016) also found out a decreasing trend in winter precipitation and an increasing trend in summer precipitation in the Lamjung District of Nepal. Unlike the rainfall pattern, the annual mean temperature, maximum temperature, and minimum temperature in Nepal have been steadily increasing (Dhakal et al., 2016). Similarly, in Ethiopia, the trend in temperature showed a steady increase while rainfall has shown high variation since the 1960s (Alemayehu and Bewket, 2016). On the contrary, a study in Tanzania claimed that the annual rainfall shows a slight variation in the 1970s but has been decreasing consistently throughout the past three decades (Afifi et al., 2014). Similarly, Longobardi and Villani (2010) emphasized that except for the summer period, the precipitation trend in Italy from the period of 1918–1999 appears to be consistent and largely negative both at the annual and seasonal scale.
2.4. Climate Variability and Trend in Ethiopia
Various studies reported that the temperatures in Ethiopia have been increasing, but the rainfall results are mixed in the country (Gutu et al., 2012; Debela et al., 2015; Workeneh et al., 2017; Asfaw et al., 2018). Matewos (2019) indicated that the minimum, maximum, and mean monthly temperature in Sidama, Ethiopia had shown increasing trends in the past three decades. A study conducted in north-central Ethiopia also indicated that the minimum monthly
temperature has increased and an overall increase in annual temperature was observed in the study area (Asfaw et al., 2018). Another study conducted in the southern region of Ethiopia indicated that temperature has shown a significantly increasing trend in the past two decades (Debela et al., 2015).
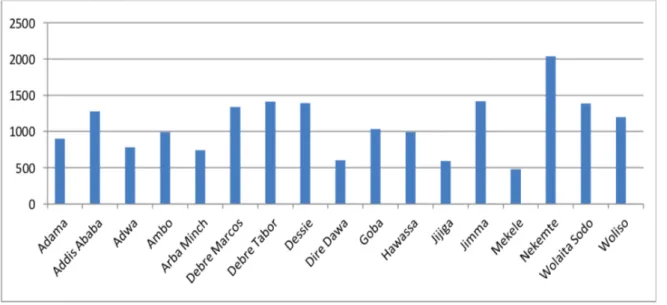
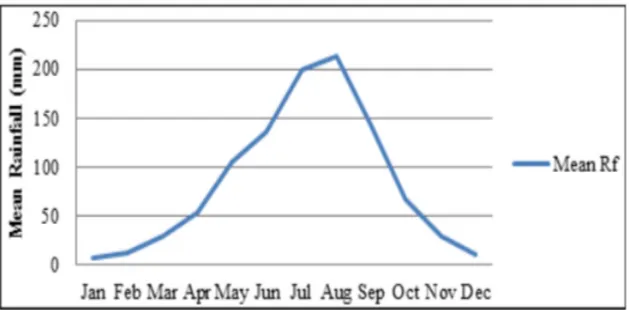
Regarding the rainfall pattern in Ethiopia only a few studies documented that it has been steadily increasing or decreasing. For instance, Matewos (2019) noted that the annual, Belg (March – April – May) and Kiremt (June -September) seasonal rainfall amounts have shown declining trends in Sidama, Ethiopia. Similarly, Debela et al. (2015) found a steady incremental trend in the rainfall amount across the two rainy seasons in the southern part of the country. The rainfall patterns in various parts of Ethiopia are often characterized by erratic, unreliable, and they display large variation across different parts of the country. Additionally, Conway and Schipper (2011) highlighted that many parts of Ethiopia experience high variation in terms of frequency, space, and volume of rainfall. For instance, Girma et al. (2016) studied the rainfall pattern in southwestern, Ethiopia and revealed that Setema displayed negative trends while Gatira showed positive trends for annual rainfall. As shown in figure 1, the overall average annual rainfall in Ethiopia ranges from 500 to 2000 mm (Lemma, 2015).
Figure 1. The Mean Annual Rainfall of the 17 Stations Between 2001-2008 Source (Lemma, 2015)
The western and north-western parts of Ethiopia receive the highest amount of annual rainfall, ranging from 1000 to 1200mm and 866.27 mm per year respectively (Ayalew et al., 2012;
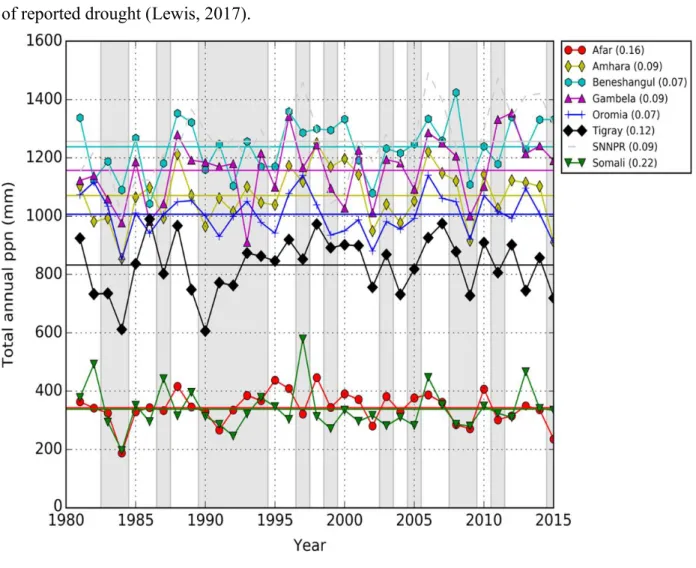
Workeneh et al., 2017). As it is displayed in figure 2, Tigray, Afar, and Somali regions of Ethiopia are the driest, and where low precipitation totals correspond most closely with periods of reported drought (Lewis, 2017).
Figure 2. Annual Average Rainfall over the different regions of Ethiopia with Coefficient of Variability.
Source Lewis (2017).
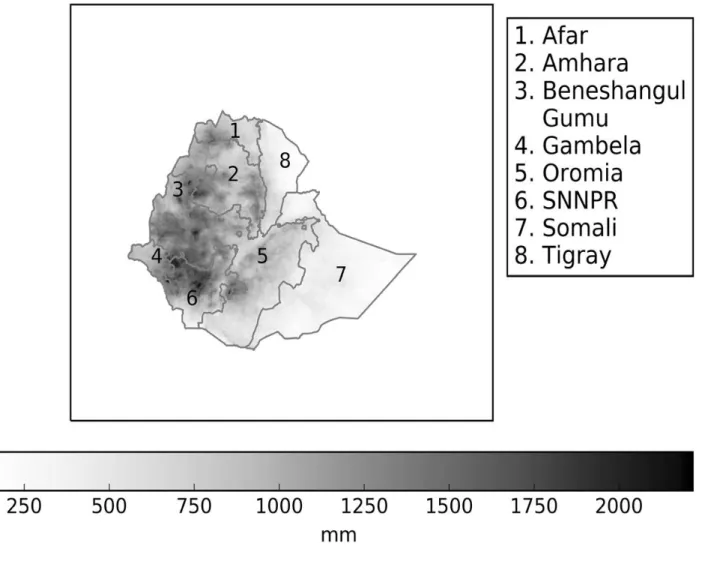
The southern, south-eastern, and central regions of the upper Awash basin area receive between 700 to 900 mm. Whereas, the lowland regions such as Afar and Gambela are often characterized by a short rainy season and they receive less rainfall. It’s not only the amount of precipitation that diverges in the country rather the duration of rainfall also fluctuates across different months and regions.
Figure 3. Average annual precipitation over Ethiopia for 1981–2015 climatology source Lewis (2017).
Kiremt rainfall onset begins around early March in the Southwest, June in the North, and
Mid-June in the Western part of the country (Segele and Lamb, 2005). In the Amhara region, Kiremt starts around June and lasts up to three to four months and it contributes more than 74.3% to the mean annual rainfall (Ayalew et al., 2012). Whereas, Belg (March – April – May) is the shortest rainy season and contributes around 21.50% to the annual total rainfall in this region. In the Southern Nation, Nationality, and People of Ethiopia (SNNP), the Belg and Kiremt seasonal rainfall accounts for 40% and 41% of the total annual rainfall respectively (Matewos, 2019). Other rainy seasons account for 19% of the total annual rainfall in the region. However, Asfaw et al. (2018) underscored that Kiremt rain constitutes 50–80% of annual rainfall totals in many parts of Ethiopia and it has a significant contribution to agricultural productivity. Segele and Lamb (2005) noted that variation also exists in terms of the growing season. For
instance, the beginning of the main rainy season in north-eastern Ethiopia is the latest countrywide and initiates the country’s shortest growing season.
Figure 4. Ethiopian Annual Cycle of Rainfall, 1970-2006: Northwest, West, and Southwestern Source Fekadu (2015)
Generally, although various studies have shown that daily minimum, maximum and mean monthly temperature have increased in the past decades (Gutu et al., 2012; Debela et al., 2015; Workeneh et al., 2017; Asfaw et al., 2018); there are mixed findings with regards to rainfall trends. Few studies found a steady and consistent rainfall trend in Ethiopia (Debela et al.,2015; Matewos, 2019). While other studies claimed greater variation in the rainfall trends in various parts of Ethiopia (Conway and Schipper 2011; Girma et al., 2016). The northern, northwestern parts of the country receive the highest rainfall amount whereas the southern, southeastern, and central regions of the upper Awash basin receive less rainfall (Ayalew et al., 2012; Workeneh et al., 2017).
2.5. Climate and Crop Yield Relationship
Changes in temperature and precipitation, and climate extreme events like droughts, floods, have a direct impact on crop yields (Alexandrov and Hoogenboom, 2001; Joshi et al., 2011). The same holds for CO2 concentrations. It is predicted at the global scale that agriculture will be adversely affected by climate change in 2020, 2030, and 2040 if climate change adaptation is not done (Ochieng et al., 2016). The impact of climate variability on agricultural production is certain at the local, regional, national, and global scale (Alexandrov and Hoogenboom, 2001). Numerous studies that are conducted on a wide range of regions and crops have
articulated that the negative impacts of climate change on crop yields have been significant (IPCC, 2014). Among the two most important climatic parameters (rainfall and temperature), rainfall has a tremendous impact on the yield of staple crops (Panda et al., 2019).
Globally, climate variability accounts for around 32–39% of the crop yield variation (Ray et al., 2015). It is estimated that in some African countries the agricultural crop yield could be decreased and this can jeopardize the existence of many smallholder rural farmers (Matewos, 2019). However, the effect on yield can vary across different crops (Poudel and Shaw, 2016). For instance, an increase in rainfall has a positive effect, but the increasing temperature has a negative effect on Maize crops and their revenues (Ochieng et al., 2016). Similarly, a study in Tanzania recognized that increases in temperature and intra-seasonal variability in precipitation have negatively affected Sorghum and Maize yields but surprisingly, increasing temperature variability over the same period has improved rice yields (Rowhani et al.,2011). Further, Panda et al. (2019) noted that rainfall deficit has negative impacts on both rice and Maize yield, but the impact on rice is seen to be higher than the impact on Maize yield. In Ghana, both rainfall and temperature trends are negatively related to Maize yield (De-Graft and Kweku, 2012). In Nigeria, the gradual delay in the onset of rainfall dates and shortening duration/number of annual rain days have led reduction to Maize yield per hectare (Adamgbe and Ujoh, 2013). Further, the impact could differ across different growing seasons. For instance, in the Lamjung District of Nepal, an increase in the temperature and decreases in the precipitation has negatively impacted winter crops such as Barley, whereas, the precipitation and temperature increases during summer has contributed positively to the yields of summer crops (Poudel and Shaw, 2016). Similarly, Conway and Schipper (2011) also found out that an increase in the amount of rainfall in Ethiopia had inconsistent and modest effects on yield.
However, the impact of climate variability on smallholder farmers can be minimized through local climate change adaptation strategies. For instance, a study conducted in the Rift Valley of Ethiopia indicated that farmers changed the crop planting dates and crop varieties to respond to climate variability and they migrated to the highland areas for some time in case of extreme drought (Belay et al., 2017). Further, livestock diversification, engaging in off-farm income activities, and rainwater harvesting were some of the adaptation strategies used by farmers of West Harerge of Ethiopia (Legesse et al., 2012). Weldegebriel and Prowse (2017) also studied different climate change adaptation strategies by smallholder farmers in north wollo of the Amhara region and they indicated that on-farm and off-farm livelihood diversification were
used as adaptation strategy mechanism to respond to climate variability and its impact. For instance, smallholders have started to harvest rainwater to irrigate land and to grow perennial crops and trees instead of cereals. But, Belay et al. (2017) argue that although these climate adaptation measures by the farmers can reduce the impacts it cannot entirely address the impacts of climate variability such as drought.
Besides the impacts on crop yield, climate variability could have other primary and secondary effects on humans and other ecosystems. Some of these impacts include climate-related epidemics, flooding, livestock mortality, shortage of water, and pasture or migration (Matewos, 2019). The cumulative effect of such climate shock will lead the affected community to fully rely on food aid. For instance, Belay et al. (2017) reported that livestock and crop production in the central rift valley of Ethiopia was disrupted as a result of late-onset of the main rainy season which makes it challenging to maintain food security of the local people. Hence, the majority of the local communities were obliged to rely on food aid programs from the government.
3. Methodology
3.1. Study Area
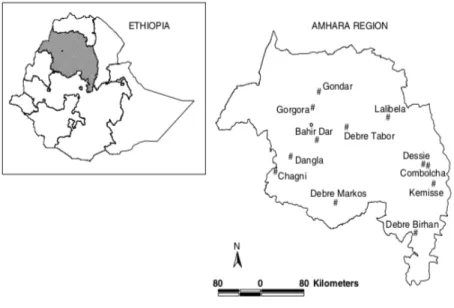
The Amhara National Regional State (ANRS) is located in northwest Ethiopia and the total area of the region estimated at 170,152 km, which is about one-sixth of the country's total area (Tsetadirgachew, 2016). The rural inhabitant constitutes 88.5% of the population, while 11.5% are urban (CSA and ICF, 2016). The region is divided into 12 administrative zones, 106 rural woredas, and 3231 kebeles. Geographically, the region is a source of Lake Tana and comprises a range of physical landscapes, featured by rugged mountains, plateaus, valleys, and gorges (Oswald et al., 2016). The elevations in the region range from 700 m a.s.l in the eastern part to over 4600 m a.s.l in the northwest (Ayalew et al., 2012). Around 31% of the region which is lying below 1500 m a.s.l are commonly classified as lowlands, (hot zone), the areas between 1500-2300 m a.s.l constitute around 44% are classified as Woyina Dega (cold-humid zone), and finally the areas between 2300-3200 m a.s.l which cover 25% of the region are classified as Dega (cold zone). The mean annual temperature in the low land ranges between 21-27 °C, while in the cold to very cold moist zone, the mean annual temperature varies from 7.5-16 °C (Tsetadirgachew, 2016).
Figure 5. The Amhara Region and Location of The Weather Stations Used in The Study Source (Bewket and Conway, 2007).
The region is characterized by irregular and uneven rainfall, high land degradation, high population density (Ayalew et al., 2012). Land degradation is caused by population pressure, intense grazing pressure, and torrential rains and drought are the major physical challenges to agriculture in the region (Bewket and Conway, 2007).
3.2. Data Source and Types
3.2.1. Climate Data
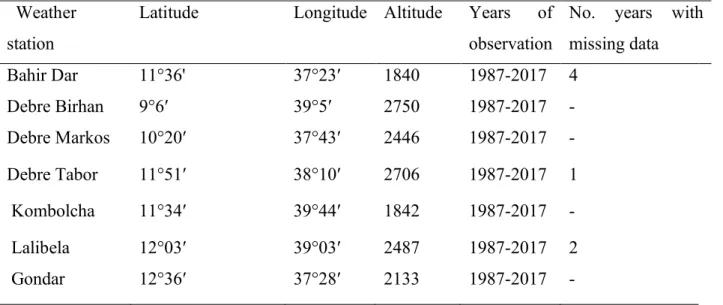
This study is based on climate data (rainfall and temperature) from Ethiopian National Meteorological Services Agency (NMA) weather stations across the Amhara region, Ethiopia. These climatic parameters are the most well-known variables considered by many studies in Sub-Saharan Africa and have the longest and largest data coverage in Ethiopia (Ochieng et al., 2016). World Meteorological Organization recommended a minimum of 30 years of historical data to detect trends in the climatic study (Abrha and Simhadri, 2015; Birara et al., 2018). Therefore, relatively long temperature (°C) and rainfall (mm) records from 1987 to 2017 were collected for seven weather stations of the Amhara region, with a reasonably good geographic distribution to cover the study area. The stations were chosen based on the length of the record period and the completeness of the data. Monthly rainfall, maximum, and minimum temperature data were collected from each zonal station. The seasonal and annual total rainfall, maximum, and minimum temperature were then calculated from the monthly data of those stations. One limitation of the weather data used in this study was that some stations have monthly and yearly missing data. However, such cases were handled by taking the average of the preceding and succeeding months (for monthly missed data) and excluding years with missing data from analysis (Asfaw et al., 2018).
Table 2. Details of Weather Stations Used for the Study Weather
station
Latitude Longitude Altitude Years of
observation
No. years with missing data Bahir Dar 11°36' 37°23′ 1840 1987-2017 4 Debre Birhan 9°6′ 39°5′ 2750 1987-2017 - Debre Markos 10°20′ 37°43′ 2446 1987-2017 - Debre Tabor 11°51′ 38°10′ 2706 1987-2017 1 Kombolcha 11°34′ 39°44′ 1842 1987-2017 - Lalibela 12°03′ 39°03′ 2487 1987-2017 2 Gondar 12°36′ 37°28′ 2133 1987-2017 - 3.2.2. Crop Data
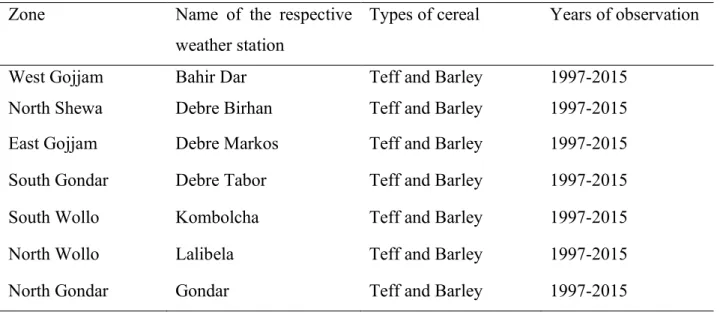
The crop data aggregated at the level of the zonal administrative level was collected from the Central Statistical Authority. The same seven zones of the Amhara region where the climate data collected were included in the study. This is to explore crop yield and climate variables relationship at each zonal level. Cereal crops including Teff, Barley, Maize, Wheat, and Sorghum account for 60 and 80% of rural employment, total cultivated land respectively (Nigus et al., 2019). It also accounted for a yearly average of 12 million tons, which is 68 percent of total agricultural production at the national level (Taffesse et al., 2013). Further, Bewket (2009) indicates that cereals are the most significant type of crops and occupy the largest area in the Amhara region. Barley and Teff being the most important cereal crops among others were selected for this study. Accordingly, the available data from the period 1997 to 2015 were collected from the Central Statistical Agency of Ethiopia. Therefore, Barley and Teff production for these periods in terms of harvested area (ha), production in quintal (qt), and yield (qt/ha) were collected. According to Alemayehu and Bewket (2016), the contribution of short rainy (Belg) season is not significant to the annual total production in the region. Further, around 90% of the total cultivated land in the Amhara region is cropped during the Meher season (Bewket, 2009; Workeneh et al., 2017). Therefore, 18 years of time series data from the seven zones of the Amhara region on the total production of the two crops for the main cropping season, locally known as Meher (between September and February) were considered for this study. So, Belg production was ignored for this study.
Table 3. Details of Zonal Administration and Respective Weather Station Used for Crop Yield and Climate Variable Relationship Analysis
Zone Name of the respective
weather station
Types of cereal Years of observation
West Gojjam Bahir Dar Teff and Barley 1997-2015
North Shewa Debre Birhan Teff and Barley 1997-2015
East Gojjam Debre Markos Teff and Barley 1997-2015
South Gondar Debre Tabor Teff and Barley 1997-2015
South Wollo Kombolcha Teff and Barley 1997-2015
North Wollo Lalibela Teff and Barley 1997-2015
North Gondar Gondar Teff and Barley 1997-2015
3.3. Method of Analysis
Descriptive statistical tools such as, mean, percentages, standard deviations, coefficient of variation, and precipitation concentration index were used to summarize and compute the variability of rainfall, temperature, and crop production data. Further, multiple linear regression using ordinary least squares (OLS) method of estimation and Mann-Kendall trend test were employed to determine the association between crop yield and climate variables and the seasonal and annual climatic variable trends respectively.
Different packages of RStudio Version 1.2.5 software were used to analyze the data in this study. Precipitation Intensity, Concentration, and Anomaly Analysis ('Precintcon’) package were used to analyze Precipitation Concentration Index (PCI) and Modified Versions of Mann Kendall (‘modifiedmk’ ) package were used to detect the trend of seasonal and annual rainfall and annual maximum and minimum temperature. The coefficient of variation for seasonal and annual rainfall and annual maximum and minimum temperature for each station was calculated on RStudio using the CV formula. Several techniques that are used to analyze climate variability, trend analysis, and the relationship between crop and climate variables are discussed in detail in the following sections.
3.3.1. Rainfall and Temperature Variability
A number of rainfall and temperature analysis techniques have been developed so far, which fall into variability and trend analysis classification (Asfaw et al., 2018). This study has
employed the Coefficient of Variation (CV) to determine interannualvariability of rainfall and temperature for the selected zonal station. Coefficient of variation for rainfall and temperature can be calculated as the ratio of the standard deviation to the mean i.e., standard deviation divided by the mean of maximum temperature (ATmax), annual minimum temperature (ATmin), and annual total rainfall (ATR), respectively (Asfaw et al., 2018; Esayas et al., 2019).
i.e. CV is the coefficient of variation; σ is the standard deviation and μ is the mean Eq. (1)
(Asfaw et al., 2018). According to Asfaw et al. (2018), the degree of variability can be classified into low (CV < 20), moderate (20 ≤ CV ≤ 30), and high (CV > 30). A higher value of CV refers to larger variability, and vice versa.
𝐶𝑉 =𝜎
µ∗ 100 (1)
Further, a modified version of Oliver’s (1980) Precipitation Concentration Index (PCI) were used to examine the variability of rainfall for each studied station and each year throughout the study period. The Precipitation Concentration Index formula can be obtained from Eq. (2) (Workeneh et al., 2017). 𝑃𝐶𝐼𝑎𝑛𝑛𝑢𝑎𝑙 = [ ∑ ∗ 12 𝑖=1 𝑃𝑖2 (∑12𝑖=1∗𝑃𝑖)2] ∗ 100 (2)
where Pi is the rainfall amount of the ith month, and Σ is the summation over the 12 months. Table 4. Interpretation of PCI Results
PCI value Interpretation
<10 Uniform distribution of precipitation (Low concentration)
11-16 Moderate distribution of precipitation (Moderate concentration)
16-20 Irregular distribution of precipitation (High concentration)
>20 Strong irregularity of precipitation distribution (Very high
concentration) Source (Birara et al., 2018)
3.3.2. Rainfall and Temperature Trend Analysis
Rainfall and temperature trend analysis can be done through different parametric and non-parametric tests. Non-non-parametric statistical tests are more suitable over the non-parametric test for non- normally distributed, outlier, censored, and missing data, which are common in time series climate data (Asfaw et al., 2018). Mann- Kendall (MK) trend test is one of the non-parametric tests used to detect monotonic trends in a series of environmental data, hydrological, and climate data. It is less sensitive to outliers and helps to test the hypothesis of no trend versus the alternative hypothesis of the existence of an increasing or decreasing trend (Mann, 1945; Girma et al., 2016). In the MK test, the null hypothesis (H0) indicates there has been no significance trend in rainfall/temperature over time and alternate hypothesis (H1) denotes there has been a significance increasing or decreasing trend in the series. Trend analysis was carried out for annual maximum and minimum temperature and seasonal and annual rainfall at each station level.
Therefore, Mann- Kendall was used in this study to detect the trend and estimate the magnitude of the trends in the time series data of rainfall and temperature. However, Yue and Wang (2002) stated that for time series data with short record length (n <50) the presence of positive serial correlation can increase the possibility of rejecting the null hypothesis, while negative serial correlation will decrease the rejection rate. Therefore, before the Mann-Kendall test was applied, the autocorrelation (serial correlation) test was conducted using the autocorrelation function (ACF) on R studio. The sample size, the magnitude of serial correlation, and the magnitude of the trend are determinants for positive/negative serial correlation on the MK test (Yue and Wang, 2002). Following the autocorrelation function (ACF) test, if the the lag-1 serial correlation coefficient exceeds the upper or lower limits, the data have an autocorrelation problem, therefore, the trend-free pre-whitening (TFPW) approach is recommended (Fathian et al., 2016). Whereas, if the lag-1 serial correlation coefficient stays below the upper or lower limits, the data doesn’t have an autocorrelation problem. Therefore, for the data that are not significantly serially correlated, the Mann-Kendall trend test of time series data without modifications was used. On the contrary, for serially correlated data, Mann-Kendall trend-free pre-whitening time series data in the presence of serial correlation approaches were used (Yue et al., 2002; Fathian et al., 2016).
3.3.3. Crop Yield and Climate Variability Relationship
Correlation, regression, and simulation models have been widely used to determine the climate-crop yield relationship (Joshi et al., 2011; Adamgbe and Ujoh, 2013; Alemayehu and Bewket, 2016; Poudel and Shaw, 2016; Panda et al., 2019). Pearson’s correlation coefficient used to measure the strength of the relationship between crop yield and climatic variability. The range of correlation coefficients is -1 to +1, where -1or +1 refers to complete dependency between two variables, and 0 represents the complete independence of the variables (Poudel and Shaw, 2016).
Though simulation and regression models can be used to estimate the effects of climate variables on crop productivity, regression models that use time series data on both climate variables and yields are more efficient of providing accurate estimates of the changes in crop yield as a result of changes in climate variable ( Lobell and Field, 2007; Joshi et al., 2011; Sarker et al., 2012). Regression analysis is used to assess the quantitative effect of the independent or underlying variables upon the dependent variable, the variable that is influenced (Panda et al., 2019). Multiple linear regression (Ordinary Least Square) model was used in this study to determine the effect of climatic variables, specifically rainfall (seasonal and annual rainfall totals) and temperature (maximum and minimum) on each crop and zone. The regression model for a single crop in a given zone can be calculated using Eq (3).
Ywt= 𝛼 + 𝛽1𝑥1𝑤𝑡 + 𝛽2𝑥2𝑤𝑡+ 𝛽3𝑥3𝑤𝑡+ 𝛽𝑛𝑥𝑛𝑤𝑡+ 𝜀𝑡 (3) where
Ywt=the value of the dependent variable (crop yield) in zone w in year t; α = intercept
β1, β2, β3….. βn= regression coefficients
x1, x2, x3…..xn =the independent variables (seasonal and annual rainfall totals, and minimum and maximum temperatures total).
εt= the error term
Many studies have used log-transformed data while estimating climate variables effect on crop yield, this helps to avoid potential cases of heteroscedasticity and improves the distribution of variables (Blanc, 2012; Sarker et al., 2012; Verón et al., 2015). Therefore, we first log-transformed crop yield and climate variables data before employing the OLS method. Further,
it is highly recommended to check the presence of multicollinearity, heteroscedasticity, and endogeneity problems in ordinary least square (OLS) model estimation (Wosene et al., 2018) As a result, all ordinary least square assumptions were checked before reporting the result. Multicollinearity problems occur when there is a linear correlation among the independent variables and it becomes difficult to identify the separate effect of explanatory variables on the dependent variables (Wosene et al., 2018). Multicollinearity problems among explanatory variables could be checked using the Variance Inflation Factor (VIF) (Batho et al., 2019). VIF greater than 10, indicates high collinearity among variables (Wosene et al., 2018). Besides, heteroscedasticity test was carried out in the study. The Breusch-Pagan-Godfrey test was used to check for heteroscedasticity. Heteroscedasticity is the violation of the homoscedasticity assumption and when it occurs the ordinary least square estimates become inefficient. As a result, it might lead to false conclusions on the significance of certain variables.
4. Result
4.1. Annual and Seasonal Rainfall Patterns and Variability
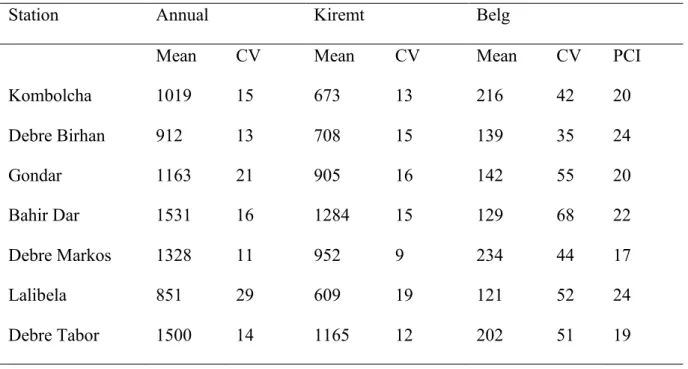
The annual total rainfall in the study areas of the Amhara region varies from 851 mm in Lalibela to 1531 mm in Bahir Dar. Debre Birhan and Lalibela stations have experienced less than 1000 mm average annual rainfall in the study period. Whereas, five stations (Gondar, Debre Markos, Bahir Dar, Debre Tabor, and Kombolcha) received above 1000 mm of mean annual rainfall. The maximum mean annual Kiremt rainfall in our study was recorded in Bahir Dar and Debre Tabor respectively. Kiremt seasonal rainfall (June -September) provides a substantial amount of rain for the total annual rainfall and Belg rainfall (March to May) contribution to the annual rainfall is less significant (Table 4). The Coefficient of Variation (CV) of annual rainfall in the region ranges between 11 in Debre Markos to 29 in Lalibela. This shows that the rainfall pattern in the region is characterized by low to moderate interannual rainfall variability. In comparison to Kiremt rainfall, the Belg seasonal rainfall in all stations has shown a high coefficient of variation which implies a higher rainfall variability than that of the Kiremt seasonal rainfall. In terms of rainfall concentration, only Debre Markos station has experienced high rainfall concentration (PCI=17), whereas all the remaining stations have a PCI value of more than 20, which refers to very high rainfall concentration. This shows that the annual rainfall in the region has been more erratic and irregular.
Table 5. Annual and Seasonal Rainfall (mm), Coefficient of Variation, Precipitation Concentration Index (PCI), 1987-2017
Station Annual Kiremt Belg
Mean CV Mean CV Mean CV PCI
Kombolcha 1019 15 673 13 216 42 20 Debre Birhan 912 13 708 15 139 35 24 Gondar 1163 21 905 16 142 55 20 Bahir Dar 1531 16 1284 15 129 68 22 Debre Markos 1328 11 952 9 234 44 17 Lalibela 851 29 609 19 121 52 24 Debre Tabor 1500 14 1165 12 202 51 19
4.2. Annual Minimum and Maximum Temperature Variability
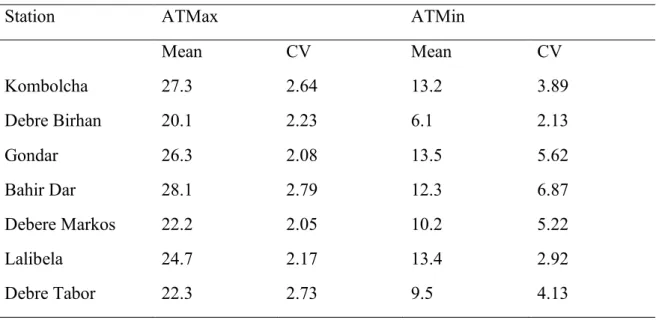
As shown in table 5, the highest mean annual maximum temperature in the region (28.1°C) was recorded in Bahir Dar station, which was higher by 8 °C than the relatively low annual maximum temperature in the Debre Birhan (20.1°C). Whereas, the annual minimum temperature in the Amhara region ranges between 6.1°C and 13.5°C in Debre Birhan and Gondar station respectively. The interannual maximum temperature in the region is characterized by less variability with the coefficient of variation between 2.05 in Debre Markos to 2.79 in Bahir Dar. Similarly, the annual minimum temperature coefficient of variation showed less variability ranging between 2.13 to 6.87. However, except Debre Birhan, the remaining stations have higher CV in annual minimum temperature compared to their annual maximum temperature. This shows that both maximum and minimum temperature interannual variability in the region is quite low.
Table 6. Annual Mean Maximum and Minimum Temperature (°C) and Coefficient of Variation, 1987-2017
Station ATMax ATMin
Mean CV Mean CV Kombolcha 27.3 2.64 13.2 3.89 Debre Birhan 20.1 2.23 6.1 2.13 Gondar 26.3 2.08 13.5 5.62 Bahir Dar 28.1 2.79 12.3 6.87 Debere Markos 22.2 2.05 10.2 5.22 Lalibela 24.7 2.17 13.4 2.92 Debre Tabor 22.3 2.73 9.5 4.13
4.3. Rainfall Trend Analysis
The results of the Mann–Kendall test and the Sen’s slope for the variation of annual total rainfall (ATR) and seasonal (Belg and Kiremt) rainfall from 1987 to 2017 in seven-station of Amhara region is presented in table 6. Autocorrelation was checked before selecting the appropriate modified MK test, i.e. Lalibela Kiremt rainfall has showed negative significant autocorrelation and Gondar Kiremt and annual rainfall data have shown a positive significant autocorrelation. The remaining stations have shown no significant autocorrelation,
therefore, the Mann-Kendall trend test of time series data without modifications was used. For the data with positive or negative significant autocorrelation, Mann-Kendall trend-free Pre-whitening time series data in the presence of serial correlation approach was used (Yue et al., 2002). The MK result includes Sen slope which refers to the rate of rainfall decrease or increase in mm/year and the value is the significance level at 1 %, 5 %, and 10 %. Hence, if the p-value is ≤ to the significance level (α = 0.1, 0.05, 0.01), the null hypothesis (Ho) will be rejected and the alternative hypothesis (H1) will be accepted. Rejecting Ho means that there is a significant trend in the time series data. On the contrary, accepting Ho indicates that no significant trend has been detected.
Table 7. Mann–Kendall Rainfall Trend Analysis at Different Stations, 1987-2017
Note: ** statistically significant at 0.05 significance level.
The result revealed that except Kiremt and Annual rainfall in Debre Birhan station that has shown an increasingly significant trend at a rate of 6.3 and 5.3 mm/year respectively at 5% level of significance, all the stations annual and seasonal rainfall didn't show a significant trend. Gondar and Bahir Dar stations are experiencing insignificant increasing annual rainfall trends at a rate of 2.3 mm/year and 5.89 mm/year respectively whereas, the remaining stations have shown an insignificant decreasing annual trend. The Belg seasonal rainfall showed a non-significant increasing trend in Debre Tabor, Debre Markos, and Gondar stations at a rate of 2.38 mm, 1.55 mm, and 1.01 mm per year respectively, all the remaining stations are experiencing a non-significant downward trend. Whereas the Kiremt seasonal rainfall showed
Station Belg Kiremt ATR
Sen Slope (mm) p value Sen
Slope(mm) p value Sen Slope(mm) p value Debre Birhan -0.12 0.914 6.3** 0.041 5.3** 0.03 Debre Tabor 2.38 0.417 -2.04 0.736 -0.54 0.98 Lalibela -1.21 0.452 -1.48 0.691 -4.86 0.452 Bahir Dar -2.23 0.4719 7.8 0.385 5.89 0.535 Comobolcha -1.81 0.184 3.15 0.434 -3.64 0.376 Debre Markos 1.55 0.443 -2.21 0.45 -1.13 0.65 Gondar 1.01 0.47 0.39 0.85 2.3 0.617
a non-significant decreasing trend in Debre Tabor, Lalibela, Debre Markos station at a rate of 2.04 mm, 1.48 mm, and 2.21 mm respectively and increasing trend were noticed in the remaining stations. The annual rainfall and Kiremt rainfall at Bahir Dar station have shown the highest increasing trend in the region with 5.89 and 7.8 mm per year. On the other hand, Debre Tabor and Lalibela have experienced the highest decreasing trend in the annual and
Kiremt rainfall respectively. In addition to the MK test, the annual and seasonal rainfall trend
for 30 years is illustrated in figure 6, which shows that the seasonal and average annual rainfall pattern has been changing throughout time. The rate of change is indicated by the slope of the regression line in the equation. The figure also confirms the mixed increasing and decreasing trend in the seasonal and annual rainfall at different station in the study period.
y = -0.3988x + 145.69 R² = 0.0051 y = 7.8455x + 586.23 R² = 0.2414 y = 6.1493x + 816.74 R² = 0.194 0 200 400 600 800 1000 1200 1987 1988 1989 1990 1991 1992 1993 1994 1995 1996 1997 1998 1999 2000 2001 2002 2003 2004 2005 2006 2007 2008 2009 2010 2011 2012 2013 2014 2015 2016
Debre Birhan
Belg Kirmet Annual Linear (Belg) Linear (Kirmet) Linear (Kirmet)
y = 1.0068x + 125.72 R² = 0.0137 y = 1.3758x + 883,27 R² = 0.0046 y = 1.9168x + 113.,5 R² = 0.0056 0 200 400 600 800 1000 1200 1400 1600 1800 2000 1987 1988 1989 1990 1991 1992 1993 1994 1995 1996 1997 1998 1999 2000 2001 2002 2003 2004 2005 2006 2007 2008 2009 2010 2011 2012 2013 2014 2015 2016 2017
Gondar
y = -2.6223x + 258.13 R² = 0.0674 y = 2.6351x + 631.67 R² = 0.0311 y = -2.2666x + 1056 R² = 0.0188 0 200 400 600 800 1000 1200 1400 1987 1988 1989 1990 1991 1992 1993 1994 1995 1996 1997 1998 1999 2000 2001 2002 2003 2004 2005 2006 2007 2008 2009 2010 2011 2012 2013 2014 2015 2016 2017
Kombolcha
Belg Kirmet Annual Linear (Belg) Linear (Kirmet) Linear (Annual )
y = -2.1129x + 151.03 R² = 0.069 y = -0.0063x + 609.03 R² = 0.000009 y = 0.9902x + 837.3 R² = 0.0009 0 200 400 600 800 1000 1200 1400 1600 1800 1989 1992 1993 1994 1995 1996 1997 1998 1999 2000 2001 2002 2003 2004 2005 2006 2007 2008 2009 2010 2011 2012 2013 2014 2015 2016 2017
Lalibela
Belg Kirmet Annual Linear (Belg) Linear (Kirmet) Linear (Annual )
y = 1.8069x + 205.51 R² = 0.0253 y = -2.6778x + 995.05 R² = 0.0408 y = -2.9198x + 1374.9 R² = 0.0361 0 200 400 600 800 1000 1200 1400 1600 1800 1987 1988 1989 1990 1991 1992 1993 1994 1995 1996 1997 1998 1999 2000 2001 2002 2003 2004 2005 2006 2007 2008 2009 2010 2011 2012 2013 2014 2015 2016 2017
Debre Markos
Figure 6. Annual and Seasonal Rainfall Variation and Trends at Different Stations from 1987 to 2017
4.4. Temperature Trend Analysis
The results of the Mann–Kendall test for the trend of annual maximum and minimum temperature from 1987 to 2017 in seven stations of the Amhara region are depicted in table 7. The same autocorrelation test procedure was applied for temperature, as a result, the annual maximum temperature in Kombolcha and Debre Tabor, the annual minimum temperature in Debre Markos, and both annual maximum and annual minimum temperature in Bahir Dar have shown positive significant autocorrelation. Therefore, Mann-Kendall's trend-free pre-whitening time series data in the presence of serial correlation approach was used (Yue et al., 2002). While for the remaining stations temperature trend analysis, Mann-Kendall trend test of time series data without modifications was used.
y = -3.2926x + 170.03 R² = 0.0705 y = 6.7649x + 1199.4 R² = 0.0423 y = 4.5261x + 1474.8 R² = 0.0161 0 500 1000 1500 2000 2500
Bahir Dar
Belg Kirmet Annual Linear (Belg) Linear (Kirmet) Linear (Annual )
y = 3.0261x + 158.2 R² = 0.0576 y = -2.2679x + 11983R² = 0.0108 y = -1.707x + 1524.8R² = 0.0045 0 500 1000 1500 2000 2500 1 2 3 4 5 6 7 8 9 10 11 12 13 14 15 16 17 18 19 20 21 22 23 24 25 26 27 28
Debre Tabor
Table 8. Mann–Kendall Annual Maximum and Minimum Trend Analysis 1987-2017.
Stations ATMax ATMin
Sen slope (°C) p value Sen slope(°C) p value
Debre Birhan 0.027*** 0.002 -0.004 0.746 Debre Tabor 0.05*** 0.005 -0.007 0.323 Lalibela 0.03** 0.021 0.016 0.122 Bahir Dar 0.021* 0.086 -0.027 0.175 Komobolcha 0.051*** 0.0001 -0.009 0.42 Debre Markos 0.029*** 0.0011 0.025*** 0.0001 Gondar 0.044*** 0.00052 0.043*** 0.0005
Note: *, **, *** statistically significant at 0.1, 0.05 and 0.01 significance level.
The MK finding revealed that the annual maximum temperature has been significantly increasing in all stations. The highest maximum temperature increase was recorded in Kombolcha station with a 0.051°C increase per year, which is 0.5/decade. Whereas, Bahir Dar has shown the lowest increase (0.021 °C per year), which is 0.6/30 years at a rate of 0.2 /decade. The annual minimum temperature has significantly increased in Debre Markos and Gondar stations by 0.025°C/ year and 0.043°C/year respectively. Besides, the annual minimum temperature in Lalibela has shown a 0.016°C/year increase but a non-significant trend. Except for the three stations, the remaining stations have experienced a non-significant downward trend in the annual minimum temperature. Amongst all the stations, Debre Birhan station has shown the highest decreasing trend in the annual minimum temperature with 0.004°C decline. Furthermore, as shown in figure 7, the annual maximum temperature follows a linear trend of increase and it shows the recent years are warmer than the earlier years. Similarly, to the MK test, the figure 7 confirms that the minimum temperature showed increasing trend in only three station of Amhara region.
y = 0.0692x + 26.819 R² = 0.6506 y = -0.0552x + 12.722 R² = 0.3802 0 10 20 30 40 1987 1988 1989 1990 1991 1992 1993 1994 1995 1996 1997 1998 1999 2000 2001 2002 2003 2004 2005 2006 2007 2008 2009 2010 2011 2012 2013 2014 2015 2016 2017
Bahir Dar
y = 0.0223x + 19.564 R² = 0.2087 y = -0.0004x + 6.2594 R² = 0.00003 0 5 10 15 20 25 1987 1988 1989 1990 1991 1992 1993 1994 1995 1996 1998 1999 2000 1997 2001 2002 2003 2004 2005 2006 2007 2008 2009 2010 2011 2012 2013 2014 2015 2016 2017
Debre Birhan
AnnualMax AnnualMin Linear (AnnualMax) Linear (AnnualMin)
y = 0.0487x + 26.041 R² = 0.3912 y = -0.068x + 12.702 R² = 0.0162 0 5 10 15 20 25 30 1987 1988 1989 1990 1991 1992 1993 1994 1995 1996 1997 1998 1999 2000 2001 2002 2003 2004 2005 2006 2007 2008 2009 2010 2011 2012 2013 2014 2015 2016 2017
Kombolcha
AnnualMax AnnualMin Linear (AnnualMax) Linear (AnnualMin)
y = 0.0464x + 26.428 R² = 0.5759 y = 0.0506x + 12.785 R² = 0.3648 0 5 10 15 20 25 30 1987 1988 1989 1990 1991 1992 1993 1994 1995 1996 1997 1998 1999 2000 2001 2002 2003 2004 2005 2006 2007 2008 2009 2010 2011 2012 2013 2014 2015 2016 2017
Gondar
Figure 7. Annual Minimum and Maximum Temperature Variation and Trends at Different Stations from 1987 to 2017 y = 0.0368x + 24.141 R² = 0.298 y = 0.0105x + 13.245 R² = 0.0456 0 5 10 15 20 25 30 1989 1992 1993 1994 1995 1996 1997 1998 1999 2000 2001 2002 2003 2004 2005 2006 2007 2008 2009 2010 2011 2012 2013 2014 2015 2016 2017
Lalibela
AnnualMax AnnualMin Linear (AnnualMax) Linear (AnnualMin)
y = 0.0333x + 22.282 R² = 0.4248 y = 0.0408x + 9.8319 R² = 0.4592 0 5 10 15 20 25 1987 1988 1989 1990 1991 1992 1993 1994 1995 1996 1997 1998 1999 2000 2001 2002 2003 2004 2005 2006 2007 2008 2009 2010 2011 2012 2013 2014 2015 2016 2017
Debre Markos
AnnualMax AnnualMin Linear (AnnualMax) Linear (AnnualMin)
y = 0.0498x + 21.525 R² = 0.4541 y = -0.0152x + 9.7249 R² = 0.1014 0 5 10 15 20 25 1988 1989 1992 1993 1994 1995 1996 1997 1998 1999 2000 2001 2002 2003 2004 2005 2006 2007 2008 2009 2010 2011 2012 2013 2014 2015 2016 2017
Debre Tabor
4.5. Descriptive Statistics for Crop Production
The study revealed that Teff is the most significant cereal crop and constitutes the highest share in terms of cultivated area and total production in all zones of the Amhara region. However, considering crop yield, Barley has higher productivity except for Debre Markos. Debre Markos has the highest annual Teff crop production in the region, followed by Bahir Dar and Gondar. The Barley production is higher in Debre Markos and Debre Birhan compared to other zones. Table 9. Summary of Teff and BarleyCrop Production in Amhara Region on Area Cultivated (1000 ha), Production (1000 Qt) and Yield (Qt/ha), 1997-2015
Zone Teff Barely
Debre Birhan Area 105.8 52.2
Production 1281.9 820.8
Yield 11.6 15.1
Bahir Dar Area 130.3 26.4
Production 1430.9 297.3
Yield 10.6 10.9
Debre Markos Area 199.3 86.7
Production 2537.7 944.7 Yield 12.5 11.9 Kombolcha Area 99.7 36.3 Production 1164.3 481.2 Yield 11.4 12.8 Lalibela Area 60 37.2 Production 655.6 470.5 Yield 10.7 12.4
Debre Tabor Area 126.1 48
Production 1278.7 471.2
Yield 9.8 10.4
Gondar Area 120.2 47.3
Production 1306.7 643.1
4.6. Crop Yield and Climate Variables Relationship
To understand the crop yield change due to changes in climate variables and their relationship in each zone of the Amhara region, ordinary least square regression (OLS) analysis was performed (Table 9). Both dependent and independent variables i.e. yield for Barley and Teff, seasonal Kiremt rainfall, annual total rainfall (ATR), annual maximum temperature (ATMax), and annual minimum temperature (ATMin) were log-transformed before running the model. Further, before reporting the result, the model was tested if it meets all the required ordinary least square regression assumptions. The p-value of the Breusch Pagan chi-squared value showed that the model does not suffer from the problem of heteroscedasticity. Further, there is no issue of endogeneity that arises from simultaneity i.e. the outcome variable (crop yield) doesn’t predict the independent climate variables rather it is a response to the explanatory variable. Once again, all independent variables have the variation inflation factor (VIF) values of less than10, which indicates that there is no multicollinearity problem among explanatory variables.
The results revealed that the model can describe the change in the yields of crops ranging from 19% (0.19) in Lalibela to 68% (0.68) in Kombolcha in the case of Teff and 36% (0.36) in Lalibela to 69% (0.69) in Gondar in the case of Barley. Further, for Teff yield, Debre Tabor, Debre Birhan, and Debre Markos have coefficients of determination of 0.54, 0.49, and 0.48, which indicates that climate variables account for 54%, 49%, and 48% of the yield changes, whereas 46%, 51%, and 52% variation in Teff yield are explained by other unknown factors. Similarly, the result shows that the impact of climate variables accounts for 62%, 48%, and 43% Barley yield changes in Kombolcha, Debre Tabor, and Debre Birhan.
Our finding shows that annual maximum temperature is a statistically significant determinant factor for both crop yields in Debre Tabor, Debre Birhan, Kombolcha, and Bahir Dar. Further, it has a non-significant positive impact on both crops in the remaining zones. Whereas, the impact of the annual minimum temperature on Teff and Barley yield is non-significant in all station. However, except Debre Tabor and Kombolcha for both crops and Bahir Dar for Barley crop, the annual minimum temperature has contributed positively to crop yield change in the region. Seasonal Kiremt rainfall has a negative significant impact on the Barley yield in Kombolcha. Further, it has non-significant negative impacts on both crops in Debre Tabor, Gondar, and Debre Markos and on Barley in Lalibela and Bahir Dar. The remaining zones have