RIVM letter report 320103005/2010 RIVM/SIR PORS no. 12063 May 07, 2010
Normalizing dietary exposure across age
by scaling to body size
dr. B.G.H. Bokkers dr. M.I. Bakker
National Institute for Public Health and the Environment (RIVM)
Centre for Substances and Integrated Risk Assessment (SIR)
PO Box 1 3720 BA Bilthoven The Netherlands Contact: dr. B.G.H. Bokkers bas.bokkers@rivm.nl Reviewed by: dr. W. Slob
dr. ir. J.G.M. van Engelen
This investigation has been performed by order and for the account of the Food and Consumer Product Safety Authority (VWA), within the framework of project V320103 Modellering humane blootstelling via voeding, kennisvraag 9.1.19-3
Abstract
It is usually assumed that the higher dietary exposure to substances (in mg/kg bw) in young individuals compared to adults is the resultant of a relatively high consumption needed for growth. When this relatively high exposure of young individuals temporarily exceeds the human limit value, the assessment of possible health risks is not straightforward. The aim of this study was to find a way of scaling exposure in order to reduce the effect of age on the dietary intake. Several (allometric) scaling approaches were applied to explore their impact on age-related intake patterns. It was demonstrated that allometric scaling reduces the effect of body weight. Nevertheless, the results indicate that the higher exposure in young individuals is not only the resultant of a relatively high consumption needed for growth, but still contains influences of body weight. Therefore the conclusion was drawn that a different scaling of dietary exposure is not expedient. It is advised that, when a human limit value is exceeded for a relatively short period, the characteristics (e.g. accumulating properties) of the compound and the design of the toxicological studies informing the human limit value are examined closely to assess the health risk.
Introduction
In toxicology it is assumed that the response to chemical exposure is a function of the amount of the compound a species (animal or human) encounters. The impact of a given amount of a chemical on an individual partly depends on his body size, with larger absolute amounts usually being necessary to achieve the same response in species with larger body sizes. This dependence on the body size is taken into account by scaling dose to body mass, i.e. expressing dose in mg/kg bw/day. Consequently, a human limit value (e.g. ADI, TDI, RfD) derived from such a dose is expressed in the same unit. To enable the comparison of the exposures and a human limit value the exposure should also be expressed scaled proportionally, i.e. isometric, to body weight, e.g. expressed in mg/kg bw1.0.
In practice, it is often noted that within the same species infant and juvenile individuals have a higher dietary exposure to chemical substances when expressed per kg body weight compared to adult individuals (e.g. Bakker et al., 2008; Boon et al., 2008, and figures 2 and 3 in the results section). It is usually assumed that the higher exposure (in mg/kg bw1.0) in young individuals is the resultant of a relatively high consumption needed for growth. When the relatively high exposure of young individuals temporarily exceeds the human limit value, the assessment of possible health risks is therefore not straightforward (see the report of the Food and Consumer Product Safety Authority (VWA, 2008)). Hence, it would be expedient to express dietary exposure to substances in such manner that it will become independent of age. In that case, it is less likely that exposure exceeds the human limit value for a relative short period during youth. Consequently, risk assessment of dietary exposure expressed in this way will become less complicated. The aim of the present study is therefore to find a way of scaling exposure that renders the dietary intake of substances independent of age.
From inter- and intraspecies studies in the fields of toxicology and pharmacology it is known that dose-scaling to body weight other than proportional, i.e. allometric scaling, is more appropriate than isometric scaling. Based on empirical findings and theoretical arguments three scaling approaches are generally advocated: scaling to bw0.67, bw0.7, and bw0.75 (Baird et
al., 1996; Bokkers and Slob, 2007; Chappell, 1989; Mahmood, 1999; Rhomberg, 2002, 2004;
Rhomberg and Lewandowski, 2006; Schneider et al., 2004; Travis and White, 1988; Watanabe et al., 1992; West et al., 1997, 1999).
In this report we will investigate how much the effect of body weight on the intake of substances via food can be reduced by using allometric instead of isometric scaling. The dietary exposure to the brominated flame retardant 2,2’,4,4’-brominated diphenyl ether (BDE-47) and the heavy metal cadmium from food are used to illustrate the various scaling
Methods
Consumption data
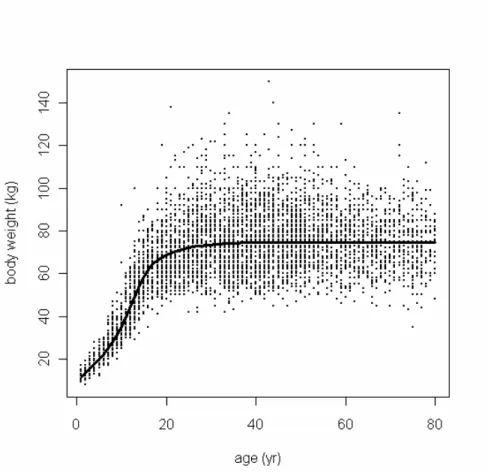
Consumption data were collected in the third Dutch National Food Consumption Survey (DNFCS-3) conducted in 1997–1998, as described in detail by Kistemaker et al. (1998). Briefly, 6250 individuals, aged 1 to 97 years, from 2564 households were selected. Respondents recorded their food consumption over two consecutive days. Furthermore, DNFCS-3 contains the body weights of all individuals (Figure 1). The data of individuals aged 1 to 80 years were used, because the data of ages 80+ are too few to derive reliable results.
Figure 1. Body weight (kg) plotted against age (years). The dots indicate the individual values of men
and women from DNCF-3. Trend line is obtained with PROAST v20.21 using the likelihood ratio test
(Slob, 2002).
Concentration data
The concentration data of 2,2’,4,4’-brominated diphenyl ether (BDE-47) are obtained from Bakker et al. (2008). Because of its lipophilicity and widespread environmental distribution, BDE-47 is found in various, mainly lipid rich, foods. A summary of the concentration data is provided in Table 1. The reader is referred to Bakker et al. (2008) for further details on the concentration data.
Table 1. Mean concentrations of BDE-47 (pg/g product or pg/g fat) in food groups sampled in the year 2004. Data are from Bakker et al. (2008).
Food group Fat (%) Concentration (*pg/g product or **pg/g fat) Fatty fish NA 1725 * Bread 1 10 * Pork 26 142 ** Eggs 10 220 ** Crustaceans NA 455 * Vegetables 0 4 * Cheese 31 209 ** Fruit 0 4 * Beef 16 113 ** Poultry 9 181 ** Butter 81 13 ** Lean fish NA 171 * Vegetable oils 57 10 * Industrial oils 35 15 * Milk 1 2010 ** NA = Not available
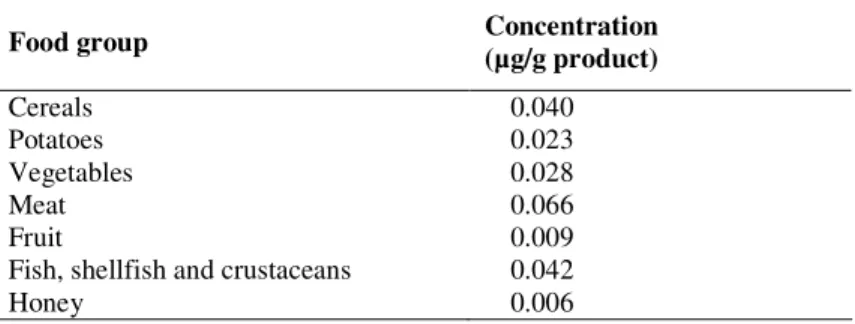
For cadmium the same concentration data were used as applied by Boon et al. (2010) who updated the dataset analyzed by de Winter et al. (2003). These data were obtained from the Quality Agricultural Products Database, which were derived from monitoring programs performed in the Netherlands by the Dutch Food and Consumer Product Safety Authority (VWA) and the Dutch Dairy Association from 1999 up to 2007. The reader is referred to Boon et al. (2010) and de Winter et al. (2003) for a description of the approach to convert concentrations in raw agricultural commodities to concentrations in food products, to handle of non-detects, and to derive concentrations in meat. An overview of the resulting mean cadmium concentrations per food group is presented in Table 2. Levels per food are reported are reported by Boon et al. (2010).
Table 2. Mean cadmium concentration per food group. Data are from Boon et al. (2010)
Food group Concentration (µg/g product)
Cereals 0.040
Potatoes 0.023
Vegetables 0.028
Meat 0.066
Fruit 0.009
Fish, shellfish and crustaceans 0.042
Honey 0.006
All daily consumptions were multiplied with the (mean) concentration of the substance per consumed food and summed over foods consumed per day per individual. This resulted in a distribution of daily exposures. The estimated exposures are expressed in various ways: absolute, scaled to bw, bw0.67, bw0.7, or bw0.75.
A distribution of daily exposures includes both the variation between individuals and between the two days of one individual. However, to assess the long-term intake within a population only the within-person variation is of interest, since in the long run fluctuations in daily concentrations are assumed to average out. Therefore, the within-person (between days) variation should first be removed from the distribution of daily exposures using statistical modeling.
Here we use the betabinomial-normal (BBN) model (de Boer et al., 2009; Slob, 2006), which allows for derivation of the exposure distribution as a function of age. The often reported 50th and 95th percentiles (P50 and P95) of the exposure distributions are reported. Exposures were derived using MCRA, version 6.2 (de Boer and van der Voet, 2007).
Results
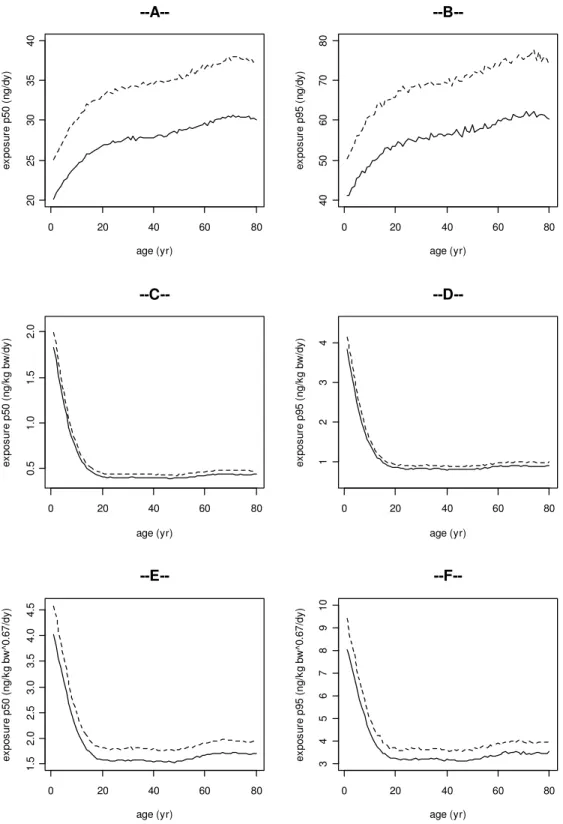
Figure 2 shows the intake of BDE-47 by men (dashed line) and women (solid line) scaled in various ways as a function of age. The plots on the left represent the P50 (median) of the exposure, and the plots on the right show the P95 of the exposure for the same body weigth-scaling approach. In general, it can be noted that the exposure shows the same pattern over the ages when comparing the P50 and P95. In Figure 2A and 2B the absolute exposure is given, i.e. no measures are applied to normalize the exposure. Here men have a higher exposure compared to women due to their higher intake of foods containing BDE-47. In both sexes the absolute exposure increases during the first 20 years of life. From age 20 to 80 the absolute exposure increases slightly. Figures 2C and 2D present the exposure as scaled to body weight (i.e. bw1.0). The scaled exposures are similar in men and women. In both sexes the exposure decreases during the first 20 years of life, and is similar between ages 20 and 80. In Figures 2E and 2F, 2G and 2H, and 2I and 2J the daily exposures are presented after allometric scaling to body weight, i.e. to bw0.67, bw0.7, and bw0.75, respectively. After allometric scaling the exposure shows a similar pattern as the isometrically scaled exposure.
0 20 40 60 80 20 25 30 35 40 age (yr) ex po su re p 50 ( ng /d y) --A--0 20 40 60 80 40 50 60 70 80 age (yr) ex po su re p 95 ( ng /d y) --B--0 20 40 60 80 0. 5 1. 0 1. 5 2. 0 age (yr) ex po su re p 50 ( ng /k g bw /d y) --C--0 20 40 60 80 1 2 3 4 age (yr) ex po su re p 95 ( ng /k g bw /d y) --D--0 20 40 60 80 1. 5 2. 0 2. 5 3. 0 3. 5 4. 0 4. 5 age (yr) ex po su re p 50 ( ng /k g bw ^0 .6 7/ dy ) --E--0 20 40 60 80 3 4 5 6 7 8 9 10 age (yr) ex po su re p 95 ( ng /k g bw ^0 .6 7/ dy )
--F--Figure 2. The exposure to BDE-47 for men (dashed line) and women (solid line) as a function of age. The graphs on the left represent the P50 (median) of the exposure, and the plots on the right show the P95 of the exposure for the same scaling approach: 2A and 2B: the absolute exposure (ng/day), 2C and
2D, 2E and 2F, 2G and 2H, and 2I and 2J: exposure scaled to bw1.0, bw0.67, bw0.7, and bw0.75,
0 20 40 60 80 1. 5 2. 5 3. 5 4. 5 age (yr) ex po su re p 50 (n g/ kg b w ^0 .7 /d y)
--G--0 20 40 60 80 3 4 5 6 7 8 9 age (yr) ex po su re p 95 (n g/ kg b w ^0 .7 /d y)
--H--0 20 40 60 80 1. 0 1. 5 2. 0 2. 5 3. 0 3. 5 age (yr) ex po su re p 50 (n g/ kg b w ^0 .7 5/ dy )
--I--0 20 40 60 80 2 3 4 5 6 7 8 age (yr) ex po su re p 95 (n g/ kg b w ^0 .7 5/ dy )
--J--Figure 2 continued.
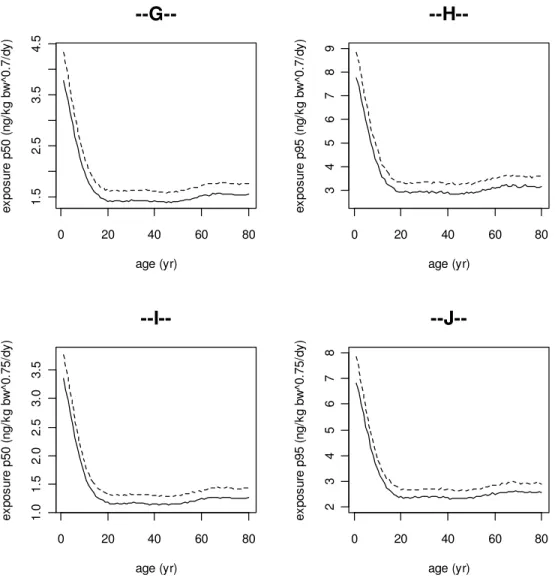
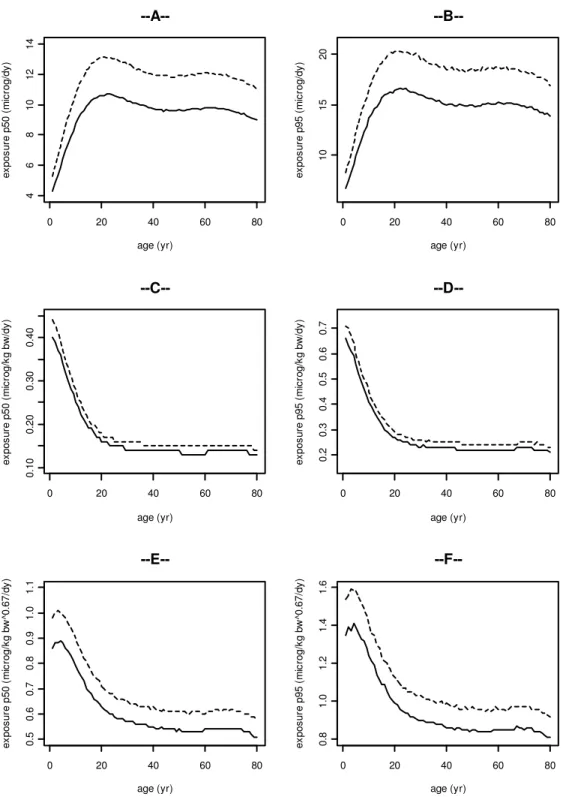
Figure 3 shows the intake of cadmium by men (dashed line) and women (solid line) scaled in various ways as a function of age. Similar to BDE-47 it can be noted that the cadmium exposure shows a similar pattern over the ages when comparing the P50 and P95. In Figure 3A and 3B the absolute exposure is given, i.e. no measures are applied to normalize the exposure. Here men have a higher (absolute) exposure compared to women due to their higher intake of foods containing cadmium. In both sexes the absolute exposure increases during the first 20 years of life. From age 20 to 80 the absolute exposure stays approximately the same. Figures 3C and 3D present the exposure as scaled to body weight (i.e. bw1.0). The scaled exposures are similar between men and women. In both sexes the exposure decreases during the first 20 years of life, and is similar in ages 20 to 80. In Figures 3E to 3J the daily exposures are presented after allometric scaling to body weight, i.e. to bw0.67, bw0.7, and bw0.75. After allometric scaling the exposure shows a similar pattern as the isometrically scaled exposure.
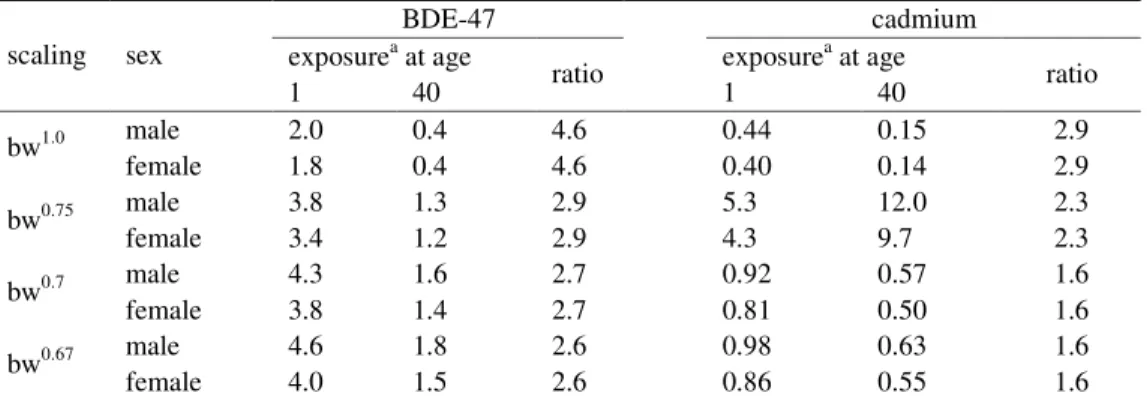
In Table 3 the P50 exposures to BDE-47 and cadmium at ages 1 and 40 are given. The ratio of these exposure values illustrates the attribution of growth to the exposure at young age. In theory, in absence of growth the scaling approach should result in a ratio equal to 1, i.e. the
plot of the scaled exposure against age is a horizontal line. The ratio between the exposure at young and older ages decreases when allometric scaling is applied.
0 20 40 60 80 4 6 8 10 12 14 age (yr) ex po su re p 50 ( m ic ro g/ dy ) --A--0 20 40 60 80 10 15 20 age (yr) ex po su re p 95 ( m ic ro g/ dy ) --B--0 20 40 60 80 0. 10 0. 20 0. 30 0. 40 age (yr) ex po su re p 50 ( m ic ro g/ kg b w /d y) --C--0 20 40 60 80 0. 2 0. 3 0. 4 0. 5 0. 6 0. 7 age (yr) ex po su re p 95 ( m ic ro g/ kg b w /d y) --D--0 20 40 60 80 0. 5 0. 6 0. 7 0. 8 0. 9 1. 0 1. 1 age (yr) ex po su re p 50 ( m ic ro g/ kg b w ^0 .6 7/ dy ) --E--0 20 40 60 80 0. 8 1. 0 1. 2 1. 4 1. 6 age (yr) ex po su re p 95 ( m ic ro g/ kg b w ^0 .6 7/ dy )
--F--Figure 3. The exposure to cadmium for men (dashed line) and women (solid line) as a function of age. The graphs on the left represent the median (P50) of the exposure, and the plots on the right show the P95 of the exposure for the same scaling approach: 3A and 3B: the absolute exposure (µg/day), 3C and
3D, 3E and 3F, 3G and 3H, and 3I and 3J: exposure scaled to bw1.0, bw0.67, bw0.7, and bw0.75,
0 20 40 60 80 0. 5 0. 6 0. 7 0. 8 0. 9 age (yr) ex po su re p 50 (m ic ro g/ kg b w ^0 .7 /d y)
--G--0 20 40 60 80 0. 8 1. 0 1. 2 1. 4 age (yr) ex po su re p 95 (m ic ro g/ kg b w ^0 .7 /d y)
--H--0 20 40 60 80 0. 4 0. 5 0. 6 0. 7 0. 8 age (yr) ex po su re p 50 (m ic ro g/ kg b w ^0 .7 5/ dy )
--I--0 20 40 60 80 0. 6 0. 8 1. 0 1. 2 age (yr) ex po su re p 95 (m ic ro g/ kg b w ^0 .7 5/ dy )
--J--Figure 3 continued.
Table 3. Exposures to BDE-47 and cadmium at age 1 and 40 and the ratio thereof for the various scaling approaches.
BDE-47 cadmium
exposurea at age exposurea at age
scaling sex 1 40 ratio 1 40 ratio male 2.0 0.4 4.6 0.44 0.15 2.9 bw1.0 female 1.8 0.4 4.6 0.40 0.14 2.9 male 3.8 1.3 2.9 5.3 12.0 2.3 bw0.75 female 3.4 1.2 2.9 4.3 9.7 2.3 male 4.3 1.6 2.7 0.92 0.57 1.6 bw0.7 female 3.8 1.4 2.7 0.81 0.50 1.6 male 4.6 1.8 2.6 0.98 0.63 1.6 bw0.67 female 4.0 1.5 2.6 0.86 0.55 1.6
Discussion
In this study several approaches to scale the exposure are applied to explore their impact on age-related intake patterns. Scaling powers lower than 0.67 were not applied because toxicological and pharmacological studies indicate that the scaling power should be around 0.7. The ratio of the exposure values at ages 1 to 40 are derived for each scaling approach. The ratio between intakes of children and adults in using isometric scaling is a factor of about 3-5. Allometric scaling reduces this factor by about 50 %. This indicates that the higher exposure (in mg/kg bw1.0) in young individuals is not only the resultant of a relatively high consumption needed for growth, but still contains influences of body weight. Allometric scaling removes or at least reduces the effect of body weight. However, after applying each of the assessed scaling approaches there is still a relatively high exposure at young ages, which can be attributed to growth. Therefore, it can be concluded that allometric scaling does not completely reduce the difference in exposure in children and adults.
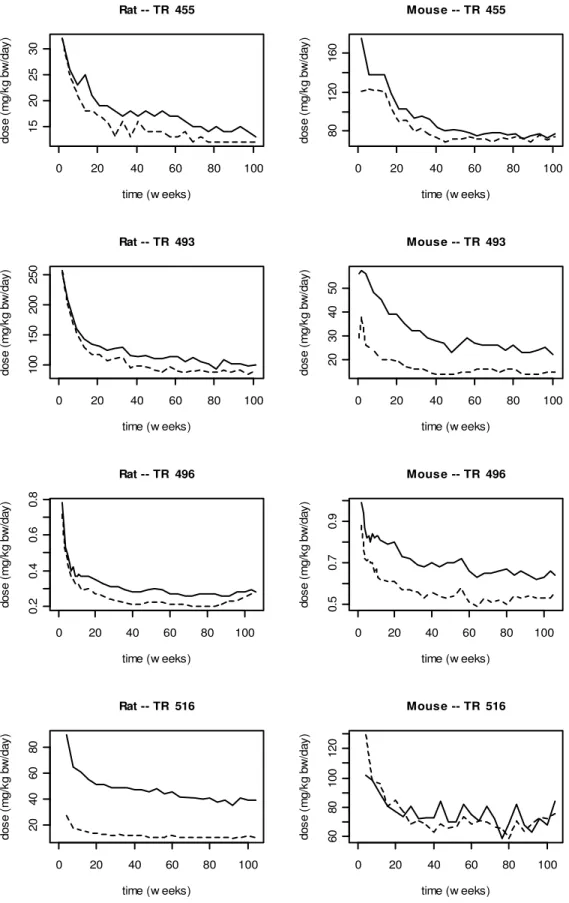
An important issue to take into account is the route of exposure applied in the toxicological studies. Human limit values are generally derived from animal studies. In an animal feed study the dosing regime is similar to long-term human exposure pattern, i.e. at young ages the exposure is relatively high compared to the exposure at adulthood. See for example Figure 6, where the doses of several long-term toxicity studies are plotted against the age of the animals after exposure via their feed. The effect(s) found in the animal (feed) study are a resultant of repeated exposure. When the animal is considered as a good surrogate to assess effects in humans, then similar effects can be expected in humans after relatively high doses at childhood and lower doses at adulthood. The effects found in a feed study in adult animals can be directly linked to the dose (in mg/kg bw), because exposure levels at adulthood include prior (higher) exposure at young ages (Luijckx et al., 1994). Assuming that the animal and human life stages are proportionally of similar duration, it is not needed to derive life-long average exposures when the human limit value is based on a feed study. The above reasoning only holds when the test compound is administered at a constant concentration in feed or water, and not when exposure is by gavage or via another route of exposure than oral, e.g. inhalation, dermal, intervenous, intraperitoneal. This is also recognized in the report of the Panel on Children and Chemical Substances of the Dutch Food and Consumer Products Safety Authority (VWA, 2008).
Accumulating compounds pose another challenge when determining the proper exposure metric. It should be noted that the two example compounds addressed here, BDE-47 and cadmium are in fact accumulating compounds. For those compounds the accumulated concentration in the whole body (also known as body burden) or in a particular target organ is probably a more precise measure of exposure compared to the actual external exposure (Bakker et al., 2008; JECFA, 2002). Whole body or organ concentrations can be derived when (toxico)kinetic data are available and the (external) exposures are available in sufficient detail. Preferably, as a function of age (de Boer et al., 2009; Slob, 1993, 2006).
Altogether, it is advised that, when a human limit value is exceeded at lower ages only, the characteristics (e.g. accumulating properties) of the compound and the setup of the
toxicological studies informing the human limit value are examined closely to assess the risks for human health.
0 20 40 60 80 100 15 20 25 30 time (w eeks) do se ( m g/ kg b w /d ay ) Rat -- TR 455 0 20 40 60 80 100 80 12 0 16 0 time (w eeks) do se ( m g/ kg b w /d ay ) Mouse -- TR 455 0 20 40 60 80 100 10 0 15 0 20 0 25 0 time (w eeks) do se ( m g/ kg b w /d ay ) Rat -- TR 493 0 20 40 60 80 100 20 30 40 50 time (w eeks) do se ( m g/ kg b w /d ay ) Mouse -- TR 493 0 20 40 60 80 100 0. 2 0. 4 0. 6 0. 8 time (w eeks) do se ( m g/ kg b w /d ay ) Rat -- TR 496 0 20 40 60 80 100 0. 5 0. 7 0. 9 time (w eeks) do se ( m g/ kg b w /d ay ) Mouse -- TR 496 0 20 40 60 80 100 20 40 60 80 time (w eeks) do se ( m g/ kg b w /d ay ) Rat -- TR 516 0 20 40 60 80 100 60 80 10 0 12 0 time (w eeks) do se ( m g/ kg b w /d ay ) Mouse -- TR 516
Figure 6. The dose (mg/kg bw1.0/day) for male (dashed line) and female (solid line) rats and mice as a
function of time on the study (weeks). Animals are exposure via their feed. Data are from four random NTP technical reports (NTP, 1996, 2001a, b, 2004).
References
Baird, S. J. S., Cohen, J. T., Graham, J. D., Shlyakhter, A. I., and Evans, J. S. (1996). Noncancer risk assessment: A probabilistic alternative to current practice. Hum Ecol
Risk Assess 2, 79-102.
Bakker, M. I., de Winter-Sorkina, R., de Mul, A., Boon, P. E., van Donkersgoed, G., van Klaveren, J. D., Baumann, B. A., Hijman, W. C., van Leeuwen, S. P. J., de Boer, J., and Zeilmaker, M. J. (2008). Dietary intake and risk evaluation of polybrominated diphenyl ethers in The Netherlands. Molecular Nutrition & Food Research 52, 204-216.
Bokkers, B. G. H., and Slob, W. (2007). Deriving a data-based interspecies assessment factor using the NOAEL and the Benchmark Dose approach. Crit Rev Toxicol 37, 355-373. Boon, P. E., Bonthuis, M., Janssen, P., te Biesebeek, J. D., and van Donkersgoed, G. (2010).
Risk assessment cadmium exposure via food. RIVM-RIKILT front office food safety, 22-01-2010, Bilthoven, the Netherlands.
Boon, P. E., van der Voet, H., van Raaij, M. T., and van Klaveren, J. D. (2008). Cumulative risk assessment of the exposure to organophosphorus and carbamate insecticides in the Dutch diet. Food Chem Toxicol 46, 3090-8.
Chappell, W. R. (1989). Interspecific scaling of toxicity data: a question of interpretation.
Risk Anal 9, 13-4.
de Boer, W. J., and van der Voet, H. (2007). Manual for MCRA, Release 6, a web-based program for Monte Carlo Risk Assessment. Biometris, RIKILT and RIVM, Wageningen and Bilthoven, the Netherlands,
https://mcra.rikilt.wur.nl/Documentation/Manual6.pdf.
de Boer, W. J., van der Voet, H., Bokkers, B. G., Bakker, M. I., and Boon, P. E. (2009). Comparison of two models for the estimation of usual intake addressing zero consumption and non-normality. Food Addit Contam Part A Chem Anal Control
Expo Risk Assess 26, 1433-49.
de Winter-Sorkina, R., Bakker, M. I., van Donkersgoed, G., and van Klaveren, J. D. (2003). Dietary intake of heavy metals (cadmium, lead and mercury) by the Dutch
population. RIVM report 320103001. RIVM, Bilthoven, the Netherlands. Available at http://www.rivm.nl/bibliotheek/rapporten/320103001.pdf.
JECFA (2002). Joint FAO/WHO Expert Committee on Food Additives (JECFA), Safety evaluationof certain food additives and contaminants, WHO Food Additives Series 48, WHO, Geneva.
Kistemaker, C., Bouman, M., and Hulshof, K. F. A. M. (1998). De consumptie van afzonderlijke producten door Nederlandse bevolkingsgroepen -
Voedselconsumptiepeiling 1997-1998 (Consumption of food products by Dutch population groups - Dutch National Food Consumption Survey 1997-1998) (V98.812). TNO-Voeding, Zeist, the Netherlands.
Luijckx, N. B., Rao, G. N., McConnell, E. E., Wurtzen, G., and Kroes, R. (1994). The intake of chemicals related to age in long-term toxicity studies--considerations for risk assessment. Regul Toxicol Pharmacol 20, 96-104.
Mahmood, I. (1999). Allometric issues in drug development. J Pharm Sci 88, 1101-6. NTP (1996). Toxicology and carcinogenisis studies of codeine (CAS no. 76-57-3) in F344/N
rats and B6C3F1 mice (feed studies), TR 455 Research Triangle Park, NC, USA. NTP (2001a). Toxicology and carcinogenisis studies of emodin (CAS no. 518-82-1) in
F344/N rats and B6C3F1 mice (feed studies), TR493 Research Triangle Park, NC, USA.
NTP (2001b). Toxicology and carcinogenisis studies of fumonisin B1 (CAS no. 116355-83-0) in F344/N rats and B6C3F1 mice (feed studies), TR496 Research Triangle Park, NC, USA.
NTP (2004). Toxicology and carcinogenisis studies of 2-methylimidazole (CAS no. 693-98-1) in F344/N rats and B6C3F1 mice (feed studies), TR 516 Research Triangle Park, NC, USA.
Rhomberg, L. (2002). Dose scaling and extrapolation across age groups. Hum Ecol Risk
Assess 8, 783-803.
Rhomberg, L. (2004). Separating pharmacokinetic and pharmacodynamic components in empirical adjustment factor distributions. Hum Ecol Risk Assess 10, 79-90. Rhomberg, L. R., and Lewandowski, T. A. (2006). Methods for identifying a default
cross-species scaling factor. Hum Ecol Risk Assess 12, 1094-1127.
Schneider, K., Oltmanns, J., and Hassauer, M. (2004). Allometric principles for interspecies extrapolation in toxicological risk assessment-empirical investigations. Regul Toxicol
Pharmacol 39, 334-47.
Slob, W. (1993). Modeling long-term exposure of the whole population to chemicals in food.
Risk Anal 13, 525-30.
Slob, W. (2002). Dose-response modeling of continuous endpoints. Toxicol Sci 66, 298-312. Slob, W. (2006). Probabilistic dietary exposure assessment taking into account variability in
both amount and frequency of consumption. Food Chem Toxicol 44, 933-51.
Travis, C. C., and White, R. K. (1988). Interspecific scaling of toxicity data. Risk Anal 8, 119-25.
VWA (2008). Paneladvies Kinderen en chemische stoffen in de voeding: Overschrijding van de gezondheidskundige advieswaarde voor chemische stoffen in de voeding van kinderen. Voedsel en Waren Authoriteit, Bureau Risicobeoordeling, Den Haag, Nederland, http://www.vwa.nl/actueel/bestanden/fileitem/33502.
Watanabe, K., Bois, F. Y., and Zeise, L. (1992). Interspecies extrapolation: a reexamination of acute toxicity data. Risk Anal 12, 301-10.
West, G. B., Brown, J. H., and Enquist, B. J. (1997). A general model for the origin of allometric scaling laws in biology. Science 276, 122-6.
West, G. B., Brown, J. H., and Enquist, B. J. (1999). The fourth dimension of life: fractal geometry and allometric scaling of organisms. Science 284, 1677-9.