AW van Drongelen, B Roszek, ESM Hilbers-Modderman, M Kallewaard, C Wassenaar
This study was performed on request of the Dutch Inspectorate for Health Care on behalf of project V/318902 ‘Technical support of the Inspectorate’
Abstract
This RIVM study was performed to gain insight into wheelchair-related incidents with powered and manual wheelchairs reported to the USA FDA, the British MDA and the Dutch Center for Quality and Usability Research of Technical Aids (KBOH).
A modified version of the Critical Incident Technique, based on the chain of events from the cause to the consequence of the injury, was used to study the FDA and KBOH data. The chain of events was limited for the analysis of MDA data. The method proved a useful tool for structuring information.
Most of the incidents reported to the FDA and MDA were product-related, whereas the literature reported mostly use-related incidents. Components for operating powered wheelchairs, frames and wheels were most frequently reported in the databases to fail. Although the problems of transportation and comfort or fit were found in the literature, they were only sporadically mentioned in the databases. Falls and tips frequently occurred, often with severe consequences. Fractures were the most frequently observed severe injuries and occurred more frequently among powered-wheelchair users.
The data in the databases do not indicate that incidents with wheelchairs present a major public health problem. However, studies in the literature and Dutch data on fatalities involving wheelchairs suggest that the actual number of serious injuries and fatalities, mostly use-related, is considerably higher than the number found in the databases. This is partially due to the different nature of the sources. In general there seems to be underreporting. The low number of vigilance reports in Europe relative to the USA deserves attention.
Preface
The authors would like to thank Mr. M. Rand of the MDA DTS3 and Mr. B. de Bruin of the KBOH for the information they supplied and for critically reviewing this report. We also thank Mrs. G. Peters-Volleberg and Mr. R. Geertsma for critically reviewing the manuscript.
Contents
Samenvatting 7 Summary 8 1. Introduction 9 1.1 General 9 1.2 Objectives 10 2. Methods 11 2.1 Data collection 112.2 Data abstraction and analysis 11
2.2.1 Critical Incident Technique 11
2.2.2 FDA and KBOH data 12
2.2.3 MDA data 14 2.3 Literature search 14 3. Results 17 3.1 FDA 17 3.1.1 General 17 3.1.2 Consequences of injury 17 3.1.3 Injuries 18 3.1.4 Effects 19 3.1.5 Problems 21 Causes 23 3.1.7 To whom it happened 24 3.1.8 Device involved 25 3.1.9 Location of incident 26 3.2 MDA 27 3.2.1 General 27 3.2.2 Outcomes 27 3.2.3 Problems 28 3.2.4 Causes 29 3.2.5 Actions 31 3.3 KBOH 32 3.3.1 General 32 3.3.2 Reported incidents 32 3.4 Wheelchair standards 33 3.4.1 ISO standards 33 3.4.2 CEN standards 33 3.5 Quality marks 33 4. Summary of results 35
4.1 FDA MAUDE database 35
4.1.1 Powered wheelchairs 35
4.1.2 Manual wheelchairs 35
4.2 MDA database 36
4.2.2 Manual wheelchairs 36
5. Discussion and conclusions 39
5.1 Discussion 39
5.1.1 Methodology 39
5.1.2 Number and type of incident reports 40
5.1.3 Causes 40
5.1.4 Problems 41
5.1.5 Effects 42
5.1.6 Injuries, consequences and outcome 42
5.1.7 Actions 43
5.1.8 Wheelchairs involved 43
5.1.9 Considerations 44
5.2 Conclusions 44
Literature 45
Appendix 1: EU marketing of medical devices 47
Appendix 2: USA marketing of medical devices 48
Appendix 3: The GQ mark 49
Appendix 4: FDA Medical Device Reporting 50
Appendix 5: MDA Incident reporting 51
Appendix 6: Description of database for FDA and KBOH 52
Appendix 7: ISO standards on wheelchairs 55
Samenvatting
Op verzoek van de Inspectie voor de Gezondheidszorg heeft het RIVM een studie verricht om inzicht te krijgen in incidenten met elektrische en handmatige rolstoelen. Een analyse is uitgevoerd van incidenten die tussen juli 2000 en juni 2001 zijn gemeld in de MAUDE database van de Amerikaanse Food en Drug Administration (FDA) en aan de Britse Medical Devices Agency (MDA) evenals incidenten die tussen juni 1997 en januari 2001 zijn gemeld aan de organisatie voor Kwaliteits- en Bruikbaarheidsonderzoek van Hulpmiddelen voor gehandicapten en ouderen (KBOH). Bovendien is in de literatuur gezocht naar publicaties over rolstoelincidenten.
Een aangepaste versie van de Critical Incident Technique (CIT) werd toegepast voor het samenvatten van incidenten gemeld aan de FDA en KBOH. Deze techniek was gebaseerd op de keten van gebeurtenissen: oorzaak-probleem-effect-verwonding-gevolg van de verwonding. De gegevens van de MDA werden gekarakteriseerd met een beperkte keten van gebeurtenissen (oorzaak-probleem-uitkomst). Hoewel de CIT zeer bruikbaar bleek voor het structureren van de informatie uit de FDA database, konden deze hoofdzakelijk verplichte meldingen niet volledig worden geanalyseerd. De belangrijkste reden hiervoor was dat de data niet de volledige informatie bevatten voor een goede analyse.
In totaal zijn er 814 rolstoelgerelateerde incidenten gevonden in de FDA MAUDE database, 997 incidenten waren gerapporteerd aan de MDA hoofdzakelijk vanuit de National Health Services (NHS) en 17 aan de KBOH door gebruikers, hun familie en verzorgenden. Het aantal rolstoelgebruikers is geschat op 2,2 miljoen voor de VS, 750.000 voor Engeland en 152.400 voor Nederland. De rolstoelincidenten van de FDA en MDA waren hoofdzakelijk productgerelateerd, terwijl in de literatuur meer gebruiksgerelateerde incidenten werden gemeld. Het falen van componenten voor de aandrijving van elektrische rolstoelen en van frames en wielen zijn het meest aangetroffen in de databases. De in de literatuur gemelde problemen tijdens transport en t.a.v. comfort of pasvorm werden zelden aangetroffen in de databases van de FDA en MDA. Het vallen met of uit een rolstoel werd frequent gemeld aan de FDA en MDA en leidde vaak tot ernstige verwondingen voor de gebruikers. Botbreuken waren de meest voorkomende ernstige verwondingen, die relatief vaak voorkwamen onder gebruikers van elektrische rolstoelen. Zowel bij de FDA als de MDA zijn in de onderzoeksperiode vier sterfgevallen als gevolg van het gebruik van rolstoelen gemeld.
Concluderend kan worden gesteld dat, op basis van de bestudeerde databases en rekening houdend met het aantal rolstoelgebruikers en de intensiteit van gebruik, incidenten met rolstoelen geen aanzienlijk probleem vormen voor de volksgezondheid. Uit CBS gegevens bleek echter dat er in 2000 in Nederlandse acht personen stierven als gevolg van een val waarbij een rolstoel betrokken was. Uit de literatuur blijkt bovendien dat het aantal ernstige, vooral gebruiksgerelateerde, incidenten waarbij een rolstoel betrokken is aanzienlijk hoger is dan het aantal dat is aangetroffen in de databases. Er is een discrepantie tussen hetgeen in de literatuur werd gevonden en hetgeen in de databases werd gerapporteerd. Dit wordt ten dele veroorzaakt door de verschillende aard van de gebruikte bronnen. In het algemeen lijkt er sprake te zijn van onderrapportage. Bovendien heeft de MDA gedurende de onderzoeksperiode slechts vijf rolstoelgerelateerde vigilantiemeldingen ontvangen en er zijn geen vigilantiemeldingen van IGZ ontvangen, terwijl de meeste FDA-meldingen vigilantiemeldingen waren. Dit verschil tussen Europa en de VS verdient verdere aandacht.
Om rolstoelgerelateerde incidenten te voorkomen moet niet alleen aandacht worden besteed aan productverbetering maar ook aan het juiste gebruik van rolstoelen. Dit laatste vereist een beter inzicht van gebruiksgerelateerde incidenten dan mogelijk wordt gemaakt door de wettelijk verplichte meldingssystemen en een beter inzicht in de omvang en intensiteit van het gebruik.
Summary
At the request of the Dutch Inspectorate for Healthcare, a study was performed to gain insight into incidents with powered and manual wheelchairs. An analysis was performed of incident reported between July 2000-June 2001 in the MAUDE database of the USA Food and Drug Administration (FDA) and to the British Medical Devices Agency (MDA) and incidents reported between June 1997-January 2001 to the Dutch Center for Quality and Usability Research of Technical Aids (KBOH). In addition, the literature was surveyed for publications on wheelchair-related incidents.
A modified Critical Incident Technique (CIT), based on the chain of events: cause-problem-effect-injury-consequence of injury, was used to abstract the incidents reported to the FDA and KBOH. The data supplied by the MDA were abstracted using a limited chain of events (cause-problem-outcome). Although the CIT was a useful tool to gain an insight in the chain of events of wheelchair-related incidents, the mainly mandatory FDA data itself were less suitable for a complete CIT-analysis, due to the lack of essential information.
In total, 814 wheelchair-related incidents were found in the FDA MAUDE database, 997 were reported to the MDA mainly through the National Health Services (NHS) and only 17 were reported to the KBOH by users, their family and carers. The number of wheelchair users was estimated to be 2.2 million for the USA, 750,000 for England and 152,400 for the Netherlands. The wheelchair incidents in the FDA and MDA databases were found to be mostly product-related, whereas more use-related incidents were reported in the literature. Failures of components for operating powered wheelchairs, of frames and of wheels were most frequently reported in the databases to fail. The problems transportation and comfort or fit were found in the literature, but they were only sporadically mentioned in the databases. Falls and tips were often occurring effects of wheelchair incidents and led to severe injuries for wheelchair users. Fractures were the most frequent severe injuries, occurring more frequently among users of powered wheelchairs. Both FDA and MDA received reports on four fatalities.
Considering the number of wheelchairs used and the intensity of use, it was concluded that the studied databases indicate that wheelchair-related incidents present no major public health problem. However, data from Statistics Netherlands showed that in 2000 eight fatalities were due to falls with wheelchairs. Moreover, studies in the literature indicate that the actual number of serious, mainly use-related, incidents involving wheelchairs will be considerably higher than the number found in these databases. There is a discrepancy between the findings in the literature and the reports in the databases. This is partially due to the different nature of the sources. In general there seems to underreporting. Moreover, during the study period, only five vigilance reports were received from the MDA and no reports were received from the Dutch competent authority, whereas nearly all FDA reports were vigilance reports. This difference between the USA and Europe deserves attention.
Preventing wheelchair-related incidents should be a combination of both product improvement and attention for the correct use of wheelchairs. The latter requires more data on use-related incidents than can be deduced from legally required reporting systems and a better knowledge of the extent and intensity of use.
1.
Introduction
1.1
General
Reporting malfunctions of medical devices and harm suffered by users of medical devices to manufacturers and authorities is important, because it can contribute to the safety of the products and thus eventually to the safety of patients and/or users. The manufacturer shall investigate the incidents and, if necessary, improve the medical device or the instructions for use to prevent recurrence (Appendix 1). This is an important part of the continuous cycle of quality improvement. Several authorities and organisations have developed databases to present a structure for collection and review of incidents. This enables them to focus their attention on certain products or aspects in order to guard public health. A previous evaluation of technical files of Class I medical devices (1) included a number of technical files of wheelchairs. None of these files contained references to incidents and/or measures to prevent specific incidents. A limited search was carried out on the websites of the United States Food and Drug Administration (FDA) and Emergency Care Research Institute (ECRI) to gain insight into wheelchair-related incidents. This search revealed several reports on incidents related to problems like fire and broken parts. Consequently, the Dutch Inspectorate for Health Care requested a more extensive review of reported incidents and failures related to the use of wheelchairs.
Another aspect of incident reports is their role in illustrating the effectiveness of regulatory measures that control the safety of products that come onto the market. Outlines of the regulatory systems in Europe and the USA are given in Appendices 1 and 2. Standards can be used to show compliance with the European regulatory requirements, allowing the CE-mark to be affixed. During the evaluation of the technical files of Class I medical devices, it became apparent that in the Netherlands another quality mark exists for wheelchairs (GQ-mark, Appendix 3). Information about incidents occurring with medical devices with or without regulatory or quality marks can give an impression of the value of these marks. The total number of wheelchairs in England, supplied by the National Health Services (NHS), is about 750,000 (personal communication M. Rand, MDA). The number of wheelchair users in the USA is 2.2 million (2). The total number of wheelchairs supplied under the Supplies for the Disabled Act (Wet Voorzieningen Gehandicapten, WVG) in the Netherlands was 119,000 ultimo 1999 (3). Moreover, it is estimated that 20 % of the residents of nursing homes and homes for the elderly use a wheelchair (personal communication P. Vreeswijk, The Dutch Council of the Chronically Ill and the Disabled). These wheelchairs are provided under the General Act on Exceptional Medical Expenses (AWBZ). The number of residents of both types of homes was approximately 167,000 in 2000 (4;5). The total number of wheelchair users in the Netherlands is therefore estimated to be 152,400. The number of powered wheelchair users in the USA was 155,000 in 1995 (personal communication J.F. Todd, FDA), whereas the number of powered wheelchairs supplied by the NHS in England is about 85,000 (personal communication M. Rand, MDA). The latter is an underestimation, because there is a considerable private market in England, especially for powered wheelchairs, about which little is known. There are no data on the number of powered wheelchairs in the Netherlands.
1.2
Objectives
The objectives of the study were:
● to gain insight into incidents related to the use of wheelchairs; ● to list the applicable standards for wheelchairs;
● to list the regulatory and quality marks used for wheelchairs and to relate the absence or presence of quality marks to incidents with wheelchairs.
Both manually propelled wheelchairs and electric powered wheelchairs1 were investigated during this study. Scooters2 were excluded.
1 An electric powered wheelchair has the same basic design as a manually propelled wheelchair, but it is propelled
by an electric motor. The movement of the wheelchair is controlled by a panel and/or a joystick (see below).
2 A scooter is considered to be a three or four-wheel electrically powered ‘platform-wheelchair’. At the rear of the
platform it has the two driven wheels with the seat on top of the motor and one or two wheels in the front connected to a steering mechanism (see below).
Powered wheelchair Scooter
2.
Methods
To gain insight into wheelchair-related incidents, an analysis was performed of incidents reported between July 2000-June 2001 in the MAUDE database of the USA Food and Drug Administration (FDA) and to the British Medical Devices Agency (MDA) and incidents reported between June 1997-January 2001 to the Dutch Center for Quality and Usability Research of Technical Aids (KBOH). In addition, the literature was surveyed for publications on wheelchair-related incidents.
2.1
Data collection
FDA dataA search was performed in the FDA MAUDE3 database for powered wheelchairs (using the device code ‘iti’) and manual wheelchairs (using the device code ‘ior’) over the period July 1st, 2000 until June 28th, 2001. The MAUDE database represents reports of adverse events involving medical devices (Appendix 4).
MDA data
The MDA supplied a database on wheelchair failures and incidents for the period July 1st, 2000 until June 30th, 2001. The data concerned failures and incidents for which the investigation by the MDA was completed. Information on MDA incident reporting procedures is given in Appendix 5.
KBOH data
From the KBOH we received reports of wheelchair incidents over the period June 1997 – January 2001, which have been voluntary submitted by users, their family or carers.
2.2
Data abstraction and analysis
2.2.1 Critical Incident Technique
A modified Critical Incident Technique (CIT) (6) was used to interpret and analyse information about the incidents in the MAUDE database and the data received from the KBOH. Each incident was categorised to identify factors that were associated with the incident. The intent was to identify why critical incidents occurred. This approach was used in the Australian Incident Monitoring Study (7), which served as a basis for the method described in this report. Critical incidents with wheelchairs were defined as those occurrences that might have led (if not discovered in time) or did lead, to an undesirable outcome. In this study, wheelchair malfunction and/or harm suffered by the user of the wheelchair were considered to be undesirable outcomes. The subsequent taxonomy was used to interpret the information about the incidents:
- To whom did it happen?
This aspect contained information on the user and the operator (e.g. age). The user is the occupant of the chair and the operator is the person propelling the chair or performing other operations (e.g. maintenance).
- Which device was involved?
This aspect contained information on the device (e.g. brand name, type and age of the wheelchair).
- Where did it happen?
For instance indoors or outdoors. - Why did it happen?
This aspect dealt with the problem and the cause. The problem could be related to a part of the product (e.g. electric drive). The cause could be related to e.g. a product failure.
- What happened?
This aspect dealt with the effect of the incident on the user or operator (e.g. collision). - What was the consequence of the injury?
This aspect contained information on the injury and the consequence of the injury (e.g. required medical intervention).
Shortly, a cause resulted in a problem having an effect on the user or operator, leading to injury with a certain consequence. This is schematically shown in the following chart:
It should be noted that a critical incident could occur without every item of the chain being applicable (e.g. a wheel detaching from a chair without causing an effect or an injury).
2.2.2 FDA and KBOH data
Data from the FDA MAUDE database and from KBOH were entered in a database. Table 1 summarises the items chosen for abstraction. A record in the database contained data for a single incident with a single wheelchair. If several incidents were stated in a single report, a separate record was created for each incident. Reports that did not mention an incident as defined in § 2.2.1 were not entered into the database. For example, a complaint of a user about a dealer who needed a week to repair a flat tire would have been excluded. A complete overview of all fields in the database is given in Appendix 6.
Reports can be subjected to different interpretations if different persons perform the abstraction of reports into database records. The following steps were taken to limit these differences, to increase the consistency of the database, and to improve the reproducibility of this study.
● A manual was written to facilitate the abstraction of information. The manual contained a general description of the method, descriptions of items to be abstracted and the corresponding fields in the database, and additional information and agreements for most fields.
● All reports were abstracted independently by two of the authors blinded to each others work and double entered into the study database. Both entries were compared and inconsistencies were checked and resolved. If necessary data were re-abstracted and inconsistencies in the database corrected. If required the manual was amended.
Problem Effect Injury Consequence Chain of events
Table 1. Summary of items for abstraction of incident information (continued on next page).
Factor Description Options
Report source Source of report Manufacturer, distributor, voluntary, other, unknown
Wheelchair Type of wheelchair Powered wheelchair
Manual wheelchair
Consequence Consequence of injury Death
of injury Injury requiring medical treatment
Injury without medical treatment No injury
Unknown
Injury Type of injury resulting Fracture
from an incident Burn
Bruise Cut Concussion Decubitus Multiple injuries Other None Unknown
Effect Effect of problem Fall with or out of wheelchair
Entrapment
Collision with other object or person
Fire wheelchair without someone in wheelchair Fire wheelchair with someone in wheelchair Involuntary standstill
Uncontrolled movement (without any other effect) Exploding rim and/or tire
Other None Unknown
Problem Stability: wheelchair tipped without apparent technical
failure
Electric drive, including motor and user interface Power supply, including batteries and charger Malfunction and/or
failure (more than one per incident possible)
Wheels, including casters Frame, including attached parts Seat, excluding its frame
Brakes, including (electro)mechanical and dynamic brakes Transportation of wheelchair in car or public transport Medical devices used in combination with wheelchair Comfort and/or fit of wheelchair leading to disorder Electromagnetic interference affecting wheelchair Other
Unknown problem, i.e. problem not specified in report
Cause Cause of problem as Product
identified in report User
Use-related (mainly maintenance and assembly) Combination with other devices
Information and/or education Other
Table 1. (continued)
Factor Description Options
Operator Operator of the wheelchair User (occupant)
Family member/carer/other Unknown
Pre-existing condition Condition of user Text field
Where did it happen Indoors (no institution)
Outdoors Institution During transport Unknown
2.2.3 MDA data
The MDA data on incidents with wheelchairs were already entered in a database by the MDA. The database, a summary of the complete MDA database on wheelchairs, contained a limited number of items relating to problems, causes, effects and actions taken. The information in the MDA database was not suited for analysis using CIT, as essential information was often missing (e.g. type of injury and consequence). Some of this information was available in a non-structured way in narratives in text fields. Due to time restrictions, it was not possible to read through the text fields and abstract that data for all the incidents reported to the MDA. We categorised the information in the MDA database as shown in Table 2. Effect of the problem, injury and consequence of injury were not separated in the MDA-database. The chain of events used to describe the incidents reported to the MDA is given in the following chart:
2.3
Literature search
A scientific literature search was performed for wheelchair-related incidents. The search strategy covered the period January 1990 up to January 2002 using the electronic database PubMed and focused on relevant biomedical papers and reviews. The query was formed using the term ‘wheelchairs/adverse effects[MESH]'. The number of retrieved references during this period was 32.
Table 2. Summary of items of MDA incident information.
Description of factors Categories Included options
Type of wheelchair Powered wheelchair
-Manual wheelchair
-Problem 1 Brakes Brake assembly and linkage
Electrical not specified
-Frame Arm-, back-, foot-, head-, leg rest, battery carrier,
seat support, side frame
Other Problem not allocated
Electric drive Connector, controller, gear, harness, motor
Power supply Battery, charger
Seat Upholstery
Stability
-Wheels Casters, fork, hand rim, spokes, tyres
Cause 2 Labelling / instructions
-Other Contaminated, incident reported in error, tampering
Packaging / storage / transit
-Product Damage, design, end of normal life, mechanical
failure, performance
Quality assurance
-Unknown Cause not established
User Device performed as intended, user error
Use-related Maintenance, device degradation
Outcome 2 Actual injury Serious injury and fatality
Actual minor injury
-No effect
-Chair no longer used
-Other Adverse reaction, burn, electric shock, fire,
explosion, inadequate treatment, overheating
Potential injury Minor and serious injury
Unknown
-Action taken 2 Additional user training
-Alternative manufacture method
-Design modified
-Device-related action Device exchange, recall, repair
Field correction
-Improved maintenance
-Improved quality assurance -Labelling / instructions -Manufacturer advisory notice
-None
-Production ceased
-Safety warning issued
-Unknown
-1. One problem per incident 2. Three or less per incident
3.
Results
3.1
FDA
3.1.1 General
For powered wheelchairs 176 MAUDE reports were collected over the one-year period. Two reports were not entered into the database: one report only mentioned the anxiety of a patient about the safety of the wheelchair and the second report involved a walker. Thus, 174 reports were abstracted. A single incident was mentioned in 171 reports and three reports mentioned three incidents. Eventually, 180 incidents with powered wheelchairs were entered into the database. Of these incidents 167 (93%) were found in reports by the manufacturer, 11 (6%) in ‘voluntary’ reports and two (1%) were reported by a distributor.
For manual wheelchairs 626 MAUDE reports were collected over the same one-year period. One report was not abstracted, because the incident was not wheelchair-related. Three reports mentioned two incidents, one report mentioned three incidents and another report mentioned five incidents. In total, 634 incidents were abstracted. Of these incidents 618 (97%) were found in reports by the manufacturer, 15 (2%) in ‘voluntary’ reports and one incident was reported by the ‘user facility’.
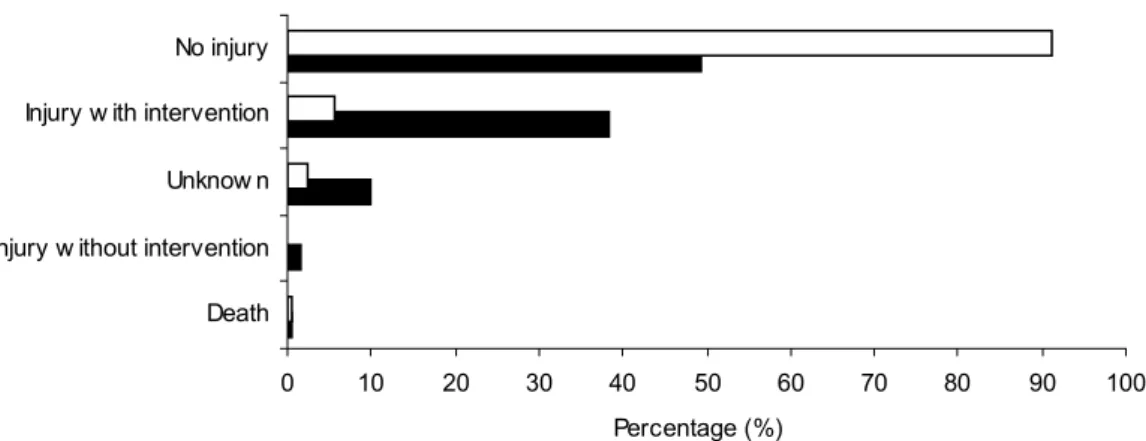
3.1.2 Consequences of injury
No injuries were reported in 49% of the incidents with powered wheelchairs and in 91% of the incidents with manual wheelchairs (Figure 1). Injuries requiring medical intervention were mentioned in 40% of the reports on powered wheelchairs and in only 5% of reports on manual wheelchairs. In total, 4 deaths were reported due to incidents with wheelchairs: three with manual wheelchairs and one with a powered wheelchair.
Figure 1. Wheelchair-related consequences of injuries. Consequences of injuries reported in incidents for powered wheelchairs (solid bars, n=180) and manual wheelchairs (open bars, n=634) are shown as percentage.
A dealer reported the death of a user. He alleged that the wheelchair caught fire and the user died as a result of the incident. The incident was investigated and a candle was identified as the cause of the fire.
0 10 20 30 40 50 60 70 80 90 100 Death
Injury w ithout intervention Unknow n Injury w ith intervention No injury
3.1.3 Injuries
The majority of injuries for incidents with powered wheelchairs were fractures (Figure 2). Only few fractures were reported for manual wheelchairs. The remainder of injuries, i.e. cut, multiple injuries, concussion, burn, decubitus, bruise and other injuries, occurred in a relatively small number of incidents.
Figure 2. Wheelchair-related types of injuries. Injuries reported in incidents for powered wheelchairs (solid bars, n=180) and manual wheelchairs (open bars, n=634) are shown as percentage.
Table 3 shows that for powered wheelchairs nearly all injuries lead to a medical treatment. Burns caused the only death reported.
Table 3. Injuries vs. consequences of injuries for powered wheelchair *.
Consequence of injury
Death Intervention No intervention None Unknown Total
Injury n % n % n % n % n % n None - - - - - - 89 100 - - 89 Fracture - - 35 100 - - - - - - 35 Unknown - - 3 15 1 5 - - 16 80 20 Other - - 9 75 2 17 - - 1 8 12 Cut - - 12 100 - - - - - - 12 Multiple injury - - 5 83 - - - - 1 17 6 Concussion - - 2 100 - - - - - - 2 Burn 1 50 1 50 - - - - - - 2 Decubitus - - 1 100 - - - - - - 1 Bruise - - 1 100 - - - - - - 1 Total 1 69 3 89 18 180
*Note that the percentages are given for the injuries in the rows.
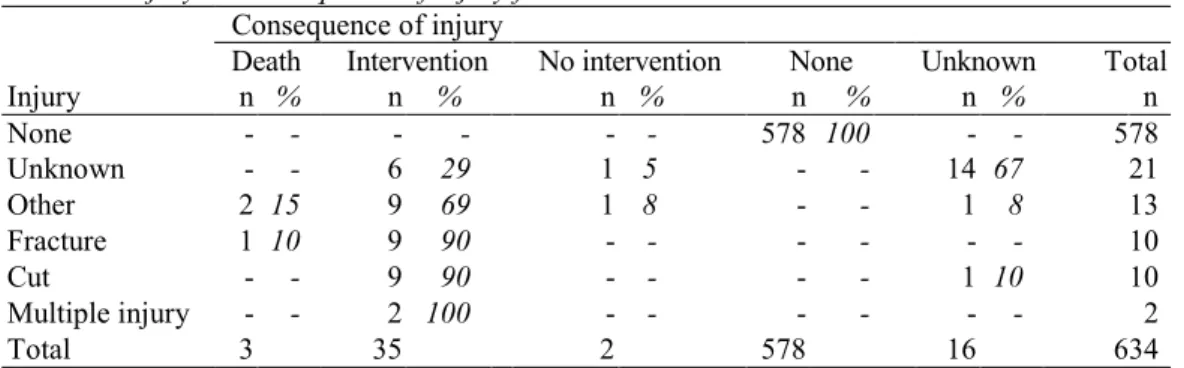
If an injury was reported for manual wheelchairs, intervention was frequently needed (Table 4). The three fatal incidents were caused by:
● The wheelchair tipping during transportation in a van. The user sustained a broken leg and subsequently died.
● A malfunctioning seat belt. The user became trapped under the belt.
● A push handle coming off a wheelchair. The patient fell on the ground and hit his/her head. 0 20 40 60 80 100 Bruise Decubitus Burn Concussion Multiple Cut Other Unknow n Fracture None Percentage (%)
Table 4. Injury vs. consequence of injury for manual wheelchairs *. Consequence of injury
Death Intervention No intervention None Unknown Total
Injury n % n % n % n % n % n None - - - - - - 578 100 - - 578 Unknown - - 6 29 1 5 - - 14 67 21 Other 2 15 9 69 1 8 - - 1 8 13 Fracture 1 10 9 90 - - - - - - 10 Cut - - 9 90 - - - - 1 10 10 Multiple injury - - 2 100 - - - - - - 2 Total 3 35 2 578 16 634
*Note that the percentages for the injuries are given in the rows.
3.1.4 Effects
Figure 3 shows the effects of problems with powered and manual wheelchairs. Falls and tips were found to be the most common effect of problems for powered wheelchairs (23%). No distinction was made between users falling from a wheelchair and users tipping over with a wheelchair. For manual wheelchairs, the effects of problems were mostly ‘unknown’ (90%).
Figure 3. Effects of problems with wheelchairs. Effects for powered wheelchairs (solid bars, n=180) and for manual wheelchairs (open bars, n=634) are shown as percentage.
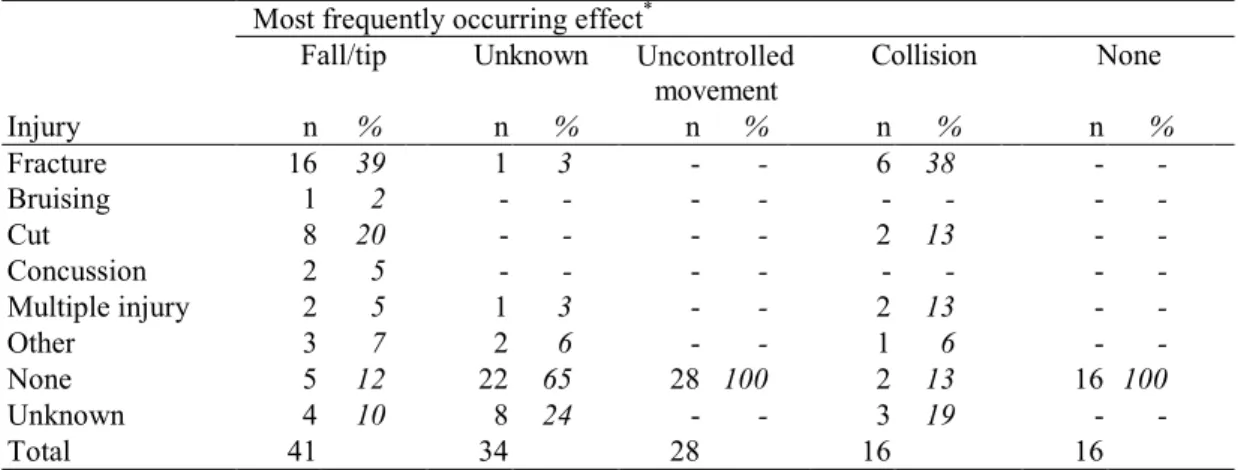
The most frequently mentioned effect for powered wheelchairs, ‘falls and tips’, often led to fractures (39%, Table 5). The effect ‘uncontrolled movement’ did not often lead to an injury.
0 20 40 60 80 100
Fire w heelchair & user Standstill Entrapment Exploding rim / tire Other Fire w heelchair None Collision Uncontrolled movement Unknow n Fall / tip Percentage (%)
Table 5. Injury vs. most frequently occurring effect for powered wheelchairs.
Most frequently occurring effect*
Fall/tip Unknown Uncontrolled Collision None
movement Injury n % n % n % n % n % Fracture 16 39 1 3 - - 6 38 - -Bruising 1 2 - - - - - - - -Cut 8 20 - - - - 2 13 - -Concussion 2 5 - - - - - - - -Multiple injury 2 5 1 3 - - 2 13 - -Other 3 7 2 6 - - 1 6 - -None 5 12 22 65 28 100 2 13 16 100 Unknown 4 10 8 24 - - 3 19 - -Total 41 34 28 16 16
* Effects ‘fire wheelchair’ (n=14), ‘other’ (n=12), ‘exploding rim/tire’ (n=6), ‘entrapment’ (n=5), ‘standstill’ (n=4), and ‘fire wheelchair and user’ (n=4) are not shown.
For powered wheelchairs the category ‘other’ comprised the following effects: ● wheelchair ran over foot (4x),
● user tripped over wheelchair (2x), ● user got trapped due to a wrong transfer, ● push handle touched boiling pot of water, ● chair useless,
● discomfort,
● user slid forward in seat, ● spouse fell from footplate.
The collision leading to an ‘other’ injury (Table 5) was the only incident in which a bystander (no user or operator) was injured. The report stated that “while the user was learning how to drive the chair, user accidentally changed from drive 1 to drive 2. This caused the chair to take off and hit a bystander in the stomach. As a result, the bystander received an intestinal injury”.
For manual wheelchairs the effects were mostly ‘unknown’, nearly always resulting in no injury. Falls and tips as well as effects categorised as ‘other’ were responsible for the majority (71%) of the few specified injuries.
Table 6. Injury vs. effect for manual wheelchairs.
Effect
Unknown Fall/tip Other None Entrapment
Injury n % n % n % n % n % Fracture - - 6 15 1 6 - - 3 60 Cut 1 0 2 5 7 44 - - - -Multiple injury - - 2 5 - - - - - -Other - - 9 22 2 13 6 100 2 40 None 557 98 11 27 4 25 - - - -Unknown 8 1 11 27 2 13 - - - -Total 566 41 16 6 5
For manual wheelchairs the category ‘other’ included: ● pusher caught chair when wheel broke,
● user cut himself on wheelchair (6x), ● shopping basket fell on user’s knee, ● armrest broke,
● user was lowered in chair (2x), ● chair collapsed,
● wobbling chair, ● near fall,
● chair folded under user.
3.1.5 Problems
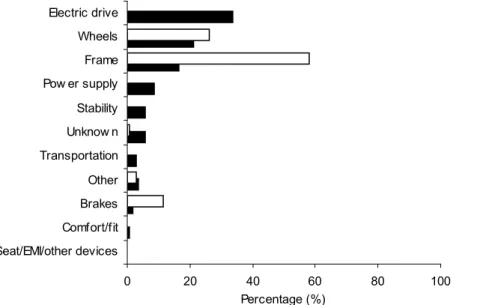
Electronic problems involving electric drive (controllers, drive systems) and power supply (batteries, charger) were unique to powered wheelchairs and were mentioned in many reports (Figure 4). Problems occurring for both types of wheelchairs were related to frame, wheels, and brakes. The majority of manual wheelchair problems were reported to be failures of these mechanical components. Instability and problems during transportation were only reported for powered wheelchairs. Electromagnetic interference (EMI) was not reported for powered wheelchairs.
Figure 4. Wheelchair-related problems. Problems are shown as percentages for powered wheelchairs (solid bars, n=175) and manual wheelchairs (open bars, n=632).
It should be noted that the total number of problems for powered wheelchairs (n=175, Table 7) is lower than the number of reports (n=180). Of the 180 reports on powered wheelchairs, 16 reports mentioned no problem, 153 reports mentioned one problem and 11 reports mentioned two problems. The number of problems mentioned for manual wheelchairs (n=632, Table 8) is lower than the number of reports for manual wheelchairs (n=634). In four reports, no problems were mentioned, In 628 reports one problem was mentioned and in two reports two problems were mentioned.
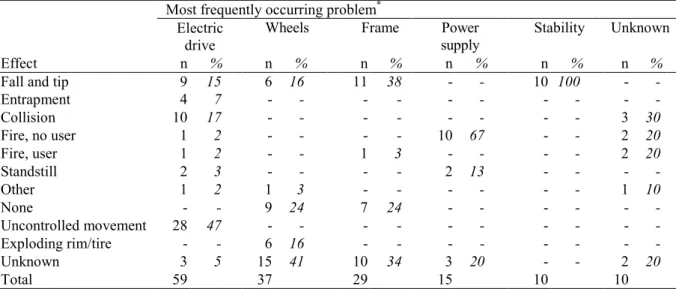
Problems with the ‘electric drive’ of powered wheelchairs often led to uncontrolled movement (28 of 59 cases) or collisions (10 of 59 cases) as shown in Table 7. Power supply led to fire in 10 of 15 problems reported. Falls and tips were the result of problems with frame, stability, electric drive or wheels.
A unique example of a problem with the power supply is the report about a wheelchair that caught fire at the wire harness. A review of the incident by the engineering department revealed that a nickel and a dime, found in the returned charger, shorted the wire leads.
0 20 40 60 80 100 Seat/EMI/other devices Comfort/fit Brakes Other Transportation Unknow n Stability Pow er supply Frame Wheels Electric drive Percentage (%)
Table 7. Effect vs. most frequently occurring problem for powered wheelchairs.
Most frequently occurring problem*
Wheels Frame Stability Unknown
Electric
drive supplyPower
Effect n % n % n % n % n % n %
Fall and tip 9 15 6 16 11 38 - - 10 100 -
-Entrapment 4 7 - - - - - - - - - -Collision 10 17 - - - - - - - - 3 30 Fire, no user 1 2 - - - - 10 67 - - 2 20 Fire, user 1 2 - - 1 3 - - - - 2 20 Standstill 2 3 - - - - 2 13 - - - -Other 1 2 1 3 - - - - - - 1 10 None - - 9 24 7 24 - - - - - -Uncontrolled movement 28 47 - - - - - - - - - -Exploding rim/tire - - 6 16 - - - - - - - -Unknown 3 5 15 41 10 34 3 20 - - 2 20 Total 59 37 29 15 10 10
*The problems ‘transportation’ (n=5), ‘other’ (n=6), ‘brakes’ (n=3) and ‘comfort or fit’ (n=1) are not shown. Problems categorised as ‘other’ were:
● ”sip-n-puff straw” (used to control chair by mouth), ● backrests fell back due to failing actuator,
● cable from chair got caught and was torn off, ● unspecified pin broke,
● protruding part, ● melted parts.
For manual wheelchairs, effects of the problems ‘frame’, ‘wheels’ and ‘brakes’ were mostly unknown (Table 8). Falls and tips were mostly caused by problems with wheels, frame and brakes.
Table 8. Effect vs. most frequently occurring problem for manual wheelchairs.
Most frequently occurring problem*
Frame Wheels Brakes Other Unknown Seat
Effect n % n % n % n % n % n %
Fall and tip 12 3 14 8 6 8 3 16 1 25 1 33
Entrapment 1 - - - - - 3 16 - - -
-Other 3 1 2 1 - - 9 47 1 25 2 67
None 4 1 2 1 - - - - - - -
-Unknown 346 95 148 89 67 92 4 21 2 50 -
-Total 366 166 73 19 4 3
* The problem ’transportation’ (n=1) is not given.
The category‘other’ included: ● detent button spring came out, ● protruding part (7x),
● combination chair / shopping basket,
● adjustment left little space between arm rest and wheel, ● user lost balance,
● retrofit kit was not installed, ● safety belt,
● pin is stuck in housing leaving it non-functional, ● anti tips (2x),
● release pin stuck, ● push handle came off,
● unidentified part cracked.
The incident with the safety belt led to the death of the user. The report stated that it was a custom made wheelchair. The report further stated “The chair had a h-strap attached to a lap seat belt. The latch mechanism malfunctioned at the waist allowing the patient to slide forward at the hips and their throat became trapped on top of the h-strap.”
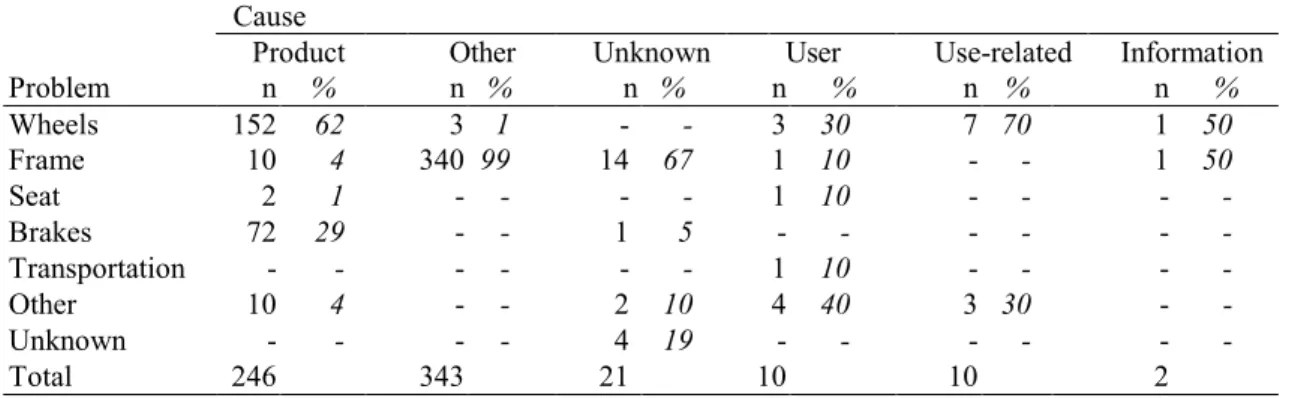
3.1.6 Causes
Figure 5 depicts the causes of wheelchair incidents. For powered wheelchairs, the product is the major cause, whereas the major causes for manual wheelchairs are ‘product’ and ‘other’.
Figure 5. Causes of wheelchair incidents. Causes are shown as percentages for powered wheelchairs (solid bars, n=180) and manual wheelchairs (open bars, n=634) obtained from the MAUDE database.
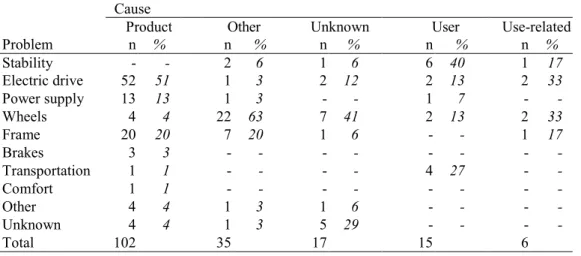
The relation between problems and their causes is shown in Table 9 for powered wheelchairs. It should be noted that the number of causes (n=175, see 3.1.5) is lower than the number of causes mentioned in Figure 5 (n=180). If the cause was ‘product’, the problems mentioned were most often related to the electrical systems (‘electric drive’ and ‘power supply’).
Table 9. Cause vs. problem for powered wheelchairs.
Cause
Product Other Unknown User Use-related
Problem n % n % n % n % n % Stability - - 2 6 1 6 6 40 1 17 Electric drive 52 51 1 3 2 12 2 13 2 33 Power supply 13 13 1 3 - - 1 7 - -Wheels 4 4 22 63 7 41 2 13 2 33 Frame 20 20 7 20 1 6 - - 1 17 Brakes 3 3 - - - - - - - -Transportation 1 1 - - - - 4 27 - -Comfort 1 1 - - - - - - - -Other 4 4 1 3 1 6 - - - -Unknown 4 4 1 3 5 29 - - - -Total 102 35 17 15 6 0 20 40 60 80 100 Other devices Information Use-related Unknow n User Other Product Percentage (%)
The cause ‘other’ (n=35) for powered wheelchairs comprised the following causes: ● high stresses/excessive loading (n=31);
● combination user and product; ● wrong chair supplied;
● inattention of user and carer; ● short circuit due to coins.
Causes of problems with manual wheelchairs were most often categorised as ‘other’. These ‘other’ causes led to the problem ‘frame’ in 99% of all incidents. It should be noted that the number of causes (n=632) is lower than the number of causes in Figure 5 (n=634), because for two incidents no problems were identified (see 3.1.5).
Table 10. Cause vs. problem for manual wheelchairs.
Cause
Product Other Unknown User Use-related Information
Problem n % n % n % n % n % n % Wheels 152 62 3 1 - - 3 30 7 70 1 50 Frame 10 4 340 99 14 67 1 10 - - 1 50 Seat 2 1 - - - - 1 10 - - - -Brakes 72 29 - - 1 5 - - - - - -Transportation - - - - - - 1 10 - - - -Other 10 4 - - 2 10 4 40 3 30 - -Unknown - - - - 4 19 - - - - - -Total 246 343 21 10 10 2
For manual wheelchairs causes categorised as ‘other’ (n = 344) included: ● awkward transfer;
● high stresses/excessive loading (n=343).
An example of a report for a manual wheelchair mentioning high stresses is: “Reporter states the X-tube cracked while the chair was in use. No injuries reported.” Additional manufacturers narrative stated: “High stress factor at centre and ends of X-tube.”
3.1.7 To whom it happened
For powered wheelchairs the occupant operated the wheelchair in 172 of the 180 cases (96%). In the other 8 cases, the operator was someone else, e.g. a family member or a carer. For manual wheelchairs, in 615 of the 634 incidents (97%) the occupant operated the wheelchair. In 11 cases the operator was someone else, e.g. a family member or a carer, and in 8 cases it was unknown who operated the wheelchair. The age of the user was never mentioned and hardly any information was offered on the pre-existing condition of the user.
3.1.8 Device involved
3.1.8.1 Brand name
The brand ‘Quickie’ was involved in half of the incidents with powered wheelchairs (Table 11). The brand names ‘Action Storm’, ‘Pride’ and ‘Ranger’ were also mentioned frequently.
Table 11. Brand names for powered wheelchairs
Brand name Occurrence
n % Quickie 90 50 Action storm 23 13 Pride 21 12 Ranger 18 10 Other 10 6 Rascal 8 4 Power 9000 5 3 Tiger 3 2 Unknown 2 1 Total 180
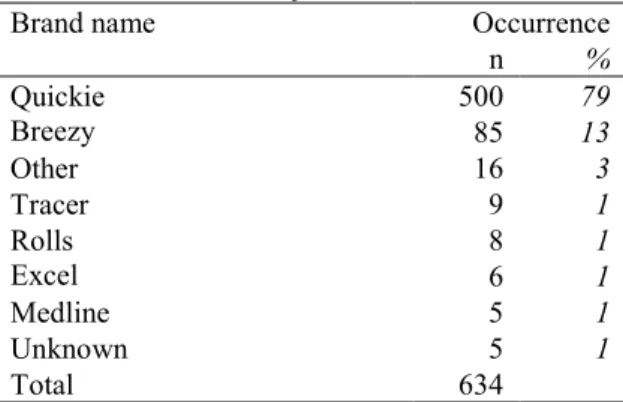
For manual wheelchairs the brands ‘Quickie’ and ‘Breezy’ occur most frequently and together they are mentioned in 92% of all incidents (Table 12). Both brand names are marketed by Sunrise.
Table 12. Brand names for manual wheelchairs
Brand name Occurrence
n % Quickie 500 79 Breezy 85 13 Other 16 3 Tracer 9 1 Rolls 8 1 Excel 6 1 Medline 5 1 Unknown 5 1 Total 634 3.1.8.2 Wheelchair age
For powered as well as manual wheelchairs the first bulge of wheelchair-related incidents was reported within the 7-12 months wheelchair age group (Figure 6). After one year the number of reported incidents for powered wheelchairs decreased, whereas manual wheelchairs showed repetitive bulges of increased reported incidents at 25-30 months, 61-66 months, and 85-90 months.
3.1.8.3 Device usage
In incident reports for powered wheelchairs, reuse was mentioned 12 times, initial device usage was mentioned 141 times, and no information was given in 27 cases. In the reports for manual wheelchairs, reuse was mentioned 6 times, initial device usage was mentioned 610 times, and no information was given in 18 cases.
3.1.8.4 510 (k) number
A 510 (k) number for the wheelchairs (see Appendix 2) was indicated in 129 out of 180 reported incidents with powered wheelchairs. For manual wheelchairs a 510 (k) number was mentioned in 578 out of 634 reported incidents.
Figure 6. Distribution of wheelchairs involved in reported incidents by age. Incidents for powered wheelchairs (solid bars, n=180) and manual wheelchairs (open bars, n=634) are shown. The >120 months age group consisted of manual wheelchairs up to 16 years old.
3.1.9 Location of incident
Table 13 and 14 indicate that the location was not mentioned in most of the reports in the MAUDE database. For powered wheelchairs (Table 13), the location was specified in only 68 of the 180 cases. For falls and tips the location outdoors was more frequently mentioned than the location indoors.
Table 13. Location vs. effect for powered wheelchairs.
Location
Indoors1 Outdoors Institution Transportation Unknown
Effect n % n % n % n % n %
Falls and tips 3 10 20 61 1 50 4 100 13 12
Entrapment 2 7 1 3 - - - - 2 2
Collision 7 24 3 9 - - - - 6 5
Fire, no user 7 24 1 3 1 50 - - 5 5
Fire with user - - 1 3 - - - - 3 3
Standstill - - - - - - - - 4 4 Other 4 14 2 6 - - - - 6 5 None 1 3 1 3 - - - - 14 13 Uncontrolled movement 2 7 2 6 - - - - 24 21 Exploding tire - - 1 3 - - - - 5 4 Unknown 3 10 1 3 - - - - 30 27 Total 29 33 2 4 112 1 Not in an institution 0 10 20 30 40 50 60 70 80 1-6 7-12 13-18 19-24 25-30 31-36 37-42 43-48 49-54 55-60 61-66 67-72 73-78 79-84 85-90 91-96 97-102 103-108 109-114 115-120 >120 unknow n
Wheelchair age (months)
N
For manual wheelchairs, the location was not specified in 591 of 634 cases (94%, Table 14).
Table 14. Location vs. effects for manual wheelchairs.
Location
Inside Outside Institution Transportation Unknown
Effect n % n % n % n % n %
Falls and tips 10 48 6 50 2 22 1 100 22 4
Entrapment - - - - 3 33 - - 2 0 Other 5 24 1 8 4 44 - - 6 1 None - - - - - - - - 6 1 Unknown 6 29 5 42 - - - - 555 94 Total 21 12 9 1 591
3.2
MDA
3.2.1 General
The MDA received 463 reports for powered wheelchairs and 600 reports for manual wheelchairs. The investigation of the reported incidents was completed for 436 reports on powered wheelchairs and for 561 reports on manual wheelchairs. Information on these incident reports was supplied by the MDA. The MDA supplied a database containing information on the closed reports (Table 15). The number of mandatory vigilance reports by the manufacturer were three for powered wheelchairs and two for manual wheelchairs (personal communication M. Rand, MDA).
Table 15. Items per wheelchair incident of the MDA database.
Category Number of
items wheelchairPowered wheelchairManual
n % n % Outcome 1 372 85 521 93 2 61 14 34 6 3 3 1 6 1 Problem 1 436 100 561 100 Cause 1 344 79 480 86 2 76 17 74 13 3 16 4 7 1 Action taken 1 372 85 500 89 2 58 13 48 9 3 6 1 13 2
3.2.2 Outcomes
In a minority of the incidents actual injury was mentioned as an outcome: 6 incidents with serious injuries and 1 fatal incident for powered wheelchairs; 1 incident with serious injury and 3 fatal incidents for manual wheelchairs (Figure 7). The type of injury was infrequently reported. ‘Actual minor injuries’ were reported more often than actual injuries (5.6 vs. 1.4% for powered wheelchairs, 5.8 vs. 0.7% for manual wheelchairs). The majority of manual wheelchair incidents resulted in an ‘unknown’ outcome (28%) or ‘no effect’ (27%). The most common outcome for powered wheelchairs was potential injury (27%), which indicates that many incidents could have led to injuries.
Figure 7. Outcomes of wheelchair incidents. Outcomes are shown as percentages for powered wheelchairs (solid bars, n=503) and manual wheelchairs (open bars, n=607) obtained from the MDA database.
3.2.3 Problems
The majority of wheelchair problems were related to frame and wheels for powered as well as for manual wheelchairs (Figure 8). Electronic/electrical components for powered wheelchairs (electrical, power supply, and electric drive) were affected by failure to a slightly lesser extent. For ‘other’ problems the failures were not allocated by the MDA (n=49 and n=43 for powered and manual wheelchairs, respectively) and not specified ‘wheelchair’ problems (n=10 and n=9 for powered and manual wheelchairs, respectively).
Figure 8. Wheelchair-related problems. Problems are shown as percentages for powered wheelchairs (solid bars, n=436) and manual wheelchairs (open bars, n=561) obtained from the MDA database.
0 10 20 30 40 50
Actual injury Not used Actual minor injury No effect Other Unknow n Potential injury Percentage (%) 0 20 40 60 80 100 Seat Stability Brakes Electric drive Pow er supply Other Electrical Wheels Frame Percentage (%)
For powered wheelchairs actual or potential injury was mentioned in 27% of the cases, evenly distributed over all categories of problems (Table 16).
Table 16. Outcome vs. most frequently occurring problem for powered wheelchairs MDA.
Most frequently occurring problem
Electrical Frame Other § Electric
drive supplyPower Wheels
Outcome n % n % n % n % n % n %
Actual injury - - - - 1 1 - - - - 6 7
Actual minor injury 2 2 6 6 6 8 2 3 3 4 9 10
No effect 13 14 24 22 9 12 16 27 13 16 10 11
Chair not used 2 2 7 7 7 9 9 15 - - 2 2
Other 29 31 14 13 3 4 13 22 28 35 16 18
Potential injury 20 22 36 34 18 24 7 12 27 34 28 31
Unknown 27 29 20 19 32 42 12 20 8 10 18 20
Total 93 107 76 59 79 89
§ Including: problem not allocated, brakes, seat and stability.
Also for manual wheelchairs no single problem seemed to contribute excessively to the (few) reported actual or the potential injuries (Table 17).
Table 17. Outcome vs. problem for manual wheelchairs MDA.
Problem
Brakes Frame Other Seat Wheels
Outcome n % n % n % n % n %
Actual injury - - 2 1 2 3 - - -
-Actual minor injury 3 7 11 4 9 14 1 9 11 6
No effect 9 21 83 28 10 15 2 18 58 30
Chair not used 5 12 21 7 2 3 1 9 18 9
Other 8 19 44 15 4 6 - - 19 10
Potential injury 5 12 48 16 10 15 4 36 49 25
Unknown 12 29 86 29 29 44 3 27 38 20
Total 42 295 66 11 193
3.2.4 Causes
Figure 9 depicts the causes of wheelchair incidents. Over one third of the causes for powered wheelchairs were product-related and nearly one fourth for manual wheelchairs. A remarkable fact is that no causes could be established for about 30% of the powered wheelchair incidents and 40% of the manual wheelchair incidents. User and use-related causes were less common, whereas quality assurance was the third cause of problems with manual wheelchairs.
Figure 9. Causes of wheelchair incidents. Causes are shown as percentage for powered wheelchairs (solid bars, n=544) and manual wheelchairs (open bars, n=649) obtained from the MDA database.
0 10 20 30 40 50
Other Packaging / storage / transit Labelling / instructions Quality assurance User Use-related Unknow n Product Percentage (%)
Table 18 shows the relation between cause and problem for powered wheelchairs. Powered wheelchair incidents mentioned a product failure as the major cause. The cause ‘product failure’ was related to problems of the electrical system (electric drive, power supply, and not specified electrical components: 37%), frame components (29%), and wheels (23%).
Table 18. Cause vs. most frequently occurring problem for powered wheelchairs MDA*.
Most frequently occurring problem
Electrical Frame Other § Electric
drive Power supply Wheels Total
Cause n % n % n % n % n % n % n LI# 7 23 1 3 5 16 3 10 12 39 3 10 31 Other 4 80 - - 1 20 - - - - - - 5 PST# - - - - 2 40 1 20 - - 2 40 5 Product 27 14 55 29 22 11 22 11 23 12 44 23 193 QA# 4 9 7 15 9 20 6 13 5 11 15 33 46 Unknown 38 24 29 18 35 22 18 11 13 8 25 16 158 User 5 10 14 28 14 28 2 4 4 8 11 22 50 Use-related 10 18 6 11 4 7 5 9 15 27 16 29 56
* Note that the percentages for the causes are given in the rows.
§ Including: problem not allocated, brakes, seat and stability.
# LI = labelling / instructions; PST= packaging / storage / transit; QA= quality assurance
The majority of manual wheelchair reports mentioned an unknown cause attributing to frame problems (52%) for the major part of the incidents (Table 19). Product failure was the second major cause and was related to frame problems (48%) and wheel problems (36%) as well.
Table 19. Cause vs. problem for manual wheelchairs MDA*.
Problem
Brakes Frame Other Seat Wheels Total
Cause n % n % n % n % n % n LI 2 15 4 31 5 39 1 8 1 8 13 Other - - 2 100 - - - - - - 2 PST - - 12 60 1 5 - - 7 35 20 Product 12 8 75 48 10 7 2 1 56 36 155 QA 8 9 37 41 2 2 4 4 39 43 90 Unknown 19 8 128 52 32 13 4 2 62 25 245 User 8 9 43 49 11 13 3 3 22 25 87 Use-related 2 5 16 43 4 11 - - 15 41 37
* Note that the percentages for the causes are given in the rows.
3.2.5 Actions
The majority of actions were device-related and consisted of device exchange, recall, and/or repair (Figure 10). ‘Unknown’ and ‘none’ were frequently reported and ‘design modified’ was ranked fourth.
Figure 10. Actions taken due to wheelchair incidents. Actions are shown as percentage for powered wheelchairs (solid bars, n=506) and manual wheelchairs (open bars, n=635) obtained from the MDA database.
For powered wheelchairs product failure was most frequently related to a modification of the wheelchair design (32%) followed by device-related actions (21%) (Table 20).
Table 20. Action taken vs. most frequently occurring cause for powered wheelchairs MDA.
Most frequently occurring cause
Other § Product QA Unknown User Use-related
Action taken n % n % n % n % n % n %
Additional user training 1 11 1 1 1 2 - - 5 9 -
-Alt. manufact. method - - - - 5 9 1 1 1 2 1 1
Design modified - - 49 32 - - - - 8 15 9 12 Device-related action 1 11 32 21 25 45 22 14 9 17 33 42 Field correction - - 8 5 1 2 - - 3 6 2 3 Improved maintenance - - - - - - - - - - 10 13 Improved QA - - 1 1 13 24 - - - - 1 1 LI 4 44 13 8 1 2 - - 5 9 8 10
Manufacturer advice notice - - 13 8 1 2 - - - - 3 4
None 3 33 24 16 5 9 18 11 22 42 7 9
Production ceased - - 6 4 - - - - - - 1 1
Safety warning issued - - 2 1 3 5 - - - - 3 4
Unknown - - 4 3 - - 117 74 - - -
-Total 9 153 55 158 53 78
§ Including: other cause, labelling / instructions, and packaging / storage / transit
LI = labelling / instructions; QA = quality assurance
0 10 20 30 40 50
Production ceased Safety w arning issued Alternative manufacture method Additional user training Improved maintenance Field correction Improved quality assurance Manufacturer advisory notice Labelling / instructions modified Design modified None Unknow n Device-related action
For manual wheelchairs product failure was firstly related to device-related actions (42%) and secondly to a modification of wheelchair design (24%) (Table 21).
Table 21. Action taken vs. most frequently occurring cause for manual wheelchairs MDA.
Most frequently occurring cause
Other § Product QA Unknown User Use-related
Action taken n % n % n % n % n % n %
Additional user training - - 2 2 1 1 - - 7 7 -
-Alt. manufact. method 1 6 2 2 1 1 - - 1 1 1 2
Design modified - - 30 24 5 5 1 0 16 16 7 16 Device-related action 11 65 52 42 46 44 25 10 23 23 11 24 Field correction - - 6 5 1 1 2 1 6 6 - -Improved maintenance - - - - - - - - - - 7 16 Improved QA - - 5 4 40 38 8 3 2 2 2 4 LI 3 18 2 2 1 1 - - 3 3 1 2
Manufacturer advice notice - 12 - - - - - - - - 1 2
None 2 - 25 20 9 9 40 16 42 42 15 33
Production ceased - - - - - - - - - - -
-Safety warning issued - - 1 1 - - - - - - -
-Unknown - - - - - - 168 69 - - -
-Total 17 125 104 244 100 45
§ Including: other cause, labelling / instructions, and packaging / storage / transit
LI = labelling / instructions; QA = quality assurance
3.3
KBOH
3.3.1 General
Fourteen reports were received from KBOH over the period June 1997 - January 2001. One report mentioned four incidents, whereas all other reports mentioned one incident. The CE mark and the GQ-mark (see Appendix 1 and 3) were both mentioned three times.
3.3.2 Reported incidents
Table 22. Summary of KBOH data
No. Type of
wheelchair Consequence Injury Effect Problem Cause
1 Manual Unknown Unknown Entrapment Other Product
2 Manual Unknown Unknown Unknown Frame Product
2 Manual None None Uncontrolled
movement
Electric drive Product
4* Manual Unknown Unknown Other Frame Product
5 Manual Treatment Multiple Entrapment Other Unknown
6* Manual Unknown Unknown Entrapment Instability Unknown
7* Manual Unknown Unknown Entrapment Instability Unknown
8* Manual Unknown Pain Other Other Unknown
9 Powered None None Standstill Electric drive, wheels Information
10 Powered None None Unknown Electric drive Product
11 Powered Treatment Unknown Entrapment Electric drive, wheels Product
12 Powered Unknown Unknown Collision EMI Product
13 Powered Unknown Other Standstill Electric drive Product
14 Powered Treatment Unknown Entrapment Electric drive Product
15 Powered Unknown Unknown Entrapment Wheels Product
16 Powered None None Other Electric drive Unknown
17 Powered None None Standstill Electric drive Use-related
3.4
Wheelchair standards
3.4.1 ISO standards
The ISO 7176-serie contains a number of standards dealing with several aspects of both manual and powered wheelchairs (see Appendix 7).
3.4.2 CEN standards
There are two European standards on wheelchairs:
● EN 12183 “Manually propelled wheelchairs – Requirements and test methods” and ● EN 12184 “Electrically powered wheelchairs, scooters and their chargers – Requirements
and test methods”.
EN 12183 refers to all parts of the ISO 7176-series that specify requirements for manual wheelchairs. EN 12184 refers to all published standards from the ISO 7176-series, except for part 7 and part 22. If the ISO standards do not give requirements, the EN standards state these requirements and refer to the ISO standard for the test method.
3.5
Quality marks
In the FDA-MAUDE database, information was given on the 510 (k) approval (see 3.1.8.4 and Appendix 2). For the MDA, the percentage of wheelchairs bearing a CE mark involved in incidents was 63% for powered wheelchairs and 72% for manual wheelchairs (personal communication M. Rand, MDA). For the KBOH, a CE mark and GQ mark on the device were only mentioned three times.
4.
Summary of results
4.1
FDA MAUDE database
4.1.1 Powered wheelchairs
During the period July 2000-June 2001 the number of reported incidents was 180. The major cause of the incidents was product-related (54%), whereas user or use-related causes were less common (18%). Product-related causes resulted in problems concerning electric drive (51%), frame (20%), and power supply (13%). Other and unknown causes were frequently related to wheel failures in 63% and 41% of the cases, respectively. User-related causes often led to instability (40%).
Problems with the electric drive were the most frequently occurring problems (34%). Twenty-one percent of the problems were due to wheel failures, 17% to frame failures, 9% to power supply, and 6% to stability. Problems with the electric drive led to uncontrolled movements (47%), collisions (17%) and falls and tips (15%). Wheel problems led to unknown effects (41%), no effect (24%), exploding rims/tires (16%) and falls and tips (16%). Frame failures led to falls and tips (38%), but also to unknown effects (34%) and no effects (24%). Problems with the power supply led frequently to a wheelchair fire without user (67%) and instability of the wheelchair always led to falls and tips.
Falls and tips (23%), unknown effects (19%), uncontrolled movements (16%) and collisions (9%) were the most frequently mentioned effects of problems, whereas no effect was reported in 9% of the incidents. Falls and tips resulted mainly in fractures (39%) and cuts (20%). Wheelchair incidents with unknown effect often did not cause any injury (65%). Uncontrolled movement, often a consequence of electric drive problems, never led to an injury. Collision resulted mainly in fractures (38%) and to a lesser extent in cuts, multiple injuries and no injuries (all 13% of the cases of collisions), whereas the injury was unknown in 19% of these cases. In a small number of the incidents (9%) no effect was reported and therefore no injury was given.
In 49% of all incidents no injury was reported, whereas fractures and unknown injuries were mentioned in 19% and 11% of the incidents, respectively. Other injuries and cuts were both mentioned in 7% of the cases. Medical intervention was always required for fractures and cuts, whereas ‘other’ injuries frequently resulted in medical intervention (75%). If the injury was unknown, the consequence of injury was often unknown (80%). In other cases, the MAUDE report mentioned that medical intervention was required. A burn was only mentioned once, but this particular incident caused the only death reported for powered wheelchairs.
4.1.2 Manual wheelchairs
During the period July 2000-June 2001 the number of reported incidents was 634. Most incidents were attributed to ‘other’ causes (54%) leading to a frame failure in 99% of the cases. The product was the second frequently mentioned cause (39%) resulting in failures of wheels (62%) and brakes (29%).
Frame failures were a major problem (58%), but wheels (26%) and brakes (12%) were also frequently mentioned. Frame failures led to an unknown effect in 95% of the cases, whereas it led to falls and tips in only 3% of the cases. Wheel failures led to an unknown effect in 89% of the cases and falls and tips in 8% of the cases. Problems with the brakes led to unknown effect in most instances (92%) and only led to falls and tips in 8% of the cases.