This is a publication of:
National Institute for Public Health and the Environment
P.O. Box 1 | 3720 BA Bilthoven The Netherlands www.rivm.nl August 2011 002796
Environment
radioactivity
in the
Netherlands
Environmental radioactivity in the Netherlands
Environmental radioactivity in the
Netherlands
Results in 2009
© RIVM 2011
Parts of this publication may be reproduced, provided acknowledgement is given to the 'National Institute for Public Health and the Environment', along with the title and year of publication.
NV. Electriciteit-Productiemaatschappij Zuid-Nederland EPZ
This investigation has been performed by order and for the account of the Ministry of Economic Affairs, Agriculture and Innovation, within the framework of Project 610891: environmental monitoring of radioactivity and radiation.
M.C.E. Groot (editor), RIVM
G.J. Knetsch (editor), RIVM
Contact:
G.J. Knetsch
Laboratory for Radiation Research (LSO)
Gert-Jan Knetsch@rivm.nl
Abstract
Environmental radioactivity in the Netherlands Results in 2009
In 2009 the Netherlands fulfilled the European obligation to annually measure radioactivity in the environment and in food. According to the Euratom Treaty of 1957, all Member States of the European Union are obliged to perform these measurements each year. Euratom has provided guidelines for performing the measurements uniformly since 2000. However, Member States are not obliged to comply with these recommended guidelines. In the Netherlands, in 2009 strontium-90 was also determined (for the first time) in a mixed food package for which the above recommendations had been fulfilled.
The National Institute for Public Health and the Environment (RIVM) reports on behalf of the Netherlands to the European Union about radioactivity in the environment. Moreover, this information provides background values and/or amounts of radioactivity that are present under normal circumstances. These background values can be used as reference values, for instance, during a disaster.
Radioactivity in air, food and milk.
The measurements in the air and environment showed normal levels. The deposition of polonium-210 showed the highest level since 1993, and approximately the same level as in 2008.
Radioactivity levels in food and milk were well below the export and consumption limits set by the European Union.
Radioactivity in surface water
The activity concentration in surface water was in some locations above the target values from the Vierde Nota waterhuishouding (1998). However, these exceeded values do not pose a threat to public health. Target values are values that should preferably not be exceeded but they are not limits as such.
Keywords:
Rapport in het kort
Radioactiviteit in het Nederlandse milieu Resultaten in 2009
In 2009 voldeed Nederland aan de Europese verplichting om jaarlijks de hoeveelheid radioactiviteit in het milieu en in voeding te meten. Volgens het Euratom-verdrag uit 1957 zijn alle lidstaten van de Europese Unie verplicht deze metingen jaarlijks te verrichten. Sinds 2000 bevat Euratom aanbevelingen om de metingen volgens een bepaald stramien uit te voeren, maar lidstaten zijn niet verplicht deze na te leven. In 2009 heeft Nederland voor het eerst ook
strontium-90 bepaald in een gemengd voedselpakket, waarmee aan al deze aanbevelingen is voldaan.
Het RIVM rapporteert namens Nederland over radioactiviteit in het milieu aan de Europese Unie. Deze informatie levert bovendien achtergrondwaarden, oftewel hoeveelheden radioactiviteit die onder normale omstandigheden aanwezig zijn. Deze waarden kunnen bijvoorbeeld bij calamiteiten of rampen als referentie dienen.
Radioactiviteit in lucht, voedsel en melk
De metingen in lucht en omgeving lieten een normaal beeld zien. De depositie van polonium-210 is het hoogst sinds 1993, en ongeveer even hoog als in 2008. De radioactiviteitsniveaus in voedsel en melk zijn duidelijk beneden de Europese limieten voor consumptie en export.
Radioactiviteit in oppervlaktewater
In het oppervlaktewater ligt de activiteitsconcentratie op een aantal locaties boven de streefwaarden uit de Vierde Nota waterhuishouding (1998). De overschrijdingen zijn echter zodanig dat ze niet schadelijk zijn voor de
volksgezondheid. Streefwaarden zijn waarden die bij voorkeur niet overschreden mogen worden, maar het zijn geen limieten.
Trefwoorden:
Preface
The following institutes have contributed to the report:
The National Institute for Public Health and the Environment Rijksinstituut voor Volksgezondheid en Milieu (RIVM)
Data on air dust, deposition, ambient dose rates and drinking water. ing. G.J. Knetsch (editor), ing. R.B. Tax (RIVM/LSO), ir. J.F.M. Versteegh (RIVM/IMG).
RWS WD Centre for Water Management Rijkswaterstaat Waterdienst (RWS WD)
Data on seawater and surface water from the main inland waters. C. Engeler, ing. M van der Weijden.
The Food and Consumer Product Safety Authority Voedsel en Waren Autoriteit (VWA)
Data on foodstuff.
drs. K. Zwaagstra, ing. G. Visser RIKILT - Institute of Food Safety
RIKILT - Instituut voor Voedselveiligheid Data on milk and foodstuff.
dr. G. C. Krijger, J.M. Weseman, ing. A. Vos van Avezathe, J. Verbunt. N.V. Elektriciteits-Produktiemaatschappij Zuid-Nederland (EPZ) Data on environmental samples around the nuclear power plant at Borssele, measured by Nuclear Research & consultancy Group (NRG).
Contents
Summary—11 Samenvatting—13
1 Introduction—19
2 Airborne particles—21
2.1 Long-lived α- and β-activity—21 2.2 γ-emitting nuclides—24
3 Deposition—29
3.1 Long-lived α- and β-activity—29 3.2 γ-emitting nuclides—34
4 National Radioactivity Monitoring Network—37
5 Surface water and seawater—43
5.1 Introduction—43
5.2 The results for surface water—47 5.3 The results for seawater—58
6 Water for human consumption—67
7 Milk—69
8 Food—71
8.1 Honey—71
8.2 Game and poultry—71
9 Nuclear power plant at Borssele—73
9.1 Air—74 9.2 Soil—75 9.3 Water—76
10 Conclusions—79
Appendix A Result tables—81
Appendix B The presentation of data—107 Appendix C Glossary—109
Summary
The Dutch government has the obligation to measure radioactivity in air, water and soil under the terms of the Euratom Treaty of 1957. In 2000, the European Union specified this treaty by means of recommendations describing the
matrices to be measured (air dust, ambient dose, surface water, drinking water, milk and food) and the frequency of the measurements. The results should be published yearly. This report presents the results of radioactivity measurements in the Dutch environment in 2009. The measurements were carried out by RIVM, Centre for Water Management, RIKILT, VWA, and (tasked by EPZ) NRG.
The yearly averaged activity concentration in air dust was determined for gross α, gross β, 7Be, 137Cs and 210Pb. The yearly total activity in deposition was determined
for gross α, gross β, 3H, 7Be, 137Cs, 210Pb and 210Po. Gross α and gross β is the total
activity of nuclides emitting α- and β-radiation, respectively. The results are presented in Table S1 and are within the range of those in previous years, except for the yearly total activity in deposition from 210Po (32.5 Bq·m-2) which is the
highest since 1993.
The National Radioactivity Monitoring Network (NMR) was used to determine the activity concentrations in air dust of gross α and artificial β (β-radiation emitted by man-made nuclides). The difference between the NMR data and those mentioned above is due to the contribution of short-lived natural radionuclides (radon daughters). The yearly averaged gross α-activity concentration in air dust was 3.3 Bq·m-3. The yearly average of the artificial β-activity concentration did
not deviate significantly from zero. The NMR was also used to determine the ambient dose equivalent rate, the yearly averaged measured value was 74.1 nSv·h-1.
The yearly averaged activity concentrations of gross α, residual β (gross β minus naturally occurring 40K), 3H, 90Sr and 226Ra were determined in surface water. The
yearly averaged activity concentrations of 60Co, 131I, 137Cs and 210Pb were
determined in suspended solids in surface water. In seawater, the yearly averaged activity concentrations were determined for gross α, residual β, 3H and 90Sr. The
yearly averaged activity concentrations of 137Cs and 210Pb were determined in
suspended solids in seawater. The results are presented in Table S1.
The gross α-activity concentration in the Noordzeekanaal, Nieuwe Waterweg and Scheldt exceeds the target value (100 mBqL-1) in 6 out of 6, 6 out of 13 and 13
out of 13 samples taken, respectively. The yearly averaged gross α-activity concentrations in the Noordzeekanaal, Nieuwe Waterweg and Scheldt (220, 113 and 380 mBq·L-1, respectively) are above the target value, but within the range
of those in previous years.
The residual β- and 90Sr-activity concentrations (of both individual samples and
yearly average) in surface water are below the target value (200 and 10 mBq·L-1
respectively).
The 3H-activity concentration in the Scheldt and Meuse exceeds the target value
(10 BqL-1) in 4 out of 7 and 4 out of 13 samples taken, respectively. The yearly
averaged 3H-activity concentrations in the Scheldt and Meuse (11.9 and
14.0 Bq·L-1, respectively) are above the target value of 10 Bq·L-1, but within the
The 60Co-activity concentration in suspended solids in the Meuse exceeds the
target value (10 Bqkg-1) in 6 out of 45 samples taken, but the yearly averaged 60Co-activity concentration is below the target value.
The 131I-activity concentration in suspended solids in the Noordzeekanaal and
Meuse exceeds the target value (20 Bqkg-1) in 6 out of 6 and 10 out of 45 samples
taken, respectively. The yearly averaged 131I-activity concentration in the Meuse
is below the target value. The yearly averaged 131I-activity concentration in the
Noordzeekanaal (29 Bq·kg-1) is higher than those in previous years, and exceeds
the target value.
The 137Cs-activity concentrations (of both individual samples and yearly average)
in suspended solids in surface water are below the target value (40 Bq·kg-1).
The 210Pb-activity concentration in suspended solidsin the Nieuwe Waterweg, Rhine
and Meuse exceeds the target value (100 Bqkg-1) in 4 out of 7, 6 out of 6 and
5 out of 6 samples taken, respectively. The yearly averaged 210Pb-activity
concentrations in the Nieuwe Waterweg, Rhine and Meuse (112, 120 and 153 Bq·kg-1, respectively) are above the target value, but within the range of
those in previous years.
The yearly averaged gross α-, and residual β-activity concentrations in seawater are in some areas higher than in previous years.
The yearly averaged 3H-, 90Sr-, and 137Cs-activity concentrations in seawater are
within the range of those in previous years.
Since 2009, for seawater 210Pb is reported instead of 210Po. The yearly averaged 210Pb-activity concentrations in seawater are within the range of those in previous
years.
Typical activities found in raw input water for drinking water production are
presented in Table S1. There is little potassium, and thus 40K, present in this water.
In 2009, the gross α-activity concentration averaged per production station did not exceed the screening value (0.1 Bq·L-1) at any of the 187 production
stations.
The results of the monitoring program in milk and mixed diet are presented in Table S1. Radioactivity levels are well below the export and consumption limits set by the European Union.
Data on environmental samples taken around the nuclear power plant at Borssele are presented in Table S2.
In 2009, the Netherlands complied with the Euratom recommendations, including the determination of 90Sr in mixed diet, which was performed by
Samenvatting
In het kader van het Euratom Verdrag uit 1957 is de Nederlandse overheid verplicht om radioactiviteitsgehalten te meten in de compartimenten lucht, water en bodem. In 2000 heeft de Europese Unie dit nauwkeuriger
gespecificeerd middels aanbevelingen. Hierin wordt in detail beschreven wat moet worden gemeten (luchtstof, de omgevingsdosis, oppervlaktewater, drinkwater, melk en voedsel) en met welke frequentie. De resultaten dienen jaarlijks te worden gerapporteerd. In dit rapport worden de resultaten gegeven van radioactiviteitsmetingen in het Nederlandse milieu in 2009. De metingen zijn verricht door RIVM, RWS Waterdienst, RIKILT, VWA en (in opdracht van EPZ) NRG.
In luchtstof werd de jaargemiddelde activiteitsconcentratie bepaald van totaal-α, totaal-β, 7Be, 137Cs en 210Pb. In depositie werd de totale jaarlijkse activiteit
bepaald van totaal-α, totaal-β, 3H, 7Be, 137Cs, 210Pb en 210Po. Totaal-α
respectievelijk totaal-β is de totale activiteit aan α- dan wel β-straling uitzendende nucliden. De resultaten zijn weergegeven in Tabel S1 en vallen binnen het bereik van voorgaande jaren, met uitzondering van de depositie van
210Po (32,5 Bq·m-2) die het hoogst sinds 1993 is.
Met het Nationaal Meetnet Radioactiviteit (NMR) werden activiteitsconcentraties bepaald in luchtstof voor totaal-α en kunstmatige β (β-straling uitgezonden door nucliden ontstaan door menselijk handelen). Het verschil tussen de
NMR-metingen en bovenstaande metingen wordt veroorzaakt door de bijdrage van kortlevende natuurlijke radionucliden (radondochters). Het jaargemiddelde voor de totaal-α-activiteitsconcentratie in luchtstof was 3,3 Bq·m-3. Het
jaargemiddelde voor de kunstmatige β-activiteitsconcentratie in luchtstof week niet significant af van nul. Met het NMR werd daarnaast het
omgevingsdosisequivalenttempo bepaald, de jaargemiddelde meetwaarde was 74,1 nSv·h-1.
In oppervlaktewater werd de jaargemiddelde activiteitsconcentratie bepaald van totaal-α, rest-β (totaal-β minus het van nature aanwezige 40K), 3H, 90Sr en 226Ra
en de jaargemiddelde activiteitsconcentratie van 60Co, 131I, 137Cs en 210Pb in
zwevend stof.In zeewater werd de jaargemiddelde activiteitsconcentratie bepaald van totaal-α, rest-β, 3H en 90Sr. In zwevend stof in zeewater werd de
jaargemiddelde activiteitsconcentratie bepaald van 137Cs en 210Pb. De resultaten
zijn weergegeven in Tabel S1.
De totaal α-activiteitsconcentratie in het Noordzeekanaal, de Nieuwe Waterweg en de Schelde overschrijdt de streefwaarde (100 mBqL-1) in respectievelijk 6 van de
6, 6 van de 13 en 13 van de 13 genomen monsters. De jaargemiddelde totaal α-activiteitsconcentraties in het Noordzeekanaal, de Nieuwe Waterweg en de Schelde (respectievelijk 220, 113 en 380 mBq·L-1) zijn boven de streefwaarde,
maar vallen binnen het bereik van voorgaande jaren.
De rest β- en 90Sr-activiteitsconcentraties (van zowel de individuele monsters als
het jaargemiddelde) in oppervlaktewater zijn beneden de streefwaarde (respectievelijk 200 en 10 mBq·L-1).
De 3H-activiteitsconcentratie in de Schelde en de Maas overschrijdt de streefwaarde
(10 BqL-1) in respectievelijk 4 van de 7 en 4 van de 13 genomen monsters. De
(5 mBqL-1) in 7 van de 7 genomen monsters. De jaargemiddelde 226
Ra-activiteitsconcentratie in de Schelde (12,4 mBq·L-1) is boven de streefwaarde,
maar valt binnen het bereik van voorgaande jaren.
De 60Co-activiteitsconcentratie in zwevend stof in de Maas overschrijdt de
streefwaarde (10 Bqkg-1) in 6 van de 45 genomen monsters. De jaargemiddelde 60Co-activiteitsconcentratie is echter beneden de streefwaarde.
De 131I-activiteitsconcentratie in zwevend stof in het Noordzeekanaal en de Maas
overschrijdt de streefwaarde (20 Bqkg-1) in respectievelijk 6 van de 6 en 10 van
de 45 genomen monsters. De jaargemiddelde 131I-activiteitsconcentratie in de
Maas is echter beneden de streefwaarde. De jaargemiddelde
131I-activiteitsconcentratie in het Noordzeekanaal (29 Bq·kg-1) is hoger dan in
voorgaande jaren en overschrijdt de streefwaarde.
De 137Cs-activiteitsconcentraties (van zowel de individuele monsters als het
jaargemiddelde) in zwevend stof in oppervlaktewater zijn beneden de streefwaarde (40 Bq·kg-1).
De 210Pb-activiteitsconcentratie in zwevend stof in de Nieuwe Waterweg, de Rijn en
de Maas overschrijdt de streefwaarde (100 Bqkg-1) in respectievelijk 4 van de 7, 6
van de 6 en 5 van de 6 genomen monsters. De jaargemiddelde
210Pb-activiteitsconcentraties in de Nieuwe Waterweg, de Rijn en de Maas
(respectievelijk 112, 120 en 153 Bq·kg-1) zijn boven de streefwaarde, maar
vallen binnen het bereik van voorgaande jaren.
De jaargemiddelde totaal α- en rest β-activiteitsconcentraties in zeewater zijn voor sommige gebieden hoger dan in voorgaande jaren.
De jaargemiddelde 3H-, 90Sr- en 137Cs-activiteitsconcentraties in zeewater vallen
binnen het bereik van voorgaande jaren.
Sinds 2009 wordt in zeewater 210Pb in plaats van 210Po gerapporteerd. De
jaargemiddelde 210Pb-activiteitsconcentraties in zeewater vallen binnen het bereik
van voorgaande jaren.
Gangbare activiteitsconcentraties die in ruw water voor de drinkwaterproductie gevonden worden, zijn weergegeven in Tabel S1. In dit water is weinig kalium, en dus 40K, aanwezig. De totaal α-activiteitsconcentratie gemiddeld per
productiestation overschrijdt de grenswaarde van 0,1 BqL-1 bij geen van de
187 productiestations.
De resultaten van het meetprogramma voor melk en voedsel zijn weergegeven in Tabel S1. De radioactiviteitsniveaus zijn duidelijk beneden de Europese limieten voor consumptie en export.
Gegevens betreffende milieumonsters genomen rondom de kerncentrale Borssele zijn weergegeven in Tabel S2.
Nederland voldeed in 2009 aan alle Europese aanbevelingen, inclusief de bepaling van 90Sr in voedsel uitgevoerd door RIKILT – Instituut voor
Table S1: Summary of the results of the Dutch monitoring program in 2009. Tabel S1: Overzicht van de resultaten van het Nederlandse
monitoringsprogramma in 2009.
Matrix Parameter Locations Values Frequency
(per year) Air dust (1) Gross α 1 0.029 mBq·m-3 52
Gross β 1 0.421 mBq·m-3 52 7Be 1 4.060 mBq·m-3 52 137Cs 1 0.00074 mBq·m-3 52 210Pb 1 0.363 mBq·m-3 52 Deposition (2) Gross α 1 36.9 Bq·m-2 12 Gross β 1 95 Bq·m-2 12 3H 1 0 - 1330 Bq·m-2 (3) 12 7Be 1 1410 Bq·m-2 52 137Cs 1 0 - 4.3 Bq·m-2 (3) 52 210Pb 1 82 - 125 Bq·m-2 (3) 52 210Po 1 32.5 Bq·m-2 12
Surface water (1) Gross α 6 36 - 380 mBq·L-1 6 or 13 (4)
Residual β 6 27 - 120 mBq·L-1 6 or 13 (4) 3H 6 3200 - 14000 mBq·L-1 6, 7 or 13 (4) 90Sr 3 1.8 - 3 mBq·L-1 6 or 7 (4) 226Ra 4 2.7 - 12.4 mBq·L-1 6 or 7 (4) Suspended solids 60Co 6 < 1 - 6.6 Bq·kg-1 6, 12, 13 or 45 (4) in surface water (1) 131I 6 < 1 - 29 Bq·kg-1 6, 12, 13 or 45 (4) 137Cs 6 2.9 - 13.8 Bq·kg-1 6, 12, 13 or 45 (4) 210Pb 4 92 - 153 Bq·kg-1 6 or 7 (4) Seawater (1) Gross α 8 500 - 880 mBq·L-1 4, 5, 12 or 13 (4) Residual β 8 64 - 150 mBq·L-1 4, 5, 12 or 13 (4) 3H 8 390 - 4430 mBq·L-1 4, 5, 11 or 13 (4) 90Sr 4 2.2 - 2.5 mBq·L-1 4, 5 or 13 (4) Suspended solids 137Cs 4 5 - 6.5 Bq·kg-1 3, 4 (4) in seawater (1) 210Pb 4 64 - 89 Bq·kg-1 3, 4 (4)
Drinking water (1) Gross 187 < 0.1 Bq·L-1 350 (5)
Gross β 195 < 0.3 Bq·L-1 436 (5) Residual β 174 < 0.3 Bq·L-1 392 (5) 3H 191 < 4.0 Bq·L-1 407 (5) Milk (1) 40K 26 51.7 Bq·L-1 827(5) 60Co 26 < 1.4 Bq·L-1 827 (5) 90Sr 26 < 5 Bq·L-1 47 (5) 131I 26 < 0.6 Bq·L-1 827 (5) 134Cs 26 < 0.6 Bq·L-1 827 (5) 137Cs 26 < 0.5 Bq·L-1 827 (5)
Food (6, 7, 8)
Grain and grain products 137Cs - < 6.0 Bq·kg-1 75 (1) (9)
Vegetables 137Cs - < 6.0 Bq·kg-1 125 (1) (9)
Fruit and fruit products 137Cs - < 6.0 Bq·kg-1 44 (0) (9)
Milk and dairy products 137Cs - < 6.0 Bq·kg-1 57 (0) (9)
Meat and meat products 137Cs - < 6.0 Bq·kg-1 84 (2) (9)
Game and poultry 137Cs - < 6.0 Bq·kg-1 39 (0) (9)
Salads 137Cs - < 6.0 Bq·kg-1 28 (0) (9)
Oil and butter 137Cs - < 6.0 Bq·kg-1 39 (1) (9)
Honey 137Cs - 11.6 - 347 Bq·kg-1 101 (15) (9)
Food (6, 7, 10)
Vegetables 137Cs - < 0.5 Bq·kg-1 54 (0) (9)
Meat and meat products 137Cs - < 0.5 Bq·kg-1 492 (0) (9)
Game and poultry 137Cs - 3.0 - 266 Bq·kg-1 200 (30) (9)
Eggs 137Cs - < 0.5 Bq·kg-1 118 (0) (9)
Fish and seafood products 137Cs - < 0.5 Bq·kg-1 63 (0) (9)
Mixed diet 90Sr - < 10.0 Bq·kg-1 12 (0) (9)
(1) = Yearly average is shown. (2) = Yearly total is shown.
(3) = A 68% confidence range is shown. (4) = Frequency depends on location.
(5) = Total number of samples taken combined over all locations. (6) = Given range represents values of individual (positive) samples.
(7) = Samples were analysed for 134Cs as well, but it was below the detection limit. (8) = As measured by Food and Consumer Product Safety Authority.
(9) = Total number of samples taken. Number of positive samples between brackets. (10) = As measured by RIKILT – Institute of Food Safety.
Table S2: Summary of the results of the monitoring program in the vicinity of the nuclear power plant at Borssele in 2009.
Tabel S2: Overzicht van de resultaten van het monitoringsprogramma in de nabijheid van Kerncentrale Borssele in 2009.
Matrix Parameter Locations Values (1) Frequency
(per year) Air dust Gross α 5 0.013 - 0.30 mBq·m-3 12
Gross β 5 0.10 - 0.56 mBq·m-3 12 60Co 5 (2) < 0.04 - < 0.10 mBq·m-3 12 131I el (3) 5 (2) < 0.1 - < 0.2 mBq·m-3 12 131I or (3) 5 (2) < 0.2 - < 0.4 mBq·m-3 12 137Cs 5 (2) < 0.04 - < 0.06 mBq·m-3 12 Nat. (4) 5 (2) < 0.9 - 2.6 mBq·m-3 12 Grass 60Co 5 (2) < 1 - < 6 Bq·kg-1 12 131I 5 (2) < 1 - < 6 Bq·kg-1 12 137Cs 5 (2) 0.3 - < 4 Bq·kg-1 12 Soil 54Mn 4 < 0.2 - < 0.4 Bq·kg-1 1 60Co 4 < 0.3 - < 0.4 Bq·kg-1 1 134Cs 4 < 0.3 - < 0.4 Bq·kg-1 1 137Cs 4 1.18 - 1.88 Bq·kg-1 1 Water Residual β 4 0.031 - 0.178 Bq·L-1 12 3H 4 7.2 - 10.4 Bq·L-1 12
Suspended solids Gross β 4 0.20 - 1.33 kBq·kg-1 12
Seaweed 60Co 4 (2) < 2 - < 6 Bq·kg-1 12 131I 4 (2) < 0.8 - < 5 Bq·kg-1 12 137Cs 4 (2) 1.2 - < 4 Bq·kg-1 12 Sediment 60Co 4 (2) < 0.3 - < 0.4 Bq·kg-1 12 131I 4 (2) < 0.2 - < 0.5 Bq·kg-1 12 137Cs 4 (2) < 0.3 - 1.33 Bq·kg-1 12
(1) = Given range represents values of individual samples.
(2) = Analysis is performed on a combined sample of the monthly samples of all four or five locations. (3) = Elemental respectively organically bound 131I.
1
Introduction
Levels of radioactive nuclides of natural origin, such as 40K and daughters from
the uranium and thorium series may be enhanced as a result of human
activities, e.g. emissions from factories processing ores. Man-made radionuclides are found in the environment due to, for example, nuclear weapons tests or discharges from nuclear installations. Monitoring radiation in the environment provides knowledge of levels of radiation under normal circumstances and enables the confirmation of abnormal levels. In this report results are presented of radioactivity measurements in the environment in the Netherlands. The aim of this report is threefold. Firstly, it presents a survey of measurements on
radioactivity in the Dutch environment under normal circumstances in 2009. Secondly, it is aimed at determining compliance of monitoring programs in the Netherlands with the EU recommendation and at reporting omissions. Thirdly, it is the Dutch national report on radioactivity in the environment to the EU and to other Member States.
In the chapters, the results will be presented in graphs and tables. More detailed tables are presented in Appendix A. Chapters 2 to 8 have been subdivided according to the structure of the Recommendation on the Application of Article 36 of the Euratom Treaty [1], and give the results of measurements for various environmental compartments. Chapter 9 contains data on environmental samples taken around the nuclear power plant at Borssele. General conclusions from chapter 1-8 are presented in chapter 10.
2
Airborne particles
The monitoring program for determining radioactive nuclides in air dust is given in Table 2.1. The sampling was done on the RIVM premises in Bilthoven. Air dust samples for the measurement of gross α-, gross β- and γ-emitters were collected weekly with a High Volume Sampler (HVS).
A detailed description of sampling, sample treatment and the analytical method is given in previous reports [2, 3, 4]. The data from 1991 to 2004 were
reanalysed to determine the yearly averages by the method described in Appendix B [5]. This can lead to small differences between data presented in this report and data reported prior to 2005.
Table 2.1: Monitoring program for the determination of radioactive nuclides in air dust.
Matrix Location Parameter Sample Sample Analysis
period volume frequency
Air dust Bilthoven gross α, gross β week 500 m3 (1) weekly
Bilthoven γ-emitters (2) week 50000 m3 weekly
(1) A sub sample of 1% from the filter through which about 50000 m3 is sampled. (2) γ-spectroscopic analysis of specific γ-emitting nuclides.
2.1 Long-lived α- and β-activity
The weekly results of gross α- and β-activity concentrations in air dust are given in Figure 2.1 and Table A1 (see Appendix A). Due to large uncertainties caused by variations in dust thickness on the filters, gross α-activity concentrations in air dust should be regarded as indicative values [6]. The period between sampling and analysis is five to ten days, which is long compared to the decay time of the short-lived decay products of 222Rn and 220Rn. This is to ensure that
these naturally occurring decay-products do not contribute to the measured α- and β-activity concentrations. The frequency distributions of gross α-activity and gross β-activity concentrations in air dust are given in Figures 2.2 and 2.3, respectively.
The yearly averages of the gross α- and β-activity concentrations of long-lived nuclides in 2009 are within the range of the results from the period 1992-2008 as is illustrated in Figure 2.4. Since 2007 a new (more realistic) calibration for gross α has been implemented. This new calibration is 1.4 times higher than the one for previous years, which results in lower reported gross α-activities.
0.0 0.4 0.8 1 4 7 10 13 16 19 22 25 28 31 34 37 40 43 46 49 52 week in 2009 acti vi ty concent rat ion ( m B q /m ³)
gross alpha gross beta
Figure 2.1: Weekly averaged gross α- and β-activity concentrations of long-lived nuclides in air dust sampled at RIVM.
0 5 10 15 20 25 30 35 40 45 0.00-0.02 0.02-0.04 0.04-0.06 0.06-0.08 0.08-0.10 0.10-0.12 0.12-0.14 0.14-0.16
gross alpha activity concentration (mBq/m³)
num
ber
of
wee
ks
Figure 2.2: Frequency distribution of gross α-activity concentration of long-lived nuclides in air dust collected weekly in 2009. The yearly average is
0.029 (SD=0.010) mBqm-3. SD is the standard deviation and illustrates the
0 6 12 18 24 30 0.0-0.2 0.2-0.4 0.4-0.6 0.6-0.8 0.8-1.0 1.0-1.2 1.2-1.4 1.4-1.6
gross beta activity concentration (mBq/m³)
num
ber
of
wee
ks
Figure 2.3: Frequency distribution of gross β-activity concentration of long-lived nuclides in air dust collected weekly in 2009. The yearly average is 0.421
0.007 (SD=0.15) mBqm-3. 0.0 0.2 0.4 0.6 0.8 1992 1993 1994 1995 1996 1997 1998 1999 2000 2001 2002 2003 2004 2005 2006 2007 2008 2009 year acti vi ty concentr ati on (mB q /m ³)
gross alpha gross beta
Figure 2.4: Yearly averaged gross α- and gross β-activity concentrations of long-lived nuclides in air dust at RIVM in 1992-2009.
2.7. The detection limits for the nuclides considered in the gammaspectroscopic analysis of the HVS-samples are given in Table A2. Between 2000 and half 2009, the detection limit of 137Cs is higher than during 1991-1999, due to a
different detector set-up. Since July 2009, a new detector set up is used, which results in lower detection limits.
The behaviour of 7Be in the atmosphere has been studied world-wide [7, 8, 9,
10, 11, 12, 13]. Natural 7Be (half-life 53.3 days) is formed by spallation
reactions of cosmogenic radiation with atmospheric nuclei, such as carbon, nitrogen and oxygen resulting in the formation of BeO or Be(OH)2 molecules.
Approximately 70% of 7Be is produced in the stratosphere, with the remaining
30% being produced in the troposphere. A residence time is estimated at about 1 year in the stratosphere and about 6 weeks in the troposphere. Most of the
7Be produced in the stratosphere does not reach the troposphere, except during
spring when seasonal thinning of the tropopause takes place at midlatitudes resulting in air exchange between stratosphere and troposphere. In the troposphere, 7Be rapidly associates mainly with submicron-sized aerosol
particles. Gravitational settling and precipitation processes accomplish transfer to the earth’s surface. Seasonal variations in the concentration of 7Be in surface
air is influenced by the following main atmospheric processes: wet and dry deposition, mass exchange between stratosphere and troposphere, vertical transport in the troposphere and horizontal transport of air masses from the subtropics and midlatitudes into the tropics and polar regions.
The red line in Figure 2.5 shows the seasonal variation of the 7Be-activity
concentration, with peaks during the spring and summer periods, reflecting the seasonal variations in the transport rate of air from stratosphere to troposphere. Figure 2.5 further shows the influence of the solar cycle. The maximum at 1997 and the minimum at 2000-2002 are consistent with the solar minimum
(measured by radio flux and sunspot count) of 1996-1997 and the solar maximum of 2000-2002 [14]. In the summer of 1991 two severe geomagnetic storms caused a significant world-wide disturbance of earth’s geomagnetic field. This resulted in a considerable decrease in cosmogenic radiation, unprecedented in at least the previous four decades [15]. The absence of a 1991 summer peak in the 7Be-activity concentration can be explained by the decrease in cosmogenic
radiation.The concentrations found for 7Be in 2009 fit in the pattern described
0 2000 4000 6000 8000 10000 year 7 B e-activity concentr at ion (µ B q /m³) 1992 1993 1994 1995 1996 1997 1998 1999 2000 2001 2002 1991 2003 2004 2005 2006 2007 2008 2009
Figure 2.5: Weekly averaged 7Be-activity concentrations (blue) in air dust at
RIVM in 1991-2009. The red line is a moving average of 13 weeks. The yearly average for 2009 is 4060 50 (SD=1200) μBqm-3.
The nuclide 137Cs (half-life 30.2 years) is of anthropogenic origin. The two main
sources of 137Cs in the environment are nuclear weapons tests and the
Chernobyl accident. Nowadays resuspension of already deposited activity is the main source of airborne 137Cs-activity.
Figure 2.6 shows a peak during May 1992. During the same period several wildfires occurred near the Chernobyl area [16]. The level of airborne
137Cs-activity increased ten times in the 30 km exclusion zone around
Chernobyl. It is plausible that the airborne 137Cs was transported to Western
Europe due to the weather conditions in the same period, dry and a strong eastern wind [17]. On the 29th of May 1998 an incident occurred at Algeciras
(Spain), an iron foundry melted a 137Cs-source concealed in scrap metal [18]. As
a result elevated levels of airborne 137Cs-activity were measured in France,
Germany, Italy and Switzerland during late May and early June. Figure 2.6 shows a slightly elevated level of 137Cs-activity (second peak) around the same
period (29th of May until 5th of June 1998). Such slightly elevated levels are not
uncommon as can be seen in Figure 2.6. These elevations may be related to resuspension of already deposited dust especially during a strong wind from the continent [18].
0 4 8 12 year 13 7 Cs-act iv it y con cent rat io n (µBq /m³ ) 1994 1995 1996 1997 1998 1999 2000 2001 2002 1991 1992 1993 2003 2004 2005 2006 2007 2008 2009
Figure 2.6: Weekly averaged 137Cs-activity concentrations in air dust at RIVM in
1991-2009. 50 out of 52 measurements were below the detection limit in 2009. Between 2000 and half 2009 the detection limit was higher than during 1991-1999, due to a different detector set up. Since July 2009, a new detector set up is used, which results in lower detection limits (see Table A2).
The primary source of atmospheric 210Pb (half-life 22.3 years) is the decay of 222Rn exhaled from continental surfaces. Therefore, the atmospheric
concentration of 210Pb over the continental areas is in general higher than that
over the oceanic ones (222Rn exhalation from the ocean is 1000 times less than
that from the continents). The reported reference value of 210Pb in air dust is
500 μBqm-3 [19]. In the atmosphere this radionuclide is predominantly
associated with submicron-sized aerosols [20, 21]. The mean aerosol (carrying
210Pb) residence time in the troposphere is approximately five days [22].
Other sources of 210Pb in air dust are volcanic activity and industrial emissions
[23, 24, 25, 26, 27]. Examples of industrial emissions are discharges of power plants using fossil fuels, fertiliser and phosphorus industries, and exhaust gases of traffic. In the Netherlands the emission of power plants is only of local importance regarding 210Pb deposition. The emission by other industries
contributes a significant part of the yearly total 210Pb deposition [25]. Volcanic
eruptions bring uranium decay products in the atmosphere like 226Ra, 222Rn, 210Pb and 210Po. Beks et al. [25] estimate that volcanoes contribute
60 TBqyear-1 to the atmospheric 210Pb stock. If the volcanic deposition is evenly
distributed world-wide, the contribution to the yearly total 210Pb deposition
would be negligible.
Unusual 210Pb values might be explained by natural phenomena such as an
explosive volcanic eruption, Saharan dust [28, 29, 30] and resuspension of (local) dust. The unusual value of week 45 in 2002 (3000 300 μBqm-3) can not
Except for week 45 in 2002 there is a good correlation between activity concentrations of 210Pb and activity concentrations of gross β, as is the case in
2009 (Figure 2.8). The weekly averaged activity concentrations of 210Pb in 2009
are within range of those found in previous years (Figure 2.7).
0 500 1000 1500 2000 2500 3000 3500 year 210 Pb -a ctiv ity co nc en tratio n (µ Bq /m ³) 1992 1993 1994 1995 1996 1997 1998 1999 2000 2001 2002 1991 2003 2004 2005 2006 2007 2008 2009
Figure 2.7: Weekly averaged 210Pb-activity concentrations in air dust at RIVM in
1991-2009. The yearly average for 2009 is 363 5 (SD=180) μBqm-3.
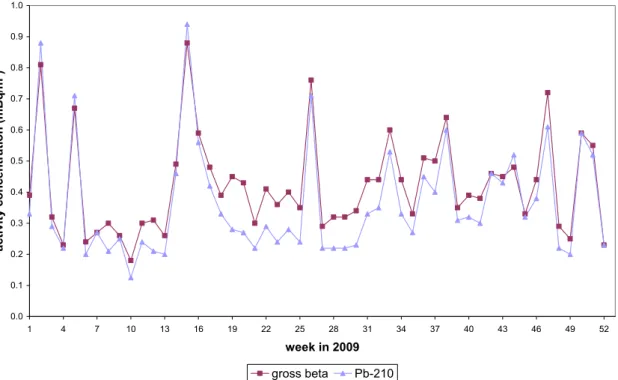
0.0 0.1 0.2 0.3 0.4 0.5 0.6 0.7 0.8 0.9 1.0 1 4 7 10 13 16 19 22 25 28 31 34 37 40 43 46 49 52 week in 2009 activ ity c oncen tr ati on (mBq/m³) gross beta Pb-210
Figure 2.8: Figure illustrating the correlation between weekly averaged gross - and 210Pb-activity concentrations in air dust at RIVM.
3
Deposition
The monitoring program for determining radioactive nuclides in deposition is given in Table 3.1. Sampling was done on the RIVM premises in Bilthoven. Samples were collected weekly for γ-emitters and monthly in case of gross α, gross β, 3H and 210Po. The data from 1993 to 2004 were reanalysed to
determine the yearly totals by the method described in Appendix B [5]. This can lead to small differences between data presented in this report and data reported prior to 2005.
Table 3.1: The monitoring program for the determination of radioactive nuclides in deposition.
Matrix Location Parameter Sample Sample Analysis
period volume Frequency
Deposition Bilthoven γ-emitters (1) week variable weekly
Bilthoven gross α, gross β, and 210Po
month variable monthly Bilthoven 3H month variable quarterly
(1) γ-spectroscopic analysis of specific γ-emitting nuclides.
3.1 Long-lived α- and β-activity
The monthly deposited gross α- and gross β-activities of long-lived nuclides are given in Figure 3.1, Figure 3.3 and Table A4. The yearly total deposition of gross α and gross β was 36.9 ± 1.3 and 95 ± 2 Bq·m-2, respectively. These
values are within range of those from previous years, as illustrated in Figure 3.2, Figure 3.4 and Table A5.
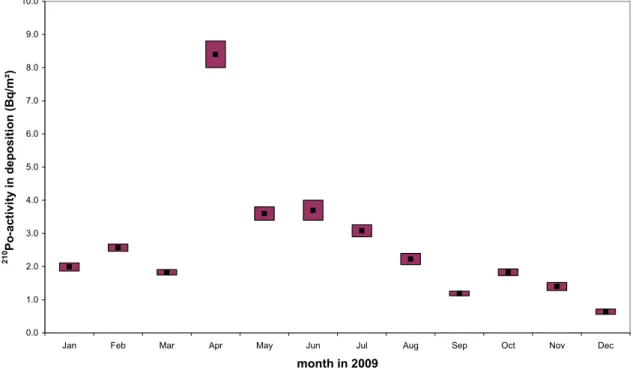
The monthly deposition of 3H is given in Table A4. In 2009, the yearly total
deposition of 3H ranged between 0 and 1300 Bq·m-2 (68% confidence level). The
yearly total consists of 12 samples. All measurements were below the detection limit. Therefore, detection limits were used for the contribution to the yearly total. The range of 2009 does not differ significantly from those measured since 1993, as illustrated in Figure 3.5 and Table A5. Until 1998, samples were electrolytically enriched before counting, which resulted in a much lower detection limit than that after 1997.
0.0 2.0 4.0 6.0 8.0 10.0
Jan Feb Mar Apr May Jun Jul Aug Sep Oct Nov Dec
month in 2009 g ros s al ph a ac tiv ity in de p o si tio n (B q/ m²)
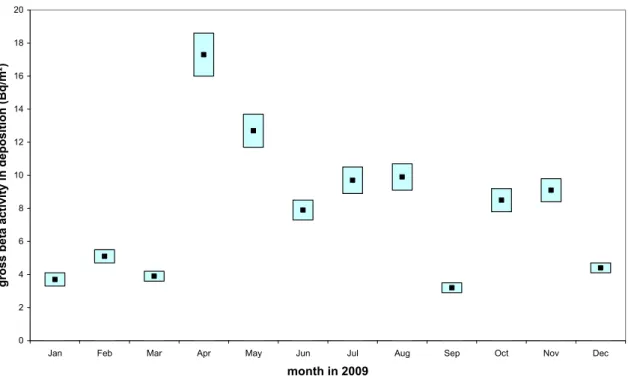
Figure 3.1: Monthly deposited gross α-activity of long-lived nuclides at RIVM. Given are monthly totals (black dot) with a 68% confidence range (coloured bar). 0 10 20 30 40 50 60 1993 1994 1995 1996 1997 1998 1999 2000 2001 2002 2003 2004 2005 2006 2007 2008 2009 year gr o ss al p h a a ct ivi ty i n d epo si ti on ( B q /m ²)
Figure 3.2: Yearly gross α-activity of long-lived nuclides deposited at RIVM from 1993 to 2009. Given are yearly totals (black dot) with a 68% confidence range (coloured bar). Solely a 68% confidence range is given if the yearly result is made up of at least one detection limit.
0 2 4 6 8 10 12 14 16 18 20
Jan Feb Mar Apr May Jun Jul Aug Sep Oct Nov Dec
month in 2009 g ros s be ta act iv it y i n d ep o si ti on ( B q /m² )
Figure 3.3: Monthly deposited gross β-activity of long-lived nuclides at RIVM. Given are monthly totals (black dot) with a 68% confidence range (coloured bar). 0 20 40 60 80 100 120 1993 1994 1995 1996 1997 1998 1999 2000 2001 2002 2003 2004 2005 2006 2007 2008 2009 year g ros s be ta act iv it y i n d ep o si ti on ( B q /m² )
Figure 3.4: Yearly gross β-activity of long-lived nuclides deposited at RIVM from 1993 to 2009. Given are yearly totals (black dot) with a 68% confidence range (coloured bar).
0 500 1000 1500 2000 2500 1993 1994 1995 1996 1997 1998 1999 2000 2001 2002 2003 2004 2005 2006 2007 2008 2009 year 3 H -a ct iv ity in d ep o si tio n ( B q /m²)
Figure 3.5: Yearly deposition of 3H at RIVM from 1993 to 2009. Given are yearly
totals (black dot) with a 68% confidence range (coloured bar). Solely a 68% confidence range is given if the yearly result is made up of at least 1 detection limit. 0.0 1.0 2.0 3.0 4.0 5.0 6.0 7.0 8.0 9.0 10.0
Jan Feb Mar Apr May Jun Jul Aug Sep Oct Nov Dec
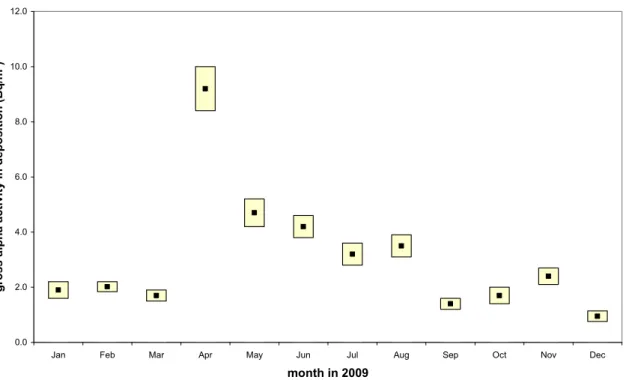
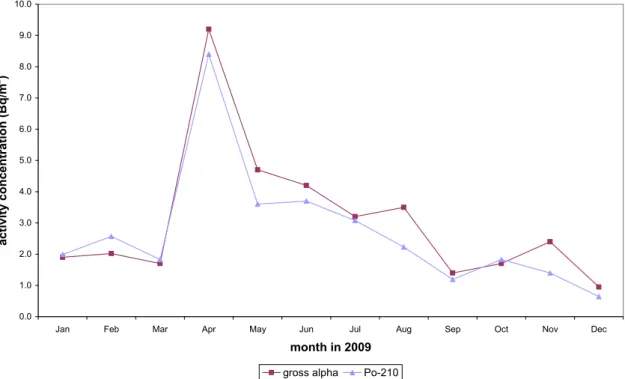
month in 2009 210 Po-a ct iv it y i n de po si ti on ( B q/ m² )
Figure 3.6: Monthly deposited 210Po-activity at RIVM. Given are monthly totals
0 5 10 15 20 25 30 35 1993 1994 1995 1996 1997 1998 1999 2000 2001 2002 2003 2004 2005 2006 2007 2008 2009 year 21 0 Po -a ctivit y in d epo sit ion (B q /m ²)
Figure 3.7: Yearly 210Po-activity deposited at RIVM from 1993 to 2009. Given are
yearly totals (black dot) with a 68% confidence range (coloured bar). Solely a 68% confidence range is given if the yearly result is made up of at least one detection limit. 0.0 1.0 2.0 3.0 4.0 5.0 6.0 7.0 8.0 9.0 10.0
Jan Feb Mar Apr May Jun Jul Aug Sep Oct Nov Dec
month in 2009 ac tivity conc entration (Bq/ m 2 )
gross alpha Po-210
Figure 3.8: Figure illustrating the correlation between monthly total gross α- and
approximately the same level as in 2008. The elevated level of 210Po in April is in
good correlation with the elevated level of gross α as can be seen in Figure 3.8.
3.2 γ-emitting nuclides
Detectable quantities of the naturally occurring nuclides 7Be and 210Pb were found
in 52 and respectively 36 out of 52 samples. Due to a new detector set up the detection limit for 210Pb is lower in the second half year of 2009; all non detectable
results are from the first half of the year. The yearly total deposition of 7Be is
1410 30 Bq·m-2. The yearly total deposition of 210Pb ranged between 82 and
125 Bq·m-2 (68% confidence level). The nuclide 137Cs was detected in none of
52 samples. The detection limit for 137Cs during the first half of the year is
0.1 Bq·m-2. The detection limit for the second half of the year is 0.02 Bq·m-2. The
yearly total deposition of 137Cs ranged between 0 and 4.3 Bq·m-2 (68% confidence
level). The weekly results for deposition of 7Be, 137Cs and 210Pb are given in
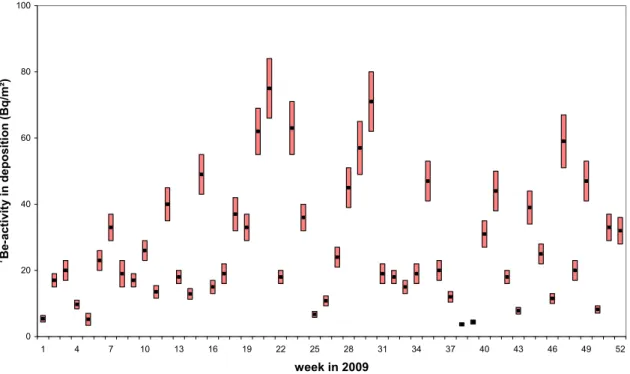
Table A8 and Figures 3.9 and 3.12. The results for previous years are given in Table A7, Figure 3.10, 3.11 and 3.13.
0 20 40 60 80 100 1 4 7 10 13 16 19 22 25 28 31 34 37 40 43 46 49 52 week in 2009 7 B e-ac tiv ity in d e p o si tio n (B q /m² )
Figure 3.9: Weekly deposited 7Be-activity at RIVM. Given are weekly totals
0 500 1000 1500 2000 2500 1993 1994 1995 1996 1997 1998 1999 2000 2001 2002 2003 2004 2005 2006 2007 2008 2009 year 7 Be-a ct iv it y i n de po si ti on ( B q/ m² )
Figure 3.10: Yearly 7Be-activity deposited at RIVM from 1993 to 2009. Given are
yearly totals (black dot) with a 68% confidence range (coloured bar). Solely a 68% confidence range is given if the yearly result is made up of at least one detection limit. 0 1 2 3 4 5 6 7 8 9 1993 1994 1995 1996 1997 1998 1999 2000 2001 2002 2003 2004 2005 2006 2007 2008 2009 year 13 7 C s-a ctivit y in d epo sit ion (B q /m ²)
Figure 3.11: Yearly 137Cs-activity deposited at RIVM from 1993 to 2009. Given
are yearly averages, solely a 68% confidence range is given since the yearly result is made up of at least one detection limit. Since 2000 the detection limit is higher than during 1993-1999, due to a different detector set up. Since July 2009, a new detector set up is used, which results in lower detection limits.
0 2 4 6 8 10 1 4 7 10 13 16 19 22 25 28 31 34 37 40 43 46 49 52 week in 2009 21 0 Pb-acti vit y i n depo si ti on (Bq/ m²)
Figure 3.12: Weekly deposited 210Pb-activity at RIVM. Given are weekly
averages (black dot) with a 68% confidence range (coloured bar). Solely a black dot is given if the result is a detection limit.
0 20 40 60 80 100 120 140 160 180 200 1993 1994 1995 1996 1997 1998 1999 2000 2001 2002 2003 2004 2005 2006 2007 2008 2009 year 21 0 Pb-acti vit y i n depo si ti on (Bq/ m²)
Figure 3.13: Yearly 210Pb-activity deposited at RIVM from 1993 to 2009. Given
are yearly averages (black dot) with a 68% confidence range (coloured bar). Solely a 68% confidence range is given if the yearly result is made up of at least 1 detection limit.
4
National Radioactivity Monitoring Network
This chapter presents data on gross α- and artificial β-activity concentrations in air dust and ambient dose equivalent rates as measured by the National Radioactivity Monitoring Network (Nationaal Meetnet Radioactiviteit, NMR). The data on gross α and artificial β differ in sample size, sampling frequency and analytical procedures from those given in the previous chapter. The difference between the NMR data and those mentioned in the previous chapter is due to the contribution of short-lived natural radionuclides (radon daughters).
The NMR consists of 14 measuring sites at which gross α- and artificial β-activity concentrations are determined as well as the ambient dose equivalent rate [32]. At another 153 measuring sites only the ambient dose equivalent rate is
determined. The dose equivalent rate monitors at the previously mentioned 14 sites are differently placed from the 153 dose equivalent rate monitors with regard to height (3.5 meter versus 1 meter above ground level) and surface covering. Therefore, results can differ between the two types of measuring sites [33]. Hence, these 14 dose equivalent rate monitors are not taken into account for calculating the yearly averaged ambient dose equivalent. The reported artificial β-activity concentrations are calculated from the difference between the measured gross β-activity concentration and the natural gross β-activity derived from the measured gross α-activity concentration.
During the second half of 2002 the 14 aerosol FAG FHT59S monitors were gradually replaced by 14 new Berthold BAI 9128 monitors. Due to differences in detection method, filter transport, calibration nuclides and algorithms the results for the activity concentrations are not exactly the same. By running both
monitors simultaneously at the same location, the measured gross α-activity concentration was compared. On average the Berthold monitor systematically reports about 20% higher values than the FAG monitor [34]. The estimated random uncertainty for both types of monitor is about 20%. No correction is applied for the difference in the gross α-activity concentration between the Berthold and FAG monitor.
The data presented in this chapter are based on ten-minute measurements. Averages over the year are calculated per location using daily averages from the ten-minute measurements (Tables A9 and A10). The data on external radiation, expressed in ambient dose equivalent, contain a systematic uncertainty because of an overestimation of the cosmogenic dose rate. However, NMR data are not corrected for these response uncertainties.
In Figures 4.1 and 4.3, an impression has been constructed of the spatial variation in the yearly averages of the NMR data using RIVM’s Geographical Information System (GIS). An inverse distance weight interpolation algorithm was applied to calculate values in between the NMR stations.
Figure 4.2 presents the yearly averages of gross α-activity concentration from 1990 to 2009, while Figure 4.4 presents the yearly averages of ambient dose equivalent rate from 1996 to 2009. In 2009 the yearly averaged gross α-activity concentration in air dust was 3.3 Bq·m-3 (based on the yearly averages of the
14 measurement locations). To compare this value with data before 2002 it should be noted that the Berthold values are 20% higher than FAG values, and
been based on a set of 163 stations. From 2004 onwards, the analysis of the ambient dose equivalent rate has been based on the set of 153 stations,
10 stations have been dismantled. The yearly averaged ambient dose equivalent rate in 2009 is calculated using 146 stations. The remaining 7 stations were not operational.
For the ambient dose equivalent rate the yearly averaged measured value was 74.1 nSv h-1 in 2009. Figure 4.5 shows the influence of the 11-year solar cycle
on the cosmogenic contribution to the effective dose rate, which is related to the ambient dose equivalent rate. The decrease in the ambient dose equivalent rate (as given by the NMR) during 1996 to 2003 (Figure 4.4) might be related to the decrease in the cosmogenic contribution.However, the correlation between the increase in the cosmogenic contribution since 2004 and the measured ambient dose equivalent rate is less evident (Figure 4.4).
Figure 4.1: Spatial variation in the average gross α-activity concentration of (mainly) short-lived nuclides in air dust. The dots represent the locations of the aerosol monitors. 0.0 0.5 1.0 1.5 2.0 2.5 3.0 3.5 4.0 4.5 5.0 1990 1991 1992 1993 1994 1995 1996 1997 1998 1999 2000 2001 2002 2003 2004 2005 2006 2007 2008 2009 year al pha ac ti vi ty conce n tr at io n (B q/ m 3 ) Berthold FAG
Figure 4.2: Yearly averaged gross α-activity concentration of (mainly) short-lived nuclides in air dust. During the second half of 2002 the FAG monitors were gradually replaced by the Berthold monitors.
Figure 4.3: Spatial variation in the average ambient dose equivalent rate. The dots represent the locations of the dose equivalent rate monitors.
71,0 72,0 73,0 74,0 75,0 76,0 77,0 1996 1997 1998 1999 2000 2001 2002 2003 2004 2005 2006 2007 2008 2009 year amb ie n t d o se eq uiva le nt ra te (nSv /h)
32 34 36 38 40 42 1958 1962 1966 1970 1974 1978 1982 1986 1990 1994 1998 2002 2006 year eff ecti ve d o se r a te (n Sv/ h )
Figure 4.5: Cosmogenic contribution to the effective dose rate (at sea level), influenced by the solar cycle. Location 51 26’ north latitude and 3 43’ eastern longitude (in the south-west of the Netherlands), air pressure 1019 hPa. Figure derived from data supplied by Federal Aviation Administration [35].
5
Surface water and seawater
5.1 Introduction
The RWS WD Centre for Water Management regularly monitors the
concentration of a number of radioactive nuclides in surface water and seawater. The monitoring program presented here forms only part of their total monitoring program. A more detailed description of the monitoring program, underlying strategy and results of measurements on radioactivity in Dutch waters are reported elsewhere [36, 37, 38].
The locations presented in this report have been chosen to represent the major inland waters and seawater. The monitoring program is shown in Tables 5.1, 5.2 and Figure 5.1. Radioactive nuclides were determined in water and suspended solids. The samples were collected at equidistant times.
Table 5.1: Monitoring program for the determination of radioactive nuclides in surface water.
Location Parameter Matrix Monitoring
frequency (per year)
IJsselmeer Gross α Water 13
(Vrouwezand) Residual β Water 13
3H Water 6
60Co Suspended solids 12 (1) 131I Suspended solids 12 (1) 137Cs Suspended solids 12 (1)
Ketelmeer 60Co Suspended solids - (2)
(Ketelmeer West) 131I Suspended solids - (2) 137Cs Suspended solids - (2)
Noordzeekanaal Gross α Water 6
(IJmuiden) Residual β Water 6
3H Water 6
60Co Suspended solids 6 131I Suspended solids 6 137Cs Suspended solids 6
Nieuwe Waterweg Gross α Water 13
(Maassluis) Residual β Water 13
3H Water 7 90Sr Water 7 226Ra Water 7 60Co Suspended solids 13 131I Suspended solids 13 137Cs Suspended solids 13 210Pb Suspended solids 7
Rhine Gross α Water 13
(Lobith) Residual β Water 13
3H Water 13 90Sr Water 6 226Ra Water 6 60Co Suspended solids 13 131I Suspended solids 13 137Cs Suspended solids 13 210Pb Suspended solids 6
Scheldt Gross α Water 13
(Schaar van Ouden Doel) Residual β Water 13
3H Water 7 226Ra Water 7 60Co Suspended solids 13 131I Suspended solids 13 137Cs Suspended solids 13 210Pb Suspended solids 7
Meuse Gross α Water 13
(Eijsden) Residual β Water 13
3H Water 13 90Sr Water 6 226Ra Water 6 60Co Suspended solids 45 (3) 131I Suspended solids 45 (3) 137Cs Suspended solids 45 (3) 210Pb Suspended solids 6
(1) Normally 13 times per year. Sampling in January could not be performed due to floating
ice.
(2) In 2009, Ketelmeer was not monitored for radioactivity.
(3) Normally 52 times per year. Sampling frequency was reduced (halved) in April, May and
June because of instrument problems.
The radioactive nuclides were determined according to standard procedures [36] and [39]. In the Netherlands target values are in use for radioactive materials in surface water, which are given in the Fourth memorandum on water management (Vierde Nota waterhuishouding) [40]. The yearly averages are compared with these target values.
Table 5.2: Monitoring program for the determination of radioactive nuclides in seawater.
Area Location Parameter Matrix Monitoring
frequency (per year) Coastal area Noordwijk 2 (1) Gross α Water 4
(KZ) Residual β Water 4
3H Water 4
137Cs Suspended solids 3 (2) 210Po Suspended solids 3 (2)
Southern North Sea Noordwijk 70 (1) Gross α Water 4
(ZN) Residual β Water 4
3H Water 4
90Sr Water 4
Central North Sea Terschelling 235 (1) Gross α Water 4
(CN) Residual β Water 4
3H Water 4
90Sr Water 4
Delta Coastal Waters Schouwen 10 (1) Gross α Water 12
(VD) Residual β Water 12
3H Water 11 (3)
90Sr Water 5
Westerscheldt Vlissingen Boei Gross α Water 13
(WS) Residual β Water 13
3H Water 13
90Sr Water 13
137Cs Suspended solids 4 210Po Suspended solids 4
Eems-Dollard Huibergat Oost Gross α Water 5
(ED) Residual β Water 5
3H Water 5
Bocht van Watum 137Cs Suspended solids 4 210Po Suspended solids 4
Wadden Sea West (4) Marsdiep Noord Gross α Water 5
(WW) Residual β Water 5
3H Water 5
Doove Balg West 137Cs Suspended solids 3 (2) 210Po Suspended solids 3 (2)
Wadden Sea East (5) Dantziggat Gross α Water 5
(WO) Residual β Water 5
3H Water 5
(1) Number indicates distance from shore. For example, Noordwijk 2 means Noordwijk 2 km
offshore.
(2) Normally 4 times per year. Sampling did not occur on one occasion. (3) Normally 12 times per year. Sampling did not occur on one occasion.
(4) Since 2009 137Cs and 210Pb (in suspended solids) are determined at Doove Balg
West again.
WO = Wadden Sea East WW = Wadden Sea West
ZN = Southern North Sea
KZ = Coastal area
VD = Delta Coastal Waters
WS = Westerscheldt Fresh water areas: IJM = IJsselmeer KM = Ketelmeer NK = Noordzeekanaal NW = Nieuwe waterweg R = Rhine M = Meuse S = Scheldt 1 = Terschelling 235 2 = Terschelling 135 3 = Terschelling 100 4 = Huibergat Oost
5 = Bocht van Watum
6 = Dantziggat
7 = Doove Balg West
8 = Marsdiep Noord 9 = Vrouwezand 10 = Ketelmeer West 11 = IJmuiden 12 = Noordwijk 2 13 = Noordwijk 10 14 = Noordwijk 70 15 = Maassluis 16 = Schouwen 10 17 = Vlissingen Boei
18 = Schaar van Ouden Doel
19 = Lobith
20 = Eijsden
Figure 5.1: Overview of monitoring locations for the monitoring program in surface water and in seawater.
Terschelling 135 km offshore and Terschelling 100 km offshore were the old monitoring locations for the Central North Sea during 1989 and 1988-1994 (except 1989),
respectively. Terschelling 235 km offshore is the monitoring location for the Central North Sea from 1995 and onwards. Noordwijk 10 km offshore was the old monitoring location for the Coastal area during 1988-1998. Noordwijk 2 km offshore is the monitoring location for the Coastal area from 1999 and onwards [36].
5.2 The results for surface water
The general monitoring strategy for surface water is to monitor the inland and border crossing waters of the Netherlands. Therefore, the locations mentioned in Table 5.1 are used for monitoring as they represent the major inland, incoming and outgoing waters of the Netherlands. The results for surface water are presented in Tables A11 and A12 and in Figures 5.2 to 5.19.
Gross α and residual β are indicative parameters. The yearly averaged activity concentrations of gross α and residual β in 2009 are within the range of those in previous years. The gross α -activity concentration in the Noordzeekanaal, Nieuwe Waterweg and Scheldt exceeds the target value (100 mBqL-1) in 6 out of 6, 6 out
of 13 and 13 out of 13 samples taken, respectively. In 2009 the yearly averaged gross α -activity concentrations in the Noordzeekanaal, Nieuwe Waterweg and Scheldt (220, 113 and 380 mBq·L-1, respectively) are above the target value of
100 mBq·L-1.
The yearly averaged residual β-activity concentrations are below the target value of 200 mBqL-1. Residual β in the Noordzeekanaal, Nieuwe Waterweg and
Scheldt shows a change in the trend since 1994. This is caused by a change in measuring technique, which only applies to salt and brackish water [36].
Therefore, this change in trend is not seen for the IJsselmeer, Rhine and Meuse. The 3H-activity concentration in the Scheldt and Meuse exceeds the target value
(10 BqL-1) in 4 out of 7 and 4 out of 13 samples taken, respectively. The elevated
levels of 3H in the Meuse (Figure 5.6) could originate from the nuclear power
plants at Tihange (Belgium) or Chooz (France). The elevated levels of 3H in the
Scheldt could originate from the nuclear power plant at Doel (Belgium). The yearly averaged 3H-activity concentrations in 2009 are within the range of those
in previous years. In 2009, the yearly averaged 3H-activity concentration in the
Scheldt and Meuse (11.9 and 14.0 Bq·L-1, respectively) are above the target
value of 10 Bq·L-1.
The nuclide 90Sr is released into the environment by nuclear power plants and
nuclear reprocessing plants. The yearly averaged 90Sr-activity concentrations in
2009 are within the range of those in previous years. The yearly averaged 90
Sr-activity concentrations are below the target value of 10 mBqL-1.
The nuclide 226Ra is released into the environment by the ore processing
industry. The 226Ra-activity concentration in the Scheldt exceeds the target value
(5 mBqL-1) in 7 out of 7 samples taken. The yearly averaged 226Ra-activity
concentrations in 2009 are within the range of those in previous years. In 2009 the yearly averaged 226Ra-activity concentration in the Scheldt (12.4 mBq·L-1) is
0 100 200 300 400 500 600
Jan Feb Mar Apr May Jun Jul Aug Sep Oct Nov Dec
month in 2009 g ros s alph a ac tiv it y co nc ent ra tion ( m B
IJsselmeer Noordzeekanaal Nieuwe Waterweg Rhine Scheldt Meuse
Figure 5.2: The gross α-activity concentration for the IJsselmeer,
Noordzeekanaal, Nieuwe Waterweg, Rhine, Scheldt and Meuse, with yearly averages of 40, 220, 113, 61, 380 and 36 mBqL-1, respectively. Averaged
values are shown in case of multiple measurements per month. The dotted line represents the target value of 100 mBqL-1 [40].
0 100 200 300 400 500 1985 1986 1987 1988 1989 1990 1991 1992 1993 1994 1995 1996 1997 1998 1999 2000 2001 2002 2003 2004 2005 2006 2007 2008 2009 year g ros s alph a ac tiv it y co nc en tra tion ( m B q /l )
IJsselmeer Noordzeekanaal Nieuwe Waterweg Rhine Scheldt Meuse