1Staatliches Gewerbeaufsichtsamt Hildesheim, Zentrale Unterstützungsstelle LG,
Luftreinhaltung Gefahrstoffe Göttingerstrasse 14 D-30449 HANNOVER Website: http://www.luen-ni.de E-mail: michael.koester@gaa-hi.niedersachsen.de Tel.: +49 511 444 6356 Contact: A. van der Meulen
Laboratory for Environmental Monitoring ton.van.der.meulen@rivm.nl
RIVM report 680500003/2006
A comparison of automated measurements of air quality near Valthermond (NL) in 2004
D. de Jonge, P. Wolfs, A. van der Meulen B. Heits1 , E. Helmholz1, H. Rienecker1
This investigation has been performed by order and for the account of The Dutch Ministry of Housing, Spatial Planning and Environment, within the framework of project M/680500, The Dutch Air Quality Monitoring Network.
Rapport in het kort
Een vergelijking tussen automatische metingen van de luchtkwaliteit nabij Valthermond in 2004
In 2004 werd een gezamenlijke meetcampagne opgezet tussen het Duitse LUEN en het Nederlandse RIVM om een internationale bevestiging van de meetresultaten te verkrijgen. De campagne werd uitgevoerd op een landelijk meetpunt dichtbij Valthermond.
Dit rapport geeft de resultaten van de componenten PM10, NO, NO2, O3 en NH3 over 2004.
De verschillen zijn meestal binnen aanvaardbare grenzen en verklaarbaar. Voor O3 zijn de
verschillen niet volledig verklaard. Dit is een punt van aandacht.
Deze campagne laat op een constructieve wijze zien hoe kwaliteit en internationale vergelijkbaarheid van de door elk instituut geproduceerde gegevens verbeteren. De uitwisseling van ervaringen heeft een lerend effect.
Om de oorzaak en de oplossing voor de verschillen verder te onderzoeken zal de campagne in 2005 worden voortgezet.
Trefwoorden: Luchtkwaliteit, metingen, meetnet, vergelijking, grensoverschrijdend
Kurzbericht
Vergleichsprogramm automatisch arbeitender Messgeräte der Luftqualität in der Nähe von Valthermond (NL) im Jahr 2004
Im 2004 wurde eine parallel, vergleichende Messung zwischen dem
LUEN und dem RIVM der Niederlande, unter internationalen Kriterien in der Auswertung durchgeführt. Diese Vergleichsmessung fand in der ländlich gelegenen Station Valthermond im Nord-Osten der Niederlande statt. Der Bericht enthält die Messergebnisse des
Kalenderjahres 2004, mit den Komponenten PM10, NO, NO2, O3 und NH3. Abschließend
ergibt sich, dass die auftretenden Differenzen der einzelnen Messergebnisse weitgehend in einem akzeptablen Rahmen lagen und erklärbar sind. Bei der Komponente O3 konnte die
Differenz bisher noch nicht ausreichend erklärt werden. Dieser Punkt verdient weitere Beobachtung. Die Messkampagne führte zu einem wesentlichen Fortschritt in der Qualität der erzielten Ergebnisse bei der Institutionen sowie einer Verbesserung in der
internationalen Vergleichbarkeit. Wichtiger Aspekt war ferner der Austausch von Erfahrungen und die internationale Zusammenarbeit. Dies führte zu einem
beiderseitigen Lerneffekt. Zur weitere Beobachtung und Klärung der Differenzen, wird das Programm in Valthermond 2005 weitergeführt.
Abstract
A comparison of automated measurements of air quality near Valthermond (NL) in 2004
In 2004 a simultaneous measurement programme was set up between the German LUEN and the Dutch RIVM to obtain an international validation of the results.
The programme took place at a rural station near Valthermond, in the northeast of the Netherlands. This report states the results from the calendar year 2004 for the components PM10, NO, NO2, O3 and NH3. The differences observed were mostly within acceptable limits
and could be explained. However the differences for O3 cannot be fully explained and this
requires further attention.
The programme led to a constructive improvement in the quality of the data produced by each institute and showed us how to improve the international comparability. Further much was learned from the experiences exchanged. The programme will be continued at the Valthermond site in 2005 to investigate the underlying causes in the differences and to resolve these.
Preface
In 2004 a simultaneous measurement programme was set up between the German LUEN and the Dutch RIVM to obtain an international validation of the results. The programme was carried out at a rural station near Valthermond, in the northeast of the Netherlands.
Its main objective was to compare measurements so that the comparability of data from the LUEN and RIVM networks could be assured.
The programme led to a constructive improvement in the quality of the data produced by each institute.
RIVM would like to thank the Staatliches Gewerbeaufsichtsamt Hildesheim Lufthygienisches Überwachungssystem Niedersachsen, from Hannover (Germany), for making this
Contents
Samenvatting 6 Zusammenfassung 7 Summary 8 1. Introduction 9 2. Procedure 11 2.1 Monitoring methods 11 2.2 Operational aspects 132.3 Calibration and verification procedure 13
2.4 Data treatment 15
3. Results 16
3.1 Annual averages 16
3.2 Comparison with EU limit values 20
3.3 Exceptional moments 20
4. Conclusion 22
References 23
APPENDIX 1: Map and macro requirements on “rural” type measuring location 24
APPENDIX 2: Data 25
Samenvatting
In 2004 heeft een vergelijkende meetcampagne plaatsgevonden tussen het Duitse
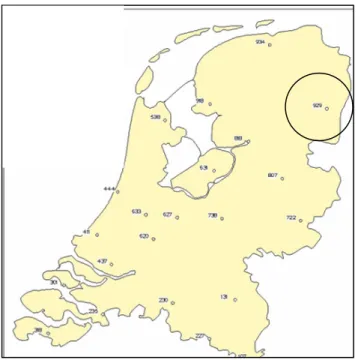
Lufthygienisches Überwachungssystem Niedersachsen (LUEN) uit Niedersachsen en het RIVM. De meetcampagne heeft als doel de meetresultaten internationaal te valideren. De meetcampagne is uitgevoerd op een regionaal station nabij Valthermond (nummer 929 van het Landelijk Meetnet Luchtkwaliteit; LML). Deze campagne is een vervolg van de meetcampagne in het Duitse Osnabrück in 2001.
Uiteindelijk wordt hiermee getracht de vergelijkbaarheid van de metingen, en dus de kwaliteit, te verhogen. In dit licht worden internationale vergelijkingen dan ook gezien als zeer ondersteunend voor de kwaliteit van nationale meetgegevens.
Dit rapport betreft de metingen in het kalenderjaar 2004, waarbij door elk instituut geheel onafhankelijk van elkaar continu metingen zijn verricht aan PM10, NO, NO2, O3 en NH3.
De data-capture, kalibratie frequenties, jaargemiddelden en vergelijkingen met de Europese limieten zijn vermeld.
Deze vergelijkende meetcampagne heeft waardevolle informatie opgeleverd op meerdere vlakken, met name over de mogelijke gevolgen van de verschillende instellingen van enkele technische details, zoals kalibratie methodes, data behandeling en apparatuur instellingen. De verschillen voor de jaargemiddelden voor PM10, NO en NO2 (tot 2,9 µg/m3 ) worden
veroorzaakt door een verschil in behandeling van (negatieve) data. De verschillen voor NH3
(0,4 µg/m3) en O3 (6,9 µg/m3) zijn niet veroorzaakt door een verschillende data-behandeling.
Voor NH3 worden de verschillen vermoedelijk veroorzaakt door verschillen in de toegepaste
meettechnieken.
Bij kruiscontrole van alle kalibratie- en verificatiestandaarden blijken er consistente verschillen in de O3 kalibratie tussen beide instituten. De oorzaak van deze verschillen is
echter nog niet gevonden.
Geconcludeerd kan worden dat de verschillen grotendeels verklaarbaar zijn. Met name voor O3 zijn de verschillen nog niet voldoende verklaard; dit is dan ook een punt van aandacht.
Om te bezien of de aanpassingen voldoende resultaat laten zien, wordt de meetcampagne ook in 2005 gecontinueerd. Uiteraard zal ook over 2005 een rapportage, met een analyse van de afwijkingen, worden gemaakt.
Zusammenfassung
Im Jahr 2004 wurde eine Vergleichsmessung zwischen dem RIVM (LML) der Niederlande und dem NLOE (LUEN) aus Niedersachsen (D) durchgeführt, mit dem Ziel der
Qualitätssicherung der Luftgütedaten im internationalen Rahmen.
Dieser Vergleich fand in der Messstation in der Nähe der Ortschaft Valthermond im Nord-Osten der Niederlande statt. Die Station ist Teil des Niederländischen Luftgütemessnetzes (Nr. 929 des LML).
Dieser Vergleich ist eine Fortsetzung der Messungen aus dem Jahr 2001 in der LUEN- Station Osnabrück (OKCC).
Der Zweck dieser Messungen ist das Fest- und Sicherstellen der Vergleichbarkeit der
Messergebnisse und ihrer Qualität, durch die unabhängig an einem Standort ermittelten Daten beider Messnetze.
Internationale Vergleichsmessungen liefern so einen wichtigen Beitrag zur Qualität der nationalen Messergebnisse.
Der Bericht umfasst die Ergebnisse des Kalenderjahres 2004 der ermittelten Komponenten PM10, NO, NO2, O3 und NH3.
Die Datenerfassung, Kalibrierungsintervalle, Ermittlung der Jahresmittelwerte sowie die Geräte-Verfügbarkeiten wurden im Rahmen der EU-Richtlinien bewertet.
Der Vergleich der sich ergebenen Jahresmittelwerte der Station in Valthermond, ergab größere Differenzen als 2001 in Osnabrück. Die jährliche Abweichung der gleichen Komponente stieg von 1,7 µg/m³ in Jahr 2001 auf 6,9 µg/m³.
Der Unterschied im Jahresmittelwert von PM10 beträgt 2,9 µg/m³.
Die Differenzen in den Komponenten PM10, NO und NO2 (bis 2,9 µg/m³) für das Jahr 2004,
ergeben sich aus der Behandlung der Daten.
Unterschiedliche Werte der Messkomponente NH3 (0,4 µg/m³) sowie O3 (6,9 µg/m³) sind
nicht auf die unterschiedliche Verarbeitung der Daten in den beiden Institutionen zurückzuführen.
Bei NH3 werden unterschiedliche Messverfahren angewandt. Für die Komponente O3 ergibt
sich bei der gegenseitigen Überprüfung des Transfer-Standards die gleiche Abweichung wie im Jahresmittelwert. Der Grund dieser Tatsache konnte bisher noch nicht ermittelt werden. Diese Luftgüte-Vergleichsmessung zeigt deutlich, wie wichtig der Vergleich der Messdaten, der Datenverarbeitung und der Kalibrierung der beiden Institutionen ist.
Die sich abschließend ergebenen Differenzen bewegen sich meistens in einem akzeptablen Bereich. Die Differenz bei der Komponente O3 konnte noch nicht ausreichend geklärt
werden. Dieser Punkt verdient weitere Beobachtung.
Untersuchungen sollen die Gründe der ermittelten Differenzen finden. Messungen der beiden Messnetze in der Station Valthermond werden fortgesetzt.
Summary
In 2004 a simultaneous measurement programme was set up between the German LUEN and the Dutch RIVM to obtain an international validation of the results.
The programme took place at a rural station near Valthermond, in the northeast of the Netherlands, which is part of the Dutch monitoring network (no. 929 of the “LML”). This programme is a follow-up of the measurements in Osnabrück (Germany) in 2001.
The objective was to improve the comparability, and thus the quality, of the measurements. In this light international comparisons are therefore seen as being highly supportive of the quality of national measurements.
This report details the results from the calendar year 2004 for those components that each institute continuously and independently measures: PM10, NO, NO2, O3 and NH3.
The data capture, calibration frequencies, annual averages and comparisons with the EU limit values are stated.
The comparison of the annual averages is less satisfying than in 2001 in Osnabrück. In Valthermond the annual differences for the same components are up to 6.9 µg/m3, whereas in
Osnabrück 2001 it was up to 1.7 µg/m3. The differences for the 2004 averages of PM10
(2.9 µg/m3), NO and NO2 (up to 0.9 µg/m3) are due to different data treatment. The
differences for NH3 (0.4 µg/m3) and O3 (6.9 µg/m3) are not due to different data treatment.
For NH3 the differences could be the result of different analysis techniques. For O3,
cross-checking the calibration standards showed the same difference as the annual averages. The differences observed were mostly within acceptable limits and could be explained. However the differences for O3 cannot be fully explained and this requires further attention.
The programme led to a constructive improvement in the quality of the data produced by each institute and showed us how to improve the international comparability. Further, much was learned from the experiences exchanged. The programme will be continued at the Valthermond site in 2005 to investigate the underlying causes in the differences and to resolve these.
1.
Introduction
EU standard measurement techniques need to be employed to ensure that air quality data are consistent across the Member States of the European Union.
The German Lufthygienisches Überwachungssystem Niedersachsen (LUEN) and the Dutch National Institute for Public Health and the Environment (RIVM) have set up a simultaneous
measurement programme as part of their quality assurance efforts. In 2004 a full year of field data of standard pollutants were compared at the Dutch station Valthermond. The main objective was to compare measurements so that the
comparability of data from the LUEN and RIVM networks could be assured.
In 2001 the institutes carried out a similar field test of comparative measurements in Osnabrück [1].
Table 1 details the set-up of the measuring equipment as agreed between RIVM and LUEN.
Table 1: The set-up of monitors as agreed between RIVM and LUEN.
Measurement location: Valthermond, the Netherlands Period January to December 2004 Measured components:
(all automatic Nitrogen oxides (NO & NO2)
monitors) Ozone (O3)
Particulate matter (PM10)
Ammoniac (NH3)
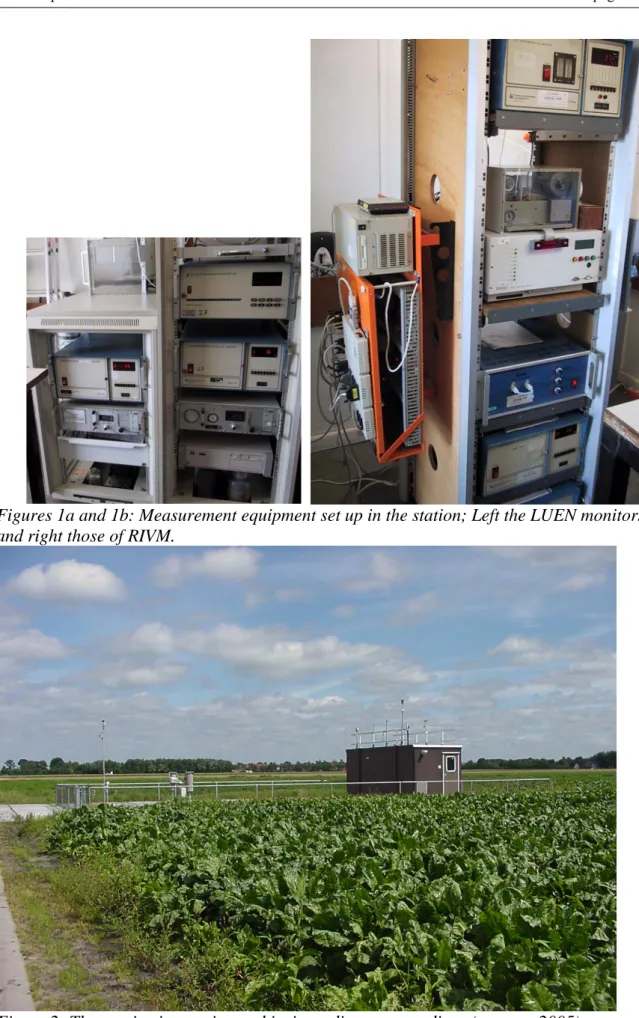
Both institutes carried out measurements in the same cabin, but with completely independent systems, with separated sampling inlets and data processing. Figures 1a and 1b show the set-up of the monitors in the cabin. Figure 2 shows the immediate surroundings of the site.
Figures 1a and 1b: Measurement equipment set up in the station; Left the LUEN monitors and right those of RIVM.
2.
Procedure
The monitoring site (Valthermond, LML 929) is part of the Dutch monitoring network. It is situated in the northeast of the Netherlands at about 15 kilometres from the German border. It is a so-called regional area, with little direct effects of emission sources. The only possible emission source is an agricultural company. It is classified as rural by the EU Airbase [2]. Further information about the EU requirements for a “rural station” is given in Appendix 1. By Dutch standards, the concentration of pollutants in the region is quite low. Table 2 details the range and 98 percentile of the annual average, based on the last 4 years of measurements.
Table 2: The annual average and 98 percentile in Valthermond, based on the last 4 years of measurements.
Component Annual average 98 percentile
µg/m3 µg/m3 NO NO2 2 − 3 12 − 15 20 − 30 40 − 50 O3 40 − 45 100 − 105 PM10 17 − 30 60 − 90 NH3 2 − 4 10 − 15
2.1
Monitoring methods
LUEN and RIVM use the same type of monitoring systems from the same manufacturer for the gaseous componentsNO, NO2 and O3 and particulate matter (PM10). The NH3 monitors
are from different manufacturers and employ different measuring principles.
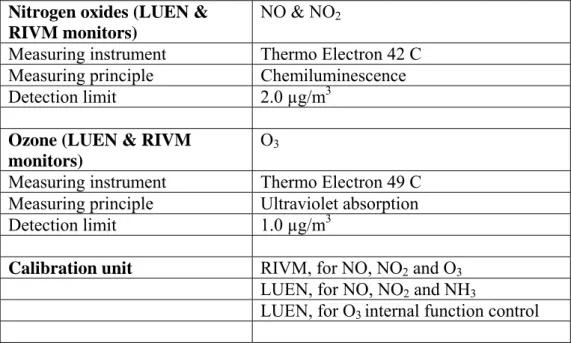
The main measurement characteristics of the monitoring systems are given in Table 3.
Table 3: The main measurement characteristics of the monitoring systems per institute.
Nitrogen oxides (LUEN & RIVM monitors)
NO & NO2
Measuring instrument Thermo Electron 42 C Measuring principle Chemiluminescence Detection limit 2.0 µg/m3
Ozone (LUEN & RIVM monitors)
O3
Measuring instrument Thermo Electron 49 C Measuring principle Ultraviolet absorption Detection limit 1.0 µg/m3
Calibration unit RIVM, for NO, NO2 and O3
LUEN, for NO, NO2 and NH3
Table 3 (continued)
Particulate matter (LUEN Monitor)
PM10
Measuring instrument EMS FH 62 I-R with TRS-system Inlet housing: 350 cm
heated at + 3 to 8 °C over ambient temperature
Measuring principle Attenuation of ß radiation Detection limit 4 µg/m3
Remark Due to underestimation of the particulate concentration in comparison to the reference method EN12341, a LUEN default correction factor of 1.33 is applied.
Particulate matter (RIVM monitor)
PM10
Measuring instrument EMS FH 62 I-R Inlet housing: 350 cm
heated at + 10 °C over ambient temperature
Measuring principle Attenuation of ß radiation Detection limit 4 µg/m3
Remark Due to underestimation of the particulate concentration in comparison to the reference method EN12341, a RIVM default correction factor of 1.3 is applied.
Ammoniac (LUEN monitor) NH3
Measuring instrument NH3-NOy Thermo Electron 42
Measuring principle Chemiluminescence + Thermal conversion of total-N
Detection limit 1.5 µg/m3
Ammoniac (RIVM monitor) NH3
Measuring instrument AMOR, ECN fabricate
Measuring principle Absorption of NH3 in an acid solution
followed by membrane separation and detection through conductance. Detection limit 0.12 µg/m3
Data Acquisition (LUEN) By digital RS232 connection from
monitors to PC.
Data Acquisition (RIVM) By analogue connection from monitors to
PC. Connection by telephone to database
2.2
Operational aspects
An external company maintains RIVM’s monitors whereas LUEN maintains its own monitors.
Table 4 details the number of visits for maintenance (preventive or corrective) in the year 2004.
Table 4: Total number of monitors treated for maintenance and calibration per month per institute in 2004. Month LUEN Maintenance RIVM Maintenance LUEN Calibration RIVM Calibration Jan 4 1 4 1 Feb 4 3 4 3 Mar 4 6 5 Apr 4 2 4 2 May 4 1 1 Jun 4 5 5 Jul 4 3 4 3 Aug 4 5 5 Sep 4 2 2 Oct 4 4 4 4 Nov 4 1 1 Dec 4 5 5 Total: 48 38 20 37 The figures in Table 4 are not fully comparable.
LUEN’s monitors are maintained each month on a preventive basis. RIVM’s monitors are maintained and calibrated every 4 weeks for NH3 monitors, every 3 months for PM10 and
every 6 months for NOx and O3 monitors. In addition to this, RIVM’s monitors undergo
preventive maintenance and repairs on failure.
Table 4 reveals that the annual maintenance frequency of the monitors is about the same for each institute. RIVM’s monitors, in particular the NH3 monitor, are calibrated more
frequently than those of LUEN. Ultimately the quality of the monitors is assessed by the (validated) data capture, which is subject to criteria stated in EU legislation. Further details about the data capture are provided in Section 3.1.
2.3
Calibration and verification procedure
All monitors (from both institutes) are set to frequently check its own quality status (occurs automatically on a daily basis). Although this is often referred to as the “calibration” procedure, it actually serves as “verification” of the monitor. The calibration is performed manually, as a rule during maintenance.
The difference between verification and calibration is roughly as follows:
- Verification results in a report of the monitor’s status (does the monitor respond within certain limits.
The verification and calibration methods for PM (calibration foils for PM10) and NOx
(calibration gases) are similar for both institutes, but the verification methods for O3 and NH3
are different. Tables 5a and 5b detail all of the verification methods used.
Table 5a: The verification methods used by LUEN.
Component Verification and calibration method Frequency NO & NO2 Combination of a multigas calibrator and
calibration gas of 300 ppb and zero check. Gas bottle is diluted 300 times from a 100 ppm NO bottle.
Calibration unit is checked with transfer standard (LN Industries 3012).
Every 25th hour
Every 4 months O3 Zero check with dry air. Span check with
internal UV lamp. Lamp is checked by a transfer standard (TE 49PC).
Every 25th hour Every 4 months PM10 Filter change.
Calibration by a zero and span check with calibration foils.
At specific load of filter.
Every 4 months NH3 Continuous calibration with test gas from
permeation tube.
Calibration unit is checked every 4 months with transfer standard (LN Industries 3014).
Every 73rd hour
Table 5b: The verification methods used by RIVM.
Component Verification and calibration method Frequency NO & NO2 Combination of a multigas calibrator and
calibration gas of 600 ppb and zero check. Gas bottle is diluted 500 times from a 300 ppm NO bottle. The bottle is cross-checked every year with certified reference standard. Calibration at maintenance company.
Verification every 24th hour at midnight Calibration every 12 months
O3 Zero check with ambient humidity, span
check with ozone source from multigas calibrator by gas phase titration.
Calibration every 12 months.
Every 24th hour at midnight
PM10 Filter change and deleting next hour.
Calibration by a zero and span check with calibration foils.
Every 25th hour Every 3 months NH3 Zero with absorption liquid and span check
2000 ppb NH4+.
2.4
Data treatment
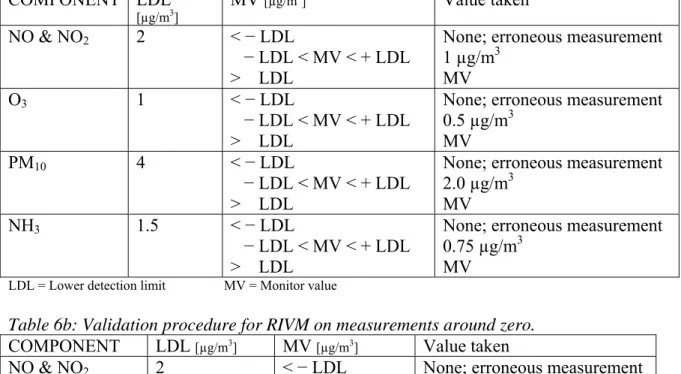
In this report the data concentrations are presented as daily averages. LUEN has slightly different acceptance rules for low or negative values than RIVM (see Tables 6a and 6b). In this report the data has been collected and treated by each institute according to its own standard procedures.
Table 6a: Validation procedure for LUEN on measurements around zero.
COMPONENT LDL [µg/m3] MV [µg/m 3] Value taken NO & NO2 2 < − LDL − LDL < MV < + LDL > LDL
None; erroneous measurement 1 µg/m3
MV
O3 1 < − LDL
− LDL < MV < + LDL > LDL
None; erroneous measurement 0.5 µg/m3
MV PM10 4 < − LDL
− LDL < MV < + LDL > LDL
None; erroneous measurement 2.0 µg/m3
MV
NH3 1.5 < − LDL
− LDL < MV < + LDL > LDL
None; erroneous measurement 0.75 µg/m3
MV
LDL = Lower detection limit MV = Monitor value
Table 6b: Validation procedure for RIVM on measurements around zero.
COMPONENT LDL [µg/m3] MV [µg/m3] Value taken
NO & NO2 2 < − LDL
> − LDL None; erroneous measurement MV
O3 1 < − LDL
> − LDL
None; erroneous measurement MV
PM10 4 < − LDL
> − LDL
None; erroneous measurement MV
NH3 0.12 < − LDL
> − LDL
None; erroneous measurement MV
LDL = Lower detection limit MV = Monitor value
In the previous report on simultaneous measurements [1] the data from the RIVM measurements were treated according to LUEN’s and not RIVM’s standard procedures. Tables 6a and 6b state the different treatment per institute of values around 0. As quite low concentrations are measured at the monitoring station, these procedures can exert a relatively high influence on the averages.
3.
Results
The comparability of LUEN and RIVM data were assessed on the basis of the following aspects:
- annual average concentration and other statistical values; - exceedance of EU limits;
- probable cause of differences.
3.1
Annual averages
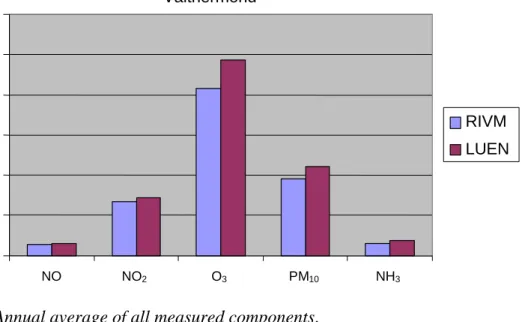
Annual averages are reported per component in Figure 3.
Pertinent data were deleted in both data series if either of the two institutes had missing data. As to RIVM, for the components NO, NO2 , O3 and PM10 this resulted in an overall average
data capture well over 96 %, and for NH3 of about 80 % .
LUEN’s capture for NH3, NO and NO2 is lower than the overall RIVM average, as these
monitors only started in mid-February. Otherwise the data capture would be 84 % for NH3
and about 96 % for NO and NO2. The availability is stated in Table 7. All of the statistical
data are stated in Appendix 2.
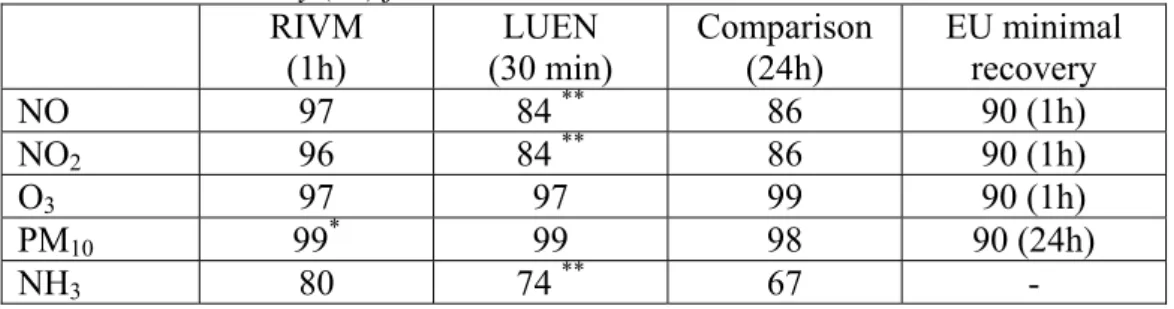
Table 7: Availability (%) from 1/1/2004 to 31/12/2004.
RIVM
(1h) (30 min)LUEN Comparison (24h) EU minimal recovery
NO 97 84 ** 86 90 (1h) NO2 96 84 ** 86 90 (1h) O3 97 97 99 90 (1h) PM10 99* 99 98 90 (24h) NH3 80 74 ** 67 - * 24h.
** monitoring started halfway February.
Despite being generally older, the RIVM monitors seem to have similar data captures than the LUEN monitors. If the late start of some of the LUEN monitors is taken into account, the LUEN and RIVM monitors are within a few percentage points of each other. All monitors comply with the relevant EU data capture requirements.
Annual average (2004) Valthermond 0 10 20 30 40 50 60 NO NO2 O3 PM10 NH3 Concent ra ti on [ µ g /m 3 ] RIVM LUEN
Figure 3: Annual average of all measured components.
Table 8 states the differences in the annual averages for all of the components measured. The results of the previous comparative measurements in Osnabrück [1] are included also in Table 8.
Table 8: Annual average of all measured components. The validation procedure is different in Osnabrück from Valthermond.
COMPONENT LUEN higher than
RIVM in Valthermond RIVM in Osnabrück [1] LUEN higher than
NO 0.3 µg/m3 11 % − 0.1 µg/m3 − 6 %
NO2 0.9 µg/m3 6 % − 0.7 µg/m3 − 3 %
O3 6.9 µg/m3 14 % 1.7 µg/m3 4 %
PM10 2.9 µg/m3 13 % − 2.0 µg/m3 − 8 %
NH3 0.4 µg/m3 11 % not measured
Figure 3 and Table 8 show that in Valthermond, the annual average RIVM concentrations for NO2, NO and NH3 are within 1 µg/m3 of those for LUEN.
For O3 and PM10 the differences are higher. As the measuring methods for O3 and PM10 are
similar for both institutes, these differences are an unwelcome surprise.
The monitor uncertainties in Osnabrück were concluded to “…more or less meet the EU data Quality Objectives…”. An uncertainty calculation has not been made for the measurements in Valthermond. However due to the higher differences in 2004 for PM10 and O3 the EU
uncertainties criteria might not be met for these components.
Several investigations were carried out to find the source of the differences: A) the data treatment was harmonised and compared;
B) the calibration standards were cross-checked at Valthermond in July 2005.
Ad A: Data treatment
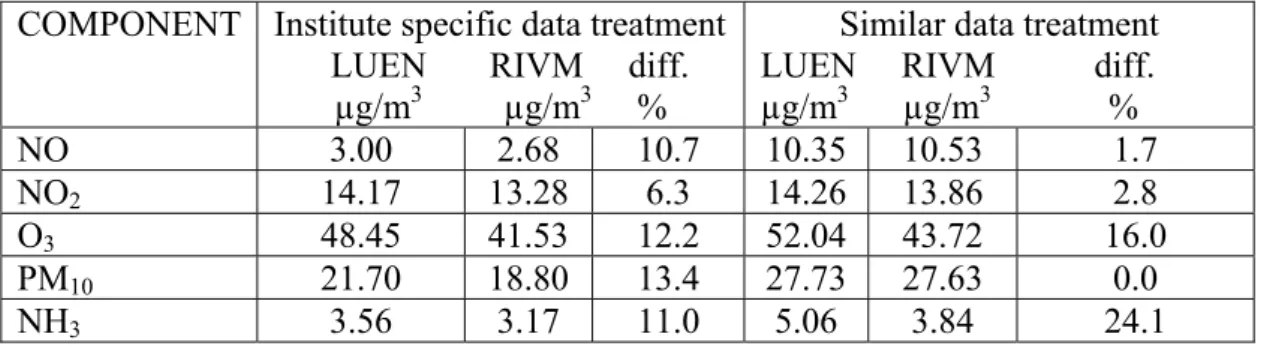
The effects of the differences in data treatment between LUEN and RIVM are shown in Table 9.
Firstly, the results are shown using the data treatment procedures per institute. Next, the results are shown using similar data treatment. For that purpose the following rules were applied: for NO and NO2, below 3.0 µg/m3, for O3 below 2.0 µg/m3, for PM10 below
5.0 µg/m3 and for NH3 below 2.0 µg/m3 all data were deleted. As before, the averaging
was only done if the data from both monitors were available.
Table 9: 2004 Annual averages for LUEN and RIVM with institute specific and with similar data treatment.
COMPONENT Institute specific data treatment LUEN RIVM diff.
µg/m3 µg/m3 %
Similar data treatment LUEN RIVM diff. µg/m3 µg/m3 % NO 3.00 2.68 10.7 10.35 10.53 1.7 NO2 14.17 13.28 6.3 14.26 13.86 2.8 O3 48.45 41.53 12.2 52.04 43.72 16.0 PM10 21.70 18.80 13.4 27.73 27.63 0.0 NH3 3.56 3.17 11.0 5.06 3.84 24.1
It is important to note that the figures under “similar data treatment” in Table 9 do not represent the real average value, since all low values have been deleted.
Table 9 shows the following:
- the data treatment has a significant influence on the estimated average for NO (LUEN and RIVM) and for NH3 (LUEN);
- the differences between LUEN and RIVM averages can be fully explained for NO, NO2
and PM10;
- for NH3 and O3 the differences increase using similar data treatment.
As to PM10 , it can be concluded that the difference between the RIVM and LUEN
averages is most likely due to the influence of data treatment. If this influence is eliminated, the differences between RIVM and LUEN for the 2004 average decreases from 2.9 to 0.1 µg/m3 (see Table 9).
It should be noted that the LUEN monitor is multiplied by a factor 1.33 and the RIVM monitor by 1.3. If the factor of 1.3 is applied to both, the RIVM results are slightly higher than LUEN (less than 2%).
As can be seen in Table 3, the heating of the inlet housings of the PM monitors are configured differently. The LUEN monitor has a lower energy input, so in theory will give less evaporation of semi-volatile dust components. So theoretically it can be expected that the LUEN monitor measures higher values than the RIVM.
As to NH3, three remarks do apply.
First, deleting all data below 2 µg/m3 implies deleting the smaller differences between LUEN and RIVM (see also Figure 7.5). Hence, it seems plausible that the average difference between LUEN and RIVM does increase.
Second, the NH3-NOy monitor 42 used by LUEN to detect NH3 is based on thermal
conversion at circa 850 °C to convert total-N to NOx, followed by chemiluminescent
detection of NOx. In this way not only NH3 is converted into NOx, but also other gaseous
components like nitric acid, and (nitrate-, sulphate-) ammonium aerosol. This results in over reading of NH3, especially at low concentrations [4]. The NH3 levels are rather low
And by that, the difference between LUEN and RIVM (some 4 µg/m vs. 5 µg/m) seems plausible.
Near stables with dominating NH3 levels with respect to total–N the afore mentioned
NH3-NOy monitoring system can serve as an indicative alternative.
Third, the LDL of the employed NH3-NOy monitor is of the same order as the observed
NH3 levels.
Ad B: Cross-check calibration standards
In July 2005 all references used for calibration were checked. All these checks gave satisfactory results, except for O3. In Figure 4 the result of the measurements by the
RIVM O3 monitor of the LUEN standard is shown. RIVM underestimates the LUEN
standard by some 16 %, on the same order as the observed difference between the annual differences.
Figure 4: The result of the RIVM O3 monitor (brown line) measurements of the LUEN
calibration standard (yellow line).
Appendix 3 describes a more detailed investigation as to the cause of the difference between LUEN and RIVM. From this investigation it is clear that:
1. The difference between LUEN and RIVM is time independent.
2. The ozone concentrations in Valthermond in 2004, relative to other RIVM stations, are not different from other years.
3. The ozone concentrations in Valthermond and neighbouring stations in Netherlands and LowerSaxony show similar patterns.
There is an important systematic and consistent difference between RIVM and LUEN for the measurement of ozone, requiring further attention.
3.2
Comparison with EU limit values
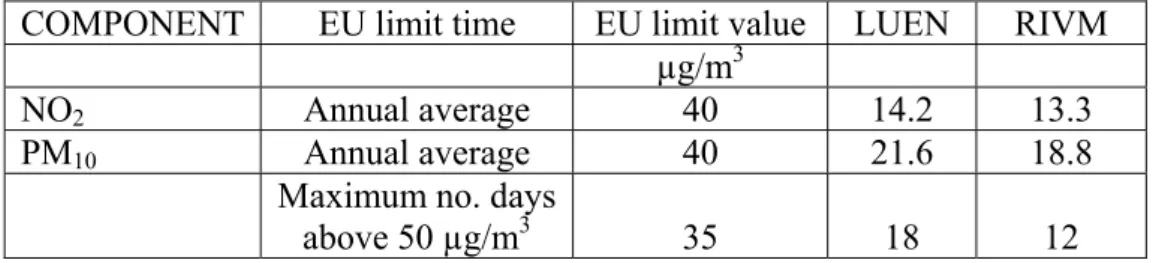
The data for NO2 and PM10 were compared with the EU limit values; see Table 10.
As to PM10 the number of days which are over 50 µg/m3 differed by 6. On all 12 RIVM days
over 50 µg/m3, LUEN also measured above 50 µg/m3.
Table 10: Exceeding of EU limits.
COMPONENT EU limit time EU limit value LUEN RIVM
µg/m3
NO2 Annual average 40 14.2 13.3
PM10 Annual average 40 21.6 18.8
Maximum no. days
above 50 µg/m3 35 18 12
Table 10 shows that the Valthermond area does not exceed the EU limit values for PM10 and
NO2 in 2004.
All statistical data are stated in Appendix 2.
3.3
Exceptional moments
Although the Valthermond station is described as a rural, it still has some episodes of
elevated levels. Figure 5 shows such a period of elevated PM10 levels (Valthermond is green;
PM10 levels around 120 µg/m3). The arrows (direction and length) show a typical Dutch
meteorological condition for these elevated levels, with high winds from the east-southeast. This figure also shows that most of the nearby stations also had elevated levels.
Figure 5: PM10 levels in Valthermond (green) and nearby stations. Red arrow indicates wind
4.
Conclusion
The main aim was to investigate the comparability of the mutual cross-border Air Quality Monitoring Networks. The results have raised questions about and provided answers to several specific issues, all of which proved to have a significant impact on the results. The differences for the 2004 averages of PM10, NO and NO2 (up to 2.9 µg/m3 ) are due to
different data treatments, whereas the differences for NH3 (0.4 µg/m3) and O3 (6.9 µg/m3)
are not.
For NH3 the differences could be due to different analysis techniques.
For O3 the cross-check of calibration standards revealed the same difference as the annual
averages. Nevertheless the exact cause of this difference has not yet been found, and this requires further attention
The programme led to a constructive improvement in the quality of the data produced by each institute and showed us how to improve the international comparability. Further, much was learned from the experiences exchanged. The programme will be continued at the Valthermond site in 2005 to investigate the underlying causes in the differences and to resolve these. A new report will be issued for the 2005 results.
References
[1] Meulen A. van der, D. van Straalen, B.G. van Elzakker, B Heits, E. Helmholz and H. Rienecker, Field comparison of air monitoring networks. Niedersächsisches Landesamt für Ökologie, Medienübergreifender Umweltschutz, Hildesheim 2003 (NLÖ) Germany and the National Institute for Public Health and the Environment (RIVM, the
Netherlands). (Language: English and German). ISSN 0949-8265 (2003).
[2] Databank Airbase (http://bettie.rivm.nl/etc-acc/appletstart.html ) of the European Topic Centre on Air and Climate Change.(language: English)
[3] Council Directive 1999/30/EC of 22 April 1999 relating to limit values for sulphur dioxide, nitrogen dioxide and oxides of nitrogen, particulate matter and lead in ambient air. Official Journal of the European Communities 163 29/6 1999.
[4] Putten E.M. van, M.G. Mennen, T. Regts and J.W. Uiterwijk
Performance study of four automatic ammonia monitors under controlled conditions RIVM report 723101004 (1994).
APPENDIX 1: Map and macro requirements on “rural”
type measuring location
Figure 6: Map showing the location of Valthermond (“929”).
Table 11: Requirements for a rural station [2.]
SUBJECT REQUIREMENT SITUATION at VALTHERMOND
Representative for 100−1000 km2 Minimum distance from a motorway 5 km South at 10 km (A37) East at 18 km (A31) West at 20 km (A28) Minimum distance from an urban agglomeration 20 km 130 km
(to Agglomeration Utrecht) Minimum distance
from built-up areas
5 km 4 towns nearby: Emmen (NL) 108,000 south at 9 km Stadskanaal (NL) 20,000 north at 10 km Assen (NL) 63,000 northwest at 28 km Papenburg (G) 35,000 northeast at 18 km Minimum distance
from an industrial area
5 km south at 9 km
APPENDIX 2: Data
All the statistical data of the measuring results are stated in this appendix.
* Availability of data from monitor, LUEN average values over 30 minutes, RIVM over 1 hour.
** Percentage used for comparison (24h).
Table 12.1: NO
Year 2004
Averaging time in days 1 1 1 1 1 1 1 * **
average P50 P95 P98 P99.5 max N % % LUEN Valthermond 3.00 1.00 13.20 29.56 43.96 55.00 313 84 RIVM 86 Valthermond 2.68 0.73 13.61 29.93 43.69 54.25 313 97 Table 12.2: NO2 Year 2004
Averaging time in days 1 1 1 1 1 1 1 * **
average P50 P95 P98 P99.5 max N % % Limit value 40 LUEN Valthermond 14.17 11.00 33.00 48.52 54.2 59.00 313 84 RIVM 86 Valthermond 13.28 10.70 30.96 41.95 48.45 52.12 313 97
Table 12.3: O3
Year 2004
Averaging time in days 1 1 1 1 1 1 1 * **
average P50 P90 P95 P98 max N % % LUEN Valthermond 48.45 51.00 75.00 83.00 93.00 112.00 362 97 RIVM 99 Valthermond 41.53 43.03 64.75 71.96 76.84 97.51 362 97 Table 12.4: PM10 Year 2004
Averaging time in days 365 1 1 1 1 1 1 * **
average P50 P90 P95 P98 max N % % Limit value 40 Limit value 50 LUEN Valthermond 21.70 17.00 38.70 51.70 60.74 87.00 364 99 RIVM 98 Valthermond 18.80 14.58 33.72 42.14 57.24 82.13 363 99 Table 12.5: NH3 Year 2004
Averaging time in days 1 1 1 1 1 1 1 * **
average P50 P90 P95 P98 max N % % LUEN Valthermond 3.56 3.16 6.60 8.12 8.94 9.75 247 74 RIVM 67 Valthermond 3.17 2.65 6.01 8.03 9.76 15.87 247 80
Red line: first order equation forced through zero
Black line: first order equation
Figure 7.1: NO
Figure 7.2: NO2
Figure 7.3: PM10
Simultaneous measurements
LUEN - RIVM, Valthermond (NL) daily means NO2
y = 0.92x R2 = 0.96 y = 0.90x + 0.53 R2 = 0.96 0 10 20 30 40 50 60 0 10 20 30 40 50 60 70 LUEN µg/m3 RI VM µ g /m 3 Simultaneous measurements
LUEN - RIVM, Valthermond (NL) daily means PM10
y = 0.86x R2 = 0.84 y = 0.82x + 1.04 R2 = 0.84 0 20 40 60 80 100 0 10 20 30 40 50 60 70 80 90 100 LUEN µg/m3 RI VM µ g /m 3 Simultaneous measurements
LUEN - RIVM, Valthermond (NL) daily means NO
y = 0.97x R2 = 0.99 y = 0.98x - 0.27 R2 = 0.99 0 10 20 30 40 50 60 0 10 20 30 40 50 60 LUEN µg/m3 RI VM µ g /m 3
Figure 7.4: O3
Figure 7.5: NH3
Simultaneous measurements
LUEN - RIVM, Valthermond (NL) daily means O3
y = 0.86x R2 = 0.99 y = 0.85x + 0.39 R2 = 0.99 0 20 40 60 80 100 120 0 20 40 60 80 100 120 LUEN µg/m3 RI VM µ g /m 3 Simultaneous measurements
LUEN - RIVM, Valthermond (NL) daily means NH3
y = 0.77x R2 = 0.04 y = 0.45x + 1.58 R2 = 0.15 0 5 10 15 20 0 2 4 6 8 10 12 LUEN µg/m3 RI VM µ g /m 3
APPENDIX 3: O
3averages
Since the difference in the averages for O3 between LUEN and RIVM at Valthermond in
2004 are significant, a number of investigations were made:
a) A graph with monthly averaged values per institute was analysed to see if the differences were time dependent (Figure 9).
b) To exclude the possibility that 2004 was an exceptional year, a long-term monthly average of all the rural Ozone stations in the RIVM network was compared.
c) To see if the measurements of the LUEN in Valthermond were comparable with other nearby stations, these were compared with the data from neighbouring stations, i.e. two other LUEN stations and one other RIVM station.
Ad a. Figure 8 shows that there is no time-dependency. Each month the RIVM result is 10 % to 20 % lower than LUEN’s.
0 10 20 30 40 50 60 70 80
Jan Feb Mar Apr May jJun jJuly Aug Sep Oct Nov Dec
mg/m³
O3 RIVM O3
Valthermond LUEN-Daten
Ad b. As can de inferred from Figure 9 (see red line in Figure 9), 2004 was not a different year for Valthermond compared to the period 2002–2004.
Figure 9: Monthly Ozone averages from all rural RIVM station
Ad c. The annual O3 averages of other LUEN and RIVM stations were compared (Figure
10). This revealed that all LUEN stations exhibit very cohesive concentration
development. It is difficult to draw conclusions from these figures, but it would appear to be more productive to investigate the quality of the RIVM data of O3 in Valthermond.
Yearly average O3
Valthermond and other nearby stations
0 10 20 30 40 50 60 2002 2003 2004 2005 2006 Year µg /m 3 Valthermond (LUEN) Emden (LUEN, 111 km) Lingen (LUEN, 64 km) Valthermond (RIVM) Kollumerwaard (RIVM, 87 km)
Figure 10: Annual O3 averages of Valthermond and nearby stations. regionale stations 0.0 10.0 20.0 30.0 40.0 50.0 60.0 70.0 80.0 ja n 20 02 fe b 20 02 m rt 20 02 ap r 20 02 m ei 20 02 ju n 20 02 ju l 2 00 2 au g 20 02 se p 20 02 ok t 20 02 no v 200 2 de c 20 02 ja n 20 03 fe b 20 03 m rt 20 03 ap r 20 03 m ei 20 03 ju n 20 03 ju l 2 00 3 au g 20 03 se p 20 03 ok t 20 03 no v 200 3 de c 20 03 ja n 20 04 fe b 20 04 m rt 20 04 ap r 20 04 m ei 20 04 ju n 20 04 ju l 2 00 4 au g 20 04 se p 20 04 ok t 20 04 no v 200 4 de c 20 04 ja n 20 05 fe b 20 05 m rt 20 05 ap r 20 05 m ei 20 05 ju n 20 05 ju l 2 00 5 au g 20 05 se p 20 05 ok t 20 05 no v 200 5 maand PM 10 ( ug /m 3) 107 131 133 227 230 235 301 318 411 437 444 538 620 627 631 633 722 738 807 818 918 929 2002 2003 2004 2005 Rural stations