1) Kiwa Research and Consultancy, P.O.Box 1072, 3430 BB Nieuwegein 2) PWN, Water Supply Company North Holland, Lucasweg 2, 2031 BE Haarlem
3) SVM, The Foundation for Advancement of Public Health and Environmental Protection, P.O.Box 457, 3720 AL Bilthoven
RIVM report 289202 028
Comparison of methods for enumeration of total coliforms and Escherichia coli in water samples in the Netherlands
F.M. Schets, P.J. Nobel1), S. Strating2), K.A. Mooijman3), G.B. Engels and A. Brouwer1)
March 2001
This investigation has been performed by order and for the account of the General Directorate for Environmental Protection, directorate of Drinking Water, Water and Agriculture, within the framework of project 289202, Watermicrobiology (MGB project MGB143).
Abstract
The new European Drinking Water Directive (December 1998) defines a reference method for estimating the concentration of coliforms and Escherichia coli in drinking water.
Laboratories may use other methods, but should demonstrate that results obtained are at least as reliable as those produced with the reference method. Three Dutch laboratories
participated in a European trial, in which a protocol for comparing enumeration methods for total coliform bacteria and Escherichia coli in water samples was tested. Besides the
membrane filtration method on Lactose TTC agar with Tergitol 7 (LTTC) described in ISO 9308-1, and the Colilert® method, the Dutch laboratories included membrane filtration methods on Laurylsulphate Agar (LSA), Chromocult® Coliform Agar (CCA) and the E. coli Direct Plating method. On LTTC37 significantly more total coliforms were enumerated than on LSA37; however, the LTTC method was found suitable for analysing very clean
(drinking) water samples only, due to its lack of selectivity. The DP method (or Rapid Test in ISO 9308-1) is the best method for enumeration of E. coli, while the Colilert® method produces 12,5 % false negative E. coli results. Recommendations for making a choice for a method for detection and enumeration of total coliforms and/or E. coli in water samples with different contamination levels are given.
Samenvatting
De nieuwe Europese Drinkwater Richtlijn (Anonymous, 1998) schrijft een methode voor voor de bepaling van het aantal bacteriën van de coligroep en Escherichia coli in drinkwater. Laboratoria mogen andere methoden gebruiken, maar moeten aantonen dat de resultaten die met deze methoden verkregen worden ten minste zo betrouwbaar zijn als die verkregen worden met de referentiemethode.
Er is een protocol voor het vergelijken van referentie en alternatieve methoden ontwikkeld (Fricker, Thames Water Utilities, Engeland; Appendix 1) en een aantal Europese laboratoria heeft dit protocol getest. De referentie methode voor het bepalen van bacteriën van de coligroep en E. coli in water was hier Lactose TTC agar met Tergitol 7 (LTTC), die
beschreven staat in ISO 9308-1 (Anonymous, 2000). Colilert® (IDEXX Laboratories) werd gebruikt als alternatieve methode.
De drie Nederlandse laboratoria die deelnamen aan het onderzoek (RIVM-MGB, Kiwa, PWN) gebruikten naast bovengenoemde methoden ook drie methoden die nu in Nederland in gebruik zijn. Er werden monsters met een verwacht besmettingsniveau van 1-50 bacteriën van de coligroep per 100 ml geselecteerd. Een totaal aantal van 179 monsters ((verdund) oppervlaktewater, drinkwater (halfproducten)) werd geanalyseerd met behulp van de Direct Plating methode (als snelle test beschreven in ISO 9308-1), Chromocult® Coliform Agar (CCA, Merck), Colilert® en LTTC om E. coli te bepalen. Laurylsulfaat agar (LSA37, Anonymous, 1982)), CCA, Colilert® en LTTC werden gebruikt om bacteriën van de coligroep te bepalen. Van membraanfilters met groei op LTTC en LSA37 werden karakteristieke kolonies bevestigd en uit positieve Colilert® wells werden reincultures geïsoleerd en bevestigd. Dit rapport beschrijft de resultaten van de Nederlandse deelnemers. Uit paarsgewijze vergelijking van de tellingen met behulp van de "sign test" en de "signed (Wilcoxon) rank test", bleek dat significant (P<0.05) meer bacteriën van de coligroep werden geteld op LTTC37 dan op LSA37. Alle drie de laboratoria rapporteerden echter achtergrond groei die 50-100 % van het oppervlak van membraanfilters, geïncubeerd op LTTC bij 37 °C (LTTC37), bedekte. Dit maakte het tellen van de karakteristieke gele kolonies tussen grote aantallen oranje tot bruine kolonies erg lastig. Incubatie van LTTC bij 44 °C (LTTC44) verbeterde dit gebrek aan selectiviteit enigzins. Karakteristieke kolonies die oxidase positief waren en door één laboratorium bevestigd werden als Aeromonas, werden regelmatig aangetroffen op LTTC37. De deelnemende laboratoria gebruiken de LSA37 methode routinematig en vonden deze eenvoudig uit te voeren en af te lezen. Er werd wel melding gemaakt van de aanwezigheid van enige storende achtergrondgroei (kleine rose kolonies) bij de analyse van oppervlaktewater monsters. Gemiddeld werd 80 tot 85 % van de isolaten verkregen van resp. LTTC37 en LSA37 bevestigd als bacteriën van de coligroep.
Colilert®, de enige MPN methode in dit onderzoek, was erg gebruikersvriendelijk: zowel het analyseren van de monsters als het aflezen van de resultaten was eenvoudig. De drie
deelnemers telden significant (P<0.05) hogere aantallen bacteriën van de coligroep met deze methode dan met de andere methoden. Verschillen in tellingen verkregen met de
worden uit het gebruik van verschillende substraten, wat resulteert in de detectie van
verschillende groepen coliformen: op lactosehoudende media vormen bacteriën die zowel het
lacY als het lacZ gen bezitten (coderend voor lactose fermentatie) karakteristieke gele
kolonies; bacteriën die alleen het lacZ gen hebben kunnen lactose niet gebruiken en vormen geen gele kolonies, maar geven wel een positief resultaat in Colilert®.
Met Colilert® werden significant (P<0.05) lagere aantallen E. coli gevonden dan met LTTC37, LTTC44 en de Direct Plating methode, bovendien werden ook 12,5 % vals negatieve resultaten voor E. coli waargenomen. Dit bevestigt resultaten uit eerdere
onderzoeken. Hieruit bleek dat een deel van de E. coli populatie niet in staat is het Colilert® substraat (een ander substraat dan in de overige methoden) te gebruiken. Het
bevestigingspercentage voor E. coli was zeer hoog: 96 % van de isolaten uit wells die karakteristieke reacties voor E. coli vertoonden werd als E. coli bevestigd.
Concluderend: m.b.v. LTTC37 werden significant meer bacteriën van de coligroep
gedetecteerd dan m.b.v. LSA37. Het bevestigingspercentage voor bacteriën van de coligroep was voor beide methoden vergelijkbaar, maar door gebrek aan selectiviteit is LTTC alleen geschikt voor het onderzoeken van zeer schoon (drink)water. Voor bepaling van E. coli is de Direct Plating methode het meest geschikt; deze methode is eenvoudig uit te voeren en detecteerde meer E. coli dan LTTC37, LTTC44 en Colilert®. Colilert® is
gebruikersvriendelijk, maar vanwege het hoge percentage vals negatieven minder geschikt voor bepaling van E. coli.
Er worden aanbevelingen gegeven voor het maken van een keuze voor een methode voor bepaling van bacteriën van de coligroep en/of E. coli in monsters water met verschillend besmettingsniveau.
Summary
The new European Drinking Water Directive (Anonymous, 1998) defines a reference method for the estimation of the concentration of total coliforms and Escherichia coli in drinking water. Laboratories may use other methods, but should demonstrate that the results obtained are at least as reliable as those produced by the reference method.
A protocol for comparison of reference and alternative methods was developed (Fricker, Thames Water Utilities, UK; Appendix 1) and a number of European laboratories tested this protocol. The reference method for determination of total coliforms and E. coli in water was Lactose TTC agar with Tergitol 7 (LTTC), which is described in ISO 9308-1 (Anonymous, 2000); Colilert® (IDEXX Laboratories) was used as an alternative method.
The three Dutch laboratories (RIVM-MGB, Kiwa, PWN) that joined in the trial also included three methods that are currently used in the Netherlands. Samples with an expected
contamination level of 1-50 coliforms per 100 ml were selected. A total number of 179 samples ((diluted) surface water, drinking water (half products)) were analysed by using the Direct Plating method (described as Rapid Test in ISO 9308-1), Chromocult® Coliform Agar (CCA, Merck), Colilert® and LTTC to enumerate E. coli. Laurylsulphate agar (LSA37, Anonymous, 1982), CCA, Colilert® and LTTC were used to enumerate total coliforms. From positive membrane filters on LTTC and LSA37, characteristic colonies were confirmed and from positive Colilert® wells pure cultures were obtained and confirmed. This report describes the results obtained by the Dutch participants.
Pairwise comparison of the count results by using the sign test and the signed rank (Wilcoxon) rank test, showed that LTTC37 enumerated significantly more (P<0.05) total coliforms than LSA37. However, all three laboratories reported background growth as high as 50-100 % coverage of membrane filters that were incubated on LTTC at 37 °C (LTTC37). This made counting of the characteristic yellow colonies amongst a crowd of orange to brown colonies very difficult. Incubation at 44 °C (LTTC44) slightly improved this lack of
selectivity. Characteristic yellow colonies being oxidase positive (and confirmed as
Aeromonas by one laboratory) were regularly observed on LTTC37. The participating
laboratories use the LSA37 method routinely and found it easy to perform, although some disturbing background growth (small pink colonies) was reported when analysing surface water samples. An average of 80 to 85 % of the isolates obtained from resp. LTTC37 and LSA37 was confirmed as total coliforms.
Colilert®, the only MPN method included in the trial, was very convenient: analysing samples and reading results was easy. The three participants enumerated significantly (P<0.05) higher numbers of total coliforms with this method than with the other methods. Differences in counts obtained with membrane filtration methods on lactose containing media and Colilert® can be explained from the different substrates that are used resulting in the detection of different groups of coliform bacteria: on lactose containing media bacteria having both the lacY and the lacZ coding for lactose fermentation form charcteristic yellow colonies; bacteria having only the lacZ gene cannot use lactose and do not form yellow colonies, but do give a positive result in Colilert®.
Colilert® enumerated significantly (P<0.05) less E. coli than LTTC37, LTTC44 and the Direct Plating method; 12.5 % false negative E. coli results were also observed. This confirms results from previous research, which showed that a part of the E. coli population was not able to use the Colilert® substrate for E. coli detection, which differs from substrates in the other methods. From 96 % of the Colilert® wells that showed a positive reaction for E.
coli, E. coli could be isolated.
In conclusion: LTTC37 detected significantly more total coliforms than LSA37, confirmation rates were comparable, but due to lack of selectivity LTTC is suitable for monitoring of very clean (drinking) water samples only.
For enumeration of E. coli, the Direct Plating method is the most suitable method: the method is easy to perform and detected more E. coli than LTTC37, LTTC44 and Colilert®. Colilert® is userfriendly, but due to a high percentage false negative results considered less suitable for enumeration of E. coli.
Recommendations for making a choice for a method for detection and enumeration of total coliforms and/or E. coli in water samples with different contamination levels are given.
Abbreviations
BBLB Brilliant Green Bile Lactose Broth CCA Chromocult® Coliform Agar
DP Direct Plating
DW Drinking Water
DWI Drinking Water Inspectorate
EN Europese Norm
ISO International Organisation for Standardisation LSA Laurylsulphate Agar
LTTC Lactose TTC agar with Tergitol 7
MPN Most Probable Number
MUG 4-methyllumbelliferyl-β-D-glucuronide ONPG ortho-nitrofenyl-β-α-galactopyranoside
PS Peptone Saline
PWN Water Supply Company North Holland
RIVM-MGB National Institute of Public Health and the Environment - Microbiological Laboratory for Health Protection
TB Tryptophane Broth
TBA Tryptone Bile Agar
TSA Tryptone Soy Agar
Contents
1. Introduction 9
2. Materials and methods 11
2.1 Samples 11
2.2 Methods per laboratory 11
2.3 Method description 11
2.3.1 Colilert® 11
2.3.2 Lactose TTC with Tergitol 7 (LTTC) 11
2.3.3 Laurylsulphate Agar (LSA) 12
2.3.4 Chromocult® Coliform Agar (CCA) 12
2.3.5 E. coli Direct Plating Method (DP) 12
2.4 Quality control 12
2.5 Additional confirmation 13
2.6 Statistical evaluation 14
3. Results 15
3.1 Count results 15
3.2 Comparing count results per laboratory 16
3.3 Confirmation 21
3.4 Practical aspects of methods 22
4. Discussion 25 5. Conclusions 27 6. Recommendations 27 Acknowledgements 28 References 29 Appendices 31
Appendix 1 A draft protocol for comparison of the EU reference method for coliforms and E.coli with
alternative culture methods 32
Appendix 2 Short description of sample sites 38
Appendix 3 Description of Colilert®-18 39
Appendix 4 Description of the Chromocult® Coliform method 40
Appendix 5 The number of total coliforms (totcol) and E. coli per 100 ml in samples analysed by Kiwa
with different methods 41
Appendix 6 The number of total coliforms (totcol) and E. coli per 100 ml in samples analysed by PWN
with different methods 42
Appendix 7 The number of total coliforms (totcol) and E. coli per 100 ml in samples analysed by
RIVM-MGB with different methods 44
Appendix 8 European method comparison trial: final report. Colin R. Fricker, Seppo I. Niemela
& John L. Lee, September 2000 46
1.
Introduction
The new European Drinking Water Directive (Anonymous, 1998) defines reference methods for the enumeration of microbiological parameters in drinking water. Member states may use alternative methods, in case they have demonstrated that these methods produce results that are at least as reliable as those produced by the reference methods. Most of the reference methods chosen are ISO (International Oragnisation for Standardisation) and EN (Europese Norm) methods, some of them recently revised.
For many member states the methods defined as reference methods in the new Drinking Water Directive, are different from the methods currently used in their laboratories.
Laboratories that wish to continue the use of their ‘own’ methods will be regularly confronted with the problem of having to prove these methods being as good as the reference method. This resulted in the need for a protocol that describes how such a test should be performed to give a statistically reliable outcome. Within ISO, a working group (ISO TC147/SC4/WG12 "Analytical Quality control") is in charge of producing an ISO document for comparing microbiological methods titled ‘Equivalence of microbiological quantitative cultural
methods’. For the purpose of the comparison of methods for total coliforms and Escherichia
coli in this study, a protocol was developed on basis of a Drinking Water Inspectorate (DWI,
UK) document ("Comparison of Methods for Drinking Water Bacteriology – Cultural
Techniques’) by C. Fricker (Thames Water Utilities, UK) in cooperation with the participants in this study. The applied protocol is inserted in Appendix 1 of this report.
According to this protocol, methods are compared based on the recovery of the target
organisms and the number of false positive results. An alternative method will be rejected if it shows significantly lower average counts than the reference method. It will be accepted if it is better or if it is “no different”, and the 95 % confidence interval for the average difference lies entirely above the value which would indicate that the alternative method was finding " 10 % fewer organisms than the reference method. Comparison of the fraction of false positive results can be obtained by estimating the true positive rate of the methods. In order to
determine this true positive rate, colonies should be confirmed. The true positive rate is the fraction of the tested typical colonies confirmed positive.
Participating countries in the test trial of the "Draft protocol for comparison of the EU reference method for coliforms and E. coli with alternative culture methods" (Appendix 1) were to examine 150 samples with an expected total coliform count of 10-50 per 100 ml and 50 samples with an expected total coliform count of 1-10 per 100 ml. For each country, this workload could be divided over a number of participating laboratories. Methods to be used were the membrane filtration method described in ISO 9308-1 (Anonymous, 2000), in which membrane filters were incubated on Lactose TTC agar with Tergitol 7 (LTTC) and the commercially available Colilert®18/QuantiTray (Colilert®) system which has a Most Probable Number (MPN) format. To suppress expected background growth due to lack of selectivity of the LTTC medium, for each sample a membrane filter was incubated on LTTC
at (44 ± 0.5) °C, in addition to the usual incubation at (36 ± 2) °C. Participating laboratories were to confirm at least 100 colonies from LTTC and 200 positive wells from Colilert®. Three Dutch laboratories participated in the European trial: National Institute of Public Health and the Environment, Microbiological Laboratory for Health Protection (RIVM-MGB), Kiwa Research and Consultancy (Kiwa) and Water Supply Company North Holland (PWN). Besides the methods prescribed in the protocol, they also analysed their samples with three methods that are currently used in the Netherlands for the enumeration of total
coliforms and E. coli, which differ from the methods included in the European trial. They analysed a total of 179 samples using LTTC, Colilert®, the E.coli Direct Plating method, Laurylsulphate Agar (LSA) and Chromocult® Coliform Agar (CCA). This report describes the results obtained by the Dutch laboratories. The methods used were compared on basis of their count results and confirmation rates, but practical aspects such as readability of results and user friendliness were also considered.
The final report of the European Trial, in which 20 laboratories participated and used the methods prescribed in the protocol only, is inserted in Appendix 8 of this report.
2.
Materials and methods
2.1
Samples
Samples were taken according to NEN 6559 (Anonymous, 1992), cooled and transported to the laboratories, where they were stored at 2-8 °C , if necessary, and analysed within 24 hours. Samples were taken at different sites, a description of each sample site and the sample type is summarized in Appendix 2. A total of 179 samples was analysed (RIVM-MGB 80, Kiwa 38, PWN 61). Surface water samples were diluted in peptone saline (PS: 0.1 % peptone in 0.09 % saline) to obtain an expected count of 1-50 total coliforms per 100 ml. Diluted samples with this target were considered natural samples and 100 ml of these samples was analysed per method. Counts were not corrected for the dilution.
2.2
Methods per laboratory
RIVM-MGB, Kiwa and PWN enumerated total coliforms by using Colilert®, Lactose TTC with Tergitol 7 (LTTC) and Laurylsulphate Agar (LSA). Kiwa used Colilert® and LTTC (both at (36 ± 2) and at (44 ± 0.5) °C) to enumerate E. coli, RIVM-MGB added the E. coli Direct Plating (DP) method to these methods, whereas PWN added Chromocult® Coliform Agar (CCA) to enumerate both total coliforms and E. coli. The methods were performed according to the brief descriptions in the next paragraph.
2.3
Method description
2.3.1 Colilert®
100 ml water sample is mixed with a fixed amount of Colilert® reagent, the mixture is poured into a Quanti-Tray, which has a 51-well MPN format. The tray is sealed and incubated at (37 ± 1) °C for 18-22 h. Total coliform positive wells display a yellow color, whereas E. coli positive wells are yellow and fluoresce under UV light (365 nm). By means of a MPN table (provided with the system) counts of the number of positive wells can be transferred to a Most Probable Number (MPN) of the target organisms.
The Colilert® method is described in detail in the user instruction that is inserted in Appendix 3.
2.3.2 Lactose TTC with Tergitol 7 (LTTC)
The sample is filtered through a 0.45 mm pore size membrane filter, which is incubated on LTTC for (21 ± 3) h at (36 ± 2) °C. Typical lactose positive colonies are yellow. A
representative number of typical colonies (at least 10) is subcultured onto Tryptone Soy Agar (TSA), which is incubated at (36 ± 2) °C for (21 ± 3) h. Material from the TSA plate is used for oxidase tests and is also inoculated into Tryptophane Broth (TB), which is incubated for (21 ± 3) h at (44 ± 0.5) °C and examined for the production of indole by adding 0.2-0.3 ml
Kovacs’ reagent. Lactose positive colonies being oxidase negative are total coliforms; lactose positive colonies being oxidase negative and indole positive are E. coli.
This method and the composition of the used media are described in detail in ISO 9308-1 (Anonymous, 2000).
2.3.3 Laurylsulphate Agar (LSA)
A water sample is filtered through a 0.45 mm pore size membrane filter, which is incubated on LSA for (5 ± 1) h at (25 ± 1) °C, followed by (14 ± 2) h at (37 ± 1) °C. At least 5 typical yellow colonies are selected for confirmation in Brillant Green Bile Lactose Broth (BBLB), which is incubated at (37 ± 1) °C. The tubes are examined for gas production after (22 ± 2) h and (44 ± 4) h. Yellow colonies which produce gas in BBLB are total coliforms.
This method and the composition of the used media are described in detail in NEN 6571 (Anonymous, 1982).
2.3.4 Chromocult® Coliform Agar (CCA)
Filtration of a sample through a 0.45 mm pore size membrane filter is followed by incubation of the membrane filter on CCA. PWN incubated the agar plates for (5 ± 1) h at (25 ± 1) °C and (14 ± 2) h at (37 ± 1)°C, which is different form the incubation prescribed by the manufacturer. Total coliforms produce salmon to red colonies, whereas E. coli forms dark-blue to violet colonies. For confirmation of presumptive E. coli the dark-dark-blue colonies are overlayed with a drop of Kovacs’ reagent. A positive reaction (cherry-red coloring of the colony ) confirms the presence of E. coli.
A detailed describtion of this method is inserted in Appendix 4.
2.3.5 E. coli Direct Plating Method (DP)
After filtration of a sample through a 0.45 mm poresize membrane filter, the membrane filter is incubated on TSA for 4 –5 h at (36 ± 2) °C, transferred to Tryptone Bile Agar (TBA) and incubated for 19-20 h at (44 ± 0.5) °C. Colonies are stained with James reagent (bioMerieux); cherry-red colonies are E. coli.
The E. coli DP method is described as Rapid Test in ISO 9308-1 (Anonymous, 2000).
2.4
Quality control
The participating Dutch laboratories used positive and negative controls and blanc samples as prescribed by their own individual quality control systems. They all used E. coli WR1 and
Enterobacter cloacae WR3 as reference strains. Quality control data are not shown since
2.5
Additional confirmation
To assess the true positive rate, which is the fraction of the tested typical colonies confirmed positive, for each method (whenever applicable) additional confirmation tests were
performed. LSA37 and CCA were confirmed as described in paragraph 2.3.3 and 2.3.4;
E.coli DP counts were not further confirmed, since the method already includes testing for
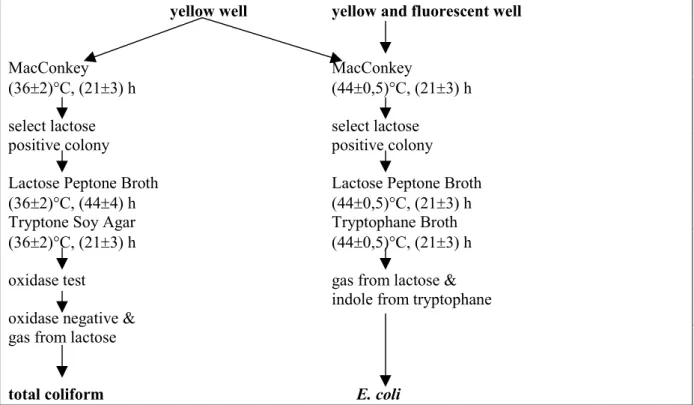
indole production. From total coliform positive (yellow) and E. coli positive (yellow and fluorescence) Colilert® wells material was subcultured on MacConkey agar no. 3 (Oxoid) to obtain pure cultures which were confirmed according to the flow chart in Figure 1.
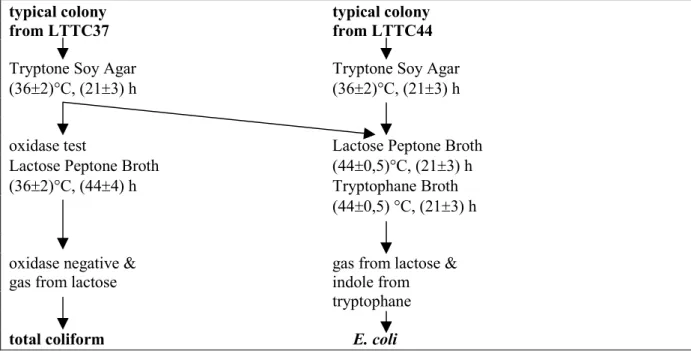
Characteristic colonies from LTTC incubated at (36 ± 2) °C (LTTC37) and at (44 ± 0.5) °C (LTTC44) were confirmed following the flow chart in Figure 2.
yellow well yellow and fluorescent well
MacConkey MacConkey
(36±2)°C, (21±3) h (44±0,5)°C, (21±3) h
select lactose select lactose
positive colony positive colony
Lactose Peptone Broth Lactose Peptone Broth
(36±2)°C, (44±4) h (44±0,5)°C, (21±3) h
Tryptone Soy Agar Tryptophane Broth
(36±2)°C, (21±3) h (44±0,5)°C, (21±3) h
oxidase test gas from lactose &
indole from tryptophane oxidase negative &
gas from lactose
total coliform E. coli
Figure 1 Confirmation procedure of total coliform positive (yellow) and E. coli positive (yellow and fluorescence) Colilert® wells.
typical colony typical colony
from LTTC37 from LTTC44
Tryptone Soy Agar Tryptone Soy Agar
(36±2)°C, (21±3) h (36±2)°C, (21±3) h
oxidase test Lactose Peptone Broth
Lactose Peptone Broth (44±0,5)°C, (21±3) h
(36±2)°C, (44±4) h Tryptophane Broth
(44±0,5) °C, (21±3) h
oxidase negative & gas from lactose &
gas from lactose indole from
tryptophane
total coliform E. coli
Figure 2 Confirmation procedure of typical colonies from Lactose TTC agar with Tergitol 7 incubated at 37 °C (LTTC37) or at 44 °C (LTTC44).
2.6
Statistical evaluation
To compare the counts obtained by using different methods, counts were compared pairwise in SAS 6.12. Two statistical tests were used: the sign test and the signed rank (Wilcoxon) test. These tests test whether the pairwise difference between two values differs significantly from zero.
As some counts were censored (i.e. only a minimum value for the counts was known due to
e.g. overgrowth of the plates), exact differences could not always be calculated and thus
direct application of these tests was not possible. Therefore the following steps were taken to calculate a "difference-score" delta between two counts:
1. If one of the counts was missing, delta was recorded as missing.
2. When both counts were known exactly, delta was recorded as the arithmetic difference. 3. If, of two values, the larger one was censored, delta was recorded as the difference
between the value of the smaller count and the minimum of the larger one. Thus delta would be the minimum of what the true difference could be. The sign of delta (positive or negative), however, thereby corresponds with that of the true difference.
4. If, of two values, only the minimum of the smaller one was known, delta was recorded as 0. This was done, to reflect the uncertainty on which of the values was the larger one.
3.
Results
3.1
Count results
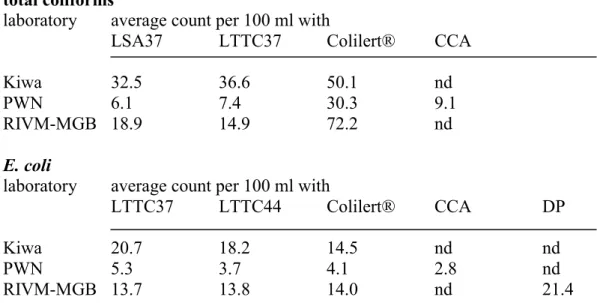
Confirmed (whenever applicable) count results are summarized in Appendix 5 (Kiwa), 6 (PWN) and 7 (RIVM-MGB). These results were used to compare a set of methods that enumerated total coliforms and a set of methods that enumerated E.coli. Comparisons were made for each laboratory individually. The count results of individual samples were summed per laboratory and an average count per 100 ml was calculated for each method. The results of these calculations are displayed in Table 1.
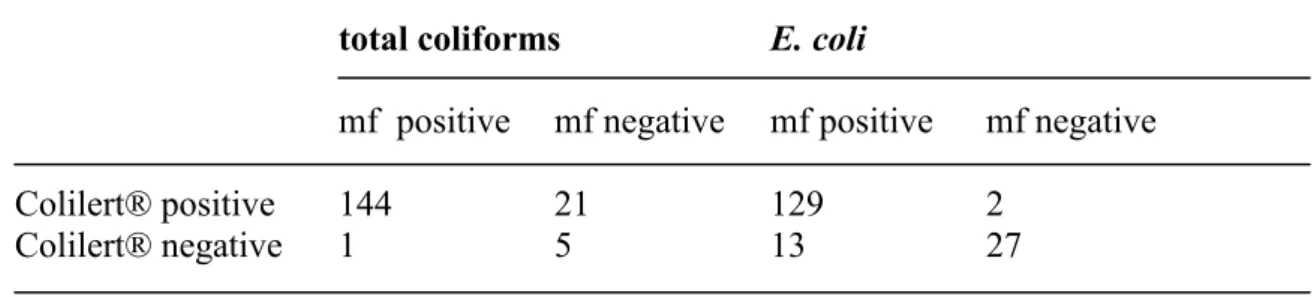
All laboratories had highest average total coliform counts with Colilert®, whereas LTTC37 and LSA37 gave similar average counts. Both Kiwa and PWN found highest average E. coli counts on LTTC37. However, at RIVM-MGB average E. coli counts on LTTC37, LTTC44 and with Colilert® were similar, but the E.coli DP method gave a higher average count. The number of samples that was found positive for total coliforms or E. coli was calculated; the membrane filtration methods done by all laboratories (LSA37 and LTTC37 for total coliforms and LTTC37 and LTTC44 for E. coli) were compared with Colilert® (Table 2).
Table 1 Average total coliform counts and E. coli counts in a set of samples, calculated for each laboratory and per method used (nd = not done);LSA37, LTTC37 and LTTC44 counts are confirmed counts, all others are not.
total coliforms
laboratory average count per 100 ml with
LSA37 LTTC37 Colilert® CCA
Kiwa 32.5 36.6 50.1 nd
PWN 6.1 7.4 30.3 9.1
RIVM-MGB 18.9 14.9 72.2 nd
E. coli
laboratory average count per 100 ml with
LTTC37 LTTC44 Colilert® CCA DP
Kiwa 20.7 18.2 14.5 nd nd
PWN 5.3 3.7 4.1 2.8 nd
Table 2 The number of samples positive or negative for total coliforms or E. coli with membrane filtration methods (mf; LSA37 and LTTC37 for total coliforms, LTTC37 and
LTTC44 for E. coli) or Colilert®.
total coliforms E. coli
mf positive mf negative mf positive mf negative
Colilert® positive 144 21 129 2
Colilert® negative 1 5 13 27
3.2
Comparing count results per laboratory
For each laboratory the count results inserted in Appendices 5-7 were used to compare the methods. In these data sets all results with a smaller than (<) sign were replaced by zero’s and all samples that had infinite counts (indicated by >) with one or more methods were
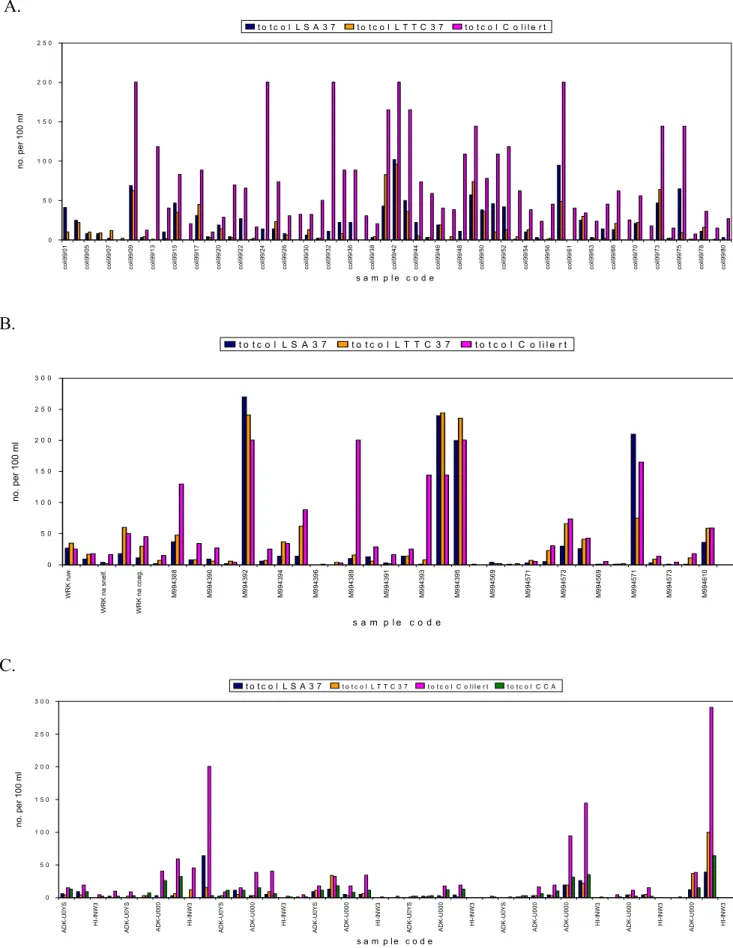
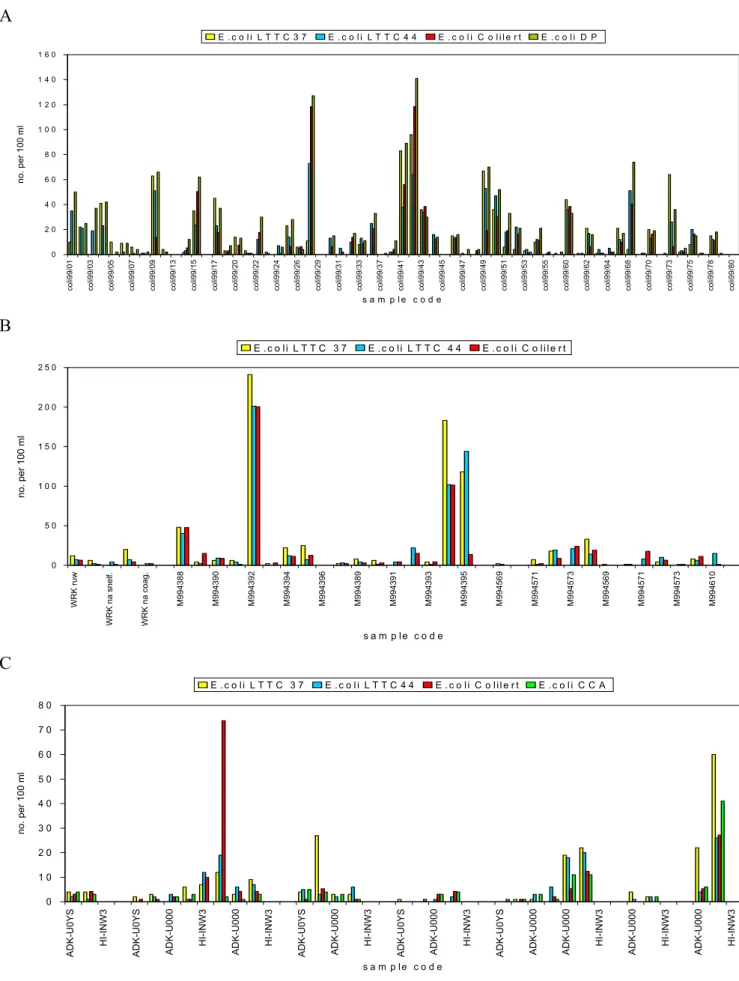
discarded. Results are displayed in simple bar charts with the sample code on the X-axis and the number of target organisms on the Y-axis to visualize trends in the performance of the methods. Bar charts of total coliform counts are displayed in Figure 3; they show that the membrane filtration methods (LTTC37, LSA37, CCA) give similar results and that the MPN method Colilert® gives higher counts, especially at RIVM-MGB; both at PWN and at Kiwa incidental peaks are observed. E. coli bar charts (Figure 4) show that there are no distinct differences between LTTC37, LTTC44, CCA and Colilert®, but that most DP data points are above the data points obtained with the other methods.
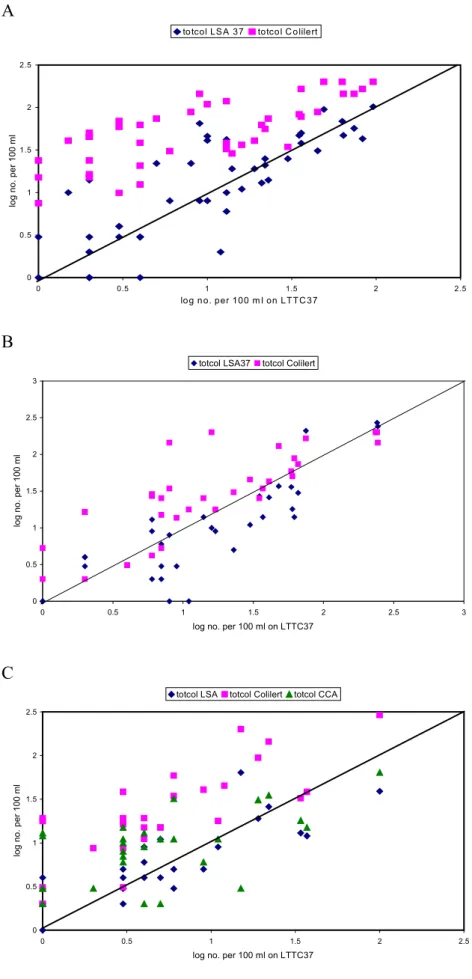
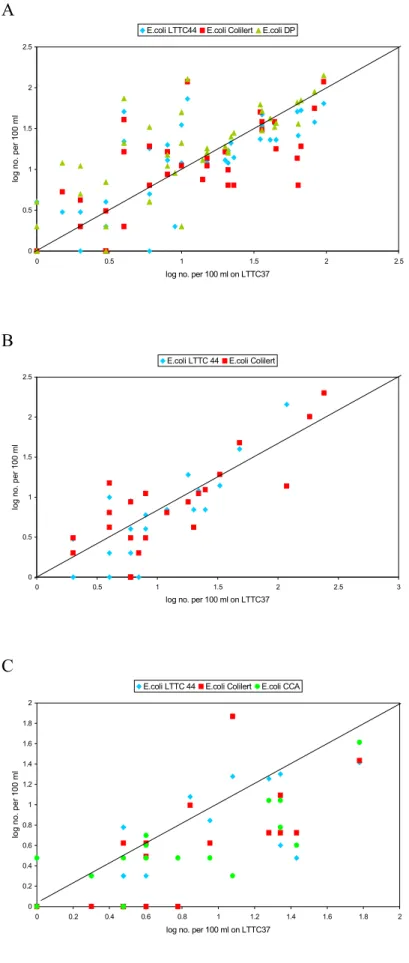
The results are also displayed in scatter charts with log transformed LTTC37 counts on the X-axis as reference method, log transformed counts obtained with the other methods on the Y-axis and a line of equality drawn in the chart. Figure 5 shows that LSA37 and LTTC37 perform almost similar, although LSA37 shows a tendency towards somewhat lower counts. For all three laboratories Colilert® counts are above the line of equality, indicating that they are higher than LTTC37 counts. Counts on CCA obtained by PWN vary and are sometimes higher, sometimes lower than LTTC37 counts. PWN appears to have highest E. coli counts with LTTC37, since most data points obtained with other methods appear below the line of equality (Figure 6C). Kiwa obtained comparable results with the methods they used (Figure 6B) and for RIVM-MGB again DP counts were higher (Figure 6A).
A. 0 5 0 1 0 0 1 5 0 2 0 0 2 5 0 col i99/ 01 col i99/ 05 col i99/ 07 col i99/ 09 col i99/ 13 col i99/ 15 col i99/ 17 col i99/ 20 col i99/ 22 col i99/ 24 col i99/ 26 col i99/ 30 col i99/ 32 col i99/ 36 col i99/ 38 col i99/ 42 col i99/ 44 col i99/ 46 col i99/ 48 col i99/ 50 col i99/ 52 col i99/ 54 col i99/ 56 col i99/ 61 col i99/ 63 col i99/ 66 col i99/ 70 col i99/ 73 col i99/ 75 col i99/ 78 col i99/ 80 s a m p l e c o d e no. per 100 ml t o t c o l L S A 3 7 t o t c o l L T T C 3 7 t o t c o l C o l i l e r t B. 0 5 0 1 0 0 1 5 0 2 0 0 2 5 0 3 0 0 WR K ru w W R K na snel f. W R K na coag. M 994388 M 994390 M 994392 M 994394 M 994396 M 994389 M 994391 M 994393 M 994395 M 994569 M 994571 M 994573 M 994569 M 994571 M 994573 M 994610 s a m p l e c o d e no. per 100 m l t o t c o l L S A 3 7 t o t c o l L T T C 3 7 t o t c o l C o l i l e r t C. 0 5 0 1 0 0 1 5 0 2 0 0 2 5 0 3 0 0 ADK-U0 YS HI -I NW 3 ADK-U0 YS ADK-U0 0 0 HI -I NW 3 ADK-U0 YS ADK-U0 0 0 HI -I NW 3 ADK-U0 YS ADK-U0 0 0 HI -I NW 3 ADK-U0 YS ADK-U0 0 0 HI -I NW 3 ADK-U0 YS ADK-U0 0 0 ADK-U0 0 0 HI -I NW 3 ADK-U0 0 0 HI -I NW 3 ADK-U0 0 0 HI -I NW 3 s a m p l e c o d e no. per 100 m l t o t c o l L S A 3 7 t o t c o l L T T C 3 7 t o t c o l C o l i l e r t t o t c o l C C A
Figure 3 The number of total coliforms (totcol) per 100 ml in water samples analysed with different methods by different laboratories (A=RIVM-MGB, B=Kiwa, C=PWN); LSA37 and LTTC37 counts are confirmed counts, Colilert® and CCA counts are not.
A 0 2 0 4 0 6 0 8 0 1 0 0 1 2 0 1 4 0 1 6 0 co li99/01 co li99/03 co li99/05 co li99/07 co li99/09 co li99/13 co li99/15 co li99/17 co li99/20 co li99/22 co li99/24 co li99/26 co li99/29 co li99/31 co li99/33 co li99/37 co li99/41 co li99/43 co li99/45 co li99/47 co li99/49 co li99/51 co li99/53 co li99/55 co li99/60 co li99/62 co li99/64 co li99/68 co li99/70 co li99/73 co li99/75 co li99/78 co li99/80 s a m p l e c o d e no. per 100 ml E . c o l i L T T C 3 7 E . c o l i L T T C 4 4 E . c o l i C o l i l e r t E . c o l i D P B 0 5 0 1 0 0 1 5 0 2 0 0 2 5 0 WR K r uw WRK na s nel f. WRK na c oag. M994388 M994390 M994392 M994394 M994396 M994389 M994391 M994393 M994395 M994569 M994571 M994573 M994569 M994571 M994573 M994610 s a m p le c o d e no. per 100 m l E . c o li L T T C 3 7 E . c o li L T T C 4 4 E . c o l i C o li le r t C 0 1 0 2 0 3 0 4 0 5 0 6 0 7 0 8 0
ADK-U0YS HI-INW3 ADK-U0YS ADK-U000 HI-INW3 ADK-U000 HI-INW3 ADK-U0YS ADK-U000 HI-INW3 ADK-U0YS ADK-U000 HI-INW3 ADK-U0YS ADK-U000 ADK-U000 HI-INW3 ADK-U000 HI-INW3 ADK-U000 HI-INW3
s a m p l e c o d e
no. per 100 ml
E . c o l i L T T C 3 7 E . c o l i L T T C 4 4 E . c o l i C o l i l e r t E . c o l i C C A
Figure 4 The number of E. coli per 100 ml in water samples analysed with different methods by different laboratories (A=RIVM-MGB, B=Kiwa, C=PWN); LTTC37,LTTC44 and CCA counts are confirmed counts, Colilert® counts are not.
A 0 0.5 1 1.5 2 2.5 0 0.5 1 1.5 2 2.5
log no. per 100 m l on LTTC 37
log no. per 100 ml
totcol LS A 37 totcol C olilert
B 0 0.5 1 1.5 2 2.5 3 0 0.5 1 1.5 2 2.5 3
log no. per 100 ml on LTTC37
log no. per 100 ml
totcol LSA37 totcol Colilert
C 0 0.5 1 1.5 2 2.5 0 0.5 1 1.5 2 2.5
log no. per 100 ml on LTTC37
log no. per 100 m
l
totcol LSA totcol Colilert totcol CCA
Figure 5 The number of total coliforms (totcol) in water samples enumerated by different laboratories with alternative methods (LSA37, Colilert®, CCA) compared to the reference method (LTTC37) (A=RIVM-MGB, B=Kiwa, C=PWN); LSA37 and LTTC37counts are confirmed counts, Colilert® and CCA counts are not.
A 0 0.5 1 1.5 2 2.5 0 0.5 1 1.5 2 2.5
log no. per 100 ml on LTTC37
log no. per
100 ml
E.coli LTTC44 E.coli Colilert E.coli DP
B 0 0.5 1 1.5 2 2.5 0 0.5 1 1.5 2 2.5 3
log no. per 100 ml on LTTC37
log no.
per 100 m
l
E.coli LTTC 44 E.coli Colilert
C 0 0.2 0.4 0.6 0.8 1 1.2 1.4 1.6 1.8 2 0 0.2 0.4 0.6 0.8 1 1.2 1.4 1.6 1.8 2
log no. per 100 ml on LTTC37
log no. per
100 ml
E.coli LTTC 44 E.coli Colilert E.coli CCA
Figure 6 The number of E. coli in water samples enumerated by different laboratories with
alternative methods (LTTC44, Colilert®, DP, CCA) compared to the reference
method (LTTC37) (A=RIVM-MGB, B=Kiwa, C=PWN); LTTC3 , LTTC44 and CCA
3.3 Confirmation
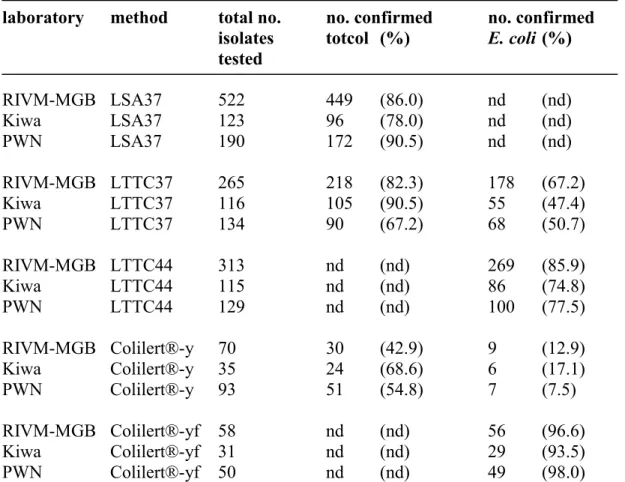
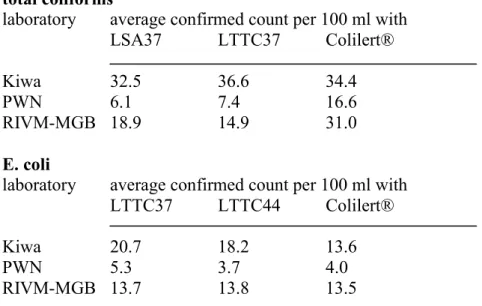
The results of the confirmation tests that were performed on isolates obtained with the different methods by the participating laboratories are summarized in Table 3. The average confirmation percentage of characteristic yellow colonies on LSA37 is about 85 %. A comparable percentage of characteristic colonies from LTTC37 (average 80 %) could be confirmed as total coliforms, whereas, as expected since they are a part of the coliform population, a lower percentage (average 55 %) could be confirmed as E. coli. The fraction of the characteristic colonies that was confirmed as E. coli increased to an average of 79 % when LTTC was incubated at 44 °C (LTTC44). Confirmation percentages of yellow Colilert® wells (average 55 %) are below the total coliform confirmation percentages obtained with the other methods and from some yellow but non-fluorescent wells (average 12.5 %) E.coli was isolated, indicating the occurrence of false negative E. coli results. In 96 % of the Colilert® wells that showed yellow coloration and fluorescence, E. coli was found. The average total coliform and E. coli counts that were generated per laboratory and per method (Table 1), were corrected for the results of the additional confirmation and multiplied with the confirmation rates per laboratory and per method (Table 3). Results are shown in Table 4.
Table 3 Results of confirmation tests: the number and percentage of isolates that was confirmed as total coliforms (totcol) and E. coli calculated per method and per laboratory
laboratory method total no. no. confirmed no. confirmed isolates totcol (%) E. coli (%) tested RIVM-MGB LSA37 522 449 (86.0) nd (nd) Kiwa LSA37 123 96 (78.0) nd (nd) PWN LSA37 190 172 (90.5) nd (nd) RIVM-MGB LTTC37 265 218 (82.3) 178 (67.2) Kiwa LTTC37 116 105 (90.5) 55 (47.4) PWN LTTC37 134 90 (67.2) 68 (50.7) RIVM-MGB LTTC44 313 nd (nd) 269 (85.9) Kiwa LTTC44 115 nd (nd) 86 (74.8) PWN LTTC44 129 nd (nd) 100 (77.5) RIVM-MGB Colilert®-y 70 30 (42.9) 9 (12.9) Kiwa Colilert®-y 35 24 (68.6) 6 (17.1) PWN Colilert®-y 93 51 (54.8) 7 (7.5) RIVM-MGB Colilert®-yf 58 nd (nd) 56 (96.6) Kiwa Colilert®-yf 31 nd (nd) 29 (93.5) PWN Colilert®-yf 50 nd (nd) 49 (98.0)
Table 4 Average counts, corrected for additional confirmation of total coliforms and E. coli in a set of samples, calculated for each laboratory and per method used.
total coliforms
laboratory average confirmed count per 100 ml with
LSA37 LTTC37 Colilert®
Kiwa 32.5 36.6 34.4
PWN 6.1 7.4 16.6
RIVM-MGB 18.9 14.9 31.0
E. coli
laboratory average confirmed count per 100 ml with
LTTC37 LTTC44 Colilert®
Kiwa 20.7 18.2 13.6
PWN 5.3 3.7 4.0
RIVM-MGB 13.7 13.8 13.5
3.4 Practical aspects of methods
The methods that were used in this trial differed in their practical application. The participating laboratories use the LSA37 method routinely and found it easy to perform. Some disturbing background growth of small pink colonies was however reported, especially when surface water samples with higher contamination levels were analysed. The E. coli DP method and the CCA method were easy to perform and gave direct and clear results.
All participants reported heavy background growth on membrane filters that were incubated on LTTC at 37 °C. Background growth was reported as the percentage of the membrane filter surface that was covered with background flora. Four categories were defined: less than 10 %, 10-50 %, 50-100 % and 100 % coverage. The results are summarized in Table 5. In 85 % (132/155) of the samples tested, 50-100 % of the membrane filter surface was covered with orange to brown colonies, amongst which the counting of the characteristic yellow colonies was extremely difficult. Incubation of membrane filters on LTCC at (44 ± 0.5) °C slightly improved this lack of selectivity, but in 52 % (80/155) of the samples the membrane filter surface was still covered with disturbing background flora. The photographs in Figure 7 illustrate the above. Characteristic colonies being oxidase positive were regularly observed on LTTC incubated at (36 ± 2) °C. Kiwa confirmed these oxidase positive colonies as Aeromonas. Colilert®, as the only MPN method included in the test, was found very convenient: analysing of samples and reading of results was easy.
Table 5 Background growth on membrane filters incubated on LTTC, incubated at (36 ± 2) °C (37 °) and at (44 ± 0.5) °C (44 °), indicated as the percentage coverage of the membrane filter surface
laboratory no. tested no. of samples with % coverage of membrane filter surface
<10 10-50 50-100 100
37 ° 44 ° 37 ° 44 ° 37 ° 44 ° 37 ° 44 °
RIVM-MGB 72 0 16 18 24 39 26 15 6
Kiwa 35 2 23 3 12 24 0 6 0
A
B
Figure 7 Membrane filter incubated on LTTC at (36 ± 2) °C (A) and membrane filter of the same sample incubated on LTTC at (44 ± 0.5) °C (B); yellow colonies are characteristic.
4.
Discussion
All participating laboratories enumerated much higher numbers of total coliforms with Colilert® than with LSA37 and LTTC37; differences were significant (P<0.05). Differences in counts obtained with these membrane filtration methods and Colilert® can be explained from the different substrates that are used, resulting in the detection of two different groups of coliform bacteria. Coliforms growing on lactose-containing agar media, need two enzymes to ferment lactose: b-galactoside-permease, for active transport of lactose into the bacterial cells and b-galactosidase, to use lactose, resulting in the production of acid and gas. The genes that code for these enzymes are lacY and lacZ, respectively. Coliforms that lack lacY do not form characteristic yellow colonies on lactose-containing agar media, unless lactose is present in extremely high concentrations. When lacZ is however present, the Colilert® substrate ortho-nitrofenyl-b-a-galactopyranoside (ONPG) can be used. Coliforms that have both genes can use lactose and ONPG.
From our results it is clear that a larger population of bacteria contains only the lacZ gene resulting in higher counts with Colilert®. Fricker et al. (1997) also reported the occurrence of non-lactosefermenting coliforms: approximately 10 % of the coliforms they isolated from potable source water did not ferment lactose due to lack of β-galactosidepermease. The Chromocult® method is based on the same detection principle as Colilert®, but CCA counts were however significantly (P<0.05) lower than Colilert® counts. This might be due to a different resuscitation capacity of liquid media (Colilert®) and solid agar media (CCA). CCA total coliform counts were higher (P<0.05) than LSA37 counts, but were equal to LTTC37 counts (P>0.05).
Total coliform counts on LSA37 were significantly (P<0.05) lower than total coliform counts on LTTC37. Confirmation percentages of these membrane filtration methods were
comparable: LSA37 85 % and LTTC37 80 %. The presence of disturbing background growth is experienced as a serious drawback of the LTTC37 method. Presence of some disturbing background growth (small pink colonies) on LSA37 was reported, particularly when highly contaminated surface water samples were analysed, but this was not considered a major problem and no attempt was made to quantify the proportion of background growth. The abundance of organisms other than the target organisms on LTTC37 reduces readability of the membrane filters and makes it almost impossible to use the criterium that is stated in ISO 9308-1: ”… count as lactose-positive bacteria all typical colonies irrespective of size which show a yellow color development in the medium under the membrane.”. With so many other organisms present, the medium under the membrane filters is almost completely yellow. In this way counts are less accurate and can only be properly made when only a few target organisms are present and the amount of background growth is equally reduced. We noticed that heavy background growth appeared in surface water with higher total coliform
contamination levels (most RIVM-MGB samples, some PWN samples), but that it could also be abundant in samples with rather low total coliform contamination levels (most Kiwa samples, some PWN samples). Incubation of LTTC at 44 °C slightly reduced the amount of background growth, but a different type of background bacteria, the so called ‘spreaders’
(usually members of the genus Bacillus) appeared. There were low numbers of these bacteria present, but they spread along the membrane filters and hindered the counting of the target organisms. Incubation of membrane filters on LTTC at 44 °C also suppresses the growth of some of the members of the total coliform group and results in the detection of fecal
coliforms in stead of total coliforms. Incubation at 44 °C did not alter the E. coli count results in the analysed samples.
Confirmation of isolates from yellow (total coliform positive) Colilert® wells showed that only 55 % (range 43 – 69 %) of the isolates were total coliforms, when total coliforms were defined as lactosefermenting organisms. The confirmation procedure that was followed, included direct streaking of material from yellow Colilert® wells on MacConkey agar in which lactose is present. In quite a few cases this direct streaking on MacConkey agar resulted in no or very poor growth due to the lack of the lacY gene in a part of the isolates from Colilert®, resulting in a low confirmation rate. As Colilert® and the tested membrane filtration methods enumerated different groups of coliform bacteria, counts obtained with these methods can only be fairly compared when results are confirmed and the criteria used to define the group of bacteria called ‘total coliforms’are identical. In an attempt to get an indication, the average total coliform and E. coli counts were corrected for the obtained confirmation rates. These calculations suggest that a larger number of lactose fermenting total coliforms is detected with Colilert® than with LSA37 and LTTC37.
LTTC37, LTTC44 and DP enumerated significantly (P<0.05) more E. coli than Colilert® and CCA. Colilert® and CCA performed similar (P>0.05). A high percentage false negative E.
coli results was found with Colilert®: from 12,5 % (range 7,5-17,1 %) of wells that were
positive for total coliforms but negative for E. coli, i.e. showing yellow coloration but no fluorescence, E. coli was isolated. The lower counts with Colilert® and CCA, which include 4-methylumbelliferyl-b-D-glucuronide (MUG) as a substrate for the enzyme b-glucuronidase for E. coli detection, and the high percentage false negative results with Colilert® in this study show that testing water samples for b-glucuronidase activity will underestimate the number of E. coli present in a sample. Present results confirm results from previous research (Schets and Havelaar, 1991) in which 14 % (range 4-26 %) of isolated E. coli strains was found b-glucuronidase negative at 44 °C. A fraction of these isolates was b-glucuronidase positive at 37 °C. An indole test will give a more reliable count of the number E. coli in samples, since only 2-4 % of E. coli strains are indole negative (Schets and Havelaar, 1991; Schets et al., 1993). The E. coli DP method is based on testing for indole production and includes a resuscitation step on a non-selective medium (Havelaar and During, 1988). In this study the method was used by RIVM-MGB only and gave higher counts than all other methods used by RIVM-MGB, differences were significant (P<0.05) for LTTC44 and Colilert®, but not for LTTC37.
5.
Conclusions
· Membrane filtration methods based on transport and use of lactose used in this study (LTTC37 and LSA37) have similar true positive rates for total coliforms, but total coliform counts on LSA37 are significantly lower than on LTTC37.
· Due to lack of selectivity, LTTC37 is however suitable for monitoring of very clean (drinking) water samples only.
· Colilert® and CCA enumerate a different group of coliform bacteria than the other methods used; counts can only be fairly compared when results are confirmed and the criteria used to define the group of bacteria called 'total coliforms' are identical. · For enumeration of ONPG positive total coliforms Colilert® might be a suitable
alternative for membrane filtration methods.
· For enumeration of E. coli, the DP method (or Rapid Test in ISO/FDIS 9308-1) appeared to be most suitable, although the method was only used by one laboratory in this study;
6.
Recommendations
For enumeration of total coliforms, drinking water companies can use the EU reference method on LTTC agar, but due to its lack of selectivity this method can only be used for monitoring of very clean drinking water samples. This forces the water companies to have a second method for enumeration of total coliforms operable, for analysis of e.g. surface water samples, drinking water half products or repair samples. The LSA method, extensively used in the Netherlands, is more selective than the LTTC method and can therefore be used for analysis of water samples with various contamination levels, ranging from surface water to drinking water. Some disturbing background growth may however occur when certain surface water samples are analysed. The elevated selectivity of LSA results in lower total coliform counts.
Colilert® can be used as alternative for the above mentioned membrane filtration methods: it is a convenient method, giving final results within 18 h and can be used for analysis of all water types. It should be borne in mind that this method enumerates a broader group of coliform bacteria than the membrane filtration methods, resulting in higher counts.
When a drinking water sample is found positive for total coliforms with either LTTC, LSA or Colilert®, subculturing for E. coli should be performed; for Colilert® this should be done regardless of the presence of fluorescence in wells. Colilert® is considered less suitable for direct detection of E. coli because of the occurrence of a high percentage false negative results due to the inability of a fraction of the E. coli population to use the substrate incorporated in Colilert® for E. coli detection. Resulting form the present study, the DP method is the most suitable method for detection and enumeration of E. coli: it is easy to perform and detected more E. coli than the other methods.
Acknowledgements
References
AnonymousBacteriologisch onderzoek van water - Kwantificeren van bacteriën van de coligroep met behulp van membraanfiltratie (NEN 6571)
Nederlands Normalisatie Instituut, Delft, The Netherlands, 1982 Anonymous
Bacteriologisch onderzoek van water – Monsterneming en conservering (NEN 6559) Nederlands Normalisatie Instituut, Delft, The Netherlands, 1992
Anonymous
Council Directive 98/83/EC on the quality of water intended for human consumption Official Journal of the European Communities, Brussels, Belgium, 1998
Anonymous
Water Quality Detection and enumeration of Escherichia coli and total coliform bacteria -Part 1: Membrane filtration method (ISO 9308-1)
International Organisation for Standardisation, Geneva, Switzerland, 2000 Fricker EJ, Illingworth KS, Fricker CR
Use of two formulations of colilert and quantitray™ for assessment of the bacteriological quality of water
Wat Res 1997; 31: 2495-2499 Havelaar AH, During M
Evaluation of the Anderson Baird-Parker direct plating method for enumeration of
Escherichia coli in water
J Appl Bact 1988; 64: 89-98 Schets FM, Havelaar AH
Comparison of indole production and β-glucuronidase activity for the detection of
Escherichia coli in a membrane filtration method
Lett Appl Bact 1991; 13: 272-274 Schets FM, Medema GJ, Havelaar AH
Comparison of Colilert with Dutch standard enumeration methods for Escherichia coli and total coliforms in water
Appendix 1 A draft protocol for comparison of the EU reference method for coliforms and E.coli with alternative culture methods
Introduction
The European Drinking Water Directive (1998) defines a reference method for the estimation of the concentration of coliforms and E.coli in drinking water. Whilst it is not mandatory that member states use this method, there is an obligation to demonstrate that any alternative method which is to be used has a similar performance. The exact nature of the similarity is not defined, nor is the methodology to be used for comparison of methods. It is generally accepted however, that alternative methods should have a performance which is equivalent or better. In this context, “equivalent or better” must be defined. A method is normally
considered to be “equivalent” if the recovery of target organisms is not significantly lower than the reference method. However, “significantly lower” also requires definition and for the purposes of comparisons such as this, a definition of overall not significantly lower than 10% of the reference method is suitable.
In addition to testing the recovery of organisms using the two test methods, the number of false positive results should be determined. This can done by estimating the true positive rate of the methods. Since the EU reference method does not require that colonies be
“confirmed” all colonies which fulfil the criteria described in the method should be counted. In order to determine the true positive rate, all colonies should be confirmed using an
appropriate methodology. However, this is not feasible for a study of this size and therefore a compromise must be used. In this case, it is reasonable for each laboratory to “confirm” the identity of one hundred colonies selected at random from a range of water types. Any positive results which do not confirm by traditional methodologies should be sent to single reference laboratory (in this case Thames Water) for accurate identification. In addition to the 100 colonies identified from the EU reference method, 100 positive wells from Colilert should be examined. This can be done using the protocol given below.
Tests to be performed by individual laboratories
Each laboratory or group of laboratories, will perform a minimum of 200 tests in total. These will be split into two phases. In phase one, a minimum of five and a maximum of ten sites will be selected which will give 10-50 colonies of coliforms per 100 ml. A total of 150 samples from this type of source should be examined, with the samples being spread evenly over the different sites. The type of water sample should be chosen according to the type of sample normally examined by individual laboratories. For example, laboratories whose normal samples are from surface water treatment plants which receive disinfection, then sewage effluent disinfected with chlorine should be used to generate the samples, according to the protocol given below. Laboratories who examine samples of water which receives no disinfection should use contaminated groundwater or good quality surface water for this phase of the study.
Results should be reported on the forms given in this document. The site, type of sample, date of analysis, and results should be presented as shown in the example.
For the second phase of the study, samples should be selected to give results in the range 1-10 coliforms per 100 ml. All results should be reported, even where the result is zero. A
minimum of 30 samples where at least one organism is recovered by one or other method or both should be reported.
In reporting results, no attempt should be made to correct the results in view of the findings of confirmation tests, unless the method being compared specifically states that results should be confirmed. In this trial of Colilert and the EU reference method, neither method requires confirmation. When the results are analysed, account will be taken of the true results obtained by examination of the 100 organisms identified as described above.
Samples
Samples should be taken into bottles of no less than 500 ml. Aliquots (100 ml) should be used for each of the three tests, i.e. Colilert, membrane filtration for coliforms and membrane filtration E.coli. Each aliquot must be taken from the same bottle. On no account must subsamples be taken from different bottles. Samples must be adequately mixed by repeated inversion of the sample bottle.
Disinfection of sewage effluent
Disinfected sewage effluent has been used in several studies to good effect to determine the efficiency of different methods for recovering coliforms and E.coli. The protocol uses “good quality” sewage effluents i.e. with suspended solids of less than 30 mg per litre.
The method for producing samples from sewage effluent is as follows: Day 1
1. Fill a 10 litre container with tap water warm to 37oC for two hours and then place at 4oC overnight.
Day 2
2. Select a good quality sewage effluent (one litre) and allow to stand for 2 hours to allow large particulates to sediment.
3. Carefully pour off 500 ml of effluent into a clean container.
4. Add the 500 ml of sewage effluent to the tap water, mix by shaking and place on a magnetic stirrer.
5. Prepare a solution of chlorine using chlorine generating tablets (Instachlor, Palintest) containing in total 10-15 mg of chlorine.
6. Add the chlorine solution to the diluted sewage effluent. 7. Allow to mix for 5 minutes.
8. Take one litre samples of the chlorinated effluent into sterile bottles containing 5 ml of 18% sodium thiosulphate solution at one minute intervals (i.e. 5-14 minutes contact time) and mix thoroughly.
9. Examine 100 ml of the chlorinated sewage effluent from each time point using Colilert 18 and the Colilert 2000 QuantiTrays.
10. Store all chlorinated samples at 4oC overnight. Day 3
12. Select samples which give 15-70 coliforms per 100 ml. These can be used directly to compare the methods and duplicate samples can be analysed.
13. Select samples which yield 150-700 coliforms per 100 ml.
14. These can be diluted 1:10 in de-chlorinated water to yield one litre samples. Tap water can be de-chlorinated by adding 5 ml of 18% sodium thiosulphate to 900 ml of water. Five replicate one litre samples can be prepared from each sample which yielded 150-700 coliforms. These samples can each be used to compare the methods and samples from each bottle can be analysed in duplicate.
15. Analyse samples using EU reference method to be incubated for recovery of total and faecal coliforms (i.e. incubate one membrane at 37oC and 44oC) and the Colilert 18 method.
16. Incubate samples at appropriate temperatures for the relevant time.
17. Examine samples after incubation and record the count from each sample on the Results Sheet.
18. Organisms can be selected at this stage for determination of the “True Positive Rate” for each method according to the protocol given below.
Protocol for determining the “True Positive Rate”
To determine the “True Positive Rate” 100 organisms from each test will be identified. For methods which produce colonies these must be selected at random from a variety of sites. Selecting colonies at random is essential and no attempt to should be made to select colonies on the basis of whether they are “typical” or “atypical”. For Colilert, select one hundred wells which are yellow with no fluorescence and one hundred which are yellow and fluorescent.
1. Colonies from membranes
i. Select a well isolated colony and streak out onto nutrient agar, incubate overnight at 37oC ii. After incubation, inoculate a single colony into lactose peptone water and incubate at 37oC
for 48 hours and record the result. For membranes intended to detect faecal coliforms, inoculate a single colony into lactose peptone water and tryptone water and incubate at 44oC for 24 hours. Test the tryptone water for indole production using Kovacs reagent and record the result. Record the result from the lactose peptone water.
iii. Test the growth from the nutrient agar plate for cytochrome oxidase production and record the result
2. For Colilert samples
i. Select wells showing yellow colour or yellow colour plus fluorescence as appropriate. ii. Puncture the back of the well with a sterile hypodermic needle or sterile pipette tip and
withdraw a small volume (approximately 10 ml ) of liquid.
iii. Inoculate the liquid on to a MacConkey agar plate and streak out for single colonies. Incubate plates from fluorescing wells at 44oC and those from wells which are yellow only at 37oC overnight.
iv. Select a well isolated lactose fermenting colony. Isolates from fluorescing wells should be inoculated into lactose peptone water and tryptone water for incubation at 44oC as
described above. Isolates from yellow only wells should be inoculated into lactose peptone water and incubated at 37oC for 48 hours and onto a nutrient agar plate for examination for cytochrome oxidase.
v. Results should be recorded on the appropriate sheet. Quality Assurance
It is essential that all laboratories taking part in this study must have appropriate quality control systems in place. Some specific quality control points are listed below in relation to the use of the EU reference medium. It is also beneficial if laboratories can provide results from an external quality assurance scheme.
Incubators
All incubators to be used in this study must be monitored daily to ensure compliance with the target temperature. The temperature required is ±1 degree C of the target temperature or as specified within the specific method (i.e. the Colilert package insert and the EU reference method).
Media
Culture media should be made and stored in accordance with the manufacturers instructions. With regard to the EU reference media, all media should be used within seven working days of preparation.
A quality control procedure, based on that used by Institut Pasteur, Lille is provided. This must be used with every batch of media produced.
Protocol for quality control of media I / Field of application
This protocol describes the quality controls to be performed on each production batch of media used in microbiology laboratories.
The sensitivity, pH, selectivity and/or performance are studied (performance of a positive strain comparing to a reference medium and non selective medium, selection characteristics of a positive strain for confirmation media).
II / Definitions
2.1/ Batch : a batch is a group of containers, tubes or flasks, containing medium, coming from the same production lot, in other words a « series » in the case of media prepared with an automatic preparator.
2.2/ Sterility : absence of any culture at the temperature and timing normally used for the medium studied.
III/ Control
3.1/Presumptive media
3.1.1/ general principle
Take :
· 1% of the production (at different stages of production, with a minimum of 3) to control the pH,
· 1% of the production (at different stages of production, with a minimum of 3) to control the sterility,
· 1% of the production (at different stages of production, with a minimum of 3) to control the performance of a positive control
· 2 samples for the negative control (at the beginning and at the end of the production), so in total 3% of the production and 2 samples.
To control the pH, a pH-meter is used. The mean of measurements must be calculated. The pH should fall within the limits set by the manufacturer. If this is not the case, then the media must be rejected.
The negative control (a strain of Aeromonas) must not grow on both plates or must not be/look like the target strains identified on the media.
To test the performance of the medium, a reference strain should be examined on the “reference medium” and on nutrient agar. The recovery on the reference medium should be between 55 and 120% of that found on the nutrient agar. For this purpose, lenticules will be supplied. These should be rehydrated in 500 ml of sterile distilled water. Four membrane filters are then used to concentrate 100 ml of the material and two incubated on nutrient agar (one at 37oC and the other at 44oC) and two on the reference medium (one at 37oC and the other at 44oC). Colonies are then counted after incubation and the results recorded.
If results do not demonstrate that the medie are equivalent in performance then a second set of controls should be run. If these do not give acceptable results then the batch of medium should be discarded.
3.2/ Confirmation media
3.2.1/ general principle
Take :
· 1% of the production (at different stages of production, with a minimum of 3) to control the pH,
· 1% of the production (at different stages of production, with a minimum of 3) to control the sterility,
· 1% of the production (at different stages of production, with a minimum of 3) to control the performance of a positive control
so in total 3% of the production
This applies to tryptone water and lactose peptone water.
To control the pH, a pH-meter is used. The results must fall within the range specified by the media manufacturer.
The sterility is controlled with plates or tubes, incubated at the specified temperature and the timing normally used for the medium. No growth in all samples is the only acceptable result. Each medium is incubated with a strain of E.coli and a strain of Aeromonas spp. To ensure correct performance. The E.coli strain should ferment lactose at both 37 and 44oC and produce indole from tryptophane at 44oC. The strain of Aeromonas should give negative results in all tests.
Results are reported in the file of results. If results do not meet fixed criteria of quality, a new control is done. If the second control gives the same results, the batch is discarded a new batch is made.
3.3/ Nutrient agar
At each production, we take 1% of the production (at different stages with a minimum of 3 flasks) to control the sterility, the pH and the performance.
For each flask, prepare 2 boxes (1 for the control of the sterility and 1 for the pH). Keep the rest at 50°C to control the performance.
To control the sterility, put the plates at 20°C. No growth after an incubation of 72 hours. To control the pH, a pH-meter is used. The mean must be within the limits specified by the manufacturer.
If results do not follow the fixed criteria of quality, a new control is done. If the second control gives the same results, the batch is refused and a new production is made.
Quality Control samples
On each day that analyses are being performed, a lenticule should be added to 500 ml of sterile deionised water. After appropriate mixing, samples should be analysed by membrane filtration and incubated on tergitol TTC medium at 37 and 44oC and on nutrient agar at 37 and 44oC. Counts should be recorded and sent in with the other analytical results.
Appendix 2 Short description of sample sites
sample code sample site sample type and dilution
coli99/01, /09, /17, /25, /33, /41, /49, /57, /65, /73
De Oude Pol – Nunspeet surface water, 10 x in PS coli99/02, /10, /18, /26, /34, /42, /50, /58, /66, /74 Strand Horst – Harderwijk surface water, 10 x in PS coli99/03, /11, /19, /27, /35, /43, /51,
/59, /67, /75 Salmsteke – Lopik surface water, 10 x in PS
coli99/04, /12, /20, /28, /36, /44, /52,
/60, /68, /76 River Lek – Vianen surface water, 10 x in PS
coli99/05, /13, /21, /29, /37, /45, /53, /61, /69, /77 Maarseveenseplassen – Molenpolder surface water, 10 x in PS coli99/06, /14, /22, /30, /38, /46, /54, /62, /70, /78
De Strook – Tienhoven surface water, 10 x in PS coli99/07, /15, /23, /31, /39, /47, /55, /63, /71, /79 De Wijde Blik – Kortenhoef surface water, 10 x in PS coli99/08, /16, /24, /32, /40, /48, /56, /64, /72, /80 Vinkeveenseplassen – Vinkeveen surface water, 10 x in PS
WRK ruw WRK Nieuwegein surface water
WRK coag, M994391, M994572 WRK Nieuwegein drinking water proces, after coagulation
WRK snelf WRK Nieuwegein drinking water proces, after
rapid filtration M994388, M994390, M994392,
M994571, M994573, M994574
not specified surface water, after reservoir storage M994389, M994393, M994369,
M994570,
not specified drinking water proces, after filtration
M994394, M994395 not specified artificial contaminated
drinking water
M994610, M994611 pilotplant after filtration
AUOY1 Lake IJsselmeer surface water, 10 x in DW
AUOY2 Lake IJsselmeer surface water, 10 x in DW
AUOY3 Lake IJsselmeer surface water
AUOY4 Lake IJsselmeer surface water, after 1 week
storage at 4°C
AUOO1 Lake IJsselmeer raw water, 10 x in DW
AUOO2 Lake IJsselmeer surface water, 10 x in DW
AUOO3 Lake IJsselmeer raw water
AUOO4 Lake IJsselmeer raw water, after 1 week
storage at 4°C
HI-INW1 WRK Andijk surface water
HI-INW2 WRK Andijk surface water, after 1 week
storage at 4°C