Valuing the benefits of environmental policy: the Netherlands | RIVM
194
0
0
Hele tekst
(2) page 2 of 194. EFTEC/RIVM report 481505 024. Abstract This study seeks to set priorities for environmental policy in the Netherlands. The report focuses on seven environmental issues including: climate change, acidification, low level ozone, particulate matter, noise, eutrophication and land contamination. These issues are prioritised using three different approaches: damage assessment, public opinion and ‘disability adjusted life years’(DALYs). The damage assessment approach largely follows that of the European Commission DG Environment study ‘European Environmental Priorities: an integrated economic and environmental assessment’ (RIVM et al, forthcoming 2001). It is based on a logical stepwise progression through emission, change in exposure, quantification of impacts using exposure-response functions, to valuation based on willingness to pay. The existence of significant uncertainty in assessment of environmental damage is dealt with by conducting a transparent sensitivity analysis for each issue, this demonstrates the consequences of uncertainty on the robustness of our conclusions. The public opinion approach makes use of European and national surveys to determine the importance of environmental issues as perceived by the population of the Netherlands. The DALY methodology largely follows that of Murray and Lopez (1996). This procedure combines years of life lost and years lived with disease or disability that are weighted according to severity. According to the damage assessment approach the priorities, in terms of potential benefits from full control, are low level ozone, land contamination and particulate matter, followed by acidification and climate change, whilst noise and eutrophication are estimated to yield the lowest potential benefits from control. However, in the absence of cost estimates no conclusions can be reached on the desirability of control measures. Public opinion surveys show that environmental issues other than the seven considered in this study are a major concern for the Dutch public, namely chemical release and oil pollution. However, focusing on the seven issues considered in this study, the Dutch public rank, climate change, acidification, eutrophication and air pollution from cars (interpreted as low-level ozone and PM10) as the issues of most concern. According to the DALYs approach the health effects of air pollution from particulate matter, and to a certain degree from low level ozone, dominate the disease burden. The future disease burden is largely due to changes in the population structure, i.e. an increasing, aged population. Another environmental problem associated with a high disease burden is noise exposure from road and air traffic. Based on a simple ‘Borda count’, a final ranking for the environmental issues is made. This study concludes that land contamination, climate change and particulate matter are top priority environmental issues in the Netherlands, followed by acidification, low level ozone, eutrophication and finally noise. These findings suggest that future policies focusing on the top issues may yield considerable benefit depending on their cost of control. Although ranking environmental issues is useful in the sense of highlighting priority issues and indicating if there is any surprise environmental issues for the Netherlands. It is important to note that the benefit estimates offer only some guidance on environmental priorities, in the absence of data on costs of implementing policies only part of the picture necessary for establishing priorities is provided. For a full-scale economic analysis benefit estimates need to be compared with cost estimates within a CBA framework. This is outside the scope of this study, however a separate paper on the issues relating to and experience with such CBAs is presented in Annex II..
(3) EFTEC/RIVM report 481505 024. page 3 of 194. Preface This study has been written by a multi-disciplinary team composed of environmental economists from Economics for the Environment (EFTEC) and scientist, economists and modellers at National Institute of Public Health and the Environment (RIVM) for the Ministry of Economic Affairs, the Netherlands, in May 2000. The Ministry of Economic Affairs’ aim, to further examine the potential benefit estimates as a guiding tool in environmental policy, was the basis for commissioning this study. The main report is an assessment of the environmental damage due to seven environmental issues in the Netherlands. Damage estimates can be interpreted as benefit estimates of environmental control and can be used as a tool to facilitate an environmental priority scheme for the Netherlands. Annex II presents a paper, written by Professor David Pearce, that examines the role of cost-benefit analysis in efficient decision-making. The assessment in the main report is new and refreshing for the Netherlands and indeed improves understanding of the potential of benefit estimates as a guiding tool in environmental policy.. Bilthoven, March 2001..
(4) page 4 of 194. EFTEC/RIVM report 481505 024.
(5) EFTEC/RIVM report 481505 024. page 5 of 194. Contents Samenvatting. 9. Summary. 16. 1.. Background to and scope of the study. 23. 2.. Structure of the report. 25. 3.. Methodology for setting priorities in environmental policy. 27. 4.. 3.1. Introduction. 27. 3.2. Overview of methodologies for setting priorities in environmental policy. 27. 3.3. Monetary damage estimation methodology. 28. 3.4. Public opinion methodology. 35. 3.5. Disability adjusted life years’ (DALYs). 36. Application of damage assessment methodology. 37. 4.1 Climate change 4.1.1 The issue 4.1.2 Source of emissions 4.1.3 Physical measure of impacts 4.1.4 Monetary measure of impact 4.1.5 Aggregate monetary damage estimate 4.1.6 Uncertainty. 38 38 38 38 40 46 48. 4.2 Acidification 4.2.1 The issue 4.2.2 Source of emissions 4.2.3 Physical measure of impacts 4.2.4 Monetary measure of impact 4.2.5 Aggregate monetary damage estimate 4.2.6 Uncertainty. 53 53 53 53 55 57 58. 4.3 Noise 4.3.1 The issue 4.3.2 Source of emissions 4.3.3 Physical measure of impacts 4.3.4 Monetary measure of impacts 4.3.5 Aggregate monetary damage estimate 4.3.6 Uncertainty. 65 65 65 65 67 71 77. 4.4 Land contamination 4.4.1 The issue 4.4.2 Source of emissions 4.4.3 Physical measure of impacts 4.4.4 Aggregate monetary damage estimate 4.4.5 Uncertainty. 80 80 80 80 81 83. 4.5 Particulate matter 4.5.1 The issue 4.5.2 Source of emissions 4.5.3 Physical measure of impacts. 85 85 85 85.
(6) page 6 of 194. 4.5.4 4.5.5. EFTEC/RIVM report 481505 024. Monetary measure of impact Uncertainty. 86 87. 4.6 Eutrophication 4.6.1 The issue 4.6.2 Source of emissions 4.6.3 Physical measure of impacts 4.6.4 Monetary measure of impacts 4.6.5 Aggregate monetary damage estimate 4.6.6 Uncertainty. 90 90 90 90 91 94 94. 4.7 Low level ozone 4.7.1 The Issue 4.7.2 Source of emissions 4.7.3 Physical measure of impacts 4.7.4 Monetary measure of impacts 4.7.5 Aggregate monetary damage estimate 4.7.6 Uncertainty. 96 96 96 96 98 99 100. 4.8 Damage assessment and priority issues 4.8.1 Ranking environmental issues according to damage estimates 4.8.2 Burden of disease associated with selected environmental exposures. 107 107 109. 5.. Public opinion in the Netherlands. 115. 5.1. Environmental issues in general. 115. 5.2. Global environmental issues. 115. 5.3. National environmental issues. 116. 5.4. Attitudes towards the future. 117. 5.5. Environmental protection action- who is responsible?. 117. 6.. Prioritisation of environmental issues. References Annex I. 119 123. Methodology and assumptions. 133. 1.. Monetary valuation techniques. 133. 2.. Benefits transfer. 139. 3.. Valuing the risk of premature mortality. 143. 4.. Monetary valuation of morbidity effects. 149. 5.. Environmental data, assumptions and models. 151. 6.. Data flows of the 5th National Environmental Outlook. 159. Annex II. Integrating cost-benefit analysis into the policy process. 163. 1.. Purpose of the paper. 165. 2.. The issue: how to introduce rationality in public decision-making. 166. 3.. The criteria / alternatives matrix. 169. 4.. Summary so far. 170. 5.. What if all costs and benefits cannot be monetised?. 170. 6.. The issue of geographical bounds. 171.
(7) EFTEC/RIVM report 481505 024. page 7 of 194. 7.. Experience with CBA. 172. 8.. Obstacles to the use of Cost-Benefit Analysis. 175. 9.. Baseline. 176. 10.. Obstacles: credibility. 178. 11.. Obstacles: moral objections to Cost-Benefit Analysis and the issue of democracy. 180. 12.. Obstacles: the efficiency focus of Cost-Benefit Analysis. 182. 13.. Obstacles: flexibility of process. 183. 14.. Obstacles: is Cost-Benefit Analysis non-participatory?. 183. 15.. Obstacles: capacity. 184. 16.. Getting Cost-Benefit Analysis into the process of decision-making. 184. Appendix A Mailing list. Types of formal appraisal procedures. 187 193.
(8) page 8 of 194. EFTEC/RIVM report 481505 024. Abbreviations ∆ AOT40 AOT60 BT CBA CLS CO CO2 COI COPD CVM DALY dB(A) D/ERF EU GDP GDP GNP GHG GWP IPCC MWTP N n N2O NH3 NO2 NOx NEO5 NSDI O3 P p.a. PB PM10 PM2.5 POP pp ppb PPP RAD RHA SO2 UNECE VOCs VOLY VOR VOSL. Change in Accumulated ozone above threshold 40ppb, (usually for crops) Accumulated ozone above threshold 60ppb, (usually for health) Benefits transfer Cost benefit analysis Current legislation scenario Carbon monoxide Carbon dioxide Cost of illness Chronic obstructive pulmonary disease Contingent valuation methodology Disability adjusted life years Decibel exposure level of noise Dose / exposure response functions European Union Global damage potential Gross domestic product Gross national product Greenhouse gases Global warming potential Intergovernmental Panel on Climate Change Marginal willingness to pay Nitrogen Noise Nitrous oxide Ammonia Nitrogen dioxide Oxides of nitrogen Fifth National Environmental Outlook (draft report) (final July 2000) Noise sensitivity depreciation index Low level ozone, otherwise known as tropospheric ozone Phosphorous Per annum Primary benefit Fine particles less than 10µm in diameter Fine particles less than 2.5µm in diameter Population Per person parts per billion Purchasing power parity Restricted activity day Respiratory hospital admission Sulphur dioxide United Nations Economic Commission for Europe Volatile organic compounds Value of life year Value of risk Value of statistical life. WTP Y. Willingness to pay Income.
(9) EFTEC/RIVM report 481505 024. page 9 of 194. Samenvatting Achtergrond Het doel van deze studie is het stellen van mogelijke prioriteiten voor het Nederlands milieubeleid. De studie is uitgevoerd door het Economics for the Environment Consultancy (EFTEC) in samenwerking met het Rijksinstituut voor Volksgezondheid en Milieu (RIVM) in opdracht van het Ministerie van Economische Zaken. Het rapport beschrijft drie verschillende methoden om prioriteiten te stellen binnen het milieubeleid: • Schadeschatting voor de huidige status van zeven milieuproblemen (1995) en de verwachtte toekomstige ontwikkeling (2010, 2020 en 2030). Schadeschattingen geven een indicatie voor de potentiële baten van milieumaatregelen, met andere woorden de voorkomen schade is gelijk aan de baten van milieumaatregelen; • Publieke opinie als maatstaf voor het belang van milieuproblemen, zoals waargenomen bij de Nederlandse bevolking, en • ‘Disability adjusted life years’ (DALY’s).. Milieuproblemen Het rapport richt zich op zeven milieuproblemen. Deze problemen zijn: • Klimaatverandering; • Verzuring; • Troposferische ozon; • Fijn stof; • Geluid; • Eutrofiëring, en • Bodemverontreiniging. Deze onderwerpen zijn tot prioriteit verkozen door de stuurgroep om twee hoofdredenen: i) Momenteel is het beleid voor deze onderwerpen of niet op zijn plaats of niet geheel effectief1, en ii) De verwachting is dat de geselecteerde onderwerpen in Nederland in belang zullen toenemen in de komende decennia. De data zijn afkomstig uit de concept versie van de Nederlandse Nationale Milieuverkenning 5 (definitieve versie beschikbaar augustus 2000). Er is gekozen voor het ‘EC’ scenario, wat hier wordt aangeduid met ‘current legislation scenario’ (CLS). De toekomstige ontwikkelingen van de milieuproblemen zijn gebaseerd op maatschappelijke trends gecombineerd met het huidige milieubeleid, zoals het reeds vastgesteld is in Nederland en de EU. Tabel 1 geeft de aannames die ten grondslag liggen aan het CLS.. 1. De stuurgroep heeft besloten om bodemverontreiniging in de studie op te nemen ondanks het huidige beleid dat bodemverontreiniging beperkt. Dit is gedaan om te kijken wat de prioriteit van bodemverontreiniging is in vergelijking met de andere milieuproblemen..
(10) page 10 of 194. EFTEC/RIVM report 481505 024. Tabel 1 Maatschappelijke trends en milieubeleid in het CLS Maatschappelijke trends • Opkomst van ‘Fortress America’ en de trend dat strategische handel en industrieel beleid significant bijdragen aan het vormen van handelsblokken; • Ondanks toenemende gespannen relaties met de USA ontwikkelt West-Europa zich erg gunstig. Het Europese proces van integratie is een belangrijke stimulans voor een versterking van de structuur van het West-Europese produkt en arbeidsmarkt. Een verreikend proces van hervorming van de West Europese welvaartsstaat wordt in beweging gezet. Hierin worden pogingen gedaan om de Europese traditie van sociale gelijkheid te combineren met een toegenomen gevoeligheid voor economische stimulansen; • De EU introduceert een energieheffing van $ 10 per barrel; • Technologische ontwikkeling en verspreiding is gematigd; • Hoge migratie naar de EU. Belangrijk milieubeleid in het CLS* • Klimaatbeleid (1999); invoering van het Kyoto protocol; • Europese emissies instructies (e.g., EURO IV); • Meest recente normen voor emissie bij verbranding; • Geïntegreerd beleid voor de reductie van ammoniak en mest; • Meest recente geluidsnormen voor transport. * Beleid goedgekeurd door het Nederlands parlement voor 1 januari 2000. Methoden Schadebenadering De toegepaste methode komt grotendeels overeen met de methode die gevolgd is voor de studie ‘European Environmental Priorities: an integrated economic and environmental assessment’ (RIVM et al., 2000)2 voor de Europese Commissie DG Milieu. De methode is gebaseerd op een logische stapsgewijze opeenvolging van emissies, verandering in blootstelling, kwantificeren van effecten met behulp van blootstellings-effect relaties, tot waardering gebaseerd op ‘willingness-to-pay’ (WTP). We onderkennen het bestaan van significante onzekerheid bij het schatten van milieuschade als gevolg van: • Statistische fout; • Overbrengen van blootstellings-effect relaties en waarderingen naar een andere context (locatie en tijd) ; • Variatie in politieke en ethische opvattingen, en • Tekortkomingen in het huidige kennisniveau, in sommige gevallen leidend tot het weglaten van effecten. We benaderen het bestaan van onzekerheid door het zoveel mogelijk kwantificeren van effecten, gebruikmakend van wat wij de beste beschikbare data vinden (na een uitgebreide bestudering van de literatuur), en de aannames die zoveel mogelijk overeenkomen met deze data. Wij anticiperen op het bestaan van onzekerheid door het uitvoeren van een gevoeligheidsanalyse om op een overzichtelijke manier de gevolgen van de onzekerheid op de robuustheid van onze conclusies, gebaseerd op onze baseline data en aannames, weer te geven. Om een duidelijk overzicht te bewaren is er een gevoeligheidsanalyse uitgevoerd voor elk milieuprobleem. De belangrijkste bronnen van onzekerheid, zoals vastgesteld in loop van deze studie, zijn de volgende: 2. Met uitzondering van bodemverontreiniging, welke niet was opgenomen in deze studie. Voor een uitgebreide uiteenzetting van de ontwikkelde en gebruikte methode voor dit onderwerp, zie Section 4.4..
(11) EFTEC/RIVM report 481505 024. • • • • •. • • • • •. page 11 of 194. Benadering van de waardering van vroegtijdige sterfte; De ‘willingness-to-pay’ waarden worden constant veronderstelt, in Euro 2000 waarden, over de gehele tijdsperiode ondanks een stijgend Nederlands BBP. De relatie tussen blootstelling en uiteindelijke gezondheidseffecten, oftewel de blootstellingseffectrelaties; Het beleid ter voorkoming van klimaatverandering kan hogere baten voortbrengen wanneer de secundaire baten als gevolg van andere milieuproblemen worden meegenomen. Aan de andere kant kan de schade overschat worden door het weglaten van aanpassingsstrategieën; De baten van verzuring kunnen onderschat zijn door het weglaten van de effecten op ecosystemen, cultuurgoederen en zichtbaarheid. De baten van verzuring kunnen overschat worden, doordat de effecten van PM10 op de volksgezondheid worden meegenomen, terwijl deze effecten al in de separate analyse voor PM10 berekend worden; De aanname voor geluidhinder is dat alle type geluid hetzelfde gewaardeerd worden, ondanks het bewijs dat veronderstelt dat geluid van vliegtuigen en railverkeer als ‘erger’ beschouwd wordt dan geluid als gevolg van wegverkeer; De baten van bodemverontreiniging zijn behoorlijk onzeker als gevolg van de data met betrekking tot het aantal verontreinigde locaties, het omzetten van aantal locaties in omvang verontreinigde grond, en de waarde van schone / verontreinigde grond; De baten van fijn stof worden geschat op basis van de aanname dat alle fracties van PM10 even schadelijk zijn voor de volksgezondheid en het feit dat in de resultaten andere ziekte-effecten dan ziekenhuisopnames niet zijn opgenomen; Eutrofiëring; aanzienlijke onzekerheid omtrent de wetenschappelijke data voor de waterkwaliteit in Nederland en het gebrek aan bewijs voor een WTP voor daling van de eutrofieringseffecten voor binnenwateren in Nederland, en Troposferische ozon; niet meegenomen zijn de effecten op materialen, bosecosystemen, nietgewas begroeiing en biodiversiteit, en de ziekte effecten anders dan ziekenhuisopnames.. Deze en andere bronnen zijn vollediger uiteengezet en onderzocht in het rapport. Sommige criticie beweren dat het bestaan van onzekerheid de betrouwbaarheid van een batenschatting of de batenschatting als een beslissingsinstrument ondermijnt. Het is onze professionele opvatting dat de aanwezigheid van een grote onzekerheid het essentiëler maakt om een batenschatting uit te voeren. Een batenschatting vergroot de kennis in het probleemgebied en het geeft politicie een indicatie voor het potentiële risico van hun acties. Een alternatieve benadering is dat alleen de baten waarvan de begeleidende onzekerheid als minimaal gekwantificeerd is, worden meegenomen. Echter dit zou betekennen dat het noodzakelijk is om een subjectief standpunt in te nemen met betrekking tot hoe goed het bewijs moet zijn om een gegeven effect als robuust te beschouwen voor de analyse. Behalve het vaststellen of een vervuiler schadelijk is, geeft het een gebrekkig advies voor de reeks van mogelijke effecten van de onderzochte vervuilers.. Publieke opiniebenadering Om de belangrijkheid van de milieuproblemen zoals bezien door de Nederlands bevolking te bepalen, refereren we naar Europese en nationale onderzoeken. De redenen om naar publieke opinie te kijken zijn tweeledig; • Verscheidene Europese en nationale onderzoeken tonen dat het milieu een belangrijke bron van zorg blijft voor de Nederlandse bevolking, en • Het gebruik van publieke opinie voor het rangschikken van milieuproblemen verzekert dat alle inwoners van Nederland een even hoge weging hebben. Met andere woorden, ze krijgen in feite een even groot aantal ‘stemmen’ over het milieu. Een dergelijke rangschikking van milieuproblemen is daarom ongevoelig voor verschil in factoren, die een batenschatting kunnen beïnvloeden, zoals bijvoorbeeld inkomen..
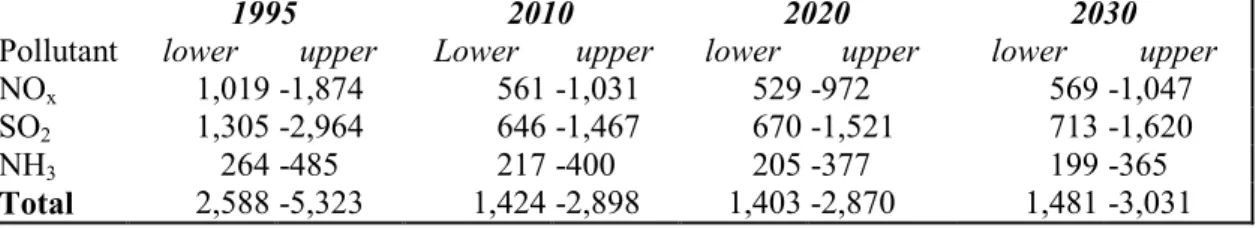
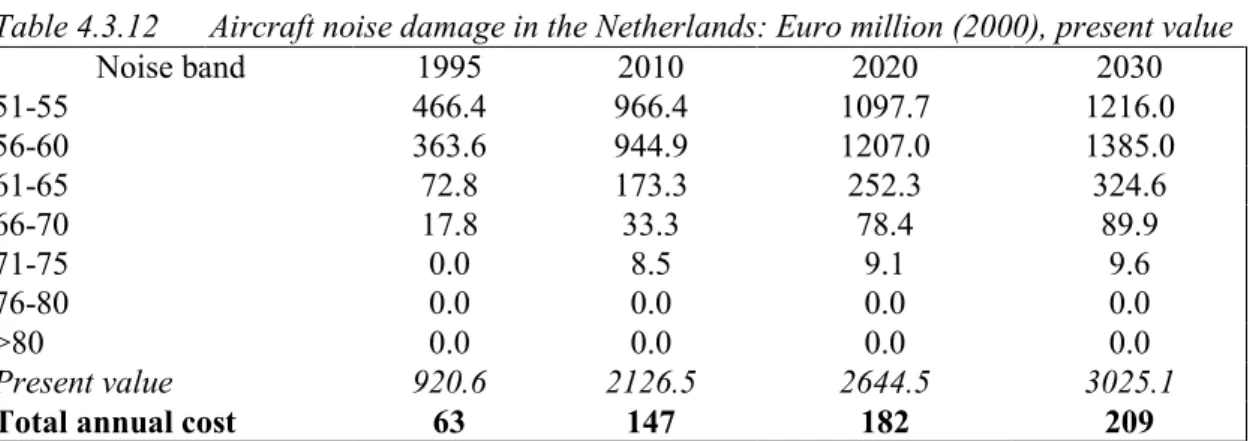
(12) page 12 of 194. EFTEC/RIVM report 481505 024. Disability adjusted life years (DALY’s) benadering De gebruikte methode komt grotendeels overeen met de methode van Murray en Lopez (1996). Zij ontwikkelden de ‘disability adjusted life years’ maatstaf om de wereldwijde ziektelast en de daaruitvolgende gezondheidsbeleidsprioriteiten in verschillende regio’s van de wereld te schatten. Deze gezondheidseffectmaatstaf combineert verlies van levensjaren en jaren geleefd met ziekte of handicap, die gewogen zijn naar zwaarte. In het kader van de 5e Nationale Milieuverkenning zijn alleen adequate data en toekomstperspectieven beschikbaar voor fijn stof, troposferische ozon, geluid, ultra-violette straling, radon, huisvochtigheid en ziekte als gevolg van voedselinfecties. Voor elke relevante gezondheidsuitkomst berekenen we toegeschreven risico’s door het combineren van populatie gewogen blootstellingverdeling met relatieve risicoschattingen, afgeleid uit de epidemiologische literatuur. Vervolgens is voor iedere gezondheidsuitkomst het aantal gevallen geschat door het combineren van de in de baseline voorkomende gevallen met de toegevoegde risico’s. Berekeningen van de toekomstige ziektelast zijn gebaseerd op projecties van de toekomstige populatiestructuur. Wij presenteren de gebruikte set van eindpunten om te komen tot de schattingen van toegeschreven ziektelast en het aantal verloren DALY’s. Tenslotte is de totale blootstelling toegeschreven aan ziektelast berekend door het aggregeren van het aantal DALY’s voor elke gezondheidsuitkomst. De ziektelast veroorzaakt door additionele UV-blootstelling, als gevolg van degradatie van de ozonlaag, is berekend door het aggregeren van jaarlijkse ziekte en sterfte schattingen van huidkanker en de Nederlandse ziektelast data, Melse et al (2000). Statistische onzekerheid is geschat met MonteCarlo technieken.. Resultaten Schadebenadering Om voor de milieuproblemen op basis van schade (of potentiële baten van beleid) prioriteiten te stellen, moeten de schatting direct vergelijkbaar gemaakt worden. Dit wordt gecompliceerd door het feit dat de schadeschattingen voor geluid en bodemverontreiniging contante waarden over een oneindige periode zijn. Dus we vergelijken de milieuproblemen met de contante waarde van de schadeschatting (rente = 6%). In Tabel 2 worden de totale schadeschattingen gegeven als een netto contante waarde en de overeenkomende waarde voor de jaarlijkse schade, vervolgens zijn de Nederlandse milieuthema’s gerangschikt naar de hoogste potentiële baten van beleid. Tabel 2. Totale en jaarlijkse schadeschattingen voor milieuthema’s in Nederland Totale schade Jaarlijkse schade Rangschikking Netto contante waarde miljoen Euro (2000) rentevoet=6% Miljoen Euro(2000) Troposferische ozon 110034 – 110613 6228 - 6261 1 Bodemverontreiniging 59559 3371 2 PM10 54471 3083 3 Verzuring 37017 - 41569 2095 - 2353 4 Klimaatverandering 36766 2081 5 Geluid 31980 1810 6 Eutrofiëring 9835 - 19224 557 - 1088 7 Dus we zien dat de hoogste prioriteit, in termen van potentiële baten van volledig beleid, ligt bij troposferische ozon, bodemverontreiniging en fijn stof. Gevolgd door klimaatverandering en verzuring, terwijl voor geluid en eutrofiëring geschat wordt dat ze de laagste potentiële baten zullen opleveren. Maar er kunnen geen conclusies ten aanzien van de wenselijkheid van beleid getrokken worden, omdat kostenschattingen ontbreken. Ondanks dat de schade en dus de potentiële primaire baten van beleid voor milieuproblemen toenemen in de tijd (met uitzondering van eutrofiëring en verzuring), dalen ze als percentage van het Nederlands BBP in 1995, 2010, 2020 and 2030. Tabel 3 geeft de schadeschattingen als percentage.
(13) EFTEC/RIVM report 481505 024. page 13 of 194. van het BBP. Aangemerkt moet worden dat dalende percentages van het BBP geen garantie geven voor een stijging van de relatieve waarde van het milieu in de tijd als het inkomen stijgt. Als de relatieve waarde met hetzelfde percentage stijgt als het BBP, dan blijft de schade als deel van het BBP gelijk. Maar er is slechts weinig informatie beschikbaar over de inkomenselasticiteit van de vraag naar milieu, dus we nemen aan dat ‘willingness to pay’ (WTP) waarden constant blijven in de tijd ondanks een stijgend BBP voor Nederland. Tabel 3. Milieuschadeschattingen als percentage van Nederlands BBP: % 1995 2010 2020 2030 Troposferische ozon 1,32 1,12 1,01 1,02 PM10 0,76 0,53 0,47 0,46 Klimaatverandering 0,62 0,40 0,33 0,27 Verzuring 0,85 – 0,95 0,30 – 0,34 0,23 – 0,25 0,18 – 0,20 Eutrofiëring 0,22 – 0,45 0,08 – 0,16 0,06 – 0,12 0,05 – 0,09 Geluid 0,51 0,38 0,30 0,25 Totaal 4,29 – 4,62 2,82 – 2,92 2,40 – 2,48 2,22 – 2,29 Nederlands BBP (miljard Euro): 1995 = 312,627; 2010 = 482,543; 2020 = 632,928; 2030 =830,180; bron RIVM (2000).. Tabel 3 suggereert dat milieuschade in Nederland een significant aandeel is van het BBP in 1995, een spreiding van 1.3% voor tropsferische ozon, tussen 0.6% en 0.8% voor fijn stof, klimaatverandering, verzuring tot ruwweg 0.5% voor geluid en eutrofiëring. In totaal is de milieuschade als gevolg van bovenstaande milieuproblemen geschat op ruwweg 4.5% van het BBP in 1995, dalend tot ongeveer 2% in 2030. Het is interessant om deze getallen te vergelijken met de schattingen voor uitgaven aan vervuilingbestrijding, waarvan aangegeven is dat ze ongeveer 1.2% van het BBP in 1990 zijn (ERECO, 1992).. Publieke opiniebenadering Ondanks dat het milieu minder als een probleem wordt gezien in 1999 dan in 1995, wanneer de bezorgdheid op haar hoogtepunt was, (63% in 1986, 80% in 1995 en 70% in 1999), (Eurobarometer 1986, 1995 en 1999), blijft het een punt van gemeenschappelijke zorg voor het Nederlandse publiek. Tabel 4 laat de onderwerpen zien die serieuze bedreiging voor het milieu vormen (ongeacht de schaal), zoals waargenomen bij het Nederlands publiek. Deze opinies zijn tamelijk stabiel in de tijd en de resultaten van 1992 geven eenzelfde beeld (behalve het onderwerp zure regen, dat iets belangrijker geworden is sinds 1992). Tabel 4 Onderwerpen die bijdragen aan serieuze milieuschade: 1992 and 1995 Onderwerp Rangschikking Fabrieken die gevaarlijke chemicaliën uitstoten in lucht en water 1 Olievervuiling van zeeën en kusten 2 Wereldwijde vervuiling (geleidelijke verdwijning van tropisch regenwoud, 3 afbraak van de ozonlaag, broeikaseffect etc) Opslag van radioactief afval 4 Industrieel afval 5 Zure regen 6 Overmatig gebruik van herbiciden, insecticiden en kunstmest in de landbouw 7 Zwerfvuil op straat, in groene gebieden of op het strand 8 Luchtverontreiniging door auto’s 9 Ongecontroleerd massa toerisme 10 Afvalwater 11 Geluid ontstaan door openbare gebouwen of werken, zwaar verkeer, luchthavens 12 Bron: Eurobarometer: Europeans and their Environment, 1992, 1995 en SCP onderzoek 1993..
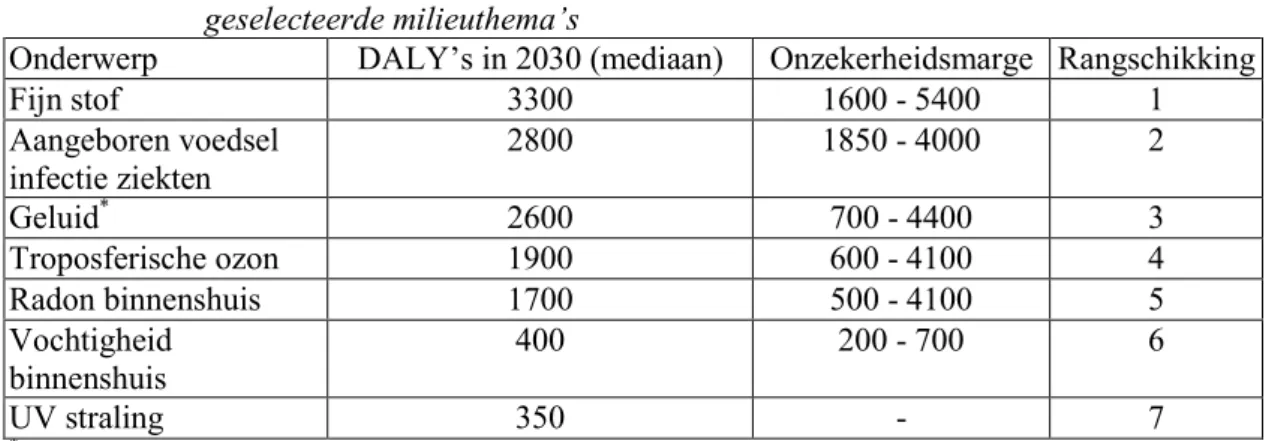
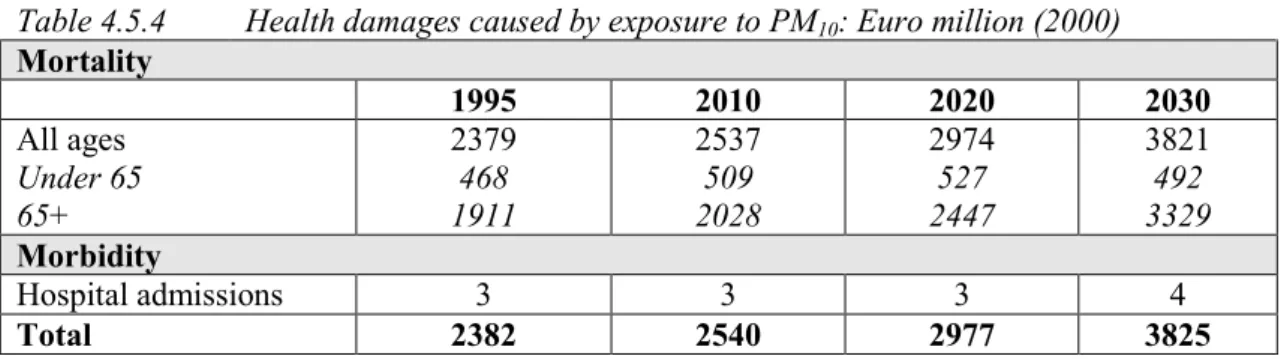
(14) page 14 of 194. EFTEC/RIVM report 481505 024. Disability adjusted life years (DALY’s) benadering De gezondheidseffecten van luchtverontreiniging door fijn stof en gedeeltelijk door tropesferische ozon, domineren de ziektelast. De toekomstige ziektenlast is voor een groot deel het gevolg van toekomstige veranderingen in de populatiestructuur (een grotere groep oudere mensen wordt beïnvloed door dit type luchtverontreiniging). Een ander milieuprobleem dat geassocieerd wordt met een hoge ziektelast is blootstelling aan geluid van weg- en luchtverkeer. We laten na om ziektenlast toe te schrijven aan het hoge aantal mensen dat serieuze hinder en slaapproblemen aangeeft.. Er is namelijk veel discussie of deze respons gezien moet worden als schade aan de volksgezondheid of meer als een sociale reactie. In plaats daarvan schatten we de mogelijke fractie van cardiologische ziekten die toe te wijzen zijn aan blootstelling aan geluid op basis van de resultaten van diverse omvangrijke epidemiologische studies die een causaal verband impliceren. De ziektelast als gevolg van de overgebleven milieuproblemen zijn verhoudingsgewijs miniem. Tabel 5 geeft het jaarlijks verlies aan DALY’s als gevolg van de geselecteerde milieuproblemen. Tabel 5. Jaarlijks verlies aan Disability-Adjusted Life Years (DALY’s) als gevolg van de geselecteerde milieuthema’s Onderwerp DALY’s in 2030 (mediaan) Onzekerheidsmarge Rangschikking Fijn stof 3300 1600 - 5400 1 Aangeboren voedsel 2800 1850 - 4000 2 infectie ziekten Geluid* 2600 700 - 4400 3 Troposferische ozon 1900 600 - 4100 4 Radon binnenshuis 1700 500 - 4100 5 Vochtigheid 400 200 - 700 6 binnenshuis UV straling 350 7 *. weg- en luchtverkeer; vergelijkt alleen klinische gezondheidsuitkomsten. Conclusies Het rangschikken van milieuproblemen is nuttig om onderwerpen die prioriteit hebben te onderstrepen en om aan te geven of er een verrassende uitkomst is voor de Nederlandse milieuproblemen. Zulke studies kunnen gebruikt worden om het bewustzijn van de verantwoordelijke mensen te vergroten. Ondanks dat de rangschikking geen enkele politieke vraag beantwoordt, (hiervoor moeten naast de baten ook de kosten van de maatregelen berekent worden) kunnen de berekende eenheidswaarden van de studie gebruikt worden voor een toekomstige kosten-batenanalyse voor milieumaatregelen. Het is belangrijk om op te merken dat de schade of batenschattingen, zoals gepresenteerd voor de verschillende milieuproblemen slechts een gedeeltelijke indicatie geven voor de milieuprioriteiten in Nederland. Door het ontbreken van data voor de kosten van de implementatie van het beleid, kunnen deze maatstaven van effictiviteit slechts een deel van het plaatje, wat noodzakelijk is voor het vaststellen van prioriteiten, geven. Voor een volledige economische analyse zoals in RIVM et al (2000), moeten baten(schade)schattingen aan kostenschattingen gekoppeld worden in een kostenbaten analyse schema. Dit valt buiten het bereik van deze studie, maar een apart rapport over de onderwerpen in relatie tot en ervaring met kosten-baten analyse wordt gepresenteert als Annex II van de totale studie (zie Annex II: Integrating Cost Benefit Analysis into the Policy Process). Het is ook belangrijk om het verschil aan te geven tussen de schade van een milieuthema, zoals klimaatverandering en de baten van beleidsmaatregelen om klimaatverandering te voorkomen. De baten bevatten de voorkomen schade maar zijn waarschijnlijk significant hoger door bijkomende voordelen van milieubeleid. Deze bijkomende voordelen zijn beter bekend als secundaire baten. Secundaire baten ontstaan omdat maatregelen voor een bepaald milieuprobleem ook andere vervuilende stoffen reduceren. Klimaatbeleid zal behalve het verminderen van broeikasgassen ook de uitstoot van verzurende stoffen verminderen. Dus de baten van beleidsmaatregelen voor een.
(15) EFTEC/RIVM report 481505 024. page 15 of 194. milieuprobleem zullen waarschijnlijk de gemaakte schatting overstijgen. Een belangrijk onderwerp is wanneer de primaire en secundaire baten optreden, nu of in de toekomst, en het effect van disconteren. De secundaire baten van bijvoorbeeld klimaatbeleid zullen dichterbij het heden plaatsvinden dan de primaire baten die ver in de toekomst zullen plaatsvinden. Een ander belangrijk onderwerp is dat verwacht wordt dat de secundare baten van klimaatbeleid (i.e. SOx, NOx) zullen dalen in de toekomst, omdat ze afhankelijk zijn van klimaatsonafhankelijk beleid dat leidt tot daling van emissies. Om een definitieve rangschikking naar de belangrijkheid van de Nederlands milieuproblemen te maken, gebruiken we de resultaten van de schadeberekeningen, de publikie opinie in Nederland en de DALY-benadering. Tabel 6 brengt de resultaten van de drie methoden samen. De definitieve rangschikking van milieuproblemen, zoals gegeven in de één na laatste kolom van Tabel 6 is gebaseerd op een eenvoudige 'Borda count'. Dit betekent dat voor ieder milieuprobleem we de gewogen rangschikking van de schadeberekening, de publieke opinie en de DALY-benandering optellen en delen door het totaal aantal beschouwde milieuproblemen. Het is noodzakelijk om de rangen te wegen om zodoende de verschillende aantallen beschouwde milieuproblemen in de verschillende benaderingen mee te nemen. De algehele rangschikking wordt gevonden met behulp van de resultaten van de ‘Borda count’, waar een lage waarde een hoge prioriteit scoort. Ondanks dat de ‘Borda count’ een conventionele manier is om een aantal rangschikkingen te rangschikken is het grootste nadeel van deze procedure dat de algehele rangschikking niet gevoelig is voor de onzekerheid van de verschillende milieuproblemen. Om de definitieve rangschikking te kwalificeren bevat de laatste kolom van Tabel 6 een benadering van de algehele onzekerheid van elk milieuprobleem met een schaal van ++ tot --, waar ++ een lage onzekerheid aangeeft en -- een hoge onzekerheid. Tabel 6. Milieuthema’s in Nederland in volgorde van prioriteit. Milieuprobleem. Bodemverontreiniging Klimaatverandering PM10 Verzuring Troposferische ozon Eutrofiëring Geluid Aantal beschouwde onderwerpen in de studie. Rangschikking volgens schadeberekening 2 5 3 4 1 7 6 7. Rangschikking volgens publieke opinie 3 9 6 9 7 12 12. Rangschikking volgens DALYbenadering 1 4 3 7. Definitieve rangschikking. Onzekerheid. 1 2 3 4 5 6 7 -. -++ + ++ + --. Deze studie concludeert dat in volgorde van prioriteit, bodemverontreiniging, klimaatverandering en fijn stof de top drie prioriteit van milieuproblemen in Nederlands zijn, gevolgd door verzuring, troposferische ozon, eutrofiëring en tenslotte geluid. Deze bevindingen suggereren dat toekomstig beleid gericht op de onderwerpen met een top prioriteit aanzienlijke baten kunnen opbrengen..
(16) page 16 of 194. EFTEC/RIVM report 481505 024. Summary Background The objective of this study is to set priorities for the environmental policy in the Netherlands. The study is undertaken by Economics for the Environment Consultancy (EFTEC) with Rijksinstituut voor Volksgezondheid en Milieu (RIVM) for the Ministry of Economic Affairs, the Netherlands. This report describes three different approaches to environmental policy prioritisation: • Damage assessment for the current status of seven environmental issues (1995) and the expected future progress (2010, 2020 and 2030). Damage estimates indicate what the benefits of environmental control could be, i.e. avoided damage equals benefit of control; • Public opinion, as a measure of the importance of environmental issues as perceived by the population of the Netherlands, and • ‘Disability adjusted life years’ (DALYs). Environmental issues The report focuses on seven environmental issues. These are: • Climate change; • Acidification; • Low level ozone; • Particulate matter; • Noise; • Eutrophication, and • Land contamination. These issues are chosen as priorities by the steering group for two main reasons: i) At present the regulatory systems for these issues are either not in place or not wholly effective3, and ii) The issues listed are expected to be increasing in importance in the next decades in the Netherlands. The data are drawn from the Fifth National Environmental Outlook for the Netherlands (NEO5) draft report. The ‘medium growth’ scenario is chosen and this is referred to here as the ‘current legislation scenario’ (CLS). The future growth of environmental issues is based on societal trends combined with current environmental policies already in place in the Netherlands and the EU. Table 1 presents the assumptions behind the CLS.. 3. Although policies are in place to control land contamination, the steering group decided to include land contamination in the priority assessment in order to see how land contamination compares with the other environmental issues in the Netherlands, in terms of priority..
(17) EFTEC/RIVM report 481505 024. page 17 of 194. Table 1 Societal trends and environmental policies included in the CLS Societal trends • Rise of ‘Fortress America’ and the tendency toward strategic trade and industrial policies significantly contribute to formation of trade blocks; • Despite increasingly strained relations with the USA, Western Europe develops very favourably. The European process of integration is an important stimulus toward strengthening incentive structures in the Western European product and labour markets. A far-reaching process of reform of the Western European welfare state is set in motion. In this, attempts are made to combine the European tradition of social equity with an increased sensitivity to economic incentives; • EU introduces an energy/carbon tax of $ 10 per barrel; • Technological development and diffusion is moderate; • High migration to the EU from outside the EU. Key environmental policies included in the CLS* • Climate change policy plan (1999); implementation of Kyoto protocol; • European emission directives (e.g., EURO IV); • Most recent emission standards for combustion; • Integrated policy plan for reducing ammonia and manure; • Most recent noise standards for transport. * Policies in place as approved by the Dutch parliament before January 1, 2000. Methodology Damage assessment approach The methodology adopted largely follows that of the European Commission DG Environment study ‘Economic Assessment of Priorities for a European Environmental Policy Plan’ (RIVM et al., 2000)4. It is based on a logical stepwise progression through emission, change in exposure, quantification of impacts using exposure-response functions, to valuation based on willingness-to-pay. We acknowledge the existence of significant uncertainty in assessment of environmental damage arising through: • Statistical error; • Transfer of exposure-response functions and valuations from one context (location and time) to another; • Variation in political and ethical opinion, and • Gaps in current knowledge base, leading in some cases to omission of effects. Our approach to the existence of uncertainty is to quantify effects as far as possible using what we regard (from a comprehensive review of the literature) to be the best data available, and assumptions which correspond most closely with those data. We respond to the existence of uncertainty through a sensitivity analysis to demonstrate in a transparent manner the consequences of uncertainty on the robustness of our conclusions based on our baseline data and assumptions. To retain transparency a sensitivity analysis is conducted for each environmental problem. The following is a detailed account of sources of uncertainty: • Approach to the monetary valuation of premature mortality; • Willingness-to-pay values assumed to remain constant, at Euro 2000 values, through time despite increasing GDP for the Netherlands; • Relationships between exposure and health end points, i.e. dose / exposure response functions;. 4. With the exception of land contamination, which was not included in that study. For a detailed discussion of the methodology developed and implemented for this issue see Section 4.4..
(18) page 18 of 194. • •. • • • • •. EFTEC/RIVM report 481505 024. Climate change control policies may yield greater benefits if the secondary benefits to other environmental issues are included. Damage estimates may however be overstated due to the omission of adaptation strategies; Acidification benefits may be understated due to the omission of effects on ecosystems, cultural assets and impacts to visibility. Acidification benefits may be overestimated due to the inclusion of impacts due to PM10 on human health which are already accounted for in the separate analysis on PM10; Noise nuisance assumption, that all noise types are valued the same despite the evidence that suggests aircraft and rail noise may be more 'annoying' than road noise. Land contamination benefits are very uncertain due to the uncertain data for number of contaminated sites, the conversion of 'number of contaminated sites' to size of contaminated land, and the value of clean and contaminated land; Particulate matter benefit estimates are based on the assumption that all fractions of PM10 are equally aggressive to human health and the results omit morbidity effects other than hospital admissions; Considerable uncertainty is attached to the scientific data for water quality in the Netherlands used for eutrophication damage estimates. There is also a lack of evidence of a WTP for a reduction of eutrophication impacts for inland waters in the Netherlands, and The omission of impacts due to low level ozone to materials, forests ecosystems, non-crop vegetation and biodiversity and the morbidity effects other than hospital admissions is likely to lead to underestimation.. These and other sources of uncertainty are more fully discussed and investigated in the report. Some commentators argue that the existence of uncertainty undermines the credibility of the benefit estimates as a decision making tool. It is our professional opinion that the presence of large uncertainty makes it more essential that benefit assessment is conducted. It serves to increase the knowledge base in the area of question and it acts as a signal to policy makers for the potential risks of their actions. An alternative to the approach adopted here would be to quantify only those benefits for which associated uncertainty is minimal. However, this would mean taking a necessarily subjective position on how good the evidence must be on a given effect for analysis to be considered robust. Beyond establishing if a pollutant is known to be harmful, it would provide poor guidance on the range of possible effects of the pollutants considered.. Public opinion approach In order to determine the importance of environmental issues as perceived by the population of the Netherlands we refer to European and national surveys. The rationale for turning to public opinion is twofold; • Various European and national public opinion surveys show that the environment remains a major concern for the Dutch public, and • Using public opinion to rank environmental issues ensures all Dutch citizens are weighted equally. In other words, they are effectively given an equal number of ‘votes’ on the environment. Such a ranking of environmental issues is therefore impartial to differences in factors, such as income, that can affect economic assessments.. Disability adjusted life years (DALYs) approach The DALY methodology largely follows that of Murray and Lopez (1996). They develop the ‘disability adjusted life years’ measure in order to assess the global disease burden and consequently the health policy priorities in different regions of the world. This health impact measure combines years of life lost and years lived with disease or disability that are weighted according to severity. In the NEO5 framework adequate data and future projections are available for particulate matter, low level ozone, noise, ultra-violet radiation, radon, home dampness and food borne infectious disease only. For each relevant health outcome we calculate attributable risks by combining population.
(19) EFTEC/RIVM report 481505 024. page 19 of 194. weighted exposure distributions with relative risk estimates derived from the epidemiological literature. Subsequently for each health outcome the number of cases was estimated by combining baseline incidence rates with the attributive risks. Calculations of future disease burden are based on projections of future population structure. We present the set of endpoints used to arrive at estimates of attributable disease burden and the number of DALYs lost. Finally a total exposure attributable disease burden was calculated by aggregating the number of DALYs for each health outcome. The disease burden associated with additional UV-exposure due to ozone layer degradation was calculated by aggregating annual morbidity and mortality estimates of skin cancer and Dutch burden of disease data, (Melse et al., 2000). Statistical uncertainty was assessed using Monte Carlo techniques.. Results Damage assessment approach In order to prioritise the environmental issues in order of damages (or potential benefits from control), the damage estimates must be made directly comparable. This is complicated by the fact that damage estimates for land contamination are present values. Thus, we compare the environmental issues according to present value damage estimates (discount rate = 6%). Table 2 gives the total damage estimates as a present value and the corresponding annual damage value and then the environmental issues for the Netherlands are ranked in terms of greatest potential benefit from control. Table 2. Total and annual damage estimates for environmental issues in the Netherlands Total damage Annual damage Ranking Present value, discount rate=6% Euro million (2000) Euro million (2000) Low level ozone 110034 - 110613 6228 – 6261 1 Land contamination 59559 3371 2 PM10 54471 3083 3 Acidification 37017 - 41569 2095 – 2353 4 Climate change 36766 2081 5 Noise 31980 1810 6 Eutrophication 9835 - 19224 557 – 1088 7 Thus we see that the priorities, in terms of potential benefits from full control, are low level ozone, land contamination and particulate matter, followed by acidification and climate change, whilst noise and eutrophication are estimated to yield the lowest potential benefits from control. However, in the absence of cost estimates no conclusions can be reached on the desirability of control measures. The full discussion on this methodology and the results is given in Section 3 and 4. Despite the fact that damages and hence the potential primary benefits of control are rising over time for the environmental issues (with the exception of eutrophication and acidification), they fall as a proportion of Dutch GDP in 1995, 2010, 2020 and 2030. Table 3 presents the damage estimates as a percent of GDP. Note however that the falling percentage of GDP results makes no allowance for a rising relative value of the environment over time as income rises. If these relative valuations rise at the same rates as GDP, the proportion of damage to GDP would remain the same. Little information is available on the income elasticity of demand for the environment, thus we assume that ‘willingness to pay’ (WTP) values are constant through time despite increasing GDP for the Netherlands..
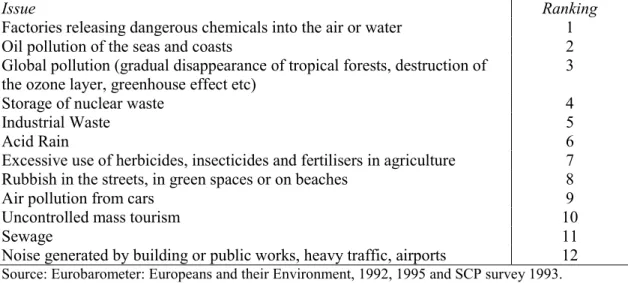
(20) page 20 of 194. EFTEC/RIVM report 481505 024. Table 3. Environmental damage estimates as a percent of Dutch GDP: % 1995 2010 2020 2030 Low level ozone 1.32 1.12 1.01 1.02 PM10 0.76 0.53 0.47 0.46 Climate change 0.62 0.40 0.33 0.27 Acidification 0.85 - 0.95 0.30 - 0.34 0.23 - 0.25 0.18 - 0.20 Eutrophication 0.22 – 0.45 0.08 – 0.16 0.06 – 0.12 0.05 – 0.09 Noise 0.51 0.38 0.30 0.25 Total 4.29 - 4.62 2.82 - 2.93 2.40 - 2.48 2.22 - 2.29 Dutch GDP: Euro billion: 1995 = 312.627, 2010 = 482.543, 2020 = 632.928 and 2030 = 830.180, source RIVM (2000).. Table 3 suggests that environmental damage in the Netherlands is a significant proportion of GDP in 1995, ranging from 1.3% for low level ozone, between 0.6% and 0.8% for PM10, climate change, acidification and roughly 0.5% for noise and eutrophication. Overall, total environmental damage due to the above environmental issues is estimated to be roughly 4.5% GDP in 1995, falling to about 2% in 2030. It is interesting to compare these figures with the estimates of expenditure on pollution abatement, reported to be about 1.2% of GDP in 1990 (ERECO, 1992).. Public opinion approach Although the environment was seen as less of a problem in 1999 than in 1995, when concern was at its highest, (63% in 1986, 80% in 1995 and 70% in 1999), (Eurobarometer 1986, 1995 and 1999), it remains a common concern for the Dutch public. Table 4 presents the issues considered to constitute a ‘serious threat to the environment’ (regardless of locality) as perceived by the Dutch public. Table 4. Issues considered by Dutch public to constitute serious environmental damage: 1992 and 1995 Issue Ranking Factories releasing dangerous chemicals into the air or water 1 Oil pollution of the seas and coasts 2 Global pollution (gradual disappearance of tropical forests, destruction of 3 the ozone layer, greenhouse effect etc) Storage of nuclear waste 4 Industrial Waste 5 Acid Rain 6 Excessive use of herbicides, insecticides and fertilisers in agriculture 7 Rubbish in the streets, in green spaces or on beaches 8 Air pollution from cars 9 Uncontrolled mass tourism 10 Sewage 11 Noise generated by building or public works, heavy traffic, airports 12 Source: Eurobarometer: Europeans and their Environment, 1992, 1995 and SCP survey 1993.. These opinions are fairly resilient to time and results from 1992 show similar rankings (excepting the issue of acid rain, which has increased in importance slightly since 1992). The full discussion on. these results is presented in Section 5. Disability adjusted life years (DALYs) approach The health effects of air pollution from particulate matter, and to a certain degree from low level ozone, dominate the disease burden. The future disease burden is to a large extent the result of future changes in the population structure, i.e. a greater share of older people are affected by this type of air pollution. Another environmental problem associated with a high disease burden is noise exposure.
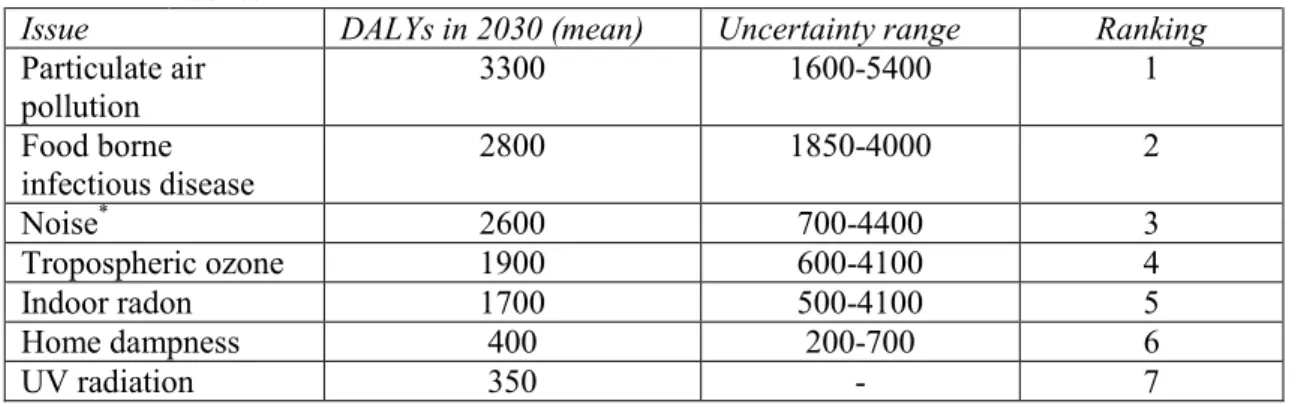
(21) EFTEC/RIVM report 481505 024. page 21 of 194. from road and air traffic. We refrained from attributing the disease burden to the large number of people reporting serious annoyance and sleep disturbance. There is much discussion about whether these responses should be regarded as a damage to human health or merely a social response. Instead we estimate the possible fraction of cardiovascular disease attributable to noise exposure based on the results of several large epidemiological studies implicating a causal association. The disease burden due to the remaining environmental issues are by comparison relatively minor, a fuller discussion of these issues is presented in Section 4.8.2. Table 5 presents the DALYs lost yearly due to the selected environmental issues. Table 5. Disability-Adjusted Life Years (DALYs) lost annualy to selected environmental issues Issue DALYs in 2030 (mean) Uncertainty range Ranking Particulate air 3300 1600-5400 1 pollution Food borne 2800 1850-4000 2 infectious disease Noise* 2600 700-4400 3 Tropospheric ozone 1900 600-4100 4 Indoor radon 1700 500-4100 5 Home dampness 400 200-700 6 UV radiation 350 7 * Road and air traffic; comprises only clinical health outcomes. Conclusions Ranking environmental issues is useful in the sense of highlighting priority issues and indicating if there is any surprise environmental issues for the Netherlands. Such exercises can be used for awareness raising for decision makers. Although ranking does not answer any questions about policy, in order to do so we would need to compare the benefits of environmental control with the costs, the unit damage values used in the benefit assessment study can be re-used if a CBA of environmental policy is conducted in future. It is important to note that the damage or benefit estimates presented for the various environmental issues offer only some guidance on environmental priorities for the Netherlands. In the absence of data on costs of implementing policies, these measures of effectiveness can provide only part of the picture necessary for establishing priorities. For a full scale economic analysis, like that in RIVM et al (2000), benefit (damage) estimates need to be compared with cost estimates within a CBA framework. This is outside the scope of this study. However, a separate paper on the issues relating to and experience with such CBAs is prepared as Annex II of the overall study (see Annex II: Integrating Cost-Benefit Analysis into the Policy Process). It is also important to distinguish between damages of an environmental issue, such as climate change and the benefits of policy measures to control the issue. The benefits include the avoided damages but are likely to be significantly greater because of the ancillary gains from environmental policy. These are known as the secondary benefits. Secondary benefits arise because the control of an environmental issue is likely to involve policies, which will also reduce other pollutants, e.g. climate change control policies will reduce greenhouse gases as well as the acidifying pollutants. Thus, benefits of a policy measure to control an environmental issue are, most likely to exceed the estimates of avoided damage. An important consideration is the issue of when primary and secondary benefits take place, i.e. now or sometime far in the future, and the effect of discounting. For example, the secondary benefits of climate change control measures will take place closer to the present, rather than decades or centuries into the future as with the primary benefits. Another important consideration is that since most secondary pollutants of greenhouse gas control policies i.e. SOx, NOx, are subject to independent policies, emissions are expected to fall over time, this means that climate change policies will secure further but smaller secondary benefits in the future..
(22) page 22 of 194. EFTEC/RIVM report 481505 024. In order to determine a final ranking for the environmental issues in the Netherlands in order of importance we draw upon the results of the damage assessment, public opinion in the Netherlands and the DALY assessment. Table 6 brings together the results of the three methods. The final ranking for the environmental issues given in the fifth column of Table 6 is based on a simple ‘Borda count’, i.e. for each environmental problem we sum the weighted ranking from the public opinion, the damage assessment and the DALY procedure and divide this by the number of total environmental issues considered. It is necessary to weight the rankings in order to allow for the different numbers of environmental issues considered in the different approaches. The overall ranking is found by ordering the results of the ‘Borda count’, where lower values score higher priorities. Although the ‘Borda count’ is a conventional way to rank a number of rankings, the main disadvantage of this procedure is that the overall rankings are not sensitive to the uncertainty associated with each environmental problem. To qualify the final rankings, Table 6 includes an assessment of overall uncertainty for each problem in the final column, on a scale of ++ to --, where ++ indicates low uncertainty and -- indicates high uncertainty. Table 6 Environmental issues in the Netherlands in order of priority Environmental ranking ranking ranking final ranking problem according to according to according to damage public opinion DALYs assessment Land contamination 2 1 Climate change 5 3 2 PM10 3 9 1 3 Acidification 4 6 4 Low level ozone 1 9 4 5 Eutrophication 7 7 6 Noise 6 12 3 7 No of issues 7 12 7 considered in each methodology. Uncertainty. -++ + ++ + --. This study concludes that land contamination, climate change and particulate matter are the top priority environmental issues in the Netherlands, followed by acidification, low level ozone, eutrophication and finally noise. These findings suggest that future policies focusing on the top issues may yield considerable benefit depending on their cost of control..
(23) EFTEC/RIVM report 481505 024. 1.. page 23 of 194. Background to and scope of the study. In 1998, the Dutch Ministry of Economic Affairs commissioned a research project on the valuation of the benefits of environmental policy. The research steering group concluded that monetary valuation should have a role in environmental policy decision making. A major outcome of this process is the Dutch Ministry of Economic Affairs' aim to further examine the potential benefit estimates as a guiding tool in environmental policy. The Ministry has a particular interest in: • Benefit estimates as a policy tool for prioritising environmental policy, and • Benefit estimates as part of the use of cost-benefit ratios in environmental policy. As the next step to further examine the potential benefit estimates for various environmental issues in the Netherlands this study was undertaken by Economics for the Environment Consultancy Ltd (EFTEC) with Rijksinstituut voor Volksgezondheid en Milieu (RIVM). This report focuses on seven environmental issues as chosen by the steering group. These are: 1. Climate change; 2. Acidification; 3. Noise; 4. Land contamination; 5. Particulate matter; 6. Eutrophication, and 7. Low level ozone. These issues were chosen as priorities for discussion for two reasons: (a) at present the regulatory systems necessary for a better environment are either, not in place or not wholly effective and (b) the issues listed are predicted to be increasing in importance in the next decades in the Netherlands. Although policies are in place to control land contamination, the steering group decided to include land contamination in the priority assessment in order to see how land contamination compares with the other environmental issues, in terms of priority, for the Netherlands. There are obvious omissions to this report. Environmental issues not included are; chemical release into air, land and water, waste disposal and the depletion of groundwater. The reason for this exclusion is because these issues are considered to be already regulated and existing targets are expected to be met. In other words, these environmental issues are no longer considered to be the subject of further environmental policy in the Netherlands and as a consequence are not included in the forthcoming NEO5. The issue of biodiversity is not treated as a separate environmental issue because the preservation of biodiversity is a common aim to all the issues covered..
(24) page 24 of 194. EFTEC/RIVM report 481505 024.
(25) EFTEC/RIVM report 481505 024. 2.. page 25 of 194. Structure of the report. The aim of this research project is twofold: i) To use benefit estimates as a tool to determine the size of public benefits for environmental issues relevant for the Netherlands, in order to facilitate an environmental priority scheme for the Netherlands; and ii) To examine the role of cost benefit analysis (CBA) in efficient decision making. Consequently the report is divided into two parts. The main report is an assessment of the environmental damage due to seven environmental issues in the Netherlands. These results are then interpreted as the primary environmental benefits of pollution control, where benefits are taken as avoided damage. Annex II (Integrating Cost-Benefit Analysis into the Policy Process) presents a discussion of CBA as a decision making tool. Part II provides an outline of the structure of the cost benefit approach to environmental policy in particular and policy in general. The advantages of integrating cost-benefit approaches into decision making are discussed as well as some of the controversies surrounding CBA and suggestions are put forward on how they might be resolved. Institutional obstacles to the implementation of CBA are identified and an overview of the ways in which CBA is used in decision making in Europe and the USA is presented..
(26) page 26 of 194. EFTEC/RIVM report 481505 024.
(27) EFTEC/RIVM report 481505 024. page 27 of 194. 3. Methodology for setting priorities in environmental policy 3.1 Introduction Environmental protection is a major concern in the Dutch policy decision making process. However, all measures taken in this area cost money and environmental budgets are limited. In the Netherlands expenditure on pollution abatement5 is reported at 1.2% of GDP in 1990 (ERECO, 1992). In general, European Union Member States spend an average of 1.1% of their GDPs on pollution abatement (ERECO, 1992). Although these proportions are not fixed through time, substantial increases are not likely in the near future. This suggests efficient use must be made of the economic resources to protect the environment, in other words, environmental expenditure must be cost effective. Environmental improvement may come as reductions in ambient concentrations of a pollutant, increased land quality or reduced disturbance from noise, etc. The problem for policy is that these gains are measured in different units; such as, micrograms of pollutant per cubic metre of air, micrograms of pollutant per millilitres of water, numbers of people exposed to different noise levels, and so on. A problem of comparability arises and it is not possible to determine whether it is better to spend one more Euro on air quality improvement or noise quality improvement. Monetised values seek to overcome this problem of comparability. There are three ‘layers’ to the priority setting problem: (a) setting priorities within a given environmental issue, such as air pollution; (b) setting priorities between different environmental issues, such as air pollution versus land contamination control; and, (c) setting priorities between environmental and non-environmental expenditures. This report is concerned with layers (a) and (b); it does not address (c). The report presents both the methodologies for determining priorities and the rankings that emerge when the methodologies are adapted.. 3.2 Overview of methodologies for setting priorities in environmental policy This chapter presents the methodologies for setting priorities in environmental policy, while the results from applying these methodologies are presented in Chapters 4, 5 and 6. Priority assessment is taken to be in the context of an environmental budget. The underlying methodology required is that of cost-effectiveness, i.e. maximising the benefit to be obtained per Euro of expenditure. The rationale for adopting cost effectiveness as the basic criterion is simple: expenditures that do not maximise effectiveness could have been used for other purposes either within the environmental budget or outside it. Hence, failure to pursue cost effectiveness means that environmental benefits, or some other benefit, such as gains in employment, is being lost for the same expenditure of money. Unfortunately, information on the costs of implementing environmental policies in the Netherlands or indeed anywhere in the EU, is extremely limited. As a result, the report focuses on the evidence relating to the effectiveness of policy, i.e. the benefits to be obtained. It has to be understood that in the absence of data on the costs of implementing policies, these measures of effectiveness provide. 5. Pollution abatement is defined as the expenditures on abatement of air, water and noise pollution and includes expenditures made by government, industry, household and other organisations..
(28) page 28 of 194. EFTEC/RIVM report 481505 024. only part of the picture necessary for establishing priorities. Their primary purpose is one of ‘demonstrating’ the importance of an issue and providing a first approximation of priorities. Taking cost effectiveness as the basic tool for setting priorities presupposes that there is an agreement on what constitutes ‘effectiveness6’. Effectiveness measures can take many forms, those adopted in this report are: a). monetary damage estimation, i.e. finding the ‘willingness to pay’ (WTP) of individuals for changes in environmental quality and changes in environmental assets, (Section 3.3). This indicator underlies the cost benefit analysis approach (discussed in Part II: Integrating CostBenefit Analysis into the Policy Process);. b). public opinion, i.e. measures of ‘human wellbeing’ based on individual preferences as revealed by public opinion polls (Section 3.4); In practice the information on public preferences for environmental policy at the level of detail required for priority setting is extremely limited, and. c). expert opinion, for example, based on the opinions of the steering group for this report. The steering group suggested that the seven environmental issues considered in this study are of general priority for the Netherlands.. It is important to note that three methods used to assess effectiveness use different bases. The monetary damage and public opinion approaches are based on individual preferences, whilst the final method is based on expert opinion. The DALY methodology is also based on expert opinion since different DALYs are weighted by experts (refer to Section 4.8.2) We make no argument here as to which is more important. This is an ongoing debate and it is well known that expert and public opinion on environmental risks can diverge widely. Determining priorities using these approaches is difficult. The main problem is the substantial gaps in knowledge concerning the quantitative scale of environmental damages in both physical and monetary terms and the absence of detailed public opinion research. There is the additional problem due to the absence of detailed assessments of the costs of policy measures. Because of these deficiencies, a judgmental procedure has to be used until better information is generated. Thus the suggested priorities that follow are the result of this judgmental procedure, citing wherever possible the evidence for supposing that issues are or are not of high priority.. 3.3 Monetary damage estimation methodology The methodology used here for the monetary damage approach is similar to that used in the EC study ‘European Environmental Priorities: an Integrated Economic and Environmental Assessment’ (RIVM et al., 2000). Each environmental issue is assessed separately. The methodology presented is explained in terms of air pollution, although noise follows the same outline. For contaminated land, we make use of land lost, since the Step 2 (pollution to impact) is missing from the analysis, see Section 4.4 for methodological details. In general there are five steps necessary for the monetary damage approach. Figure 1 illustrates the five steps, which are listed below: 6. ‘Effectiveness’ measures relate to issues, (e.g. air pollution) and can be equated with ‘importance’, whereas ‘cost effectiveness’ tends to refer to an intervention, (e.g. air pollution policy). Thus the importance of an issue, such as local air pollution can be determined by measuring the risks associated with air pollution. The cost effectiveness of measures to control air pollution is directly related to the reduced risks, but also involves a reference to cost and to the potential for other benefits from the intervention besides reduced air pollution..
(29) EFTEC/RIVM report 481505 024. page 29 of 194. 1.. Inventory of pollutants: identify pollutants and estimate the tonnes of pollutant emitted, see Annex 6 on data flows of the 5th National Environmental Outlook;. 2.. Environmental impacts: identify the environmental impacts and quantify them in physical units by use of dose / exposure response functions where possible;. 3.. Monetary values: estimate the unit cost of the impacts identified above in monetary units;. 4.. Monetary damage estimation and aggregation: estimate mean aggregate monetary value of the environmental impacts for each environmental issue and sum, and. 5.. Uncertainty and sensitivity analysis: test the effects of different assumptions, or possible ranges of values for different pollutants, on the final results.. The notation presented in Figure 3.1 is as follows: i j bij STOCKij ρAj P. = impact; = pollutant; = coefficient linking ambient concentration Aj to a given physical damage; = stock of receptors at risk of suffering the given damage; = change in ambient concentration of pollutant j; = price..
(30) page 30 of 194. EFTEC/RIVM report 481505 024. Step 1 Current Legislation Scenario Tonnes of pollutant emissions. Step 2 Impact assessment Dose/exposure response functions. Bottom-up (modelling). Top-down ∆Aj = ∆Ej. Impactj = bj . STOCKj . ∆Aj. Step 3: bottom up Monetary damage per impact Euro / impact. Step 3: top down Monetary damage values Euro / unit of pollutant Note that: embedded in this value are: (Euro / impact) x (impact / pollutant) = Euro / pollutant (or bottom-up step 3). Step 4. Step 4. Total monetary damage Euro (known as the cost of impact or benefit of control). Total monetary damage Euro (known as the cost of impact or benefit of control). Monetary damage = Pi .bi. STOCKi . ρAi Euro = (Euro/impact). (impact/pop.poll).(pop).(poll). Monetary damage = Pj . Ej Euro = (Euro / tonne) x (tonnes of pollutant). Step 5 Sensitivity analysis Confidence intervals Figure 3.1. The five steps to monetary damage estimation.
(31) EFTEC/RIVM report 481505 024. Step 1:. page 31 of 194. Inventory of pollutants. This step contains the emission levels of the relevant pollutants. RIVM present data for the current status of each environmental issue and the expected future progress given the environmental policies already in place in the Netherlands and the EU. This is referred to as the 'current legislation scenario' (CLS). The data are drawn mainly from the Fifth National Environmental Outlook7 for the Netherlands (draft report) (final available in July 2000). Data are expressed as tonnes of each pollutant, or exposure levels to different noise bands. All assumptions that are made in reaching the CLS are clearly stated.. Step 2:. Environmental impacts. Current monetary valuation literature concentrates on the following environmental impacts for some air pollutants. The impacts considered are analysed in five categories of receptors: • • • • •. human health (morbidity and premature mortality); buildings and materials; crops; ecosystems, and climate change impacts (other than those included in the above).. Dose / exposure response functions8 permit the impacts to be quantified and feed into the next stages of the methodology. Dose / exposure response functions (D/ERF) measure the relationship between a unit concentration of a pollutant and its impact on the relevant receptor. With sufficient information about D/ERF it is possible to estimate the size and type of the environmental impact per pollutant, if we know the size of the relevant receptor, e.g. human population. Some assumptions about pollution dispersion are also needed. The simplest way of using D/ERFs for physical damage assessment is:. Physical damage = Σbij . STOCKij.. ∆Aj Where i is impact and j is pollutant, bi is the coefficient linking ambient concentration Aj to a given physical damage, STOCKij is the stock of receptors at risk of suffering the given damage (e.g. the human population exposed to pollution) and ∆Aj is the change in ambient concentration of pollutant j. In all cases, the stock at risk is defined as those receptors actually exposed to the pollutant in question. There are two ways of using D/ERFs equations; (i) ‘modelling’, otherwise known as ‘bottom-up’ approaches, or (ii) ‘top-down’ approaches. The ‘bottom-up’ approach makes use of D/ERFs directly, they are applied to the stock at risk and emissions data for first hand calculations. Examples of the bottom-up approach in this study are the health impacts of exposusre to PM10 and low level ozone (O3), where, dose-response functions for different health end points are known for the Netherlands (and at the European level) and these are combined with population at risk data, concentrations of PM10 / O3 and WTP to avoid each health end point to give total damage to human health due to PM10 / O3. Thus all variables are measured with the exception of bi which is usually borrowed from the literature (though it too may be estimated given sufficient time and resources). The extensive EU research programme called ExternE (CEC 1995 and 1997) uses this method. The D/ERFs used in this study are reported in appendices to the relevant chapters.. 7. This report is prepared for the 4th Dutch Environmental Policy Plan, to be published in early 2001. The term's ‘dose-response’ and ‘exposure-response’ functions are used interchangeably throughout this report. They are used to describe the response to a given exposure of a pollutant in terms of atmospheric concentration, rather than an ingested dose.. 8.
(32) page 32 of 194. EFTEC/RIVM report 481505 024. The ‘top-down’ approach makes a simplifying assumption that the relationship between emissions and concentrations is linear and directly proportional. This implies that if emissions of a pollutant increase by x%, the concentration of that pollutant in the area concerned is assumed to increase by x% as well, i.e. ∆Aj = ∆Ej Where, ∆ is change in, Aj is ambient concentration and Ej is emissions of pollutant j. Combining this assumption with that of a constant coefficient bi (implied in both approaches) implies that physical damages per unit of emissions are assumed constant in the ‘top-down’ approach. Therefore, it is not necessary to use D/ERFs directly, but it suffices to use the average Euro per unit of pollutant, which was originally estimated using D/ERFs. Adopting the ‘top-down’ assumption of linearity is generally justifiable, as many validated models are linear, at least for primary pollutants. The ‘top-down’ method bypasses Step 2 and uses the results of Step 3 directly. Thus we see that the ‘topdown’approach uses information and data from other studies that are brought together and applied to the current context for secondary calculation. For purposes of transparency all D/ERFs embedded within the unit damage values are reported at the end of the relevant sections (Section 4.4 on acidification) so that estimates may be compared and updated more easily as the literature develops.. Step 3:. Monetary values. Following on from Step 2 there are also two ways of using monetary values to measure the damage of pollutants. Since the ‘bottom-up’ approach measures the physical impact per unit of pollutant, the necessary monetary value is that per physical impact (e.g. WTP to avoid a case of cardiovascular disease). This is a first hand calculation of damage (e.g. Euro / impact). The difficulties with this approach lie in both finding the right estimates for WTP and in estimating the D/ERF. This is because the relationship between emissions and concentrations can vary across sites and over time, as do the receptors or ‘stock’ exposed to the pollution. For examples of the ‘bottum-up’ approach see the analysis on particulate matter and low level ozone. The ‘top-down’ approach discussed in Step 2 conducts a secondary calculation for damage. The only monetary value the ‘top-down’ approach requires is the final damage value given in the form of Euro per unit of pollutant. This is because physical and monetary measures of environmental impacts are already embedded within the estimate of damage of Euro per unit of pollution, i.e. Euro / pollutant comes from (Euro / impact) x (impact / pollutant). In order to make use of the ‘top-down’ approach, it is necessary to take ‘bottom-up’ step 3 results from other studies. This means the original values are applied outside of the site context where the original study was carried out. Using the results of an original study for another context / site, is called ‘benefits transfer’. For further details regarding benefits transfer, refer to the Annex 2 on Benefits Transfer. Due to the time and budget limitations of this study, it has been necessary to rely mainly on the ‘topdown’ approach to estimate the benefits of environmental control. For example, for air pollutants, we make use of both ExternE (1995 and 1997) and AEA Technology (1999), studies which both follow the ‘bottom-up’ approach. For each environmental issue, we conduct a literature review of valuation studies in the Netherlands and in the rest of Europe9 in order to pull out the most reliable 'willingness to pay' (WTP) estimates to avoid environmental damage. The majority of the studies to be used are conducted outside the Netherlands thus, the ‘willingness to pay’ (WTP) estimates are adjusted to reflect Dutch WTP values. The rationale for the adjustments to WTP are given below together with an explanation of how it is achieved: 9. Techniques for the monetary valuation of environmental damage are not reviewed here. Detailed descriptions of methodology can be found in Freeman (1993)..
Afbeelding
+7
GERELATEERDE DOCUMENTEN
Beeldgeleide chirurgie is in een stroomversnelling geraakt en zal binnen korte tijd een methode zijn die niet meer uit de operatie kamer weg te denken is. Jodium 125
At the end of the seventies SWOV made a beginning with a research into criteria for the safe layout of the entire Netherlands road net inside and outside the built-up area. The
In order to be better prepared to support RDM practices, the University of Victoria Libraries, with the support of the Office of Research Services, conducted a mixed methods study
Daarentegen is de belastingdruk voor de glastuinbouw per Euro omzet – zowel het algemene tarief als het tuinbouwtarief - relatief hoog ten opzichte van de industriële
During the optimization phase must be distinguished between obvious manufacturing defects like wavy laminates within high loaded fiber layers which will result in a
Wanneer er sprake is van een groep kinderen met verschillende sensorische behoeften moet de pedagogisch medewerker er eerst voor zorgen dat de prikkels die zij produceert voor
To investigate whether rewetting of drained fen peat- lands leads to microbial recovery, we studied the vertical depth strati fication of microbial communities and predicted
Ce ni- veau se marquait par une terre à peine plus foncée que le sol en place, conte- nant quelques fragments de torchis, des charbons de bois et des tessons d'une
