using wearables and machine learning
Assessing the physical capabilities of sportsman
Academic year 2019-2020
Master of Science in de informatica
Master's dissertation submitted in order to obtain the academic degree of
Counsellors: Prof. dr. ir. Toon De Pessemier, Kris Vanhecke
Supervisor:
Student number: 01206141
Abstract (Dutch)
Methode
Het doel van deze masterthesis is om machine learning te gebruiken voor een digitale personal coach te ontwikkelen. 2 onderdelen van deze coach zijn geïsoleerd: een model dat de huidige activiteit van een gebruiker kan classificeren en een model dat de cardiovasculaire fitness van de gebruiker kan meten. De belangrijkste metriek gebruikt is hartslagvariabiliteit. HSV is ruim onderzocht in de medische sector in de context van hartziektes en hartaandoeningen. Deze thesis poogt deze bestaande research te hergebruiken en toe te passen op cardiovasculaire fitness en machine learning.
Gezonde jongvolwassenen werden gevraagd om een fitness-regime te fietsen op een hometrainer, hun hartslage werd gemeten en een aantal meta-data punten werden genoteerd. In totaal bestaat de dataset uit 23 testpersonen, voor een totaal van ~95000 hartslagen.
Resultaten
De volgende netwerken werden gestest voor de classificatie van de huidige activiteit-staat: LSTM (~58% accuraatheid), Deep LSTM (~65% accuraatheid), DeepHeart (~62% accuraatheid), DeepHeartV2 (~75% accuraatheid), TCN (~85% accuraatheid). De dataset voor het trainen van het fitheid-niveau model bleek te klein te zijn voor een resultaat te bereiken.
Conclusie
De voorgestelde netwerken slaagden er in om tot ~85% accuraatheid te bereiken voor de activiteit-staat classification. Dit is een redelijk positief resultaat, maar nog niet toepasbaar voor een matuur product.
Echter, hoewel het onmogelijk is om de validiteit van de gebruikte methoden volledig aan te tonen totdat meer data verzameld is, beide onderdelen werden onderzocht en gevalideerd met behulp van vaak-geciteerde en collegiaal getoetste studies.
Abstract (English)
Method
The goal of this master thesis is to use machine learning to develop a digital personal coach for sport activities. 2 subgoals have been isolated: A model capable of classifying the activity state of the user and a model to gauge the cardiovascular fitness level of the user. The primary measurement used is Heart Rate Variability. HRV has been a subject of research in the medical community and can be used to predict various cardiovascular diseases or conditions. This thesis attempts to reapproriate the existing HRV research for cardiovascular fitness and machine learning.
Healthy young adults were asked to perform a specific fitness training session on a stationary bicycle, their heart rate response was measured and various meta-datapoints were noted. In total 23 test subjects were added to the data set, resulting in ~95.000 timesteps of hearbeat data.
Results
The following models were tested for activity state classification: LSTM (~58% accuracy), Deep LSTM (~65% accuracy), DeepHeart (~62% accuracy), Deep-HeartV2 (~75% accuracy), TCN (~85% accuracy). The number of participants in the study was too little to develop the base-level fitness regression.
Conclusion
The proposed networks managed to achieve up to ~85% accuracy on activity state classification. This is a fairly positive result, but not yet applicable for real-world scenarios.
However, while it is impossible to fully prove the validity of the applied methods until more data is gathered, both subgoals were explored and validated using heavily cited, peer-reviewed studies.
Extended abstract
Background
People who practice sports occasionally, often have no or very limited support and guidance. People can download a fitness scheme or app from the internet, but these schemes are rarely personalized to the physical capabilities of that person. Moreover, these schemes are usually static and do not take into account the real progress that a user has made or personal goals. Nowadays, the technological advances allow a more accurate monitoring of the user. Smart watches have become more and more popular. Heart rate sensors are becoming cheap and commonplace. Computational power of wearables and smartphones is increasing, which makes running complex tasks such as light-weight machine learning more of a reality.
Method
The goal of this master thesis is to research the possibility of using machine learn-ing to develop a digital personal coach for sport activities. 5 Subgoals were de-termined to be required to achieve this goal, 2 of which have been isolated for development.
• A model capable of classifying the state of the user. Are they resting, active, recovering, under intense exertion, …
• A model to gauge the cardiovascular fitness level of the user.
The primary measurement used is Heart Rate Variability. This is the miniscule variability in time between heartbeats and is the result of a multitude of complex interactions between various hormonal and nervous systems of the body. HRV has been a subject of research in the medical community and can be used to predict various cardiovascular diseases or conditions. Current generation heart rate mon-itors are able to monitor HRV to a respectable degree compared to medical grade electrocardiogram machines, so the timing is right to attempt to reappropriate the existing HRV research for cardiovascular fitness and machine learning. In this master thesis the Polar H7 (a HRV-capable chest strap) is used to measure heart rate data from test subjects. Healthy young adults were asked to perform
a specific fitness training session on a Kettler ergometer x3, their heart rate re-sponse was measured and various meta-datapoints were noted. A Polar plug-in adapter was used to synchronise the measurements between the chest strap and the stationary bicycle. In total 27 test subjects were gathered, of which 23 were able to fully complete the session, resulting in ~95.000 timesteps of hearbeat data. From the heart rate measurements extra features were engineered based on the established relevancy to physical fitness. These features were then labeled and used as training data for the heart rate classifier. For the base-level fitness regres-sion, a formula is established to give a “fitness score” based on results of the test subject. With some post-processing the heart rate measurements are reduced to a fixed amount of datapoints as input. Multiple deep neural networks are tested and evaluated for the classifier and regression tasks.
Results
For the activity state classification task, the proposed networks stem from either natural language processing or earlier experimentations involving machine learning and heart rate data. The following accuracies were achieved:
Model Accuracy LSTM ~58% Deep LSTM ~65% DeepHeart ~62% DeepHeartV2 ~75% TCN ~85%
The number of participants in the study was too little to develop the base-level fitness regression. Additional test subjects would be required for a adequate con-clusion.
Conclusion
The proposed networks managed to achieve up to ~85% accuracy on activity state classification. This is a fairly positive result, but not yet applicable for real-world scenarios.
However, while it is impossible to fully prove the validity of the applied methods until more data is gathered, both subgoals were explored and validated using heavily cited, peer-reviewed studies.
Verlengd abstract
Achtergrond
Personen die af en toe sporten, krijgen vaak weinig tot geen ondersteuning en begeleiding. Deze personen kunnen een fitness-schema of app downloaden van het internet, maar deze schemas zijn zelden gepersonaliseerd op basis van de fysieke capabiliteiten van de gebruiker. Daarbovenop zijn deze schemas vaak statisch en houden ze geen rekening met de vooruitgang die de gebruiker boekt of de persoon-lijke doelen van de gebruiker. Hedendaagse techonologische vooruitgang heeft er voor gezorgd dat accurate meting van de gebruiker gemakkelijk en bereikbaar zijn. Hartslagsensoren worden goedkoper en wijder gebruikt, de rekenkracht van deze draagbare toestellen en smartphones neemt gestaag toe, wat het steeds realistis-cher maakt om complexe taken (zoals simpele machine learning taken) hierop uit te voeren.
Methode
Het doel van deze masterthesis is om machine learning te gebruiken voor een digitale personal coach te ontwikkelen. 5 onderdelen werden geïsoleerd, waarven er uiteindelijk 2 uitgewerkt zijn:
• Een model dat de huidige activiteit van een gebruiker kan classificeren. Is de gebruiker in rust, actief, aan het recuperen, onder intense inspanning, …? • Een model dat de cardiovasculaire fitness van de gebruiker kan meten.
De belangrijkste metriek gebruikt is hartslagvariabiliteit. Dit is de miniscule vari-abiliteit in tijd tussen hartslagen en is het resultaat van een groot aantal complexe interacties tussen verschillende hormonale systemen en zenuwstelsels. HSV is ruim onderzocht in de medische sector in de context van hartziektes en hartaandoenin-gen. Nieuwe generatie hartslagmonitoren zijn in staat om deze HSV te meten op een niveau dat medische electrocardiogram-apparatuur bijna evenaart. Het is de opportune tijd om deze bestaande research pogen te hergebruiken en toe te passen op cardiovasculaire fitness en machine learning.
In de thesis wordt de Polar H7 (een HSV-capabele borstband hartslagmonitor) gebruikt om hartslag data van proefpersonen te meten. Gezonde jongvolwasse-nen werden gevraagd om een fitness-regime te fietsen op een Kettler Ergometer
X3 hometrainer, hun hartslagrespons werd gemeten en een aantal meta-data pun-ten werden genoteerd. Een Polar plugin adapter werd gebruikt om deze data te synchroniseren tussen de borstband en de hometrainer. In totaal werden 27 proefpersonen verzameld, waarvan 23 in staat waren om het volledige regime te voltooien, met ca. 95.000 hartslagen aan data als resultaat.
Van deze hartslagdata werden een aantal features verwerkt, gebaseerd op de geves-tigde relevante metrieken voor fysieke fitness. Deze features werden vervolgens gelabeled en gebruikt als trainings data voor de hartslag classificeerder. Voor de fitness-regressie werd een formule ontwikkeld om een “fitness score” toe te kennen aan de proefpersonen op basis van hun resultaten van het regime. Met een kleine hoeveelheid post-processing werd de hartslagdata van een regime verwerkt tot een vaste hoeveelheid datapunten die kan dienen als input. Verschillende netwerken worden getest en geëvalueerd voor beide taken.
Resultaten
Voor de hartslag classificeerder werden netwerken gebruikt die ontwikkeld zijn voor Natural Language Processing, of netwerken die in eerdere experimenten m.b.t. hartslag data gebruikt zijn. De volgende accuraatheid werd behaald:
Model Accuraatheid LSTM ~58% Deep LSTM ~65% DeepHeart ~62% DeepHeartV2 ~75% TCN ~85%
De dataset voor het trainen van het fitheid-niveau model bleek te klein te zijn voor een resultaat te bereiken. Meer proefpersonen zouden nodig zijn om tot een conclusie te komen voor deze taak.
Conclusie
De voorgestelde netwerken slaagden er in om tot ~85% accuraatheid te bereiken voor de activiteit-staat classification. Dit is een redelijk positief resultaat, maar nog niet toepasbaar voor een matuur product.
Echter, hoewel het onmogelijk is om de validiteit van de gebruikte methoden volledig aan te tonen totdat meer data verzameld is, beide onderdelen werden onderzocht en gevalideerd met behulp van vaak-geciteerde en collegiaal getoetste studies.
Lay summary
Background
People who practice sports occasionally, often have no or very limited support and guidance. People can download a fitness scheme or app from the internet, but these schemes are rarely personalized to the physical capabilities of that per-son. Moreover, these schemes are usually the same for every participant and do not take into account the real progress that a user has made or personal goals. Nowadays, the technological advances allow a more accurate monitoring of the user. Smart watches have become more and more popular. Heart rate sensors are becoming cheap and commonplace. Processing power of these smartwatches and smartphones is increasing, which makes running complex tasks such as light-weight machine learning more of a reality.
Method
The goal of this master thesis is to research the possibility of using AI to develop a digital personal coach for sport activities. Of the components determined to be required to achieve this goal, 2 were researched in this document.
• Software capable of determining how active the user is. Are they resting, active, recovering, under intense exertion, …
• Software capable of calculating how fit the user is and giving them a “fitness score”.
The primary measurement used is Heart Rate Variability. This is the miniscule difference in time between heartbeats. HRV has been a subject of research in the medical field and can be used to predict various heart diseases or conditions. Current generation heart rate monitors are able to monitor HRV to a respectable degree compared to medical grade monitors, so the timing is right to attempt to use the existing HRV research for calculating fitness in the human body using machine learning.
In this master thesis the Polar H7 (a HRV-capable chest strap) is used to measure heart rate data from test subjects. Healthy young adults were asked to perform a specific fitness training session on a Kettler ergometer x3, their heart rate response was measured and various extra information about the subject was noted. In total
27 test subjects were gathered, of which 23 were able to fully complete the session, resulting in ~95.000 heartbeats data.
On machine learning
Machine learning is a type of artificial intelligence where a stack of mathematical “neuron” layers is made to learn by example. Each of these layers is nothing more than an amount of cells, where each cell is able to receive various inputs, perform a calculation, and pass the result of this calculation on to one or more neurons in the next layer. The sequence of layers are called a “network” and are structured so that the output of the very last layer is a class (in the case of classifying networks) or a score (in case of regression networks). There are more possible use-cases of networks but the thesis is limited to these two.
If a network is designed to find the difference between a dog and a cat, we can show it 100 cat pictures and 100 dog pictures. The algorithm does not know which ones are which, but after letting the network decide on its own we can find out which pictures were predicted correctly and which weren’t. Through a concept called “backpropagation” we are capable of showing the network where it went wrong so it can adjust its network to better predict this so-called “training data”. By repeating this training session over and over with massive amounts of data, the network will eventually be able to accurately classify pictures as “Dog” or “Cat”, even pictures that it has never seen before.
In this thesis, the input data is not “Dog” or “Cat” pictures, but instead sequences of the timing measurements of 128 heartbeats. The output is not the type of animal, but rather how active the user was during time of measurement.
In the case of the fitness scorer, the output of the AI is a number roughly corre-sponding to how fit a user is.
Results
For determining how active the user is, we based ourselves on existing networks, particulary ones designed and used in text recognition, or ones that were made to find heart conditions. Each model is graded on the percentage of sequences it could correctly classify:
Model Accuracy LSTM ~58% Deep LSTM ~65% DeepHeart ~62% DeepHeartV2 ~75% TCN ~85%
The number of participants in the study was too little to create a network that can give a fitness score. Additional test subjects would be required.
Conclusion
The proposed networks achieved up to ~85% accuracy. This is a fairly positive result, but not yet up to par for a real-life fitness coach.
However, while it is impossible to fully prove if the applied methods work until more data is gathered, both subgoals were heavily researched and validated using peer-reviewed studies.
Acknowledgements
My appreciation goes out to prof. dr. De Pessemier for providing the opportunity to dig my teeth into this topic, which made me research two completely different fields that both interest me a lot.
My eternal gratitude for all the people and organisations that made me extend my academic career for 3 years longer than intended; Gentse 12urenloop vzw for showing that even IT can require getting your hands dirty. Student Kick-Off vzw for providing the greatest opportunity any student could receive and trusting me to tackle it. FaculteitenKonvent Gent vzw for opening the door to the wide world of student engagement at Ghent University. And last but certainly not least, Zeus WPI for providing the springboard towards these experiences. Without the setbacks that we overcame and the experience that was gained, I would never have made it this far.
Thanks to Lorin Werthen for joining me in most of these endeavours and being a voice of guidance into any and all things machine learning.
Thanks to Caroline De Brouwer, Francis Begyn, Lisa Dangreau, Niko Strijbol, Sofie De Clerck, Frankie De Clerck & Felix Van der Jeugt for proofreading this document.
De auteur geeft de toelating deze masterproef voor consultatie beschikbaar te stellen en delen van de masterproef te kopiëren voor persoonlijk gebruik. Elk ander gebruik valt onder de bepalingen van het auteursrecht, in het bijzonder met betrekking tot de verplichting de bron uitdrukkelijk te vermelden bij het aanhalen van resultaten uit deze masterproef.
Table of Contents
Abstract (Dutch) . . . i Methode . . . i Resultaten . . . i Conclusie . . . i Abstract (English) . . . ii Method . . . ii Results . . . ii Conclusion . . . iiExtended abstract . . . iii
Background . . . iii Method . . . iii Results . . . iv Conclusion . . . iv Verlengd abstract . . . vi Achtergrond . . . vi Methode . . . vi Resultaten . . . vii Conclusie . . . vii Lay summary . . . ix Background . . . ix Method . . . ix On machine learning . . . x Results . . . x Conclusion . . . xi Acknowledgements xii 1 Introduction 1 1.1 Goal . . . 1
1.2 Scope of the thesis . . . 2
1.4 Methodology . . . 3
1.4.1 Data Gathering . . . 3
1.4.2 Machine learning . . . 4
2 Medical Background 6 2.1 Anatomy of the heart . . . 6
2.2 Innervation of the heart . . . 7
2.3 Physiological function of the heart . . . 9
2.3.1 Nerval stimulation . . . 9
2.3.2 Ectopic Beats . . . 13
2.3.3 Heart Rate . . . 13
2.3.4 Heart Rate variability . . . 14
2.3.4.1 Time Domain . . . 15
2.3.4.2 Frequency Domain . . . 15
2.3.5 Heart Rate Recovery . . . 16
2.3.6 Cardiac Output . . . 16
2.4 Measuring heart rate . . . 17
2.4.1 Phonocardiogram (PCG) measurement . . . 17
2.4.2 Electrocardiogram (ECG) measurement . . . 18
2.4.3 Photoplethysmogram (PPG) measurement . . . 18
2.5 Physical fitness . . . 19
2.5.1 Fitness metrics . . . 20
2.5.1.1 VO2max & Aerobic capacity . . . 20
2.5.1.2 Baecke Score . . . 21
2.5.1.3 Blood Lactate levels . . . 21
2.5.1.4 Heart Rate variability . . . 21
2.5.1.5 Heart Rate Recovery . . . 22
2.5.2 Fitness Training . . . 23
2.5.2.1 Detraining . . . 24
2.5.2.2 Overreaching spectrum . . . 24
2.5.2.3 Overtraining syndrome . . . 25
3 Data Gathering 27 3.1 RR interval filtering and correction . . . 28
3.2 Heart rate metrics feature engineering for the classification task . . 29
3.2.1 RR interval . . . 30
3.2.2 Current Heart Rate . . . 30
3.2.3 Current Heart Rate Variability . . . 31
3.2.5 Resting Heart Rate . . . 31
3.2.6 HRV Time domain . . . 31
3.2.7 HRV Frequency domain . . . 32
3.2.8 Classification . . . 32
3.3 Subject Variables for the regression task . . . 32
3.3.1 Fitness score . . . 33
3.3.2 Input data . . . 33
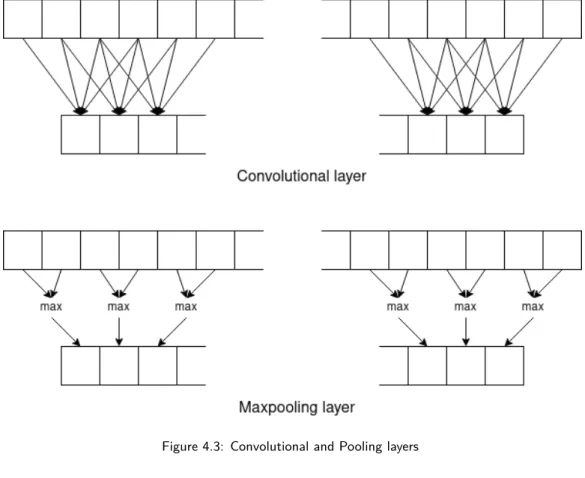
4 Implementation 36 4.1 Activity State Classification . . . 36
4.1.1 Long Short Term Memory . . . 38
4.1.2 Deep LSTM . . . 39
4.1.3 DeepHeart . . . 39
4.1.4 DeepHeart v2 . . . 40
4.1.5 Temporal Convolutional Network . . . 42
4.1.6 Labeling methods . . . 43
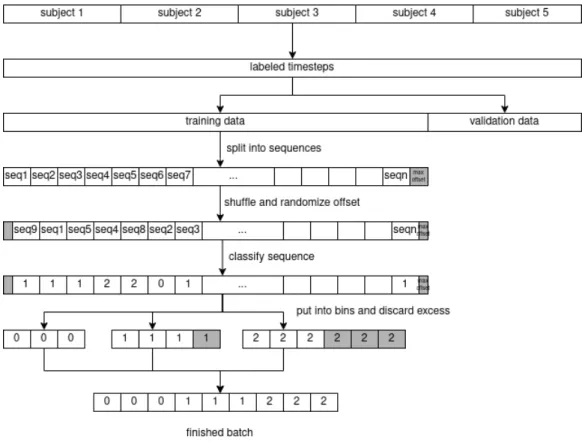
4.1.7 Seq2Seq Classification . . . 44
4.2 Base-level fitness regression . . . 44
5 Conclusion 46 5.1 Learning points . . . 46
5.2 Future work . . . 46
Appendix A: Network Summaries 48 LSTM network summary . . . 48
Deep LSTM network summary . . . 48
DeepHeart network summary . . . 49
DeepHeartV2 network summary . . . 50
TCN network summary . . . 51
Appendix B: Abbreviations 53
Chapter 1
Introduction
1.1
Goal
The goal of this master thesis is to research the possibility of using machine learn-ing to develop a digital personal coach for sports activities. It should be able to measure and track the performance of the user and suggest appropriate training sessions that result in an increase in cardiovascular fitness. In ideal conditions, a fully mature fitness coach should, therefore:
• Be able to determine a “base fitness level” of the user during the initialisation of the coaching program. This would be a machine learning regression task on labeled, batched sequence data to determine a certain “fitness level score” • Be able to determine the increase or decrease of the cardiovascular fitness of
the user through unlabeled monitoring. This would be a machine learning regression task on unlabeled, batched sequence data to update the previously acquired “fitness level score”
• Permanently track the user and classify their current “activity state”, op-tionally be able to automatically count periods of increased activity as a workout session. This would be a machine learning multi-label classification task on unlabeled, real-time sequence data to determine the current exertion level on a short-term timescale (30-60 seconds).
• Be able to track a user during their training session and provide feedback to keep the user in the optimal exertion range. This is a machine learning
multi-label classification task on unmulti-labeled, real-time sequence data to determine the current exertion level on a very short-term timescale (5-10 seconds). • Compile the result of a workout session to gauge the intensity and the effect
on the body of the user. At this point, it should be able to determine the fatigue state of the user so that the coach can take this into account. This would be a machine learning classification task on labeled, batched sequence data to determine a fatigue state.
• Suggest the user what kind of workout to perform next and how long to recover from recent workouts. This would be a recommender system task that can accurately predict so-called overreaching in the user.
1.2 Scope of the thesis
To limit the scope of this master thesis, only the first three of these goals will be researched in-depth, the first two have been combined into 1 multipurpose model.
• A model to gauge the cardiovascular fitness level of the user. Re-applying this model during different stages of the coaching period would be able to gauge the increase and decrease of the fitness level.
• A model capable of classifying the state of the user. Are they resting, active, recovering, under intense exertion, …
The primary measurement used is Heart Rate Variability (HRV). This is the mi-nuscule variability in the time between heartbeats and is the result of a multitude of complex interactions between various hormonal and nervous systems of the body. HRV has been a subject of research in the medical community and can be used to predict various cardiovascular diseases or conditions. Current genera-tion heart rate monitors can monitor HRV to a respectable degree compared to medical-grade electrocardiogram machines, so the timing is right to attempt to reappropriate the existing HRV research for cardiovascular fitness and machine learning. This however excludes the increasingly popular “smartwatches” that monitor heartrate using the less accurate light-based PPG method, as this method is incapable of measuring HRV.
1.3
Why only heart rate
While modern smartphones are almost always equipped with various sensors that can facilitate data-gathering (such as accelerometers, pedometers, GPS-trackers, …), this thesis will focus on heart rate and its variability only. HRV has been shown to be a marker of conditions such as epilepsy, Parkinson, multiple sclerosis [1], stress resilience [2], and even sudden death from cardiac causes [3].
Closer related to the subject of a fitness coach, it has been shown that habitual aerobic exercise plays a role in maintaining augmented HRV [4], that HRV is likely to be sensitive to training adaptation [5] and that HRV might be a better measure of cardiovascular fitness than post-exercise Heart Rate Recovery [6].
Limiting the subject to Heart Rate Variability reduces complexity and introduces less unknown variables, which should result in a clear conclusion of whether HRV is a suitable subject for further research and continued development.
1.4
Methodology
1.4.1 Data Gathering
Participants were asked to strap on a Polar H7 HRV-capable chest heart rate monitor and perform a specific fitness training session on a Kettler Ergometer X3. Beat-to-beat intervals were measured and stored using the Elite HRV Android app, which can export these values into text files where each line represents the milliseconds between 2 beats.
The Kettler Ergometer X3 is equipped with an electromagnetic braking system that adapts to the cycling strength of the user. Brake horsepower (BHP) is de-termined by output torque and rotational speed, so the Ergometer measures the rotational speed of the user and provides adequate braking power so that the user is forced to provide the preset BHP to keep the rotational speed constant. This BHP is provided in Wattage (Joule per second).
The Ergometer is also able to count the energy spent during the various stages of the session. As the power is equal to energy over time, determining energy is simply a matter of multiplying the power determined earlier with the time spent at this power output.
The session consisted of the following stages:
• A 2-minute stage in sedentary rest.
• A 5-minute stage in which the subject provides 50 Watt (0.067 BHP) at 50 rotations per minute.
• A 5-minute stage in which the subject provides 100 Watt (0.134 BHP) at 50 rpm.
• A 2-minute stage of recovery in sedentary rest.
• A 5-minute stage in which the subject tries to maintain 115-120 bpm heart rate (equals to around 60% of the theoretical maximum heart rate of young adults).
• A 2-minute stage of recovery in sedentary rest.
• A 5-minute stage in which the subject tries to maintain 155-160 bpm heart rate (equals to around 80% of the theoretical maximum heart rate of young adults).
• A 1-minute stage in which the subject cycles at maximum exertion. • A 13-minute stage of recovery, of which 4 minutes are kept for analysis.
Additionally, the following meta-data is noted:
• The Rating of Perceived Exertion (RPE) of each session.
• The energy spent during the three “constant heart rate” sessions. • The distance traveled during the three “constant heart rate” sessions. • The Baecke questionnaire scores of the subject.
The reasoning behind the methodology of this data gathering session is explained in-depth in chapter 3. In total 27 test subjects were gathered, of which 23 were able to fully complete the session, resulting in ~95.000 timesteps of heartbeat data.
1.4.2 Machine learning
Various sequence learning and established Natural Language Processing (NLP) techniques are tested and compared for the activity state classification task:
• A standard Long Short Term Memory (LSTM) network. • A deeply layered LSTM network.
• An experimental “DeepHeart” network that was successfully used to diag-nose various medical conditions [7].
• A bespoke evolution of DeepHeart.
• A Temporal Convolutional Network (TCN).
Various convolutional and residual networks are tested for the base-level fitness regression task.
These networks are written in Python 3.8.3, created using Keras, which uses the Tensorflow 2 library to train these networks on a GTX 1070Ti CUDA-enabled graphics card.
Chapter 2
Medical Background
2.1
Anatomy of the heart
The heart is the organ responsible for pumping blood into the arteries and veins of the human body. It is located within the thorax (chest) in between the lungs, oriented slightly towards the left-hand side in its so-called mediastinum. The shape is slightly triangular, pointing towards the feet. The superior portion is called the base, and the inferior portion is called the apex.
The pumping action is provided by 4 chambers; the left and right side of the heart each have an atrium and a ventricle-. The atria act as a receiving chamber that contracts to push blood to the ventricles, which act as the primary pumping mechanism and propel it to either the lungs or the rest of the body. The atria receive blood on a nearly continuous basis, preventing flow from stopping while the ventricles are contracting.
Both sides of the heart have a distinct function. The right-hand side delivers deoxygenated blood into the pulmonary trunk, which leads toward the capillaries in the lungs where gas exchange occurs: Carbon dioxide exits the blood and oxygen enters. Highly oxygenated blood returning from these capillaries passes join together into the left atrium, which pumps the blood into the left ventricle, which in turn pumps the freshly oxygenated blood on to the many branches of the systemic circuit. Eventually, these vessels will lead to the various capillaries, where exchange with the cells of the muscles occurs. Oxygen and nutrients exit the capillaries to be used by the cells in their metabolic processes, and carbon dioxide and waste products, such as lactic acid and ADP, will enter the blood.
Not every muscle in the heart is equal. The atria only need to pump blood into the ventricles, so they are smaller. The muscle of the left ventricle is much thicker and better developed than that of the right ventricle, to overcome the high resistance required to pump blood into the long systemic circuit. The right ventricle does not need to generate as much pressure, since the path to the lungs is shorter and provides less resistance. With an average chamber volume of 70mL and an average heart rate of 75bpm, each chamber is capable of pumping 5250 mL blood per minute [8].
2.2 Innervation of the heart
Normal cardiac rhythm is established by the sinoatrial (SA) node, also known as the pacemaker of the heart. It initiates the sinus rhythm, or normal electrical pattern followed by contraction of the heart. The impulse is conducted from the SA node through a specialized internodal pathway, to the atrioventricular (AV) node. In addition, the interatrial band conducts the impulse directly from the right atrium to the left atrium. The wave of the electrical impulse spreads across the atria from the top to the bottom portions, pumping blood down into the ventricle. It takes approximately 50 milliseconds to travel from SA to AV node (figure 2.2, step 2 and 3).
The next step in the chain is the atrioventricular bundle. There is a critical pause before the AV node transmits the impulse to the AV bundle, partially attributable to the small diameter of the cells of the node which slows the impulse. This results in approximately 100ms delay for the impulse to pass through the node. This pause is critical to the heart function, as it allows the atrial muscles to complete their contraction that pumps blood into the ventricles before the impulse is transmitted to the cells of the ventricle itself (figure 2.2, step 4).
The AV bundle divides into two AV bundle branches, both descending and reach-ing the apex of the heart where they connect with the Purkinje fibers. This passage takes approximately 25 ms. The Purkinje fibers are additional conductive fibers that spread the impulse to the muscles in the ventricles. They extend from the apex of the heart toward the wall between the atrium and the ventricle, ending at the base of the heart. The Purkinje fibers have a fast inherent conduction rate, and the electrical impulse reaches all the ventricular muscle cells in about 75 ms. Since the electrical stimulus begins at the apex, the contraction also begins at the apex and travels toward the base of the heart, similar to squeezing a tube
of toothpaste from the bottom. This allows the blood to be pumped out of the ventricles. The total time elapsed from the initiation of the impulse in the SA node until the relaxation of the ventricles is approximately 225ms (figure 2.2, step 5).
The SA node, without external control, would initiate a heart impulse approx-imately 80–100 times per minute. While possible in some healthy individuals, rates lower than 50 beats per minute would indicate a condition called brady-cardia. With extreme stimulation by the SA node, the AV node can transmit impulses maximally at 220 per minute. This establishes the typical maximum heart rate in a healthy young individual. Higher rates are possible in hearts that are damaged or stimulated by certain drugs, but the heart can no longer effectively pump blood at these rates [8].
2.3
Physiological function of the heart
2.3.1 Nerval stimulation
The human body is a complex balancing act of various electrical and/or hormonal impulses.
The nervous system can be split up in a hierarchy. Starting from the full nervous system we can split 2 subsystems based on their location; the central nervous system (CNS) in the brain and spinal cord, and the peripheral nervous system (PNS) in the rest of the body. The peripheral nervous system can again be split up into 2 subsystems based on the control that we have over it: the somatic nervous system which handles voluntary signals and the autonomic nervous system (ANS) which handles involuntary signals. The autonomic nervous system can again be split up based on the context in which signals are sent: the sympathetic nervous system (SNS) which handles “fight-and-flight” reactions and the parasympathetic nervous system (PSNS) which handles “rest-and-digest” reactions.
Nervous control starts with two paired centers in the brainstem. The cardio ac-celerator regions stimulate activity via sympathetic stimulation, and the cardioin-hibitory centers decrease heart activity via parasympathetic stimulation. During rest, both centers provide stimulation to the heart, with a slight predomination for cardioinhibitory stimulation as the SA node left to its own devices would initi-ate a sinus rhythm of approximiniti-ately 100 bpm. This means that simply stopping
parasympathetic stimulation would lead the heart rate to increase to approxi-mately 100 bpm, but further increase requires sympathetic stimulation.
These (para-)sympathetic stimulations are fired upon various sensoric impulses, which are summed up in table 2.1 and table 2.2 [8].
Table 2.1: Major Factors increasing heart rate and force of contraction. [8]
Factor Effect Trigger
n. Cardioaccelerator Release of norepinephrine by cardioinhibitory nerves Proprioceptors In creased firing rates of positional sensors
Chemoreceptors detection of decreased levels of O2
Chemoreceptors detection of increased levels of H+, CO2 and lactic acid Baroreceptors falling blood volume/pressure
Limbic system Anticipation of physical exercise or strong emotions Catecholamines Increased epinephrine and norepinephrine release Thyroid hormones Increased T3 and T4 in the blood (released by thyroid) Calcium Increase in calcium ions in the blood
Potassium Decrease in potassium ions in the blood Sodium Decrease in sodium ions in the blood Body temperature Increase in body temperature
Stimulants Presence of nicotine, caffeine or other stimulants
Table 2.2: Major Factors decreasing heart rate and force of contraction. [8]
Factor Effect Trigger
n. Cardioinhibitor Release of acetylcholine by cardio accelerator nerves Proprioceptors In creased firing rates of positional sensors
Chemoreceptors detection of increased levels of O2
Chemoreceptors detection of decreased levels of H+, CO2 and lactic acid Baroreceptors rising blood volume/pressure
Limbic system Anticipation of relaxation by the limbic system
Catecholamines Increased (nor-)epinephrine release by the adrenal glands Thyroid hormones Decreased T3 and T4 in the blood (released by thyroid) Calcium Increase in calcium ions in the blood
Potassium Increase in potassium ions in the blood Sodium Increase in sodium ions in the blood Body temperature Decrease in body temperature
2.3.2 Ectopic Beats
An ectopic or premature heartbeat is when the heart either skips a beat or adds an extra beat. These are usually not a cause for concern (in fact occur commonly in adults), and are not necessarily an indication of irregular heart functionality. Increased stress or anxiety can induce ectopic beats in healthy individuals, but these can also be caused by lack of sleep, various recreational drugs (caffeine, alcohol, smoking, … ) or medicinal drugs (asthma inhalers, antibiotics, …)
There are two types of ectopic heartbeats:
• Premature atrial contractions, which originate in the upper chambers, or atria.
• Premature ventricular contractions, which originate in the lower chambers, or ventricles.
2.3.3 Heart Rate
The maximum heart rate (HRmax) that a healthy individual can attain is around 220 bpm. This is a hard limit due to physiological phenomena (the maximum throughput of the SA node) and will remain constant for a subject, regardless of increased/decreased fitness level or other factors. This maximum heart rate will slowly deteriorate with age and can be approximated by taking the 220 bpm maximum and subtracting the age of the subject.
The lowest heart rate that a healthy individual can attain is called the Resting Heart Rate (RHR). This is the heart rate of the subject when it is at complete rest, relaxed but awake, with no external stress factors such as recent exercise, environmental temperature, … For an average person, the RHR lies within the range of 60 to 100 beats per minute, but a few exceptionally trained aerobic athletes demonstrate resting heart rates in the range of 30–40 beats per minute. This is lower for fit individuals because the body has adapted to maintain basic functionality on these lower heart rates.
Performing any kind of movement will place a circulatory demand on the heart, and the heart rate will change to meet this demand. If demand is higher than what HRmax allows, the heart rate will plateau at HRmax until the body can no longer sustain the exercise. For a constant exercise that does not reach this boundary, the demand will also remain constant, so equilibrium will be reached
at a certain heart rate. An important distinction to make is that of the lactate threshold. Lactate is a substance in the blood that increases in concentration when performing heavy exercise (see 2.5.1.3).
Heart rate will quickly reach the equilibrium as described as long as blood lactate levels remain under a threshold, the value of which depends on the individual. At higher levels of exertion blood lactate levels will rise but plateau after 10-20 min-utes above the resting lactate levels. This means that the heart rate equilibrium will only be reached after 10-20 minutes of sustained exercise; this is called the slow component of cardiovascular kinetics. At severe levels of exertion lactate lev-els will not plateau but rise steeply until the subject is too exhausted to continue, no equilibrium will be reached [9].
2.3.4 Heart Rate variability
The time between heartbeats (the so-called RR interval or Inter Beat Interval - IBI) is not constant but fluctuates ever so slightly between beats. The
differ-ence between these intervals is not random but is the result of a multitude of complex interactions between various organs of the body and is best described as “mathematical chaos”. Two overlapping processes can be isolated [10]:
• The interaction between parasympathetic and sympathetic branches of the ANS;
• The regulatory mechanisms that also control respiratory sinus arrhythmia (RSA) (in which the sinus firing rate increases with inspiration and decreases with expiration), baroreceptor reflex (negative-feedback control of blood pressure), and rhythmic changes in vascular tone (degree of restriction in blood vessels).
Heart Rate Variability (HRV) diminishes with age and is a marker for parasym-pathetic activity, with a higher value being in general considered “more healthy”. Lower HRV values have been linked to Myocardial Infarction and Myocardial Dys-function while raising HRV through exercise to battle cardiovascular mortality risk has been proven beneficial [11].
HRV can be measured in various ways, which can be split into either time domain analysis or frequency domain analysis. These measurements also give different results when different measurement epochs are used, so when studying HRV the epoch and metric must be carefully considered.
2.3.4.1 Time Domain
Time Domain analysis is in function of statistical difference in time measurement between heartbeats. Various metrics exist [10]:
• SDNN: The standard deviation of the RR intervals. 24 Hour monitoring of this value is a strong predictor of morbidity and mortality. In short-term measurement while at rest the primary source of variation can be attributed to RSA.
• Various derivatives of SDNN such as SDSD (standard deviation of the dif-ference between successive IBI), SDRR (standard deviation of IBI without filtering abnormal beats), SDANN (standard deviation of the mean of IBI of 5-minute segments during 24hr recording), and SDNNI (mean of the stan-dard deviation of IBI of 5-minute segments during 24hr recording).
• NN50: The number of adjacent NN intervals that differ from each other by more than 50 ms, requires a 2-minute epoch. NN Interval being all the RR intervals with “abnormal” beats filtered out. In practice (and certainly in our case) these two definitions are synonyms.
• PNN50: The proportion of NN50 over the total number of IBI, requires a 2-minute epoch and is closely correlated to Parasympathetic Nervous System activity.
• RMSSD: Root mean square of the difference between successive IBI. RMSSD is strongly backed by research and is considered the most relevant and accu-rate measure of ANS activity over the short-term.
• lnRMSSD: log of RMSSD which has been shown to be an acceptable mea-surement for short-term recordings [12].
2.3.4.2 Frequency Domain
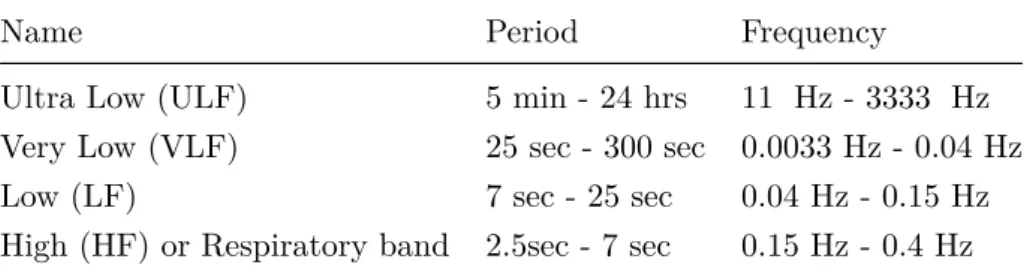
Various oscillations have been measured with a frequency ranging from seconds to >24 hours and can be roughly grouped into different bands (see table 2.3). The Low Frequency (LF) and High Frequency (HF) bands are significant because their oscillations can be affected by breathing rhythm. More specifically, the LF band is affected by slow breaths (3 to 9 respirations per minute) and the HF band is affected by fast breathing (9 to 24 respirations per minute).
The Very Low Frequency (VLF) frequency band has shown many uses for heart conditions and all-cause mortality, but very little is known of its usefulness
re-garding cardiovascular fitness. The LF band mainly reflects baroreceptor activity and is affected by both parasympathetic and sympathetic activity. The HF band mainly reflects RSA because it corresponds to the HRV related to the respiratory cycle. It also reflects parasympathetic activity. The ratio of LF to HF power (LF/HF ratio) is poorly understood and various interpretations have been given. The most useful interpretation to our goal is that it estimates the ratio between SNS and PSNS activity [10].
Table 2.3: frequency bands of Heart Rate Variability.
Name Period Frequency
Ultra Low (ULF) 5 min - 24 hrs 11 �Hz - 3333 �Hz Very Low (VLF) 25 sec - 300 sec 0.0033 Hz - 0.04 Hz Low (LF) 7 sec - 25 sec 0.04 Hz - 0.15 Hz High (HF) or Respiratory band 2.5sec - 7 sec 0.15 Hz - 0.4 Hz
2.3.5 Heart Rate Recovery
After cessation of exercise, the return of the heart rate towards its baseline is modulated by the ANS. The resulting speed at which the baseline is reached is called Heart Rate Recovery (HRR). As mentioned before, heart rate is influenced by the two distinct somatic sub-systems; PSNS and SNS. This balancing act has a significant effect on HRR because the impulses of these systems are delivered independently of each other. At first, the PSNS (responsible for reducing heart rate) will kick into gear resulting in a sharp decrease in heart rate. The SNS (responsible for increasing heart rate) reacts slower and winds down the impulses given to the heart gradually. The combination will result in a HRR curve, split into a fast phase and a slow phase. The transition between these phases denotes the border where the SNS takes over the mediation of heart rate from the PSNS [13]. Studies show that this curve becomes steeper as the subject transitions to adulthood, so a window of at least 2, preferably 3 minutes between measurements is recommended for achieving age-independent HRR metrics [14] [15].
2.3.6 Cardiac Output
In the context of fitness, one of the most important factors is Cardiac Output (CO). CO is the measurement of the volume of blood pumped by each ventricle
per minute and is calculated by multiplying heart rate with Stroke Volume (SV) (the amount of blood pumped by each ventricle). It is fairly easy to conclude that an increase in CO means an increase in oxygenated blood reaching the muscles, which increases the potential maximum energy output of a muscle. Note that SV is not the same as the volume of a ventricle. There is always a certain volume of blood (the so-called End Systolic Volume (ESV) or offload) present in the ventricles. During the cardiac cycle, the ventricles fill up to a maximum volume (called the End Diastolic Volume (EDV) or preload) after which the SV is ejected to return to the ESV. An average heart at rest has approximately 130 mL EDV and 50-60 mL ESV, which results in an SV of 70-80 mL.
A higher heart rate will result in a higher Cardiac Output (CO), but its not just a matter of multiplying heart rate with Stroke Volume. SV will initially be able to keep up with an increase in heart rate, but at around 120 bpm there is not enough time between contractions for the ventricles to fill up with blood. Up until 160bpm, the rate at which SV decreases is lower than the rate at which heart rate increases, so CO will continue to increase. As heart rate rises above 160 bpm, this balance shifts and CO starts to decrease. Therefore, individuals performing aerobic exercises are cautioned to monitor their heart rate to ensure they stay within the target heart rate range. The target heart rate is loosely defined as the range in which both the heart and lungs receive the maximum benefit from the aerobic workout and is dependent upon age [8].
2.4
Measuring heart rate
2.4.1 Phonocardiogram (PCG) measurement
The phonocardiograph will measure heart pulse data by listening to the sound of the beating heart. In a normal, healthy heart, there are two distinctly audible heart sounds. The first sound is created by the closing of the valves between the atrium and the ventricle during ventricular contraction. The second heart sound is the sound of the closing of the valves between the ventricle and the aorta during ventricular relaxation [8]. This method of measurement has some novel applications and is showing potential to be as accurate as optical measurement, but has not yet been brought to market as a consumer wearable [16] [17].
2.4.2 Electrocardiogram (ECG) measurement
By careful placement of surface electrodes on the body, it is possible to record the complex, compound electrical signal of the heart. This tracing of the electrical signal is the electrocardiogram (ECG). There are five prominent points on the ECG (see figure 2.3): the P wave, the three points of the QRS complex, and the T wave. The small P wave represents the impulse in the atria. The atria begin contracting approximately 25 ms after the start of the P wave. The large QRS complex represents the impulse in the ventricles, which will begin to contract as the R wave reaches its peak. Lastly, the T wave represents the end of the impulse in the ventricles (the end of the impulse in the atria is obfuscated by the QRS complex). Segments are defined as the regions between two waves. Intervals include one segment plus one or more waves. In this thesis, the most notable interval is the RR interval or the interval between the peaks of the QRS complex [8].
The standard electrocardiograph uses multiple electrodes to obtain 3, 5, or 12 leads. The greater the number of leads an electrocardiograph uses, the more in-formation the ECG provides. The term “lead” typically describes the voltage difference between two of the electrodes. Electrocardiographs are also available in a small, portable, battery-operated device known as a Holter monitor, or simply a Holter, that continuously monitors heart electrical activity. Chest strap heart rate monitors (such as the polar H-series used here) are rudimentary electrocar-diograms.
2.4.3 Photoplethysmogram (PPG) measurement
Various biological tissue types (bone, blood, pigments in the skin, …) reflect and absorb light in different ways. The pumping action of the heart has a large effect on the pressure and corresponding presence of blood in the arteries. The peak of this pressure wave is called “systole” and the valley is called “diastole”. Note that this pulse is very strong in the arteries, being directly connected to the output of the pump. Deeper inside the system this pulse gradually weakens to static pressure in the veins. The pulsing of blood flow and blood pressure can be determined easily using a pulse rate monitor. The principle behind PPG sensors is the optical detection of this pulse using a sensor system consisting of a light source and a detector. The sensor monitors changes in the light intensity via reflection from or transmission through the tissue. The changes in light intensity can be mapped to
Figure 2.3: an example ECG tracing.
the diastole and systole to provide information on the pulse rate of the heart [18]. PPG sensors are fairly simple devices and have found their way to various wrist-based wearables, where they measure the pulse rate of the arteries in the wrist. In HRV analysis, the RR intervals obtained from ECG measurements are required. In principle, any signal providing IBI timing data could be used, as long as the measurements are sufficiently accurate. Pinheiro et al. [19] suggest that data from PPG measurements could potentially be used to achieve the same goals as this thesis, but PPG is inherently less accurate than ECG. In the cited study the distinction is made between Heart Rate Variability from ECG measurement and Pulse Rate Variability from PPG measurement. Especially high-frequency measurements during periods of intense activity suffer from high inaccuracy [20].
2.5
Physical fitness
To model our fitness coach we need to know the distinct differences between a fit and unfit subject. The distinction has to be made between a trained and untrained subject because these concepts are inherently linked but are not synonyms. To be “fit” is to have a large aerobic capacity, the body has adapted to be able to
deliver more oxygen to the muscles which improve aerobic ability. To be “trained” is having the extra muscle and nervous impulses te be able to use this oxygen, converting it into more power than an untrained subject.
Another aspect that is closely linked to “fitness” is cardiovascular health. It is common knowledge that being more fit results in a lesser change to contract car-diovascular problems such as infarcts, but being in good carcar-diovascular health does not necessarily imply being fit. Attempting to alleviate poor cardiovascu-lar health through fitness training is however a widely acknowledged and applied therapy.
2.5.1 Fitness metrics
Due to the large amounts of ways to parametrize “fitness”, calculating a fitness score involves carefully selecting which metrics to incorporate and which to dis-card.
2.5.1.1 VO2max & Aerobic capacity
Aerobic capacity is the ability to take in oxygen and deliver it to skeletal mus-cle during exercise. It uses VO2max (or Peak Oxygen Uptake), the maximum
rate of oxygen consumption in mL/(kg*min) - the volume of oxygen delivered per minute, per kilogram of body mass - , as a measure because it reflects the capa-bilities of the circulatory and respiratory systems. It is a gold standard measure for comparing individual subjects and training methods because it correlates with cardiorespiratory fitness and endurance capacity. Erythropoietin (EPO) can sig-nificantly increase VO2max, so it is no surprise that it has been used extensively
as a Performance-Enhancing Drug in aerobic sports such as cycling. Note that higher VO2max does not necessarily mean a higher volume of oxygen in the blood.
In fact, most VO2max increases can be attributed to a higher capacity of the body
to extract the oxygen already present in the blood.
Accurately measuring VO2max is impossible without specialized medical equip-ment, but a meta-study [21] revealed that VO2max may be simulated/extrapolated
from RPE during a Perceptually Regulated Exercise Test (PRET) test. RPE can be noted using the Borg Scale, a standardised 6-20 scale with 6 meaning no ex-ertion at all and 20 meaning maximal exex-ertion. These ratings can informally be described as “exercise resulting in a heart rate of rating times 10”. Furthermore,
performance during a Cooper test (maximum distance covered by foot during 12 minutes) can be extrapolated to VO2max using the formula:
V O2max≈
dist− 504.9
44.73
Where dist is the distance covered in meters in 12 minutes [22].
2.5.1.2 Baecke Score
The Baecke Score is a tried and tested [22] self-administered questionnaire to evaluate the daily activity level of the subject. It is a quick way to determine a rudimentary score for the fitness level of an individual but requires validation from measurements to be a reliable metric.
The questionnaire includes items about daily work life, sport, and leisure time activities. The questions classify the subject’s activity in each category from inactive to very active. Questions about sport and leisure time activities also include the type of activity, the frequency of performance, and the number of months per year that the activity is performed. All items result in a separate score from 1 to 5 points that incorporates activity duration, frequency, and an intensity score based on energy costs. Summing the work score, sports score, and leisure score results in an overall unitless activity score ranging from three to fifteen.
2.5.1.3 Blood Lactate levels
Fatigue has an apparent impact on the slow phase of the blood lactate level in-crease: the higher the intensity that can be sustained without a significant pres-ence of the slow component, the better the prospects for endurance. Endurance training will have the effect of elevating the value of the lactate threshold of an individual and thus eliminate the slow component for some exercise intensities. This way exercise intensities which were initially severe for the particular person might become heavy or even moderate following training [9].
2.5.1.4 Heart Rate variability
Heart Rate Variability is the variation in time between each heartbeat. This variation is affected by the autonomic nervous system and will increase from PSNS
activity and decrease from SNS activity. A healthy ANS is one that can quickly activate or deactivate either stimulus, so being able to quickly change from low to high variation and vice-versa is a measure of good physical and mental health and high stress resilience [2]. Habitual aerobic exercise appears to aid the maintenance of elevated HRV in active subjects when compared with age- and weight-matched sedentary subjects [4], and correlates with VO2max [6].
Not all HRV measures are created equal; HF, SDNN, and RMSSD were statisti-cally significantly higher in athletes than in controls, but other resting HRV param-eters were not statistically different between groups [23]. It is equally important to compare HRV measures not in a vacuum but from longitudinal monitoring. In the case of elite athletes training for an upcoming event, another study [24] found weekly and 7-day rolling averaged Ln rMSSD and the Ln rMSSD to R–R interval ratio as practically useful to represent a meaningful change in fatigue and/or fit-ness. In the same study, increasing HRV values were shown to be a possible sign of positive adaptation and/or coping with training load, while reductions in HRV in the week/days before pinnacle events may represent increasing freshness and readiness to perform.
2.5.1.5 Heart Rate Recovery
HRR has become a significant, non-invasive measure of cardiovascular-parasympathetic influence and general cardiovascular health. A meta-analysis suggests that slowed HRR is an independent predictor of all-cause mortality [25]. HRR is statistically significantly faster in athletes [23], and is associated with cardiac adaptation to physical activities of various durations and intensities [26]. HRR differs a lot from subject to subject, depending on the type of sport the subject is trained in, their age, the intensity of the training regime, etc [26]. It is important to use the change in HRR over time as a measure of increased fitness, instead of using it as a baseline fitness metric.
HRR has a fast phase and a slow phase (see also section 2.3.5). Analysis revealed that the fast phase accounts for almost all the HR decay after intermediate in-tensity session (~98%), remaining only a minor portion of the decay falling in the slow phase. On the other hand, slightly different contributions are observed in high-intensity sessions (91% and 9%). For these reasons, percentage values of slow and fast phase might provide complementary information when comparing differ-ent exercise intensities. This same study also demonstrated that high-intensity
exertion delays both parasympathetic reactivation and sympathetic withdrawal, resulting in a flatter curve [13]. The fast phase HRR correlates with parasympa-thetic modulation [23].
Studies have shown no correlation between HRR and HRV [27] [15], but a cor-relation exists between HRR and Baecke score [6], which means that having an active lifestyle results in faster HRR. Fast phase HRR (specifically, the Heart Rate Index, being HRmax minus Heart rate after 1 minute of recovery) also correlates with VO2max. As VO2max is primarily influenced by sympathetic activity, this means that an increase in fitness not only means higher parasympathetic modu-lation but also enhanced sympathetic activity. In general, HRR can be used as a measure of ANS adaptation [26].
2.5.2 Fitness Training
Fitness training is based on three principles [28]:
• A training effect occurs when the tissue is stressed at a level beyond it is accustomed to (overload).
• A training effect is limited to the tissue involved in the activity (specifity). • The effect of training is quickly lost when training is stopped (reversibility).
These principles are not limited to muscular tissue, but can also be applied to aerobic capacity. VO2max increases after consistent training sessions of 20 to 60 minutes, at an intensity of 50% to 85% VO2max. Recall that VO2max is measured
as volume over time (per kg of body mass), which means that an increased Car-diac Output (due to higher preload and lower afterload) accounts for 50% of the VO2max increase. The remaining 50% is due to an increased oxygen intake by
organ tissue, resulting from a greater capillary density in the trained tissue [28]. If an amount of muscle fibers are insufficient to accomplish a task, more fibers will be recruited, which increases the SNS response, HR response, and ventilation response to sustain the metabolic rate of these extra fibers. Fitness training results in an increased presence of mitochondrial cells in the muscle, which means that overall fewer muscle fibers need to be recruited which decreases the aforementioned responses [28].
Carefully applied cycles of overload and adequate recovery are an important con-cept in fitness training. If the subject maintains or increases their exercise
perfor-mance after the overload training period (despite having high perceived fatigue), he/she is considered Acutely Fatigued (AF). If the subject has decreased perfor-mance, he/she is considered overreached. Overreach can be split up into Func-tionally Overreached (FOR) and Non-FuncFunc-tionally Overreached (NFOR).
Detecting FOR or AF is not possible through HR monitoring, as no difference can be observed between the two states. A study concludes that heart rate is inade-quate to prescribe and monitor intensified training. Subjective ratings of fatigue and readiness to train on visual analog scales were most powerful to distinguish between AF and FOR. In the same study, these 2 parameters correctly predicted 78% of the subjects as AF or FOR [29].
2.5.2.1 Detraining
Detraining is the rapid decline of the benefits gained from training. A fast initial decrease of VO2max is largely attributed to a decrease of blood plasma volume,
which decreases Stroke Volume (It is shown that a plasma infusion can largely alleviate detraining symptoms within 12 days of the cessation of training). An-other factor of aerobic capacity decreasing is the drop of muscular mitochondrial cells. A single week of detraining resulted in the loss of 50% of the gains during a 5-week training period [28]. Capillary density remained roughly constant during detraining.
2.5.2.2 Overreaching spectrum
FOR is when a subject reaches a short-term decrement of performance, without signs of maladaptation as a consequence. When followed by a period of adequate recovery this state will reach an overall result in performance enhancement (termed supercompensation). NFOR is a dangerous cascade of insufficient recovery and excessive demand, resulting in a downward spiral marked by negative hormonal and psychological alterations. When left unchecked it will result in overtraining syndrome (OTS). Early-stage NFOR can be compensated by a quick response in recovery strategies; more rest and better-adapted sleep schedule, diet, and social activities [30].
Supercompensation is a popular term, but a meta-analysis TenHaaf et al.??? and Bellinger et al.[31] shows that similar improvement can be gained purely by AF instead of going into FOR:
“One of the challenges of research on the training-overtraining spectrum is to distinguish between AF and FOR. Some important differences exist between these two stages of the overtraining spectrum. Firstly, intensified training which results in AF leads to increased performance. In FOR athletes, however, the increase in performance after intensified training and a taper period is smaller or even absent (Aubry et al. 2014). Secondly, disturbed sleep and an increased illness incidence in FOR compared to AF athletes has been shown (Hausswirth et al. 2014). Thirdly, continuation of imbalanced training- recovery in FOR athletes results eventually in NFOR or OTS. These stages must be prevented because of the severe symptoms and long recovery times (Meeusen et al. 2013). In conclusion, it is the difference between AF and FOR that is very relevant for athletes, because it represents the thin border between effective and too much training.” [29]
“It is clear that endurance athletes are required to undertake periodised increases in training load to provide an overload stimulus [31] and induce physiological adaptations to training. However, there is no evidence to suggest that inducing a state of FOR is necessary or required to promote these adaptations and improve exercise performance.” [31]
2.5.2.3 Overtraining syndrome
Overtraining, meaning the negative effects of training sessions that are too long and/or too strenuous, are a significant detriment to the physical and mental health of the subject. The majority of aerobic training injuries can be attributed to overtraining. The general symptoms of overtraining are an increased heart rate, continued muscle soreness, loss of appetite, chronic fatigue, decrease in perfor-mance, psychological staleness, etc. [30] [28]. Compared to NFOR, recovering from OTS requires a continuous restoration consisting of long rest and recovery periods lasting from weeks to months accompanied by a reduced performance [30]. Diagnosis of OTS can only be made after proper clinical evaluation and exclusion of the much more common medical conditions of endurance athletes. Common conditions with presentations similar to OTS include asthma, anemia, hypothy-roidism, immunodeficiency, hypocortisolemia, chronic fatigue syndrome, and de-pression among others. To accurately diagnose OTS, additional blood screening tests are required to look for markers such as the following: testosterone:cortisol ratio, overnight urinary cortisol:cortisone ratio, maximal heart rate at lactate threshold, and/or decreased maximal lactate concentration [32]. It is therefore
advised to take preventive measures to avoid OTS altogether, a general rule in prevention is that training intensity or duration should not increase more than 10% week over week.
Chapter 3
Data Gathering
Using the knowledge gained in the previous chapter, various metrics are carefully picked based on how relevant they are to cardiovascular fitness. In an ideal sce-nario, we could measure oxygen levels in the blood, but equipment for this kind of data gathering is expensive and bulky, which makes it hard to perform at the scale required for machine learning applications.
As a reminder, the subjects were asked to perform the following fitness training session:
• A 2-minute stage in sedentary rest.
• A 5-minute stage in which the subject provides 50W (0.067 BHP) at 50 rpm. • A 5-minute stage in which the subject provides 100W (0.134 BHP) at 50
rpm.
• A 2-minute stage of recovery in sedentary rest
• A 5-minute stage in which the subject tries to maintain 115-120 bpm heart rate (equals to around 60% of the maximum heart rate of young adults). • A 2-minute stage of recovery in sedentary rest.
• A 5-minute stage in which the subject tries to maintain 155-160 bpm heart rate (equals to around 80% of the maximum heart rate of young adults). • A 1-minute stage in which the subject cycles at maximum exertion. • A 4-minute stage of recovery.
Test subjects were sourced from the student population and were of mixed gender, various fitness levels, aged between 19 and 28 years old. Test subjects were asked to abstain from alcohol for at least 24 hours and to abstain from caffeine for at
least 12 hours. This is an acceptable compromise between the personal life of the test subjects and the half-life time of the substances in the circulatory system. In total 27 test subjects were gathered, of which 23 were able to fully complete the session, resulting in ~95.000 timesteps of heartbeat data.
The RR intervals are measured and stored using the Elite HRV Android app, which can then be exported to text files where each line contains an integer representing the milliseconds between each beat. These intervals are then sent through a filter and passed on for feature engineering.
3.1 RR interval filtering and correction
Not all heartbeats are captured perfectly. Any ectopic beats that occur need to be filtered out and beats that were erroneously measured or completely skipped by the heartbeat sensor or the Bluetooth connection need to be accounted for. Before passing on to feature engineering, each interval is stored in a seven-beat window. When this window is full, the fourth beat is checked (Current Beat Timing, CBT). If it differs from the previous beat with either more than 50ms or more than 10ms and 3 times the current HRV, a closer look is taken.
The filterer will assume one of five scenarios happened. For each scenario, it creates a hypothetical solution and calculates how realistic this solution is. It then picks the best solution and applies a correction to the current seven-beat window.
The filter checks for multiple possibilities:
• There is a sudden change in HRV, the measured CBT is correct. The future 3 beats are taken and averaged out. The score of this solution is the CBT minus this average.
• The sensor failed to register a beat. The proposed solution is to replace the CBT with two beats with CBT /2. The score of this solution is the difference between the average of the seven-beat window excluding the CBT, and CBT /2
• The sensor failed to register two successive beats. The proposed solution is to replace the CBT with three beats with CBT /3. The score of this solution is the difference between the average of the seven-beat window excluding the CBT, and CBT /3.
• The sensor misregistered a beat. The proposed solution is to average out the CBT and its successor. The score of this solution is the difference between the average of the seven-beat window excluding the CBT and its successor, and the averaged timing value.
• The sensor misregistered and missed a beat. The proposed solution is to average out the CBT and its successor and to add an additional beat with this averaged timing. The score of this solution is the difference between the average of the seven-beat window excluding the CBT and its successor, and the averaged timing value.
At first, if the score of the sudden change solution is less than 50ms, it means that there is no faulty measurement, just a sudden change in Heart Rate Variability. however, if this is not the case, the filterer checks for the lowest score of the four proposed solutions. If this score is lower than the score of the “sudden change”, it is accepted and the seven-beat window is replaced by the solution. If the cause of the change in IBI timing is still unexplained, the filtering gives up and will simply accept the faulty measurement.
3.2
Heart rate metrics feature engineering for the classification
task
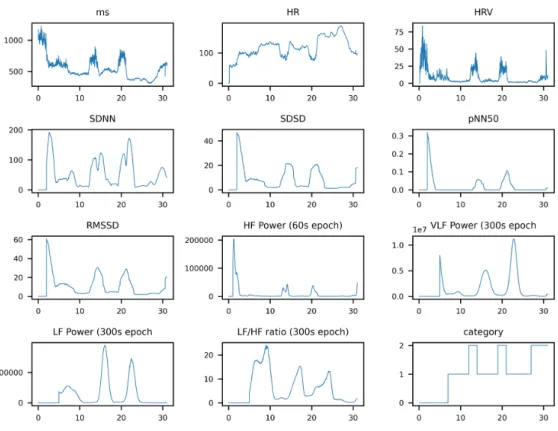
The feature engineering results in every RR interval being accompanied by 10 extra features: • HR • HRV • SDNN • SDSD • pNN50 • RMSSD • HF power (60s epoch) • LF power (300s epoch) • VLF power (300s epoch) • LF/HF ratio (300s epoch)
Figure 3.1: Feature extraction from heartbeat data
clear that some correlations exist, which means that we should be able to obtain a working machine learning classifier.
3.2.1 RR interval
The most basic measurement from which all others are derived, the RR interval is the exact time between heartbeats in milliseconds. These values are stored in various sliding windows (of a constant time interval, 10 seconds, 60 seconds, 120 seconds, and 300 seconds respectively) for further derivation.
3.2.2 Current Heart Rate
The beat-to-beat heart rate is the standard way to measure cardiac activity. It is simply the number of full contractions of the heart per minute. Because we are starting from heart rate variability metrics, it is easily derived by (60000/RR inter-val in milliseconds), but to reduce the inherent variability of heart rate variability, the linearly weighted moving average of the last 10 seconds of measurements is
![Figure 2.1: An anatomical overview of the heart [8].](https://thumb-eu.123doks.com/thumbv2/5doknet/3276220.21453/25.892.174.734.296.940/figure-anatomical-overview-heart.webp)
![Figure 2.2: the innervation and pumping mechanism of the heart [8].](https://thumb-eu.123doks.com/thumbv2/5doknet/3276220.21453/27.892.168.737.315.904/figure-innervation-pumping-mechanism-heart.webp)
![Table 2.1: Major Factors increasing heart rate and force of contraction. [8]](https://thumb-eu.123doks.com/thumbv2/5doknet/3276220.21453/29.892.166.757.200.560/table-major-factors-increasing-heart-rate-force-contraction.webp)

![Figure 4.2: RNN & LSTM Cell [33]](https://thumb-eu.123doks.com/thumbv2/5doknet/3276220.21453/55.892.177.719.205.572/figure-rnn-amp-lstm-cell.webp)