INTERIM EVALUATION OF THE DUTCH CROP PROTECTION POLICY
VAN EERDT M.M. 1, VAN DER LINDEN A.M.A.2, DE LAUWERE C.C.3, VAN ZEIJTS H. 4
1
Netherlands Environmental Assessment Agency, P.O. Box 303, 3721 AH, Bilthoven, THE NETHERLANDS
E-mail. martha.van.eerdt@mnp.nl 2
National Institute of Public Health and the Environment, P.O. Box 1, 3720 BA, Bilthoven, THE NETHERLANDS
3
Wageningen UR - LEI, P.O. Box 29703, 2502 LS, The Hague, THE NETHERLANDS 4
Netherlands Environmental Assessment Agency, P.O. Box 303, 3721 AH, Bilthoven, THE NETHERLANDS
ABSTRACT
Farmers and growers, assisted by the pesticides industry and stimulated by government, have succeeded in considerably reducing the environmental risk resulting from the use of plant protection products (pesticides) in the Netherlands between 1998 and 2005. Despite this, surface waters still contain too many pesticide residues at about half of all the monitoring sites.
Both modelling and measurements are needed for a reliable evaluation of the environmental quality of surface water. Improvement of the methodologies for smart and cost-effective monitoring of pesticides is necessary for monitoring the progress made regarding the Water Framework Directive in the Netherlands.
KEY WORDS: Crop protection policy, Pesticide, Environmental risk, Monitoring, Water Framework Directive.
INTRODUCTION
Agriculture in the Netherlands is productive and intensive. Many different crops are grown. Use of pesticides for plant protection is high. To restrict their environmental risks the use of plant protection products was reduced by 50% in 2000 compared to 1984-1988 as planned by the national pesticide policy adopted in 1991 (MJP-G, 1991). In 2005 on average 4.7 kg of active ingredients were used per hectare of arable land. The applied amounts per crop may vary enormously, ranging from 0.9 kg per hectare of silage maize to over 60 kg for roses and over 100 kg for lilies (flower bulbs) (CBS, 2005). Dutch environmental policies on pesticides aim especially at reduction of ecological risks for the aquatic environment. Spray drift is by far the most relevant exposure route of aquatic communities in watercourses in the Netherlands (De Zwart, 2005). Other exposure routes like atmospheric deposition and leaching generally cause lower concentrations in surface water than spray drift.
In the Dutch policy document on sustainable crop protection from 2004 four operational targets are stated for the period until 2010:
1. A reduction of the environmental risk for surface waters by 95% in 2010 compared to 1998. The interim target is 75% in 2005.
2. A reduction of the number of drinking water problems by 95% in 2010 compared to 1998. The interim target is 50% in 2005.
3. A reduction of exceedances of the Maximum Residue Level (MRL) in food by 50% in 2010 compared to 2003. No interim target was stated.
4. All growers handle plant protection products in 2010 on the basis of a risk inventory and risk evaluation in order to protect the applicators and workers on their farm.
These targets have to be met under the condition that economic prospects will be maintained for Dutch agriculture and horticulture.
In 2006 an interim evaluation was carried out upon request of the government for the first three targets and the condition of maintenance of economic prospects (Van Eerdt and van Zeijts, 2006). The evaluation has been carried out by the Netherlands Environmental Assessment Agency (MNP) in cooperation with the National Institute for Public Health and the Environment (RIVM), the RIKILT Institute of Food Safety and the Agricultural Economics Research Institute (LEI). This paper will evaluate whether the first two targets were reached. Furthermore, the contribution of the national policy to the achievement of these targets has been investigated.
MATERIAL AND METHODS
The evaluation of the environmental targets of the Dutch policy document on sustainable crop protection was carried out on the basis of model calculations as well as concentration measurements.
The model called Dutch Environmental Indicator for plant protection products (NMI) is described in detail in Van der Linden et al., 2004. The model estimates the emissions towards air, surface water, groundwater and soil on a grid-basis of 1x1 km square. Resulting concentrations of a substance in surface water and the potential environmental risk were calculated using data on the morphology of surface water like ditches and watercourses along the sprayed fields. The environmental risk is the ratio between the calculated chronic concentration and the Maximum Permissible Risk concentration (MPR). The MPR of a substance is the ecological water quality standard in the Netherlands and it is defined as the level at which the No Observable Effect Concentration (NOEC) is not exceeded for 95% of the species. The environmental risk for groundwater is assessed against the EU drinking water standard (0.1 µg/L).
Inputs into the model were annual sales data on pesticides (PD, 2006) and data from statistical surveys on pesticide use (more than 50 crops) and application techniques (CBS, 2005). Information on environmental fate and ecotoxicity of the pesticides were drawn from the pesticide registrations by the Dutch Board for the Authorisation of Pesticides. Additionally geographical information on crops, soils and climate was used. In order to get information on the implementation of measures for integrated pest management a face to face survey was carried out among 410 growers in the fall of 2005 (De Lauwere and Bremmer, 2006).
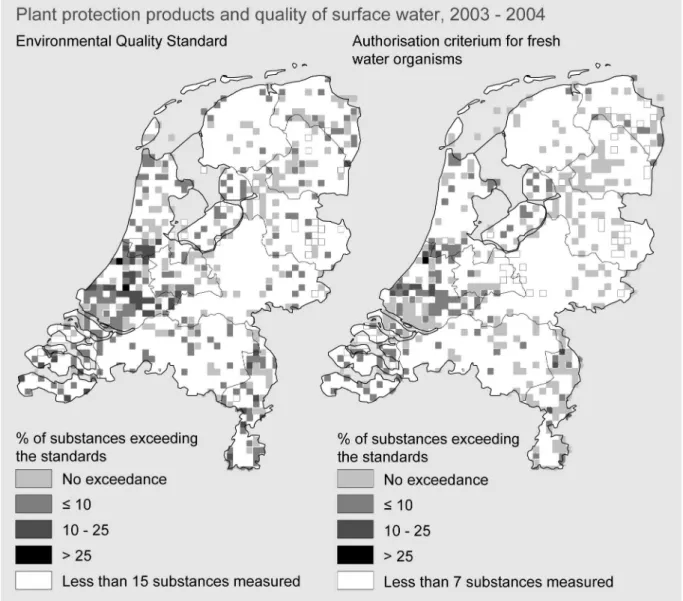
About 50% of the pesticides used for plant protection in the Netherlands (225 authorised active ingredients in 2005) are monitored by regional Water Boards. In addition about 100 metabolites and substances from plant protection products that are no longer authorised are monitored. Aggregated data are presented on a 5x5 km2 grid (Figure 2). The 90th percentile (P90) of the individual measurements of each substance was calculated for each grid cell and compared with the standard (MPR) concentration for that substance (www.pesticidesatlas.nl). Monitoring programmes and monitoring strategy may vary between the years and between the different Water Boards. The number of sampling sites increased from 286 sites in 1997/1998 to 466 sites in 2003/2004. In time sampling became ‘smarter’, i.e. more and more based on additional information about time and place of expected pesticide use. Also the number of substances analysed increased. Therefore from measurements no reliable trend in environmental quality could be assessed.
Data on the concentrations of pesticides in surface water intended for the abstraction of drinking water were available from the water supply companies. This type of abstraction takes place at
nine sites in the Netherlands. About 35 substances were monitored but not all substances were monitored at all sites in all years.
RESULTS
Policy target for the environmental risk of surface water
As stated in the policy document on sustainable crop protection, the target for 2010 is a 95% reduction in the environmental risk on surface waters from agricultural activities compared to the year 1998. The interim target for 2005 is 75%. The reduction in potential environmental risk due to agricultural uses was estimated by the NMI model. In 2005 a reduction in the environmental risk for surface water of 85% was calculated and so the interim target for 2005 has been achieved.
In 2004/2005 growers used 13% less pesticides compared to 1997/1999. From the survey it appeared that the majority of the farmers was enthusiastic about integrated pest management. About 60% believe that integrated pest management has improved the profitability of their farm. From a list of 24 measures of integrated pest management more than 10 measures were taken by more than 90% of the growers in 2005 and only 3 by less than 50% of the growers. On average 30% of the farmers answered to have taken these measures more frequently in 2005 than in 2000. Over 40% took the measures as often as in 2000. Only a few measures were taken less frequently or just as frequent in 2005 by most of the farmers. These were the ones that are laborious and/or costly (e.g. mechanical weed control).
However, more important than the amount of pesticides used is the amount that actually gets into the surface water, either directly during spraying or indirectly by leaching, runoff or volatilisation and subsequent deposition.
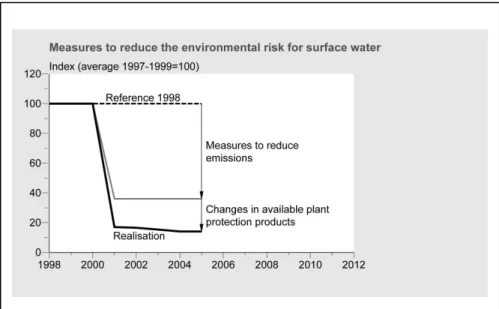
Where the amount used decreased by 13%, the emissions to surface water by drift, runoff and leaching together decreased by almost 60% whereas the environmental risk even fell by 85% (Figure 1). Three-quarters of the reduction of the environmental risk for surface water has been achieved by growers adapting their application methods, including the use of low-drift spraying
Figure 1: Reduction of the environmental risk caused by emissions of pesticide residues from agriculture (Source: Van der Linden et al., 2006)
equipment and not cultivating strips of land adjoining surface water bodies (crop-free zones). These measures are required by the government under the Open field cultivation and livestock
farming (discharges) decree. The remaining quarter of the reduction has been achieved by changes in the authorisation status of the plant protection products. In the period from 1998 to 2005, 90 plant protection products were taken off the market, either because they were no longer allowed by the government or because they were withdrawn by the industry. In the same period, the industry introduced 39 new, more environmental friendly products onto the market.
The reduction of 85% for surface water risk was almost totally achieved in the period 1997/1999 – 2001. Despite the increase in integrated pest management the decrease in the environmental risk of surface waters slowed down considerably after 2001. Given this pace of decrease it is unlikely that the target of 95% will be achieved in 2010 without additional measures being taken. By using a different package of pesticides growers also reduced the environmental risk of groundwater (with 55%) and of soil (with almost 80%). The policy document however didn’t contain any operational targets for groundwater and soil.
The main goal of the policy document is to achieve a situation in which there are no further exceedances of the ecological standards (MPR) in surface waters in 2010. This goal is not yet in sight. In 2003/2004 these standards were still exceeded at about half of all the monitoring sites in the Netherlands. Regular exceedances were found for about 20 of the 200 substances that were monitored. Four of these 20 substances had no longer an authorisation as a plant protection product in the Netherlands. Most likely sources of this pollution might be the authorised use as a biocide, subsequent delivery from drainage or sediment, or pollution coming with rivers from neighbouring countries. The substances found in measurements that have authorised uses for plant protection (Table 1) are the relatively persistent ones. Sometimes these substances are widely used but also very minor uses (e.g. in greenhouses) may cause frequent exceedances. Apart from the explanation of illegal use there are other possible explanations for these exceedances. The strongest is the discrepancy between the environmental criteria used in the authorisation procedure and the water quality criterion (MPR) (Figure 2). This discrepancy implies that application of authorised plant protection products according to good agricultural practice may cause exceedance of the environmental quality standards (EQS-MPR) in the Netherlands. Summed up for all the plant protection uses in the Netherlands in 2005 the authorisation procedure allows for an environmental risk that more than doubles the risk allowed by the Dutch water quality standards (Van der Linden et al., 2006). The procedure for establishing the MPR standard resembles the Fraunhofer procedure for deriving environmental quality standards which is used in the guideline document for the Water Framework Directive (WFD) (Lepper, 2002; Lepper 2004). Therefore it is expected that with the current environmental authorisation criteria the objectives of the WFD probably will not be met in the Netherlands. The same may hold for some other countries depending on usage and the hydrological situation there.
Two further explanations for the measured exceedances are 1. applications by different farmers at more or less the same time and place and 2. exposure routes that are not taken into account in the authorisation procedure like atmospheric deposition (de Jong et al., 2007).
Policy target for drinking water abstraction
The quality of surface water as a source of drinking water has improved, but not enough to meet the interim target: a 50% reduction in the number of drinking water problems. A drinking water problem is defined as an exceedance of the drinking water standard for an individual pesticide (0.1 µg/L) at a site of water abstraction. In 2005 the number of problems had been reduced by
Figure 2: Exceedance of two standards: Maximum Permissible Risk concentration for fresh water organisms and the authorisation criterion.
18% compared to the number in 1998. This reduction was due entirely to the prohibition of the use of three herbicides in the Netherlands. A significant proportion of the problems (at least 25%) is due to contamination originating from outside the Netherlands. Here the Water Framework Directive brings new opportunities to make agreements with neighbouring countries. The dominant remaining problem with domestic origin comes from the use of herbicides on pavements. Runoff here is extremely fast and concentrations are generally high.
DISCUSSION
Calculations as well as measurements have large uncertainties. Fate and ecotoxicological knowledge is incomplete for several substances. Therefore concentrations of substances that
were measured could not always be calculated. Calculations relate to potential risks dependent on the use and the emissions of most hazardous substances. The four most hazardous substances account for 85% of the environmental risk calculated for surface water (Van Eerdt and van Zeijts, 2006). From the 215-225 substances used, about 100 were measured in surface waters. However not all substances that are known to be hazardous from the calculations could be measured at the level of the prevailing standards (EQS-MPR). Some substances might be monitored at a moment or place without exceedance while at other moments or places exceedances for those substances might have been occurring.
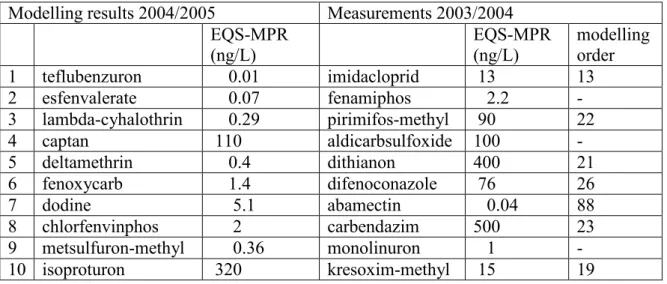
Table 1: Top 10 of plant protection products exceeding the ecotoxicological standard (MPR)
Modelling results 2004/2005 Measurements 2003/2004
EQS-MPR (ng/L) EQS-MPR (ng/L) modelling order 1 teflubenzuron 0.01 imidacloprid 13 13 2 esfenvalerate 0.07 fenamiphos 2.2 - 3 lambda-cyhalothrin 0.29 pirimifos-methyl 90 22 4 captan 110 aldicarbsulfoxide 100 - 5 deltamethrin 0.4 dithianon 400 21 6 fenoxycarb 1.4 difenoconazole 76 26 7 dodine 5.1 abamectin 0.04 88 8 chlorfenvinphos 2 carbendazim 500 23 9 metsulfuron-methyl 0.36 monolinuron 1 - 10 isoproturon 320 kresoxim-methyl 15 19
Comparison of the results from measurements and modelling shows agreement for known hazardous substances as imidacloprid and pirimifos-methyl. Imidacloprid was found exceeding the ecotoxicological standard (MPR) most often (Table 1). From the calculations it appeared to be the 13th most hazardous substance. Six of the substances measured in exceedance of the standards at the most appeared to be on the list of substances calculated ranging in order between 13 and 26 (imidacloprid, pirimos-methyl, dithianon, defenoconazole, carbendazim and kresoxim-methyl). However the disagreement is much more striking from Table 1. Three other substances in the top 10 of the measurements were mainly used in greenhouse horticulture (fenamiphos, aldicarbsulfoxide, abamectin). A module for the calculation of emissions and impact of plant protection products from greenhouses is not yet included in the NMI model. Also substances that have no authorisation anymore (like monolinuron) are not calculated by the model because no data on use are available. The same holds for substances coming from abroad by the rivers Ems, Meuse, Rhine and Schelde and for other, not very well known, exposure routes that are not included in the model. This implies that the modelling used is not sufficient to assess all the relevant environmental risks.
On the other hand it is noted that none from the substances in the top 10 of modelled exceedances show up in the top 10 of measured exceedances. The reason being that only one substance (isoproturon) has a standard (MPR) that is above the detection limit. This means that for the other nine substances exceedances can only be measured when the exceedance is manifold the standard (MPR). This leads to the conclusion that both measurements and calculations are needed to assess the environmental risk from pesticides in surface waters. Where measurements are laborious and costly further improvement of measurement schemes by ‘smart’
monitoring using information from models, will make monitoring programmes more efficient and cost-effective.
CONCLUSION
Crop protection practices have become more sustainable. The interim policy target for the environmental risk on surface waters by agriculture and horticulture in 2005 has been achieved, but water quality standards are still exceeded. The quality of surface water as a source of drinking water has improved, but not enough to meet the interim policy target.
Implementation of integrated pest management (IPM) measures is high in the Netherlands and the frequency of measures taken increased in the period 2000-2005. Yet the progress found in the reduction of environmental risks of surface water since 2001 was small compared to the results from the period 1997/98 - 2001. Main reduction was due to emission reduction measures taken in the period 2000-2001. To increase sustainable use and to reduce the environmental risks from crop protection products it is necessary to use not only IPM but to apply good plant protection practices and good environmental practices as well. Good environmental practice means that farmers seek to restrict the emissions of plant protection products (e.g. by using low-drift spray equipment), to avoid the crops that need a lot of protection and to favour plant protection products with a low risk profile.
Both modelling and measurements are needed for a reliable evaluation of the environmental quality of surface water. Improvement of the methodologies for smart and cost-effective monitoring of pesticides is necessary to meet the requirements of the Water Framework Directive. But above all the assessment of environmental risks within the authorisation procedure should be harmonised with the assessment procedure of the Water Framework Directive.
ACKNOWLEDGEMENTS
The research for the evaluation was funded by the Dutch Ministry of Agriculture and by the Netherlands Environmental Assessment Agency. We especially thank the Institute of Environmental Sciences (CML) from Leiden University and the National Institute for Inland Water Management and Waste Water Treatment (RIZA) for making available the monitoring data of surface water on www.pesticidesatlas.nl.
REFERENCES
CBS, 2005. Crop protection in agriculture and horticulture 2004 (in Dutch). Netherlands Statistics, Voorburg/Heerlen.
De Jong, F.M.W., de Snoo, G.R., van de Zande, J.C., 2007. Estimated nationwide effects of pesticide spray drift on terrestrial habitats in the Netherlands. Journal of Environmental Management. Elsevier (in press).
De Lauwere, C.C., Bremmer, J., 2007. Crop protection-related conduct of growers and their attitudes towards crop protection policy (in Dutch, English summary). LEI-report 2.06.11, Wageningen UR - LEI, The Hague.
De Zwart, D., 2005. Impact of toxicity on species composition of aquatic communities: concordance of predictions and field observations. Thesis University of Amsterdam.
Lepper, P. 2002. Towards the derivation of quality standards for priority substances in the context of the Water Framework Directive. Identification of quality standards for priority substances in the field of water policy. Fraunhofer Institute, Molecular Biology and
Applied Ecology. Report No. B4-3040/2000/30637/MAR/E1.
Lepper, P. 2004. Manual of the methodological framework used to derive quality standards for priority substances of the Water Framework Directive. Fraunhofer Institute,
Molecular Biology and Applied Ecology. Updated summary of B4- 3040/2000/30637/MAR/E1.
PD, 2006. Sales data of plant protection products, 1997-2005. Plant Protection Service, Wageningen.
Van der Linden, A.M.A., Deneer, J.W., Luttik, R., Smidt, R.A., 2004. Dutch Environmental Indicator for Plant Protection Products – Description of input data and calculation methods. Report 716601009/2004, National Institute of Public Health and the Environment and Alterra, Bilthoven.
Van der Linden, A.M.A., van Beelen, P., van den Berg, G.A., de Boer, M., van der Gaag, D.J., Groenwold, J.G., Huijsmans, J.F.M., Kalf, D.F., de Kool, S.A.M., Kruijne, R., Merkelbach, R.C.M., de Snoo, G.R., Vijftigschild, R.A.N., Vijver, M.G., van der Wal, A.J., 2006. Midterm evaluation of the plant protection policy of the Netherlands; environment (in Dutch, English summary). Report 607016001/2006, National Institute of Public Health and the Environment, Bilthoven.
Van Eerdt, M.M., van Zeijts, H. (eds), 2006. Interim Evaluation of the Policy Document On Sustainable Crop Protection (in Dutch, English summary at www.mnp.nl/en/publications/ 2007). Report no. 500126001, ISBN: 9789069601632, Netherlands Environmental Assessment Agency, Bilthoven.
www.pesticidesatlas.nl, Atlas Pesticides in surface water. Royal Haskoning and CML, the Institute of Environmental Sciences at Leiden University.