Towards a landscape scale management of pesticides: ERA using changes
in modelled occupancy and abundance to assess long-term population
impacts of pesticides
Chris J. Topping
a,⁎
, Peter S. Craig
b, Frank de Jong
c, Michael Klein
d, Ryszard Laskowski
e, Barbara Manachini
f,
Silvia Pieper
g, Rob Smith
h, José Paulo Sousa
i, Franz Streissl
j, Klaus Swarowsky
g,
Aaldrik Tiktak
k, Ton van der Linden
caDepartment of Bioscience, Århus University, Grenåvej 14, 8410 Rønde, Denmark b
Department of Mathematical Sciences, Durham University, South Road, Durham DH1 3LE, United Kingdom
c
National Institute for Public Health and the Environment (RIVM), PO BOX 1, 3720 AA Bilthoven, The Netherlands
d
Fraunhofer Institute for Molecular Biology and Applied Ecology (IME), Auf dem Aberg 1, 57392 Schmallenberg, Germany
e
Institute of Environmental Sciences, Jagiellonian University, Gronostajowa 7, 30-387 Kraków, Poland
fDepartment STEBICEF, Palermo University, Via Archirafi, 18., 90123 Palermo, Italy.
gGerman Federal Environment Agency (UBA), Wörlitzer Platz 1, D-06844 Dessau-Roßlau, Germany h
School of Applied Sciences, University of Huddersfield, Huddersfield HD1 3DH, United Kingdom
i
Centre for Functional Ecology, Department of Life Sciences, University of Coimbra, P3000-456 Coimbra, Portugal
j
European Food Safety Agency (EFSA), Via Carlo Magno 1, 43100 Parma, Italy
k
PBL Netherlands Environmental Assessment Agency, PO BOX 303, 3720 AH Bilthoven, The Netherlands
H I G H L I G H T S
• Landscape-scale simulations used to assess impacts of pesticides on beetle populations
• Action at a distance observed with off-crop effects induced by an in-off-crop mortality
• Assessment based on a single pesticide application underestimates the long-term effects
• Mitigation evaluation can be included in risk assessment
• Demonstrates the potential to move towards a landscape management of pesticides G R A P H I C A L A B S T R A C T
a b s t r a c t
a r t i c l e i n f o
Article history: Received 30 June 2015Received in revised form 30 July 2015 Accepted 30 July 2015
Available online 28 August 2015 Editor: D. Barcelo
Pesticides are regulated in Europe and this process includes an environmental risk assessment (ERA) for non-target arthropods (NTA). Traditionally a non-spatial orfield trial assessment is used. In this study we exemplify the introduction of a spatial context to the ERA as well as suggest a way in which the results of complex models, necessary for proper inclusion of spatial aspects in the ERA, can be presented and evaluated easily using abun-dance and occupancy ratios (AOR). We used an agent-based simulation system and an existing model for a wide-spread carabid beetle (Bembidion lampros), to evaluate the impact of afictitious highly-toxic pesticide on population density and the distribution of beetles in time and space. Landscape structure andfield margin
⁎ Corresponding author.
http://dx.doi.org/10.1016/j.scitotenv.2015.07.152
0048-9697/© 2015 Elsevier B.V. All rights reserved.
Contents lists available atScienceDirect
Science of the Total Environment
Keywords: ALMaSS
Source-sink dynamics Bembidion lampros
Environmental risk assessment Landscape-scale risk assessment Abundance Occupancy Ratio index
management were evaluated by comparing scenario-based ERAs for the beetle. Source-sink dynamics led to an off-crop impact even when no pesticide was present off-crop. In addition, the impacts increased with multi-year application of the pesticide whereas current ERA considers only maximally one multi-year. These results further indicated a complex interaction between landscape structure and pesticide effect in time, both in-crop and off-crop, indicating the need for NTA ERA to be conducted at landscape- and multi-season temporal-scales. Use of AOR indices to compare ERA outputs facilitated easy comparison of scenarios, allowing simultaneous evaluation of impacts and planning of mitigation measures. The landscape and population ERA approach also demonstrates that there is a potential to change from regulation of a pesticide in isolation, towards the consideration of pesti-cide management at landscape scales and provision of biodiversity benefits via inclusion and testing of mitigation measures in authorisation procedures.
© 2015 Elsevier B.V. All rights reserved.
1. Introduction
Pesticides are regulated in Europe under Regulation (EC) 1107/2009, a replacement for Directive 91/414/EEC. The pesticide regulation re-quires that the application of a pesticide has no unacceptable effects on the environment with particular regard to its impact on non-target species, including on the behaviour of those species, and no unaccept-able impact on biodiversity and the ecosystem. The general protection goals of the pesticide regulation need to be translated into specific pro-tection goals that define what to protect, where to protect it and over what time period it needs to be protected. The definition of these specif-ic protection goals for the different organism groups is based on the eco-system services concept and associated key species providing them (EFSA PPR Panel, 2010; Nienstedt et al., 2012). This, together with the aim of protecting biodiversity, leads, especially for mobile species, to the development of new risk assessment approaches taking into consid-eration not only single treatedfields as in the traditional risk assessment for pesticides but also population-level impacts at landscape scales. Similar considerations have been applied to environmental risk assess-ment (ERA) in the USA where landscape scale ERA has already been
undertaken (Landis, 2003). However, the move towards larger spatial
scales and population approaches requires a paradigm shift in ERA, requiring consideration of many facets of ecology not included up till now. Although it seems there is a general consensus that population models have the potential for adding value to ERA by incorporating better understanding of the links between individual responses and population size and structure and by incorporating greater levels of eco-logical realism, there are still many issues that require further study (Forbes et al., 2008).
One of the complexities of the real world that requires an innovative solution in regulatory pesticide ERA is the fact that the precise effect of pesticide applications in a particular landscape configuration relies on complex spatial and temporal dynamics involved in animal behaviour, ecology and exposure. For example, in ERA focus is often placed on re-covery of in-field populations, utilising the spatial dynamics of mobile agricultural land species. However, this recovery is normally based on small plot experiments that do not take into account the
landscape-scale impacts of source-sink dynamics (Topping and Lagisz, 2012;
Topping et al., 2013; Focks et al., 2014).
Of particular importance to population spatial dynamics in reaction
to stressors is the‘action at a distance’ or ‘source-sink’ phenomenon
(Pulliam, 1988) (e.g. pollinatorsflying to insecticide treated fields to
for-age, or depletion of source populations by emigration to treatedfields
with high mortality). The consequences of these dynamics are not al-ways easy to predict. For example, conventional wisdom would suggest that placing source habitats close to a treated area where they receive over-spray from pesticide treatments would increase the impact of the chemical at the population level, resulting in sinks. However, this
may not always be so. In the case offield voles it has been shown that
the rescue effects of close proximity of source populations can over-ride the higher rate of pesticide-induced impacts in the off-crop area (Dalkvist et al., 2013). Considering this kind of complexity is in fact nec-essary to obtain realistic responses of the endpoint being assessed to the intended pesticide use. Importantly, this problem is not easily solved by
using either simple landscape structures or small sections of landscape, which can induce heavy and unpredictable bias in the assessments. For
example, inHolland et al. (2007)have shown that regular geometry of
landscape construction results in bias in simulation results. In fact species can utilise resources from both crop and non-crop patches, and the decision to move from one place to another is made depending on the risks associated with a particular landscape-matrix type (Macfadeyen and Muller, 2013). This phenomenon makes prediction even more complicated.
As a consequence of the population properties described above, it is necessary to consider spatio-temporal dynamics in realistic landscapes
when carrying out a risk assessment for mobile organisms (EFSA PPR
Panel, 2015). However, when moving to landscape-scale population-level ERA we also necessarily include a number of other novel features, changing focus to a landscape ecotoxicology as called for byCairns and Niederlehner (1996), and including social-ecological systems consider-ations, multiple stressors, complexity at different spatial and biological scales and variability of exposure (Artigas et al., 2012).
Assuming this landscape-scale population-level ERA is carried out, then suitable measurement endpoints need to be determined, and
these must reflect the specific protection goals defined for the
non-target organisms to be assessed. In the case of terrestrial organisms, where action at a distance, mobile stressors (e.g. changing spatial pat-terns of pesticide use) and long-term population dynamics are impor-tant, these endpoints need to encompass population viability, size, and distribution. These are new elements to regulatory risk assessment, and therefore different ways in which to carry out ERA need to be ex-plored in order tofind out which is/are most suitable.
In this paper, we consider some of the new components of landscape-scale, population-level risk assessment, and focus in particu-lar on spatio-temporal issues, illustrated using simulations of a wide-spread and common European carabid beetle Bembidion lampros (Herbst, 1784). This species was chosen because it is a widespread pred-ator that is common on open ground, particularly in gardens and on
ar-able land (Tamaddoni-Nezhad et al., 2013). Bembidion lampros
therefore represents a typical non-target beetle species of agricultural landscapes (e.g.Kromp, 1990).
We present a way to extract, in relatively simple way, the major de-scriptors of change in beetle population abundance and distribution from the results of complex landscape-scale models, and demonstrate the method to integrate in the assessment of a single pesticide its intended use and pesticide management at landscape scale.
2. Methods
The simulations were run using the ALMaSS system (Topping et al.,
2003), a model system designed to provide answers to policy-level
questions related to changing land-use or management and the resul-tant impacts on animal wildlife.
2.1. The model system (ALMaSS)
The ALMaSS project is an open source project hosted on CCPForge (http://ccpforge.cse.rl.ac.uk), from where program code can be
downloaded. The ALMaSS program itself is a large system comprised of many interacting agent-based models and hence a detailed description cannot be provided here. The reader is therefore directed to the online
documentation (Topping, 2009). This documentation follows ODdox
format (Topping et al., 2010), combining model description with
doxygen (van Heesch, 1997) code documentation. The animal models
comprising ALMaSS have been tested using a pattern-oriented approach (Grimm et al., 2005; Topping et al., 2010) to maximise confidence in their structure and function. The models are quite detailed in their be-haviour and hence run times for ALMaSS can be long, usually measured in hours or even days. This is particularly the case for invertebrate model simulations, recorded as having over 40 million concurrent agents. For use in ERA, the animal models can respond to local concen-trations of stressors, in this case pesticides. Pesticide stressors are simu-lated as changing spatial and temporal concentrations, based on spraying regimes and environmental fate of the active substances. 2.1.1. ALMaSS— short overview
ALMaSS is comprised of two main components, the environment and the animal representations. These are represented in the model by classes each forming a structured hierarchy containing smaller
model representations as further classes (e.g. Landscape Class→ Farm
Class→ Field Class → Crop Class). The environment interface is provided by the‘Landscape’ class. This class contains a map of the landscape to be simulated together with individual landscape element classes such as fields, hedges, roads and woodlands. Fields are a special case. Fields are linked in groups to form farms. These groups are typically based on ownership or management information from municipal or EU farming-subsidy sources. Each farm is an instance of the Farm class,
which simulates the detailed management of itsfields, dependent
upon its farm type, the weather, soil type, and past history of manage-ment. There is a degree of stochasticity in farmer decisions, and hence the result is a dynamic pattern of farm management across the land-scape, with farmers of the same farm type, growing the same crops, making similar but not identical decisions. All vegetated landscape
ele-ments (crops and non-crops) undergo type-specific daily vegetation
de-velopment based on weather and fertilizer inputs as drivers. Farm-management events (e.g. harvest or ploughing) directly interact with vegetation height and biomass, providing a dynamic picture of changing landscape conditions as a result of both environmental and anthropo-genic processes and factors.
The second main ALMaSS component is the simulation of animals,
represented by specific classes (e.g. Bembidion larva and Bembidion
adult are two classes). All animals are agents (sensu agent-based modelling) and are affected by environmental variables, vegetation structure, and by direct interaction with other agents and/or farm man-agement. Each animal represents an individual, or group of individuals, of a particular life-stage, with its own behavioural rules and interactions with its environment. Animals can sense the characteristics of their environment (habitat type, vegetation structure, temperature etc.), management events, and their own physiological condition. Hence, an-imals exposed to management will choose behaviour suitable for that management, their current location, and physiological state. Animals can interact with each other in a variety of ways e.g., local-density-dependent interactions. All animals share a common basic form of con-trol simulated as a state machine. This means that they exhibit
behav-iour associated with a specific state, and make transitions to other
behavioural states as a result of internal or external cues. 2.1.2. The Bembidion model
The Bembidion model's individuals are agents designed to simulate the ecology and behaviour of individual beetles. Due to the very high number of beetles in the real world we use the super-individual concept (Scheffer et al., 1995), using each beetle agent to represent 100 real-world beetles. Since the environment is dynamic, the resultant response of the sum of the agents' interactions with each other and their
environment, through space and time, produces an emergent population response. The original model was described inBilde and Topping (2004), and full documentation is available in ODdox format (Topping, 2009).
Bembidion behaviour is characterised by annual dispersal and aggre-gation phases with aggreaggre-gation linked to non-cultivated habitats and dispersal and breeding largely occurring in open areas. Primary drivers in the model are temperature-controlled developmental rates of eggs, larvae and pupae, together with adult beetle interactions with the land-scape. Each super-individual beetle reacts to the local environmental drivers of beetle density within a 2-m radius and to global weather drivers for development and reproduction. Landscape management, primarily agricultural practices, affect beetles directly, e.g. ploughing causes direct mortality (Thorbek and Bilde, 2004).
The response to the pesticide is built into the model by assuming a threshold concentration above which there is a daily probability of mor-tality. This probability (p) is calculated from (1-m) = (1-p)d, where m is
the proportion assumed to die (e.g. 0.8 for 80% mortality over the test period) and d is the number of days over which the test was carried out. If the beetlefinds itself in a 1-m2grid cell with an
environmen-tal concentration above the trigger, then it is assumed to die with
probability p. Note there is no dose–response, so the maximum
death rate is set as m over d days. 2.2. Scenario set-up
The scenarios used here were chosen specifically to evaluate impacts of spatial structure on the risk assessment. Hence some simplifications
were made to reduce complexity. Specifically these were to assume
zero drift and run-off of pesticide, and to use a monoculture of treated crop.
2.2.1. Pesticide
The pesticide properties were chosen both to highlight the issues to be addressed and to be realistic in terms of action. No drift to off-crop areas was assumed in order to isolate completely source-sink dynamics as drivers of change in off-crop areas. It was assumed that no other in-secticides are applied to winter wheat and that normal herbicide and fungicide applications do not have any impact on beetles.
An 80%field mortality rate (LR80) for a foliar insecticide-spray
appli-cation measured over seven days was chosen. Available regulatoryfield
data indicate that this could be considered a realistic value and is not an
extreme case (seeAnon, 2015). We assumed an environmental
dissipa-tion rate (DT50) of 10 days. To ensure that beetles could be exposed
above the trigger threshold for at least 10 days, an application rate of
twice the trigger concentration at LR80 to all winter wheatfields was
used. We assumed a foliar spray twice during the activity time of the adult beetles, thefirst on 31st May, and the second 20 days later. This is likely to be the most sensitive period for the beetles where this species is actively breeding and population sizes are lowest.
For a subset of scenarios, toxicity was assumed to be increased by factors of ×2, ×5, and ×10 respectively, simulating e.g. increased sensi-tivity, increased concentration or more toxic pesticides. This was achieved by changing the threshold concentration for effect by dividing by this factor. These increased toxicity values were used with scenarios
with zerofield boundaries only (see below).
2.2.2. Definitions of spatial elements
To avoid confusion between terms commonly used to mean similar but different things in scientific literature we have defined our usage of spatial terms related pesticide treated and untreated areas below: • In-crop: the actual cropped area of a field, which may include
un-sprayed crop margins;
• Unsprayed crop margin: non-sprayed crop. This is an in-crop no-spray strip managed in the same way as the crop but not exposed to pesti-cides either via direct spray nor via spray drift;
• Off-crop: everything that is outside the in-crop area (i.e. not a cropped
area and not an unsprayed crop margin), but including grassyfield
boundaries (off-crop is synonymous with off-field);
• Field boundary: a permanent grass strip surrounding the field. Note that in the scenarios where these boundaries are added, they are cre-ated from the in-crop area, but in subsequent analysis are considered off-crop.
2.2.3. Crops
All scenarios were run assuming that the landscape containedfields
with a monoculture of winter wheat, which was either treated with the pesticide to be evaluated, or untreated.
2.2.4. Landscapes
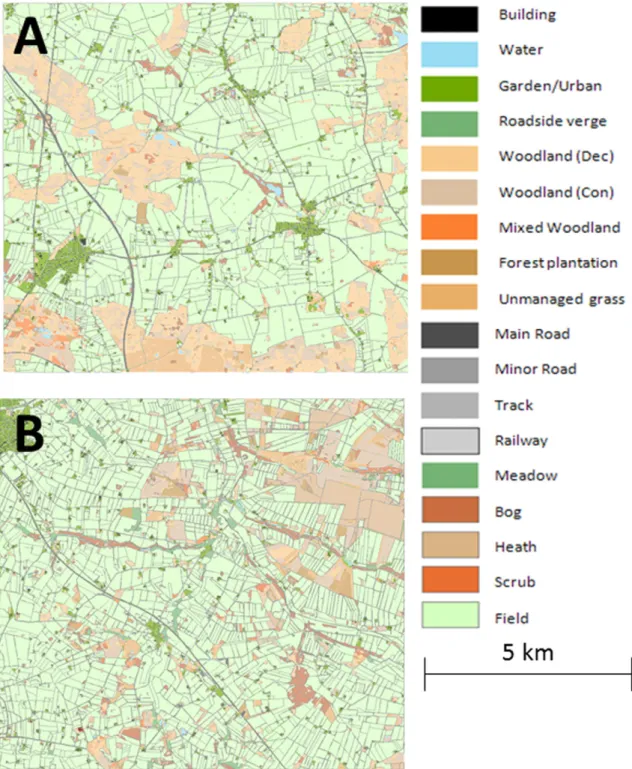
Two different landscapes with a size of 10 × 10 km2were chosen for
the simulations. These landscapes differed in both composition and ar-rangement of landscape elements and are large enough to minimise po-tential edge effects (Bembidion only move a few m per day). The
Herning landscape has a meanfield size of 3.32 ha, maximum of
33.9 ha and a total of 1990 arablefields. The Præstø landscape has a
meanfield size of 7.77 ha, a largest field of 136.6 ha, and 905 arable
fields in total. The structure of the off-crop habitats also differs, with large wooded areas in the Præstø landscape and heathland and small woodlots in the Herning (Fig. 1,Table 1).
Each landscape was used in two artificially manipulated forms. The
first was fields that were completely covered by the crop, the second
was to create a grassyfield boundary in-field around the crops. Such
grassyfield boundaries could be an option to mitigate the risk from intended pesticide use (i.e. strips which are created in-field, managed as permanent grassy strips and not subjected to the same agricultural practice as the crop itself such as ploughing or harvesting or pesticide application). These boundaries were applied to allfields in three widths, 1 m, 5 m or 10 m. The resulting area cover forfield boundaries in the two landscapes was markedly different, from 1.0 to 17.5% cover as a propor-tion of the arablefield area (Table 2).
Another option to mitigate the risk arising from pesticide use is to leave parts of the crop untreated. In order to investigate the efficiency
of such a measure, unsprayed crop margins were added to thefields
in the simulations. Unsprayed crop margins of 2 m, 5 m or 10 m were
added to the model versions which hadfields with 1 m grassy field
boundaries around the crop of both landscapes (seeTable 3). 2.2.5. Temporal effects
To determine the extent to which year-on-year application of the pesticide resulted in population impacts, the impact relative to baseline was used and compared over time. However, due to the large annual fluctuations caused by the weather, it was necessary to eliminate weather effects for this analysis. Since the weather cycle was repeated after 10 years, comparing the impacts between like weather years was necessary. Therefore the ratio of impact relative to baseline from each year following pesticide application to the corresponding year, but 10 years later, was taken. The analysis was carried out for Herning and
Præstø landscapes withoutfield boundaries, with increased toxicity by
factors of 2, 5 and 10 (scenarios designated ×2, ×5, ×10). 2.2.6. Other settings and replicates
All landscapes described above were simulated with beetles for baselines and runs with pesticide application. Starting number of bee-tles were the same in all cases and were randomly distributed across the landscape at a density of 1000 super-individuals per km2. Baseline
conditions were identical to the product run except that no insecticide
was applied to the winter wheatfields. In pesticide-application runs,
the pesticide was applied from year 11 until year 30. Data were
extract-ed from the simulations only after thefirst 10 years of simulation to
allow the populations to equilibrate with the landscape (burn-in period), i.e. all data sets consist of 20 simulated years. Ten years was de-termined to be adequate in initial tests.
Weather conditions were selected to represent the decade
1990–1999 from central Denmark. Each simulation was run for a total
of 30 simulation years, looping the 1990–1999 sequence of weather
data three times.
2.3. Simulation data extraction
Two main sets of data were extracted from all the simulation runs and gave two measurement endpoints: the Abundance:Occupancy Re-lationship Index (AOR) and data on numbers of extant female beetles annually over the 20-year simulation period.
2.3.1. Overall population impact
To compute the overall impact of the pesticide use as stressor, statis-tical analysis was based on the mean differences between baseline and treatment runs with time, resulting in an estimate of mean population depression during the second 10-years of pesticide application. The pro-cedure was to use the raw beetle abundance output from ALMaSS and average for each month over all replicates, then to average these values within each simulation year. The ratio of with-pesticide treatment sce-nario to appropriate baseline (i.e. baselines for the same landscape map as for the treatment), was computed for each year, and the average over thefinal 10 years was taken. This was then converted to percentage loss of the population. This method provided an estimate of impact rel-ative to baseline, and controls for year to year variation caused by weather-driven processes within the simulation.
2.3.2. The AOR-Index
Results from a comprehensive simulation model are often
them-selves complicated and difficult to handle in a management or policy
context. To alleviate this problem, ALMaSS output was used to create an index developed from the Abundance to Occupancy Relationship,
AOR (Gaston et al., 2000), often studied in macro-ecology. The
AOR-index as measurement endpoint has the advantage that it provides a clear picture of the changes in range and density of animals relative to
a baseline condition (Hoye et al., 2012). Previously, ALMaSS results
have been expressed as changes in local abundance and spatial distribu-tion as described by the univariate Ripley's K(r) (Jepsen et al., 2005).
However, this approach is both statistically difficult and results in
relatively complex outputs. The AOR-Index was designed to ease both calculation and communication, and works by comparing changes in oc-cupancy and abundance to a baseline scenario. The baseline acts as a ref-erence against which the impacts of scenario changes can be evaluated.
Occupancy was quantified by overlaying the landscape by a regular
grid and quantifying the proportion of grid cells containing (super-)
in-dividual female beetles using the procedure described byHoye et al.
(2012). The aim of this procedure is to obtain a grid-cell size large enough to allow more than one (super-) individual to be present in each grid cell but small enough also to avoid occupancy and abundance being identical. Two rules were used to identify the grid cell size: 1) in the baseline scenario approximately 50% of the cells should be occupied; 2) if possible within the above constraints the grid size
cho-sen should result in a mean occupancy ofN5. The resulting grid size
for all simulations in this study was 50 × 50 m2. Occupancy was
quanti-fied by the proportion of grid cells occupied by at least one model adult female (i.e. 100 real-world females) for each annual recording of the lo-cations of super-individuals averaged across a 10-year simulation peri-od from year 20 to year 30. Abundance was calculated as the mean number of super-females in grid cells where super-individuals were present. The result can be recorded and translated into a plot of AOR
Table 1
Percentage cover by area of each landscape element type in the two landscapes used in this study. The total area of each landscape is 10 × 10 km2. No asterisk indicates a
non-breeding habitat. SeeTopping et al. (2013)for more details.
Landscape element type Herning Præstø
Bushes/scrub 0.8 0.3
Fields (rotation)⁎⁎ 70.5 66.1
Heath⁎ 3.4 0.0
Linear features (excl. hedge banks)⁎ 3.9 2.5
Hedge bank⁎ 0.9 0.3 Permanent pasture⁎ 1.2 0.0 Unmanaged grassland⁎ 2.6 2.5 Urban 4.6 6.4 Water 0.6 0.7 Wetland 2.1 1.2 Woodland 8.6 19.6 Woodland plantation 1.7 0.6 Total 100.0 100.0
⁎ Indicates suitable breeding habitat for beetles where reproductive rate of 50% of max-imum possible in the model.
⁎⁎ Optimal breeding habitat where reproductive rate is assumed to be at the maximum possible.
Table 2
Percentage by area of arablefield for manipulated non-cropped field boundaries (FB) for the Herning and Præstø landscapes.
Landscape
Field boundary width (m) Herning Præstø
1 1.8% 1.0%
5 8.8% 5.2%
indicating changes in abundance and occurrence relative to a baseline condition expressed as a 2-D plot.
2.3.3. Spatially indexed data
Data were collected on thefirst day of each month on the number of
female beetles present both in the arablefields (in-crop) and in the rest of the landscape (off-crop). Note that beetles in an unsprayed crop mar-gin were classed as being in-crop. These data were collected at the full 10 × 10 km landscape scale, but also for each 1-km2area based on a
reg-ular 1-km grid. Using the same procedure as for the overall impact, the
1-km2grid provided the opportunity to assess how representative of
the 10 × 10 km landscape an impact assessment would be if carried out on the 1-km2scale.
3. Results
The impact of pesticide use on the population of B. lampros in
differ-ent landscape setting scenarios (seeTable 3) was simulated with
ALMaSS. For each scenario, standard errors for the simulation endpoints ‘reduction in beetle population size in in-crop and off-crop areas’ (Table 3) were computed from 10 replicate runs and were in all cases less than 0.17%, giving a margin of error less than 0.40% for any single scenario and a margin of error less than 0.55% for comparing any two scenarios. Simulation replicates were therefore very similar and no more than 10 replicates were needed.
The annual variation in beetle numbers measured as the mean abun-dance over each 12 month period showed considerable variation. This variation was related to changes in weather, with repeating 10-year
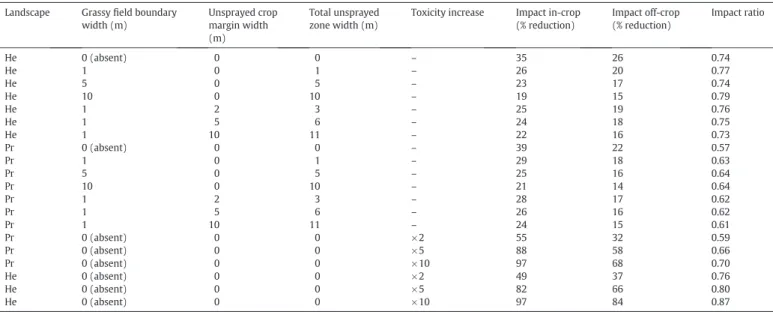
Table 3
Scenario definitions and impacts in in-crop and off-crop areas as relative proportion reduction of mean annual beetle population size of all scenarios relative to their respective baseline when pesticide is applied. Impact ratio is the ratio of off-crop to in-crop impacts on population size. Landscapes: He = Herning, Pr = Præstø; ×2, ×5, ×10: toxicity increased 2, 5, 10 fold. See text for more details.
Landscape Grassyfield boundary width (m) Unsprayed crop margin width (m) Total unsprayed zone width (m)
Toxicity increase Impact in-crop (% reduction) Impact off-crop (% reduction) Impact ratio He 0 (absent) 0 0 – 35 26 0.74 He 1 0 1 – 26 20 0.77 He 5 0 5 – 23 17 0.74 He 10 0 10 – 19 15 0.79 He 1 2 3 – 25 19 0.76 He 1 5 6 – 24 18 0.75 He 1 10 11 – 22 16 0.73 Pr 0 (absent) 0 0 – 39 22 0.57 Pr 1 0 1 – 29 18 0.63 Pr 5 0 5 – 25 16 0.64 Pr 10 0 10 – 21 14 0.64 Pr 1 2 3 – 28 17 0.62 Pr 1 5 6 – 26 16 0.62 Pr 1 10 11 – 24 15 0.61 Pr 0 (absent) 0 0 ×2 55 32 0.59 Pr 0 (absent) 0 0 ×5 88 58 0.66 Pr 0 (absent) 0 0 ×10 97 68 0.70 He 0 (absent) 0 0 ×2 49 37 0.76 He 0 (absent) 0 0 ×5 82 66 0.80 He 0 (absent) 0 0 ×10 97 84 0.87
Fig. 2. Thirty-year simulation, including the‘burn-in’ period, of annual mean 12-month adult female beetle super-individuals per 100 km2
for Herning and Præstø landscapes. These data come from zerofield boundary scenarios showing in-crop and off-crop populations when no test pesticide is applied.
cycles being clearly visible (Fig. 2). Total beetle populations were comprised of approximately two-thirds in-crop and one-third off-crop beetles in both Herning and Præstø landscapes.
To simplify comparisons and remove the direct effect of weather variation impacts, scenarios where a test pesticide was applied are shown as population size relative to the appropriate baseline. Hence, a value of 100% indicates no impact. Results were summarised as mean population impact over thefinal 10 years of simulation (Table 3). The ratios between in-crop and off-crop impacts clearly show a difference between the two landscapes, with impacts in off-crop populations in Herning always being higher than in Præstø. Conversely, in-crop im-pacts were consistently higher in Præstø (Table 3).
Increasing the width offield boundaries decreased both in-crop and
off-crop impacts. Assuming comparisons with the relevant scenario
with pesticide but withoutfield boundaries, adding 1-m boundaries
aroundfields reduced impacts by 25 and 27% in crop and 44 and 54%
off-crop for Herning and Præstø landscapes respectively (Table 3).
In-creasing the size offield boundary to 5 m decreased impacts by 34%
and 36% in-crop and 51% and 59% off-crop; increasing to 10 m decreased impacts further by 45% and 46% in-crop and 59% and 65% off-crop for
Herning and Præstø respectively. Hence, increasingfield boundary
width decreased the impact of pesticide application on the size of beetle population, but not linearly, with a 10 m boundary being a less than 1.5 times as good as a 1 m boundary.
The effect of adding unsprayed crop margins was similar to
increas-ingfield boundaries, but was at a lower magnitude. Adding a 10-m
unsprayed crop margin to a 1 mfield boundary (seeTable 3) decreased
pesticide impacts by further 14% and 12% in-crop and 15% and 14%
off-crop for Herning and Præstø respectively relative to a 1-mfield
bound-ary with no unsprayed margin.
Doubling the sensitivity of the beetles (seeTable 3, scenarios
× 2) increased population impacts by 38 and 40% in-crop, and by 41 and 45% off-crop (Herning and Præstø respectively). An increase in sensitivity of × 5 led to an increased impact of 133 and 172% in-crop, and 153 and 159% off-crop (Herning and Præstø respectively); increasing sensitivity × 10 led to an increased impact of 176 and 204% in-crop, and by 224 and 204% off-crop (Herning and Præstø respectively).
The two components of the AOR index also showed minimal vari-ability. The standard error for each abundance measure was less than 0.02% and for each occupancy measure less than 0.05%, hence even small differences are due to scenario factors and not noise in the data set. Relative impacts can be visualised using standard AOR-Index plots (Fig. 3). In both landscapes the impacts are much larger in zerofield boundary landscapes, and are reduced maximally by having a 10-m field boundary. A reduction in impacts occurred with increasing grassy field boundary or unsprayed margin width in both landscapes following a similar pattern. There were consistent differences between the two landscapes in the responses to pesticide, with higher impacts on abun-dance in Herning (cf. Præstø) and higher impacts on occupancy in Præstø (cf Herning).
As expected from the overall population size impacts (Table 3),
increasing the toxicity of the applied pesticide had major impacts on both abundance and occupancy with similar patterns in both land-scapes (Fig. 4). Impacts on beetle abundance were, however, generally greater in the Herning landscape, whereas impact on occupancy were broadly similar with a tendency for higher impacts in Præstø.
However, displaying the relative impacts of pesticides on beetle pop-ulation endpoints hides major baseline differences between scenarios. Fig. 5shows changes in occupancy and abundance for the standard tox-icity scenarios when pesticide is applied. The baseline population
condi-tions vary considerably between scenarios. Addingfield boundaries of
1 m width (going from 0 to 1 m inFig. 5) increased population
abun-dance by approximately 50% whereas subsequent increased width of
thesefield boundaries increased occupancy with a maximum range of
67 to 74% in Herning.
3.1. Temporal effects
The ratio of impacts on the mean annual population size of B. lampros relative to baseline between like weather years (10 years apart) was not constant but approached stable values in all standard toxicity scenarios after 3 years. However, increasing the toxicity of the pesticide increased the time to population stabilisation from typically three years in the standard scenarios to greater than 10 years for very high toxicity scenarios (Fig. 6). Speed of relative population stabilisation
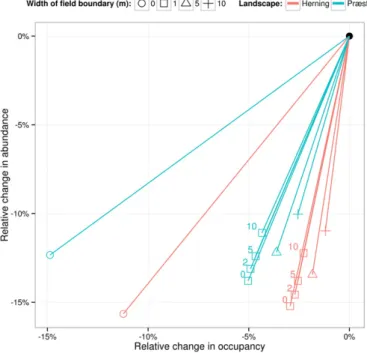
Fig. 3. Changes in mean annual occupancy and abundance of Bembidion lampros popula-tions (plot of Abundance to Occupancy Relapopula-tionship) when pesticide is applied to different landscape scenarios. Numbers next to points with 1 mfield boundary indicate the width (m) of unsprayed margin if present.
Fig. 4. Changes in mean annual occupancy and abundance of Bembidion lampros popula-tions (plot of Abundance to Occupancy Relapopula-tionship) in a landscape scenario without field boundaries when the toxicity of the pesticide is increased. X = toxicity increase of the pesticide: 2, 5 or 10 fold the standard value.
was similar between the Præstø and Herning landscapes. In all cases, in-crop stabilisation was slower than off-in-crop stabilisation for the same scenario. Slopes of very high toxicity scenarios (value ×10) were steep-er than the next highest toxicity (value ×5).
4. Discussion
4.1. Assessment of pesticide ERA impact on beetle population at landscape scale
All simulated landscape and toxicity scenarios clearly indicate the impact of source-sink dynamics on the effect of pesticide application
for the population of the beetle B. lampros. Impacts in off-crop popula-tions were often high, especially where there was little off-crop area. The effect of pesticide use was reduced with increasing area of suitable
over-wintering and breeding habitats aroundfields (in this case field
boundaries with permanent grass). Thesefindings indicate no-spray
zones with permanent grass to be an important consideration for the impact of pesticides on non-target populations. Buffer strips are usually
intended to reduce exposure of other off-crop habitats (e.g.Broughton
et al., 2014; Felsot et al., 2011; Forster and Rothert, 1998; Streloke and Brown, 2003), but here we suggest that– with proper management – they may also have an important function as source habitats for recolo-nization offields, in similar way to beetle banks providing source habi-tats for predators (MacLeod et al., 2004). This is in line with somefield studies showing the importance offield margins for colonisation of cul-tivatedfields by non-target invertebrates (Cole et al., 2012), including species of such low migratory rates as the earthworm Lumbricus terrestris (Nuutinen et al., 2011).
Unsprayed crop margins reduced population impacts of the
pesti-cide, but less so than the effect of adding an unsprayed grassyfield
boundary without crop. In both cases it was assumed that there was a 1-mfield boundary (Table 3). The effect of adding unsprayed crop mar-gins is, however, measured without taking into account the reduction in spray drift that these margins would also provide in thefield. The lower
beneficial effect of increasing unsprayed crop margin width compared
to the impact of grassyfield boundaries is due to the fact that the un-sprayed crop margin only differs from in-crop in not receiving pesticide.
The grassyfield boundary does not receive pesticide, but also is not
ploughed (incurring mortality), and acts as an over-wintering location for this beetle species.
Impacts of pesticide use on the population of B. lampros were not in-stantaneous but changed over a number of years, particularly in high
impact scenarios. This is important becausefield experiments used to
evaluate impact of pesticides on non-target organisms normally only
consider up to a one-year time frame afterfirst application (Candolfi
et al., 2001). Year-on-year application will therefore give a greater over-all population impact than would be measured from a single application if there is not 100% recovery of the population in between spray applica-tions or spraying seasons.
In the simulated scenarios, toxicity of the pesticide was clearly a crit-ical factor in determining impacts of pesticide application on popula-tions at landscape scale, although landscape settings also exerted strong effects. A 10-times increase in beetle sensitivity (equivalent to
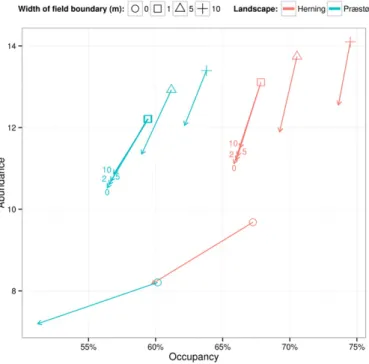
Fig. 5. Changes in mean annual occupancy and abundance (mean number of super-indi-viduals per grid cell) of Bembidion lampros populations when pesticide is applied to differ-ent landscape scenarios. Arrows indicate the changes in occupancy and abundance when pesticide is applied. One metrefield boundary includes all such scenarios, i.e. also those with an unsprayed margin for which numbers next to arrowheads indicate the width (m) of the unsprayed margin.
Fig. 6. The additional impact on Bembidion lampros in years 11–20 after pesticide treatment started compared to populations 10 years earlier, for in-crop and off-crop areas in the Herning landscape scenario. Non-zero values indicate a delay in reaching a stable equilibrium population in the presence of the pesticide.
a 10-times more toxic pesticide), led to long-term population declines of over 90%, or expressed as change in occupancy and abundance, a de-crease of 80% in abundance and 50% occupancy. However, these results are likely to change under specific realistic scenarios. In other simula-tions assessing the effects of pesticides on a vole species, toxicity was
only one of a number of equally important factors influencing the vole
population at landscape scale (Dalkvist et al., 2009). 4.2. Methods of incorporating beetle exposure to the pesticide in the simulation
The method used to model beetle exposure in our simulations is rel-atively crude. We used an effect probability above a threshold to give an 80% chance of dying over a seven-day period with environmental con-centration of pesticide above a trigger concon-centration. The disadvantage of this approach is that for long-period of exposure effects are virtually certain as probabilities combine each day, a result of multiple double jeopardy probabilities. This does not represent the case where individ-uals in a population have differential sensitivities to a chemical stressor; as a result, local extinction might occur in the simulations which could have important consequences for pesticide population impact and re-covery. One suggestion would be to use an individual sensitivity distri-bution whereby individuals have different threshold levels for effects. This would prevent very high mortality with long exposure, but would equally prevent long exposure having any impact above the instant the highest dose was experienced.
In all cases the effects of multiple applications, long-term exposure and internal accumulation need to be considered, whilst avoiding ‘double jeopardy’ effects. It is also possible that previous exposure predisposes individuals to effects rendering them more sensitive to the same dose experienced later. One useful facet of laboratory toxicity testing is that the effect rate may change with time, typically highest
in thefirst period and declining with time, e.g. LC50 of cadmium
(Ardestani and van Gestel, 2013). This could be considered if individuals carry a memory of past exposure and effect probabilities be reduced with time.
A further complication is the need to include a dose–response rela-tionship in whichever method is chosen and in all cases the implications of using one or other methods on the outcome of the assessment should be evaluated for future application in ERA. It should also be noted that the complications arising from linking exposure to effects in a model will be further compounded by any synergistic or antagonistic mixture effects, should mixtures or multiple stressors be considered.
4.3. Mitigation of risks deriving from pesticide application
Our results suggests an alternative way to approach the risk assess-ment by integrating even stronger potential mitigation strategies at landscape level as part of the authorisation conditions for pesticides. In the case of non-target arthropods (here represented by B. lampros) it seems that, even with pesticide applied, the condition of the
popula-tion in landscapes with a minimum of 5-m properly managedfield
boundaries is at least as good as the landscapes withoutfield boundaries and without pesticide application (seeFig. 5). This indicates the poten-tial to use simulation results based on more realistic scenarios to carry out an analysis of potential mitigation strategies in given landscapes. If real landscape conditions were taken into account, addition or widening
offield boundaries or other non-spray areas could be considered as a
way to mitigate the impact of a pesticide. The state of the population with pesticide and mitigation strategy could be compared to a baseline condition to evaluate overall impact using the model framework. A sim-ilar idea has been suggested byKuchnicki et al. (2005)in order to link different buffer widths to environmental risk in Canada in a proposed
strategy for aflexible approach to modify pesticide-specific buffer
zones for agricultural applications of pesticides.
An interesting result was seen in the simulations of one landscape
scenario (Herning, seeFig. 5): When adding a small 1-mfield boundary
under the impact of pesticides it showed similar effects on the beetle
population as the same landscape but withoutfield boundaries and
without pesticides. In the landscape with the small boundaries, how-ever, although there was a decrease in occupancy due to the pesticide application, there was still a far higher abundance of animals compared to the landscape scenario without any boundaries. This in effect means that in landscapes with smallfield boundaries, the range of the beetles was reduced by pesticide applications, but where the animals were still present the densities were higher than in landscape scenarios
with-out anyfield boundaries.
The observed effects of adding/increasingfield boundaries without
crop plants will be probably even more evident for some other NTA groups, such as pollinators with herbivorous larval stages. Infields with-out borders or with too narrow and uniform borders, herbivorous larvae have no host plants; even without pesticide treatments, populations of such species would become extinct in many agricultural landscapes.
On the other hand, adding sufficiently broad off-field habitats as e.g.
grassyfield boundaries or non-cropped areas in-field should help to
maintain viable populations of such species in agricultural landscapes (Thomas et al., 2000), possibly even with moderate use of pesticides. This is in line with thinking on the causes of decline in biodiversity being related to a homogenisation of the landscape and its habitats (Benton et al., 2003) and to a decline in non-cropped, non-sprayed hab-itats. Therefore, there is real potential for improving biodiversity by in-creasing habitat heterogeneity and non-sprayed areas, so that, for example, food provision for birds is supported through a highly diverse biocoenosis of non-target invertebrates (Vickery et al., 2009).
4.4. Landscape affects the impact of pesticide on invertebrate populations Although the trends in the mitigation of risk from pesticide use
asso-ciated with adding one or other boundary type to thefield in different
landscapes were clear and consistent, the actual size of pesticide im-pacts and the relative difference between in-crop and off-crop effects differed between the differing landscapes, here Herning and Præstø.
This is important because it shows that real landscape configurations
will have an impact on the outcome of an ERA employing simulation endpoints, even, as in this case, they appear quite similar. Pesticide im-pacts on population of non-target organisms are also hard to predict in advance of the simulation because overall effects depend on an interac-tions between stressor dynamics (spray regime and fate), landscape structure and organism dynamics.
Landscape structure resulted in differences in overall pesticide effect on population endpoints at large scales. Pesticide impacts in Herning landscape were generally higher on abundance endpoints, whereas im-pacts on occupancy were higher in Præstø. In baseline scenarios without pesticide application, beetle abundance was similar in both landscapes, but occupancy was much higher in Herning. As a result, in-crop pesti-cide impacts on beetle population in Præstø were higher than in Her-ning, but off-crop impacts on beetle population were higher in Herning (see relative impacts inTable 3). This suggests that the larger off-crop population in Herning was buffering the effects on the
in-crop population more efficiently than in Præstø, although this larger
off-crop population also suffered the largest proportional pesticide
im-pacts. Hence, depending upon the definition of the protection goals,
this could result in the populations exhibiting the best post-pesticide application health (seeFig. 4), also being designated as those most at risk. This is similar to previous simulation results with vole species, where proximity of source populations to the area of pesticide use
re-duced impacts at the population level (Dalkvist et al., 2013). Thus,
from a population-ecological point of view, the numbers of individuals affected may not be indicative of the overall pesticide impact on popu-lations at landscape level.
4.5. Implications of the simulation results for possible future regulatory ERA
Introducingfield boundaries around crop fields resulted in
signifi-cant decrease of pesticide effects on the population of the non-target in-vertebrate B. lampros both off-crop and in-crop. However, in all of the scenarios the off-crop impact was high when compared to the
thresh-olds defined by the recent scientific opinion (EFSA PPR Panel, 2015),
i.e. a 10% decrease in population density for local direct off-crop effects and non-negligible reductions in range occupancy and wider abun-dance at landscape scales. Given the high toxicity of the pesticide in
the simulations, even introducing 10 m widefield boundaries resulted
in 15%–16% decrease of mean annual population size off-crop. However,
beforefirm conclusions can be reached regarding the comparison of
local scale, traditional ERA and the illustrated landscape approach, it
would be useful to assess multiple factors potentially influencing the
ERA outcome in this specific case. These would include pesticide drift, different crop rotations, weather, different landscape structures and ap-plication schedules. In developing these scenarios, the impact of other stressors, including other pesticides used on other crops, would also need to be taken into account. Overall, this would provide essential background for selecting factors necessary for inclusion in realistic worst-case regulatory ERA scenarios (EFSA PPR Panel, 2014).
Given suitable environmental scenarios, if we assume that compara-ble Abundance to Occupancy Relationship (AOR) indices equate to com-parable ecological population states, then the landscape-modelling approach would also offer the possibility to test and to compare the ef-ficiency of different risk-mitigation options using the endpoints of AOR plots as a working guide. This would offer new options for risk assessors and risk managers in the authorisation process by directly implementing mitigation options at landscape scale in the risk assess-ment process.
4.6. Possibilities to link regulatory ERA of pesticides to Common Agricultural Policy subsidies
When working with pesticide ERA at landscape scales, including possibly mandatory mitigation measures to reduce impacts, there are issues that overlap with other regulations (e.g. Common Agricultural Policy CAP subsidy schemes and the Sustainable Use Directive (EU Di-rective 2009/128/EC)). These issues cannot be solved in the context of
pesticide authorisation alone. Environmental benefits under the CAP
are achieved using the Cross Compliance mechanism, whereby farmers are encouraged to fulfil certain environmental conditions in return for
governmental support payments (Meyer et al., 2014). With careful
se-lection of efficacious mechanisms, there is therefore the potential to
link mitigation measures developed during the pesticide-regulation procedure to pesticide use, using the cross-compliance con-cept already in force. In effect this would change the focus from individ-ual processes or products towards an integrated landscape-scale management.
Authorisation of the use of pesticides, providing that suitable landscape-scale mitigation measures are put in place, will thus poten-tially have two major benefits. Firstly, provision of targeted mitigation
measures, developed and tested for example via landscape-specific
sce-nario modelling, may in itself lead towards a re-biodiversification of the agricultural landscapes in Europe and could help in achieving the goal of the halt of loss of biodiversity by 2020 (Anon., 2012). Secondly, it pro-vides a way for pesticides still to be used in agriculture in Europe with less harm to biodiversity, even if those pesticides may cause local population-level effects.
5. Conclusions and recommendations
The results of this study show that a risk assessment that is focused on the local (field) scale and on short-term studies is insufficient to pre-dict effects on populations of non-target organisms at larger landscape
scales and longer temporal scales. This is based on a number of key con-cepts that were demonstrated by the scenario modelling:
1. Action at a distance— We demonstrated an off-crop effect from
in-crop mortality. Given highly toxic pesticides, annual effects of up to 70% or mean effects of 26% reduction in off-crop population size were predicted after 10 years (even without spray drift).
2 Long-term effects— Assessment based on a single spray application
would underestimate the long-term effects. This was demonstrated by the fact that, at high toxicities, the population decline was still on-going after 20 years of pesticide use. Even realistic toxicity scenarios required three years for populations to stabilise.
3. Mitigation-strategy evaluation— scores of abundance and occupancy
relationships (AOR) allowed comparative evaluation of pesticide im-pacts and consequences of implementing mitigation measures di-rectly from the modelling outputs and provide a simple method for reducing complex spatio-temporal patterns to simple metrics.
As a consequence of these concepts, traditional higher tier ap-proaches in pesticide risk assessment, which are conducted in small
plots in treated and untreatedfields, would need to be supplemented
by modelling in order to take into account long-term population effects and source-sink dynamics and management effects. However, unlike the scenarios used in this study, more realistic environmental and appli-cation scenarios would be needed, e.g. carefully chosen vulnerable key driver species and implementation of drift. We therefore recommend that future research be directed towards assessing the contribution of multiple environmental, eco-toxicological and management factors to the ERA of pesticides to determine those most critical in causing vari-ability in ERA conclusions. Evaluating both impacts and mitigation mea-sures concurrently and taking account of these factors provides a tantalizing possibility, i.e. moving from regulation of a single pesticide, often with no explicit consideration of landscape, towards the consider-ation of pesticide management at landscape scales and provision of bio-diversity benefits.
Acknowledgements
This work was based on EFSA working group on the state of the sci-ence on risk assessment of plant protection products for non-target ar-thropods. The publication was drafted under the sole responsibility of the authors and is not considered as an EFSA output. The positions and opinions presented are those of the authors alone and are not intended to represent the views of EFSA.
References
Anon., 2012.European Parliament Resolution of 20 April 2012 on Our Life Insurance, Our Natural Capital. An EU biodiversity strategy to 2020 (2011/2307(INI)).
Anon., 2015. EFSA Assessment Reports on Pesticide Active Substances.http://dar.efsa. europa.eu/dar-web/provision(accessed 20/05/2015).
Ardestani, M.M., van Gestel, C.A.M., 2013.Toxicodynamics of copper and cadmium in Folsomia candida exposed to simulated soil solutions. Environ. Toxicol. Chem. 32, 2746–2754.
Artigas, J., Arts, G., Babut, M., Caracciolo, A.B., Charles, S., Chaumot, A., et al., 2012.Towards a renewed research agenda in ecotoxicology. Environ. Pollut. 160, 201–206.
Benton, T.G., Vickery, J.A., Wilson, J.D., 2003.Farmland biodiversity: is habitat heterogene-ity the key? Trends Ecol. Evol. 18, 182–188.
Bilde, T., Topping, C., 2004.Life history traits interact with landscape composition to influ-ence population dynamics of a terrestrial arthropod: a simulation study. Ecosciinflu-ence 11, 64–73.
Broughton, R.K., Shore, R.F., Heard, M.S., Amy, S.R., Meek, W.R., Redhead, J.W., et al., 2014.
Agri-environment scheme enhances small mammal diversity and abundance at the farm-scale. Agric. Ecosyst. Environ. 192, 122–129.
Cairns, J., Niederlehner, B.R., 1996.Developing afield of landscape ecotoxicology. Ecol. Appl. 6, 790–796.
Candolfi, M.P., Barrett, K.L., Cambell, P.J., Forster, R., Grandy, N., Huet, M.-C., et al., 2012.
Guidance document on regulatory testing and risk assessment procedures for plant protection products with non-target arthropods. ESCORT 2 workshop, 2000 Mar 21–23, Wageningen, the Netherlands SETAC, Pensacola, FL. USA, 46 p.
Cole, L.J., Brocklehurst, S., Elston, D.A., McCracken, D.I., 2012.Riparianfield margins: can they enhance the functional structure of ground beetle (Coleoptera: Carabidae)
assemblages in intensively managed grassland landscapes? J. Appl. Ecol. 49, 1384–1395.
Dalkvist, T., Topping, C.J., Forbes, V.E., 2009.Population-level impacts of pesticide-induced chronic effects on individuals depend more on ecology than toxicology. Ecotoxicol. Environ. Saf. 72, 1663–1672.
Dalkvist, T., Sibly, R.M., Topping, C.J., 2013.Landscape structure mediates the effects of a stressor onfield vole populations. Landsc. Ecol. 28, 1961–1974.
EFSA PPR Panel, 2010.Scientific opinion on the development of specific protection goal options for environmental risk assessment of pesticides, in particular in relation to the revision of the Guidance Documents on Aquatic and Terrestrial Ecotoxicology (SANCO/3268/2001 and SANCO/10329/2002). EFSA J. 8, 1821.
EFSA PPR Panel, 2014.Scientific opinion on good modelling practice in the context of mechanistic effect models for risk assessment of plant protection products. EFSA J. 12, 3589.
EFSA PPR Panel, 2015.Scientific opinion addressing the state of the science on risk assess-ment of plant protection products for non-target arthropods. EFSA J. 13, 3996.
Felsot, A.S., Unsworth, J.B., Linders, J.B.H.J., Roberts, G., Rautman, D., Harris, C., et al., 2011.
Agrochemical spray drift; assessment and mitigation— a review. J. Environ. Sci. Health B 46, 1–23.
Focks, A., ter Horst, M., van den Berg, E., Baveco, H., van den Brink, P.J., 2014.Integrating chemical fate and population-level effect models for pesticides at landscape scale: new options for risk assessment. Ecol. Model. 280, 102–116.
Forbes, V.E., Calow, P., Sibly, R.M., 2008.The extrapolation problem and how population modeling can help. Environ. Toxicol. Chem. 27, 1987–1994.
Forster, R., Rothert, H., 1998.The Use of Field Buffer Zones as a Regulatory Measure to Re-duce the Risk to Terrestrial Non-target Arthropods From Pesticide Use.
Gaston, K., Blackburn, T., Greenwood, J., Gregory, R., Quinn, R., Lawton, J., 2000.
Abundance-occupancy relationships. J. Appl. Ecol. 37, 39–59.
Grimm, V., Revilla, E., Berger, U., Jeltsch, F., Mooij, W.M., Railsback, S.F., et al., 2005.
Pattern-oriented modeling of agent-based complex systems: lessons from ecology. Science 310, 987–991.
Holland, E.P., Aegerter, J.N., Dytham, C., Smith, G.C., 2007.Landscape as a model: the im-portance of geometry. Plos Comput. Biol. 3, 1979–1992.
Hoye, T.T., Skov, F., Topping, C.J., 2012.Interpreting outputs of agent-based models using abundance-occupancy relationships. Ecol. Indic. 20, 221–227.
Jepsen, J.U., Topping, C.J., Odderskaer, P., Andersen, P.N., 2005.Evaluating consequences of land-use strategies on wildlife populations using multiple-species predictive scenar-ios. Agric. Ecosyst. Environ. 105, 581–594.
Kromp, B., 1990.Carabid beeltes (Coleoptera, Carabidae) as bioindicators in biological and conventional farming in Austrian potatofields. Biol. Fertil. Soils 9, 182–187.
Kuchnicki, T., Clarke, A.E., Glaser, J.D., Hodge, V.A., Wolf, T.M., 2005.The use of buffer zones for habitat protection: a proposed strategy. Field Boundary Habitats: Implica-tions for Weed. Insect Dis. Manag. 1, 5–13.
Landis, W.G., 2003.Twenty years before and hence; ecological risk assessment at multiple scales with multiple stressors and multiple endpoints. Hum. Ecol. Risk. Assess. 9, 1317–1326.
Macfadeyen, S., Muller, W., 2013.Edges in agricultural landscapes: species interactions and movement of natural enemies. PLoS ONE 8.
MacLeod, A., Wratten, S.D., Sotherton, N.W., Thomas, M.B., 2004.‘Beetle banks’ as refuges for beneficial arthropods in farmland: long-term changes in predator communities and habitat. Agric. For. Entomol. 6, 147–154.
Meyer, C., Matzdorf, B., Muller, K., Schleyer, C., 2014.Cross compliance as payment for public goods? Understanding EU and US agricultural policies. Ecol. Econ. 107, 185–194.
Nienstedt, K.M., Brock, T.C.M., van Wensem, J., Montforts, M., Hart, A., Aagaard, A., et al., 2012.Development of a framework based on an ecosystem services approach for de-riving specific protection goals for environmental risk assessment of pesticides. Sci. Total Environ. 415, 31–38.
Nuutinen, V., Butt, K.R., Jauhiainen, L., 2011.Field margins and management affect settle-ment and spread of an introduced dew-worm (Lumbricus terrestris L.) population. Pedobiologia 54, S167–S172.
Pulliam, H.R., 1988.Sources, sinks, and population regulation. Am. Nat. 132, 652–661.
Scheffer, M., Baveco, J.M., Deangelis, D.L., Rose, K.A., Vannes, E.H., 1995.Super-individuals a simple solution for modeling large populations on an individual basis. Ecol. Model. 80, 161–170.
Streloke, M., Brown, C., 2003.Risk Mitigation Measures to Protect Non-target Life in the Frame of the Authorization of Pesticides.
Tamaddoni-Nezhad, A., Milani, G.A., Raybould, A., Muggleton, S., Bohan, D.A., 2013. Con-struction and validation of food webs using logic-based machine learning and text mining. In: Bohan, W. (Ed.), Advanced in Ecological Research: Ecological Networks in an Agricultural World. Academic Press, San Diego USA, pp. 225–290.
Thomas, S.R., Goulson, D., Holland, J.M., 2000.The contribution of beetle banks to farm-land biodiversity. Asp. Appl. Biol. 31–38.
Thorbek, P., Bilde, T., 2004.Reduced numbers of generalist arthropod predators after crop management. J. Appl. Ecol. 41, 526–538.
Topping, C.J., 2009. ALMaSS Bembidion ODdox Documentation.http://www2.dmu.dk/ ALMaSS/ODDox/Bembidion/index.html(accessed 22/07/2015).
Topping, C.J., Lagisz, M., 2012.Spatial dynamic factors affecting population-level risk as-sessment for a terrestrial arthropod: an agent-based modeling approach. Hum. Ecol. Risk. Assess. 18, 168–180.
Topping, C.J., Hansen, T.S., Jensen, T.S., Jepsen, J.U., Nikolajsen, F., Odderskaer, P., 2003.
ALMaSS, an agent-based model for animals in temperate European landscapes. Ecol. Model. 167, 65–82.
Topping, C.J., Hoye, T.T., Olesen, C.R., 2010.Opening the black box—development, testing and documentation of a mechanistically rich agent-based model. Ecol. Model. 221, 245–255.
Topping, C.J., Kjær, L.J., Hommen, U., Høye, T.T., Preuss, T.G., Sibly, R.M., et al., 2013. Recov-ery based on plot experiments is a poor predictor of landscape-level population im-pacts of agricultural pesticides. Environ. Toxicol. Chem. 7, 1499–1507.
van Heesch, D., 1997. Doxygen.www.doxygen.org(accessed 22/07/2015).
Vickery, J.A., Feber, R.E., Fuller, R.J., 2009.Arablefield margins managed for biodiversity conservation: a review of food resource provision for farmland birds. Agric. Ecosyst. Environ. 133, 1–13.