Regional costs and benefits of alternative
post-Kyoto climate regimes
Comparison of variants of the Multi-stage and Per Capita Convergence regimes
D.P. van Vuuren, M.G.J. den Elzen, M.M. Berk, P. Lucas, B. Eickhout, H. Eerens, R. Oostenrijk
This research was conducted as RIVM's contribution to a collaborative research project "Greenhouse gas reduction pathways in the UNFCCC post-Kyoto process up to 2025", commissioned by DG Environment of the European Commission. The research also profited from support by the Dutch Ministry of Environment for the International Climate Change Policy Support Project (M/728001 Ondersteuning Klimaatbeleid)
Abstract
The study documented here explores technical, economic and environmental implications of different post-Kyoto climate regimes for differentiation of future commitments that would lead to a stabilisation of greenhouse gas concentrations (Kyoto gases) in the atmosphere at 550 and 650 ppmv CO2-equivalents (S550e and S650e profile). The S650e profile requires less strict emission reductions but is unlikely to limit global temperature increase to 2oC over pre-industrial levels. In contrast, the S550e profile is more likely to keep global temperatures below this limit by 2100. Constrained by these two profiles, the implications of two different regimes, the Multi-stage and Per Capita Convergence approaches, are evaluated. For the Annex I regions, reduction targets are more dependent on the stabilisation level than on the type of regime chosen. In 2025, most regimes show emissions reductions for Annex I regions of 25-50% compared to their 1990 levels. For the non-Annex I regions, the results are generally more differentiated and differ strongly per regime and in time. Under all regimes, early participation of (major) non-Annex I regions is needed. Four groups of regions with similar efforts can be identified with respect to their abatement costs as percentage of GDP, i.e.: 1) the high income regions with high per capita emissions with average costs when compared to other regions (OECD90 regions); 2) Regions with medium to high per capita emissions and medium income levels show relatively the highest costs (Middle East & Turkey, FSU and to a lesser extent, Latin America; 3) Regions with low to medium income levels and per capita emissions (South-East & (South-East Asia) are confronted with low to average costs. 4) Regions with low per capita emissions and a low income (Africa and South Asia) show net gains from emissions trading. Implementation of these regimes leads to significant changes in the energy system and, consequently, in energy trade. For some regions, lost fuel export revenues can reflect the same order of direct abatement costs (in particular, the Middle East), while the revenues from biofuel trade can party offset these losses. The changes in the energy system can also induce significant co-benefits, such as a decrease in the sulphur and nitrogen oxide
emissions. Overall, the analysis shows that in evaluating the implications of various regimes, it is not sufficient to evaluate only the allocation of the emissions compared to baseline. Abatement costs and changes in energy trade will also have to be assessed. The gains from participating in global-emissions trading and realising reduced air pollution damage and/or abatement costs can make early participation of (large) developing countries in global GHG control possible at low costs or even net gains. However, the level and form of commitment will have to be well chosen – and not be too strict - to balance economic risks and political viability.
Acknowledgements
This report describes the research conducted by RIVM, National Institute for Public Health and the Environment, as a contribution to the EU research project ‘Greenhouse gas
reduction pathways in the UNFCC post-Kyoto process up to 2025’. This project was
directed by CNRS-IEPE (Institute de l’Economie et de Politique de l’Energie, France), with contributions from RIVM (Netherlands), National Technical University of Athens (Greece) and Center for Economic Studies, Katholieke Universiteit Leuven (Belgium). The report also draws on research performed for the Dutch Ministry of Environment within the Climate Change Policy Support project (M/728001 Ondersteuning Klimaatbeleid). The authors would like to thank the participants of IEPE, Patrick Criqui and Alban Kitous, for the constructive collaboration. We would like to thank our RIVM colleagues, in particular Bert Metz, André de Moor, Bert de Vries and Tom Kram for their comments and
contributions and Ruth de Wijs for language-editing assistance. The authors are very grateful to IIASA (and in particular Markus Amann and Janusz Cofala) for allowing us to use the RAINS-Asia model. Finally, we would like to thank Peter Zapfel and his collegues from DG-Environment of the European Commission for supporting the research and the discussions and suggestions during the project.
Contents
SUMMARY... 7
SAMENVATTING ... 11
1 INTRODUCTION... 15
1.1 Background...15
1.2 Analysing the implications of climate regime options...15
1.3 Purpose of the report...16
1.4 General overview of the report ...17
2 METHODOLOGY ... 19
2.1 Introduction...19
2.2 Overall steps within the analysis...19
2.2.1 Development of a baseline scenario without climate policies... 20
2.2.2 Development of global emission profiles for stabilising GHG concentration levels ... 20
2.2.3 Development of climate regimes and evaluation of emission allowances... 20
2.2.4 Technical and cost evaluation of the different regimes... 21
2.2.5 Assessment of implications for climate change and regional air pollution ... 21
2.3 Strengths and weaknesses of the current approach ...23
3 GLOBAL EMISSION CONSTRAINTS AND BASELINE EMISSION SCENARIO ASSUMPTIONS... 25
3.1 Introduction...25
3.2 The baseline scenario...25
3.3 Emission profiles for stabilisation of GHG concentration at 550 and 650 ppmv ...28
3.4 Impacts on temperature...32
3.5 Implications for emission reductions ...33
3.6 Conclusions...34
4 CLIMATE REGIMES FOR DIFFERENTIATION OF COMMITMENTS ... 35
4.1 Introduction...35
4.2 The climate regimes explored...35
4.2.1 New Multi-stage variants ... 35
4.2.2 The Per Capita Convergence variants... 40
4.3 Emission allowances under the S550e profile ...41
4.3.1 The Multi-Stage results ... 41
4.3.2 The PCC results ... 43
4.4 Analysis of emission allowances for the S650e profile ...43
4.4.1 The Multi-Stage results ... 43
4.4.2 The PCC results ... 44
4.4.3 Robustness of results... 45
4.5 All results of the S550e and S650e profiles compared ...48
4.6 Pros and cons of the Multi-Stage and Per Capita Convergence approaches...48
4.7 Conclusions...52
5 EMISSIONS TRADING, ABATEMENT COSTS AND THE IMPACTS ON THE ENERGY SYSTEM ... 55
5.1 Introduction...55
5.2 Emissions trading and abatement costs...57
5.2.1 International permit prices and global effort rate ... 57
5.2.3 Financial flows... 62
5.2.4 Abatement costs ... 65
5.2.5 Robustness of results... 68
5.3 Emission reductions for the different gases ...71
5.4 Abatement action within the energy system ...73
5.5 Overall conclusions...77
6 BENEFITS AND CO-BENEFITS OF MITIGATION ACTIONS... 79
6.1 Climate benefits of the two stabilisation scenarios...79
6.2 Co-benefits of climate policies for regional air pollution control...83
6.3 Potential co-benefits of the IMAGE S550e and IMAGE S650e mitigation scenarios .85 6.4 Looking more detailed into changes in Asia...90
6.5 Conclusions...93
7 CONCLUSIONS ... 95
7.1 Overall global target and need for international mitigation commitments ...95
7.2 Implications of 2 climate change regimes: Per Capita Convergence and Multi-stage..96
7.3 The costs and benefits of the climate regimes ...98
7.4 General insights gained... 101
REFERENCES ... 103
ANNEX 1: DESCRIPTION OF THE MODELS USED ... 108
The FAIR 2.0 model ...108
The IMAGE 2.2 Integrated Assessment model ... 110
The world energy model TIMER 1.0... 111
ANNEX 2: REGIONAL BREAKDOWN... 113
Summary
The Kyoto Protocol has been an important milestone in international climate
policy-making, but is only a first step in the efforts required to stabilise the greenhouse gas (GHG) concentration (UNFCCC, Article 2). This raises important questions about what future levels of commitments will be needed in the longer term and what will constitute a fair differentiation of commitments among countries. In an earlier report (den Elzen et al., 2003b), we analysed five different climate regimes in terms of their regional reduction targets (Multi-stage, Per Capita Convergence, Brazilian Proposal, Jacoby Rule and
Preference Score). In this study, we will present the results of two approaches selected for an in-depth analysis:
• The Per Capita Convergence approach (or Contraction and Convergence) which defines emission permits on the basis of a convergence of per capita emissions under a contracting global GHG emission profile (Meyer, 2000), with all countries participating from 2013 onwards.
• The Multi-stage approach, consisting of a system to divide countries into groups with different types of commitments (stages). The approach results in a gradual increase over time in the number of countries involved and their level of
commitment (Berk and den Elzen, 2001).
The regional environmental, technical and cost implications of variants of these two approaches are analysed under two different global emission profiles, leading to
stabilisation of GHG concentrations at 550 and 650 ppmv CO2-eq., respectively. For the analysis, we used a modelling framework consisting of the Integrated Assessment model, IMAGE 2.2, the world energy model, TIMER 1.0 and the climate policy assessment model, FAIR 2.0. The whole analysis is based on a multi-gas approach, with the aim of finding the most cost-efficient set of reduction options.
Baseline development and profiles for stabilising GHG concentrations.
• Sharp GHG emission reductions are required to limit global mean temperature increase to 2oC over pre-industrial level. For a median climate sensitivity, global GHG emissions need to peak before 2020 and return to 1990 levels around 2030. The baseline scenario of this study, depicting possible GHG emission trends in the absence of climate policies, leads to a global mean temperature increase of more than 3oC over pre-industrial levels by 2100 with further increases thereafter.
Table 1: Overview of the two emission profiles
Year in which: Change in 2050 Temperature increase Peak of global
emissions Emissions below1990 to baselineCompared Comparedto 1990
2100 Equilibrium
IMAGE-S550e 2015 2030 -65% -15% 2.0 (1.3-3.0) 2.4
IMAGE-S650e 2030 2070 -35% +50% 2.3 (1.5-3.5) 2.9
Note: temperature increases are given for median climate sensitivity; the numbers in parentheses indicate ranges for lowest and highest climate sensitivity of the IPCC range. Numbers for equilibrium temperature (i.e. the ultimate temperature increase achieved after 1-2 centuries) are taken from comparable profiles in (IPCC, 2001b)).
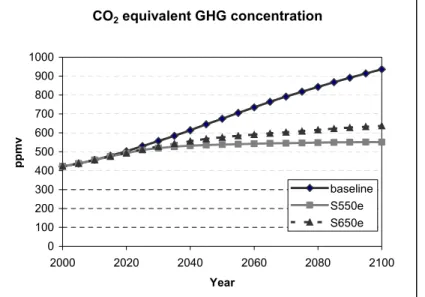
Two global emission profiles, S550e and S650e, were developed for stabilising GHG concentrations at 550 and 650 ppmv CO2 equivalent, respectively (see Table 1). Under the
S550e profile global mean temperature increase can remain below 2°C by 2100 for a low to medium value of the climate sensitivity1. Under the S650e profile, temperature increase in 2100 is unlikely to stay below this level, unless the climate sensitivity is at the low end of the range. At the same time, stabilising CO2 equivalent concentrations at 550 ppmv requires substantially larger and earlier emission reductions than at 650 ppmv.
Regional emission reduction objectives resulting from different climate regimes
• Halting global emissions growth within 2–3 decades will require early
participation of developing countries in climate policies at lower income levels than Annex I countries under the Kyoto Protocol. Considerable strengthening of the reduction targets of Annex I countries is also required.
• The abatement efforts (allocations) for Annex I regions for S550e generally range from 25%-50% below 1990 levels in 2025 (across regions and regimes) and 70-85% in 2050. For S650e, these efforts range from 10% increase to 25% reduction in 2025 and 40-60% reduction in 2050. The 2100 Per Capita Convergence regime forms an exception, leads to lower targets for Annex I regions.
• Most non-Annex I regions will need to reduce their emissions by 2025 compared to baseline levels, but emissions can increase compared to 1990 under all regimes analysed. For non-Annex I regions, the results are generally more differentiated for the various commitment schemes, stabilisation targets and time horizons (2025 versus 2050) than for Annex I regions.
The study explored three variants of the MS approach (different participation and differentiation rules) and two variants of the PCC approach (with different convergence years: 2050 and 2100) in terms of emission reduction requirements. For the Annex I regions, these were found to be much more determined by the stabilisation level than by climate regimes (in 2025, 40-60% reduction from baseline for S550e and 15-40% for S650e). Only the PCC regime based on a convergence year in 2100 forms an exception, and leads to the lowest reduction efforts for Annex I regions but the highest for non-Annex I regions. For the non-Annex I regions, results differ much more between regions and allocation regimes. For the low-income regions (Africa and South Asia), the reductions compared to the baseline levels in 2025 are limited (from less than 10% to even excess emission allowances), but increase to 20-40% in 2050. For the middle income regions (Latin America, Middle East & Turkey, and East and South-East Asia), these reductions increase from approximately 35-50% in 2025 to about 60-85% in 2050. Whether the PCC regime is more attractive to (low-income) non-Annex I countries depends strongly on the convergence year chosen. The analysis of the MS variants shows the SE & East Asia region (including China) to play a key role, as its participation relaxes the emission reductions for the other participating regions. Finally, the robustness analysis shows that future emission reductions of the different variants will depend just as much on the parameter chosen within each variant as the variant itself (the threshold levels for the MS approach and the convergence year for the PCC approach).
1 The climate sensitivity indicates the relationship between an increase in the GHG concentration and
Abatement costs and implementation of the different climate regimes.
• Stabilising the GHG concentrations at 550 and 650 ppmv CO2-eq. was found to be
feasible but resulting in major changes in the energy system. Restricting emissions to the S550e profile will require larger abatement costs than the S650e profile (equivalent to 1.0% versus 0.2% of world GDP in 2050)2. These numbers are subject to uncertainty (in particular regarding marginal abatement costs and the baseline scenario). There are large differences among the various regions. Under the S550e profile, costs range from net gains from Africa and South Asia in some regimes to costs up to 3-4% of GDP for Middle East&Turkey and 2% for CIS. • Global costs of the Per Capita Convergence regimes are generally lower than the
MS regimes, but this depends on a fully effective functioning of emission trading. • The financial consequences of changes in fuel trade could for some regions
(Middle East, North and West Africa, Oceania, possibly CIS and Latin America) be of the same order of magnitude as direct costs of implementing climate policies. Realising stabilisation of the GHG concentration at 550 and 650 CO2-eq requires
contributions from a large range of reduction options, including improved energy efficiency and profound changes in the energy mix. These changes, in combination with other
mitigation measures, lead to larger abatement costs for the S550e profile than for the S650e profile (equivalent to 1.0% and 0.2% of GDP, respectively, in 2050), with a corresponding international permit price of €120-130 and €30-40 per ton CO2-equivalent. Robustness analysis found for S550e, the costs to range from 1.0-1.5% for different assumptions on abatement costs. The international permit price and global abatement costs are mostly dependent on the GHG stabilisation level and the number of participants in international emission trading, while the regional effort rate is also dependent on the emission allocation rules; this can differ largely between regions (in particular, the non-Annex I regions). For the abatement costs as per cent of GDP, four groups with similar effort rates can be identified, i.e.: 1) regions with high per capita emissions and a high income (Annex I regions excluding the FSU) who are confronted average costs when compared to other regions (0.5-1.0% of GDP in 2025); 2) regions with medium to high per capita emissions, but a medium to low income (FSU, the Middle East & Turkey, and to a lesser extent, Latin America) confronted with average to high costs (1.0-2.0% of GDP in 2025 and lower for Latin America); 3) regions with low to medium income levels and per capita emissions (South-East & East Asia) showing low to medium cost levels (0-0.3% of GDP in 2025); and 4) regions with low per capita emissions and a low-medium income (Africa and South-Asia) showing low costs or net gains from emissions trading. The financial flows involved in emission trading can be large, and depend on the regime. For the S550e, they amount to €200 billion for most regimes in 2025 and more than €500 billion in 2050. For the S650e profile, these numbers vary between €10-50 billion in 2025 and €150-300 billion in 2050. The changes in the energy system will have a significant impact on energy trade. While some regions will gain from reduced energy imports (OECD90, Asia), others will suffer from reduced exports (Middle East, CIS, Latin America, parts of Africa). For the latter group lost oil revenues can be of similar magnitude as direct costs of climate policies. The export of biofuels might partly compensate the export losses of Latin America and CIS.
2 These abatement costs are equal to the sum of domestic abatement costs and the allowances traded times the
international permit price (see also further in this report). These costs are compared to GDP measured in purchasing power parity to give an indication of the possible economic impacts in different regions.
• Climate policies can have significant co-benefits, both in terms of reduced
emissions of such regional air pollutants as SO2/NOx and in terms of avoided costs
to control these gases. For developing countries, co-benefits could be an important support for sustainable development strategies.
Implementing the S550e profile or, to a lesser extent, the S650e profile leads to lower emissions of air pollutants, thus also improving urban air quality and reducing acidification risks. For acidification in Asia, implementing the S550e profile can limit the areas exposed to high levels of acidification by an average of 50% compared to baseline.
Overall findings
• In evaluating the fairness and political acceptability of the various regimes, it is not sufficient to only evaluate the allocation of the emissions compared to baseline. Also required is an assessment of the distribution of abatement costs, impacts from emission trading and the impacts resulting from a change in energy trade.
Although all regimes start off from a consistent set of ‘fairness’ principles, it was found that that abatement costs, impacts of emission trading and changes in energy trade may result in a much larger burden for some regions than for others, possibly constituting a ‘disproportional or abnormal burden’(UNFCCC, Art. 3). Therefore, in evaluating the fairness and political acceptability, it is important to not only assess emission allocations but also the resulting regional cost levels. The most prominent example in our analysis is the Middle East & Turkey region, confronted with much higher costs than other regions as a consequence of not only high abatement costs but also loss of energy exports.
• Financial gains from emission trading and co-benefits of climate policies may allow non-Annex I countries to take on quantified emission limitation
commitments (if not too strict) at net gains or low costs while alleviating the costs of GHG emission policies at the world level at the same time. This, however, requires a fully effective functioning of emission trading instruments.
Global emission trading and reduced air pollution damage can make early participation of developing countries in global GHG emission control possible at net gains or low costs, provided that the level of the commitment is well chosen (not too strict). The PCC2050 and the MS variants provide schemes that fulfil this criterion. However, the financial gains depend on a fully effective functioning of emission trading instruments, which may be hampered due to limited institutional capacity in low-income countries. As participation of low-income countries also reduces global abatement costs, there is an important interest in capacity building in this area.
• Further research is needed on alternative future commitment regimes,
implementation issues and methods to take national circumstances into account. In this study, selected regimes have undergone an initial assessment in terms of their costs and benefits. It would be worthwhile to analyse alternative proposals, including those which have already formed part of our earlier assessment. As a next step, the approaches deemed promising need to be subjected to a more refined analysis, including issues of practical feasibility (e.g. data needs) and institutional requirements. Finally, the large differences in regional costs indicates that national circumstance may need to be better accounted in the design of future regimes.
Samenvatting
Hoewel het Kyoto Protocol een belangrijke stap vormt in de ontwikkeling van
internationaal klimaatbeleid, zijn voor stabilisatie van de broeikasgas (BKG) concentraties in de atmosfeer (UNFCCC, Artikel 2) veel verdergaande reducties nodig. Een belangrijke vraag daarbij is hoe een ‘eerlijke’ verdeling van inspanningen tussen landen eruit zou kunnen zien. In een eerder RIVM rapport (den Elzen et al., 2003b) zijn een vijftal regime benaderingen geanalyseerd in termen van verdeling van regionale reductiedoelstellingen (Multi-stage, Per Capita Convergence, Braziliaans Voorstel, Jacoby Rule en de Preferentie Score). Dit rapport beschrijft de resultaten van een uitgebreidere analyse van de technische en economische consequenties van (varianten van) twee van deze benaderingen:
• De Per Capita Convergentie benadering (of Contraction and Convergence), waarbij voor alle landen vanaf 2013 emissierechten worden gedefinieerd op basis van een convergentie van hoofdelijke emissie ruimte onder een (dalend) wereldwijd BKG plafond (Meyer, 2000).
• De Multi-stage benadering, waarbij landen op grond van hoofdelijk inkomen en emissies worden ingedeeld in groepen met verschillende typen van doelstellingen (stadia). Deze benadering resulteert in een geleidelijke uitbreiding van het aantal landen met met kwantitatieve doelstellingen alsmede van de stringentheid van hun doelstellingen (Berk and den Elzen, 2001).
De consequenties van beide regimes zijn geanalyseerd voor twee mondiale
emissieprofielen die leiden tot stabilisatie van de BKG concentraties op respectievelijk 550 en 650 ppmv CO2-eq. De analyse is gebaseerd op een zogenaamde multi-gas benadering, gericht op het vinden van een kosten-optimale set van reductie opties. Voor de analyse is gebruik gemaakt van een raamwerk bestaande uit het ‘Integrated Assessment’ model, IMAGE 2.2, het wereld energie model TIMER 1.0 en de klimaatbeleid scanner FAIR 2.0.
Baseline ontwikkeling en profielen voor stabilisatie van de BKG concentratie
• Sterke BKG emissiereducties zijn nodig om de mondiale gemiddelde temperatuur stijging te beperken tot 2oC boven preïndustrieel niveau. Wanneer wordt
uitgegaan van een medium klimaatgevoeligheid, moeten mondiale BKG emissies pieken vóór 2020 en rond 2030 terugkeren op 1990 niveau.
Zonder klimaatbeleid stijgt in het referentie (baseline) scenario van deze studie de mondiale gemiddelde temperatuur tot met meer dan 3oC boven het preïndustriele niveau in 2100, nog sterk doorstijgend daarna. Als alternatief zijn twee mondiale emissie profielen, S550e and S650e, ontwikkeld die leiden tot stabilisatie van de BKG concentraties op respectievelijk 550 en 650 ppmv CO2 equivalent in 2100 en 2150. In geval van het S550e profiel zal de gemiddelde temperatuur in 2100 met minder dan 2°C gestegen zijn voor een lage tot medium waarde van de klimaatgevoeligheid3. Onder het S650e profiel is het
onwaarschijnlijk dat de temperatuur stijging tot dit niveau beperkt zal blijven tenzij de klimaatgevoeligheid dicht bij de onderkant van de IPCC range blijkt te liggen. Voor stabilisatie op het S550e niveau zijn echter aanzienlijke sterkere emissie reducties vereist dan voor het S650e niveau.
3 De klimaatgevoeligheid geeft de relatie weer tussen een stijging van de broeikasgas concentratie en de
Regionale emissie reductiedoelstellingen voor verschillende klimaat regimes.
• Het stoppen van de mondiale emissie groei binnen 2 tot 3 decades vereist een vroege bijdrage van ontwikkelingslanden aan emissie beperking, bij lagere inkomensniveaus dan de Annex I landen onder het Kyoto Protocol. Daarnaast is een aanzienlijke aanscherping van de doelstellingen voor Annex I landen nodig. • De reductie doelstellingen van Annex I landen voor S550e liggen in 2025 voor de
verschillende benaderingen tussen de 25%-50% onder 1990 niveau (afhankelijk van regio en regime) en 70-85% in 2050. Voor S650e variëren deze doelstellingen van een 10% toename tot een 25% reductie in 2025 en een 40-60% reductie in 2050. Het 2100 Per Capita Convergence regime vormt een uitzondering en leidt tot lagere doelstellingen voor Annex I landen.
• De meeste niet-Annex I regio’s moeten voor alle geanalyseerde regimes in 2025 hun emissies reduceren ten opzichte van baseline, maar kunnen hun emissies nog laten groeien ten opzichte van 1990. De resultaten voor non-Annex I regios laten in de regel een diverser beeld zien voor verschillende regimes, stabilisatie doelen, regio’s en tijdsperiodes (2025, 2050) dan die voor Annex I regio’s.
In de studie zijn drie varianten van de MS benadering (met verschillende participatie en verdelingsregels) en twee varianten van de PCC benadering (met verschillende
convergentie jaren: 2050 en 2100) geanalyseerd. Voor de Annex I regio’s blijken de reductiedoelstellingen meer afhankelijk van het stabilisatieniveau dan van de
verdelingsbenadering (in 2025 variëren de reducties van baseline tussen de 40-60% reductie voor S550e en tussen de 15-40% voor S650e). Alleen het PCC regime met
convergentie jaar 2100 vormt een uitzondering en leidt tot de laagste reductiedoelstellingen voor de Annex I regio’s (maar de hoogste voor niet-Annex I regio’s). Voor de niet-Annex I regio’s hangen de resultaten meer af van de regio’s en het verdelingsregime. De
reductiedoelstellingen voor midden-inkomensregio’s zoals Latijns Amerika, Midden Oosten (inclusief Turkije) en Zuid Oost & Oost Azië (15-40% en 10-30% reductie voor respectievelijk S550e en S650e) zijn in de regel groter dan voor de lage-inkomensregio’s Afrika en Zuid Azië. Of de PCC regime aantrekkelijker is voor niet-Annex I landen hangt zeer sterk af van het convergentiejaar. De analyse van de Multi-Stage varianten toont verder aan dat de Zuid Oost & Oost Azië regio (waaronder China) een cruciale rol speelt, aangezien deelname leidt tot lagere reductiedoelstellingen voor de andere deelnemende regio’s. Tenslotte toont de gevoeligheidsanalyse aan dat toekomstige emissiereducties even afhankelijk zijn van de parameter keuze binnen elke benadering als van de benadering zelf (de regels voor de MS benadering en het convergentie jaar voor de PCC benadering).
Implementatie van de verschillende regimes en de bijbehorende bestrijdingskosten
• Stabilisatie van de BKG concentratie op 550 en 650 ppmv CO2-equivalent is
technisch en economisch mogelijk – maar implementatie vereist sterke
veranderingen in het energiesysteem. Emissiebeperking voor stabilisatie onder het S550e profiel leidt tot hogere bestrijdingskosten dan onder het S650e profiel (gelijk aan 1,0%, respectievelijk 0,2% van het wereld BNP). Deze getallen zijn globaal en afhankelijk van onzekerheden ten aanzien van de kosten van
reductiemaatregelen en de baseline. Er zijn ook grote verschillen tussen de regio’s. Voor het S550e profiel variëren de kosten van netto winsten voor Afrika en Zuid Azië onder bepaalde regimes tot kosten tot 3-4% als percentage van BNP voor de regio’s Midden Oosten & Turkije en 2% voor CIS.
• De mondiale kosten van het PCC regime liggen door de volledige deelname van alle regio’s aan emissiehandel wat lager dan van het MS regime, maar dit is wel afhankelijk van het effectief functioneren van emissiehandel.
• De financiële gevolgen van veranderingen in energie handel kunnen voor bepaalde regio’s net zo groot zijn als de directe kosten van klimaatbeleid (Midden Oosten, Noord en West Afrika, Oceanië, mogelijk CIS en Latijns Amerika).
Om de BKG concentratie op 550 and 650 CO2-eq te stabiliseren is een bijdrage van een range van opties nodig, waaronder verbetering van de energie efficiëntie, en sterke wijzigingen in de energieproductie. In combinatie met andere maatregelen, leiden deze veranderingen tot hogere kosten voor het S550e profiel dan voor het S650e profiel (gelijk aan respectievelijk 1,0% en 0,2% van het BNP in 2050). De internationale koolstofprijs en de mondiale bestrijdingskosten zijn vooral afhankelijk van het BKG stabilisatie niveau en het aantal deelnemende landen in internationale emissiehandel. De regionale kosten zijn echter daarnaast ook sterk afhankelijk van de verdeling van emissieruimte. Deze kosten kunnen sterk verschillen tussen de regio’s (vooral tussen de non-Annex I regio’s).
In het algemeen geldt dat regio’s met zowel een hoog inkomen als hoge emissies per hoofd ten opzichte van andere regio’s worden geconfronteerd met een gemiddeld kostenniveau ten opzichte van hun BNP; dit betreft de OECD90 landen. Regio’s met een gemiddeld inkomen, maar met relatief hoge emissies per hoofd worden geconfronteerd met relatief hoge kosten: dit betreft de CIS, het Midden Oosten & Turkije en mogelijk Latijns Amerika. Regio’s met lage tot gemiddelde emissies per hoofd en laag tot gemiddeld inkomen zien relatief lage kosten (met name ZO en Oost Azië). Tenslotte hebben regio’s met zeer lage emissies en inkomen in de regel geringe kosten en kunnen zij (afhankelijk van het regime) zelfs profiteren van emissiehandel: Afrika en Zuid Azië. De financiële stromen die gemoeid zijn met de handel in emissierechten hangen af van het regime, maar zijn over het algemeen zeer groot. Voor het S550e profiel liggen zij voor de meeste regimes rond de €200 miljard in 2025 en meer dan €500 miljard in 2050. Voor het S650e profiel, variëren deze getallen tussen de €10-50 miljard in 2025 en €150-300 miljard in 2050.
De veranderingen in het energiesysteem hebben ook grote consequenties voor de handel in energiedragers. Terwijl verschillende regio’s zullen profiteren van beperktere import van energiedragers (OECD90 en Azië), zullen andere regio’s lijden onder verminderde exportmogelijkheden (Midden Oosten, CIS, Latijns Amerika en delen van Afrika). Voor deze groep geldt dat de gemiste olieopbrengsten van een zelfde orde van grootte kunnen zijn als de directe kosten van klimaatbeleid. De export van biobrandstoffen biedt in geval van Latijns Amerika en CIS hiervoor (gedeeltelijke) compensatie.
• Klimaatbeleid kan sterke nevenvoordelen met zich meebrengen, zowel in termen van gereduceerde emissies van stoffen als SO2/NOx als in termen van de vermeden
kosten om de emissies van deze gassen te bestrijden. Voor ontwikkelingslanden zouden deze nevenvoordelen een belangrijke bijdrage kunnen leveren aan strategieën ten behoeve van duurzame ontwikkeling.
Het implementeren van het S550e profiel en, in mindere mate, het S650e profiel leidt tot lagere emissies van luchtverontreinigende stoffen en, daarmee tot een verbetering van stedelijke luchtkwaliteit en vermindering van verzuringsrisico’s. Voor Azië geldt dat de gebieden die worden blootgesteld aan hogere verzuringsrisico’s met 50% zou kunnen afnemen als gevolg klimaatbeleid onder het S550e profiel.
Algemene bevindingen
• Bij het evalueren van de rechtvaardigheid en te verwachten mate van politieke acceptatie van de verschillende regimes is het onvoldoende om alleen naar de initiële verdeling van emissieruimte ten opzichte van een baseline ontwikkeling te kijken. Het is ook nodig een inschatting te maken van de verdeling van de
bestrijdingskosten, rekeninghoudend met de mogelijkheden voor emissiehandel, en de gevolgen voor de handel in energiedragers.
Hoewel alle regimes starten met een consistentie set van ‘rechtvaardigheidsprincipes’, blijkt uit de analyse dat de bestrijdingskosten, de effecten van emissie handel en de gevolgen voor de handel in energiedragers kunnen leiden tot veel grotere economische gevolgen voor sommige regio’s dan voor anderen. Daarom is het in het beoordelen van de ‘rechtvaardigheid’ en ‘politieke acceptatie’ van de regimes, niet alleen belangrijk om naar de verdeling zelf te kijken, maar ook naar de regionale kostenniveaus. Het negeren hiervan kan leiden tot ‘disproportionele of abnormale lasten’ (UNFCCC. Art.3) voor bepaalde regio’s. Dit geldt met name voor de regio’s Midden Oosten & Turkije en CIS die niet worden geconfronteerd met de hoogste directe kosten van klimaatbeleid per eenheid BNP, maar ook met hoge verloren olie opbrengsten.
• De financiële opbrengsten van emissiehandel en de nevenvoordelen van klimaatmaatregelen kunnen een reden zijn voor niet-Annex I landen om emissiebeperkingen op zich te nemen (indien deze niet te strikt zijn). Dit leidt tevens tot lagere mondiale kosten. Voorwaarde is wel een effectief functioneren van de emissiehandelsinstrumenten.
De resultaten van onze analyse laten zien dat de opbrengsten van deelname aan mondiale emissiehandel en de baten van vermeden luchtverontreiniging redenen kunnen zijn voor ontwikkelingslanden om deel te nemen in mondiale BKG emissiebeperking. Dit geldt echter alleen wanneer de vorm en mate van de verplichtingen zo worden gekozen dat economische risico’s worden vermeden. De PCC 2050 en de Multi-stage varianten bieden beide schema’s die aan dit criterium voldoen. De financiële opbrengsten van emissiehandel hangen echter af van een volledig effectief functioneren van emissiehandel instrumenten. Dit functioneren wordt gehinderd door de beperkte institutionele capaciteiten van lage inkomenslanden. Omdat de participatie van lage-inkomenslanden ook de mondiale kosten reduceert, is er dus een groot belang bij ‘capacity building’ op dit gebied.
• Verder onderzoek is nodig naar alternatieve allocatie regimes, methoden om nationale omstandigheden beter mee te kunnen nemen en implementatie vraagstukken.
In deze studie is voor enkele geselecteerde regimes een inschatting gemaakt van de mondiale en regionale kosten en opbrengsten. Het is aan te bevelen dit ook te doen voor alternatieve voorstellen, waaronder die welke reeds onderdeel waren van onze eerdere verkenning. Als een volgende stap zouden de veelbelovende voorstellen nader kunnen worden bestudeerd, met name wat betreft verschillende implementatie aspecten (zoals data beschikbaarheid, institutionele vereisten, en dergelijke). Tenslotte leiden de geconstateerde verschillen in regionale kosten niveaus tot de aanbeveling nader te bestuderen hoe nationale omstandigheden beter meegenomen kunnen worden in verdelingsvoorstellen.
1 Introduction
1.1 Background
The UN Framework Convention on Climate Change calls for a stabilisation of greenhouse gas (GHG) concentrations in the atmosphere at levels that prevent dangerous anthropogenic interference with the climate system (UNFCCC Article 2) (UNFCCC, 1992). At the
moment, there are still too many uncertainties across the causal chain of climate change from activities to impacts to unambiguously determine ‘safe’ concentration levels below which this condition can be considered fulfilled. In fact, determining these ‘safe’ levels is not only a scientific question but is also related to perceptions, values and political
negotiations. IPCC’s Third Assessment report indicates that, in any case, such stabilisation will require substantial reductions of global GHG emissions of more than 60% of the 1990 level (IPCC, 2001b). In 1996 the EU Council adopted as its long-term climate objective, a global-mean temperature change that would not exceed 2 degrees Celsius compared with pre-industrial level, requiring a global emission reduction of at least a similar order of magnitude. It is clear that such global emission reductions will require substantial effort in future GHG emission control by all countries, going far beyond the type of reductions that have been set in the Kyoto Protocol (KP). The KP is an important milestone in international climate policy-making, as it constitutes the first international treaty with legally binding quantified commitments to limit greenhouse gas emissions for a group of industrialised countries (Annex I). In the context of the efforts required to finally stabilise GHG
concentration, however, it is only a first step. This raises the important question about what future levels of commitments would be needed in the commitment period after the KP (in particular, between 2015 and 2025) and what would constitute a fair differentiation of commitments among countries.
It should be noted that the issue of timing and level of the emission control (needed by both developed and developing countries) cannot be analysed independently of the issue at which level climate policies intend to stabilise the GHG concentration. In the case of stabilisation levels below a doubling of pre-industrial GHG concentrations (approximately 650 ppmv CO2-equivalent concentration), it will be crucial that developing countries (non-Annex I Parties) already commit themselves to restricting their emissions in the next few decades (den Elzen et al., 2003b). The share of non-Annex I countries in global greenhouse gas emissions was about 30% in 1990, but is projected to exceed that of the industrialised countries in the coming decades (IMAGE-team, 2001; Nakicenovic et al., 2000).
Considering the complexity of the issue, there is a need for an early start of analytical work that can support an evaluation of policy options.
1.2 Analysing the implications of climate regime options
Both prior to the negotiations on the KP and afterwards there have been many proposals for differentiating mitigation commitments among countries, both from academic circles as well as from Parties to the UNFCCC (see for an overview e.g. (Banuri et al., 1996; Berk et al., 2002; Depledge, 2000; Reiner and Jacoby, 1997; Ringius et al., 1998)). Amongst the most comprehensive quantitative analysis of multiple regime proposals at a global scale are studies by (Blanchard et al., 2001; den Elzen, 2002; Jacoby et al., 1997; Jacoby et al., 1999; Rose et al., 1998) (Babiker and Eckhaus, 2002; Höhne et al., 2003). In addition, there have been some more qualitative assessments including (Baumert et al., 2002; Evans, 2002; Müller,
2003; OECD/IEA, 2002). However, the number of comparative studies systematically evaluating the implications of various post-Kyoto regime options for a wider range of implications on a global scale is limited. Most studies have limitations regarding either the options reviewed, the level of elaboration (rather stylised/academic approaches), the level of analysis (Annex I only; limited regional detail), the link to (long-term) environmental implications (mostly absent, certainly in more economic oriented studies), the time horizon (only short-term / KP horizon) or quantification of technical or economic implications (often absent) or a lack of consistent quantification). In addition, almost all studies focus on
CO2-only instead of taking all (Kyoto) GHGs into account.
Earlier, we have made both a quantitative and qualitative assessment of five different Post-Kyoto climate policy regimes: Multi-stage, Per Capita Convergence, Brazilian Proposal, Jacoby Rule and Preference Score (den Elzen et al., 2003b). This study explored the implications of the regimes in terms of the allocation of emission reductions efforts under two different stabilisation targets for the atmospheric carbon dioxide concentration. In addition, we performed a multi-criteria evaluation to identify strenghts and weaknesses of the various approaches on the basis of emission allocations only. On the basis of these results, two approaches were selected for a more in-depth analysis of their technical and economic implications: Multi-stage and Per Capita Convergence. Both the earlier study – and the current study form a contribution to the first phase of the EU project ‘Greenhouse gas reduction pathways in the UNFCCC post-Kyoto process upto 2025’ (GRP) (Criqui et al., 2003)4.
1.3 Purpose of the report
This report describes a systematic analysis of the environmental, technical and economic implications of different variants of.the Per Capita Convergence (PCC) and Multi-stage (MS) regime approaches. (see short description below). The Multi-stage approach was chosen as a typical example of an approach in which the number of regions with binding emission targets are gradually increasing. The Per Capita Convergence approach was chosen as a typical example of an approach in which all regions will participate from 2013 onwards.
• The Per Capita Convergence approach, developed and promoted by the Global Commons Institute (Meyer, 2000), defines emission permits on the basis of convergence of per capita emissions under a contracting global GHG emission profile. In such a convergence regime, all countries participate in the climate regime with emission allowances converging to become the same as per capita levels over time.
• The Multi-stage approach consists of a system to divide countries into groups with different levels of responsibility or types of commitments (stages). Over time, the approach results in a gradual increase in the number of countries and their level of commitment according to participation and differentiation rules, based on such criteria as per capita income or per capita emission (Gupta, 1998) and (Berk and den Elzen, 2001). For the purpose of the reported here, three new variants of the Multi-stage approach were developed.
4 The project was carried out by a partnership of European Institutes, i.e. CNRS-IEPE (Institut de l’Economie
et de Politique de l’Energie, now integrated in the Departement Energie et Politiques de l ‘Environment (EPE) (department of Energy and Environment) of the University of Grenoble, France), RIVM (National Institute for Public Health and the Environment, the Netherlands), ICCS-NTUA (Greece) and CES-KUL (Belgium) for the European Commission.
We have explored the consequences of these proposals in combination with two different levels of ambition in stabilising the level of GHGs in the atmosphere: 1) stabilisation at 550 ppmv CO2-equivalent concentration and 2) stabilisation at 650 ppmv CO2-equivalent concentration. In this way, we can not only provide insights into the technical and
economic consequences of different regimes, but also into the degree to which the results comply with an objective to limit the increase in global mean temperature to a maximum of 2oC compared to pre-industrial levels. The implications explored include overall climate effects (realising the uncertainty in the climate system), regional reduction targets, costs of implementation and emission trading, the required changes in the energy system and the impacts and the possibilities for co-benefits in terms of reducing regional air pollution (nitrogen and sulphur emissions). More than one variant per approach were analysed. Convergence years of 2050 and 2100 were used for the Per Capita Convergence approach, while three different variants of participation rules were explored for the Multi-stage approach.
1.4 General overview of the report
A modelling framework, consisting of the Integrated Assessment model, IMAGE 2.2, the world energy model, TIMER 1.0 and the climate policy scanner, FAIR 2.0 has been developed for the purpose of assessing the broad range of different impacts as discussed above. In addition, the RAINS-Asia model has been used to assess the possible co-benefits for acidification in Asia in more detail. The whole analysis was carried out using a so-called a multi-gas approach, i.e. taking into account all six greenhouse gasses considered in the Kyoto Protocol. The methodological aspects are discussed in more detail in Chapter 2. The research was set-up along a systematic framework of analysis, consisting of five different steps (see also Figure 1.1):
1. Development of a baseline scenario: first, an analysis is done of the possible development of emissions in the absence of climate polices (Chapter 3). 2. Development of global emission profiles: next, two alternative greenhouse gas
emission profiles that stabilise GHG concentration at 550 and 650 ppmv CO2-eq, respectively, were developed. Comparing the baseline to these emission profiles allows us to identify the global emission reduction effort (Chapter 3).
3. Development of climate regimes and evaluation of emission allowances: after this, the consequences of the two different climate regimes are explored in terms of the emission reduction allowances per region (Chapter 4).
4. Technical and cost evaluation of the regimes: the allowances form the basis of an analysis into the implementation of the regimes, identifying the level of emission trading, abatements costs and the type of abatement action. Particular attention is paid to the consequences for the energy system (Chapter 5).
5. Assessment of implications for climate change and regional air pollution: finally, an assessment was made of the climate consequences (benefits) and co-benefits of the different regimes (Chapter 6).
Development of global emission profiles (for stabilisation at 550 and 650 ppmv CO2-eq)
Development of climate regimes and evaluation of emission allowances
Technical and costs evaluation of the different regimes
Assessment of implications for climate change and regional air pollution
Development of baseline scenario
(without climate policies) Chapter 3
Chapter 3
Chapter 4
Chapter 5
Chapter 6 Figure 1.1: Systematic framework for the analysis performed.
2 Methodology
2.1 Introduction
We have analysed technical, economic and environmental consequences of variants of the Per Capita Convergence (PCC) and Multi-Stage (MS) approach for differentiation of future commitments (further referred as climate regimes). Both approaches will be discussed in more detail in Chapter 3. These regimes, applied under two different emission profiles, lead to a stabilisation of the greenhouse gas concentration at 550 and 650 ppmv CO2-equivalent, respectively. For our evaluation, we used a set of linked and related models, i.e. the
IMAGE 2.2 model (IMAGE-team, 2001), the FAIR 2.0 model (den Elzen and Lucas, 2003) and the TIMER 1.0 model (de Vries et al., 2002). In addition, the RAINS-ASIA model (Amann et al., 2000) was used to assess the potential co-benefits of the climate policies on regional air pollution in Asia. The methodology is described in more detail in section 2.2, while a short description of the four main models is available in Box 2.1. A more elaborate description can be found in Annex 1. In section 2.3 we will discuss some of strengths and weaknesses of the current approach.
2.2 Overall steps within the analysis
As indicated in the introduction, our analysis was structured around five main steps (Figure 1.1). Figure 2.1 indicates schematically how these steps are related to the different models used in the analysis. The different steps are described in the next sections. Details on assumptions are provided in the individual chapters recording the results.
IMAGE -Land use TIMER
(energy )
Land Use & climate system TIMER 1.0
( energy)
GECS MAC curves for
non-CO2 gasses CO2response curves Sinks potential Emission reductions & permit price Emission Allocation model FAIR 2.0 Mitigation costs and emission trade IMAGE 2.2
Total abatement costs, emission trade Consequences
for eergy system
Changes in land use and climate Baseline Emission Profies (S550e, S650e) 1 2 3 4 4 5 Changes in air pollution 5 Changes in air pollution 5
Figure 2.1: Overview of the linked model systems used for this analysis. Circled numbers refer to the steps in the analysis steps (see Figure 1.1 and sections 2.2.1 to 2.2.5).
In general terms, the IMAGE and TIMER models were used first to determine potential greenhouse gas emissions and the climate impacts in the absence of climate policies (baseline) (step 1). Next, the IMAGE model was used to develop emission profiles that would lead to a stabilisation of greenhouse gases at 550 and 650 ppmv CO2-equivalent (step 2). Both TIMER and IMAGE also provide information on the potential costs of
reducing emissions from different sources. The FAIR model was then used to evaluate the regional emission allowances resulting from the different climate regimes and emission profiles (step 3). FAIR was also used to determine the international permit price, the domestic and external abatements and cost levels on the basis of marginal abatement costs (step 4). At the same time, the TIMER model was employed to determine the impacts and costs of emission reductions within the energy system. Finally, the climate impacts and co-benefits of different regimes (step 5) were assessed.
2.2.1 Development of a baseline scenario without climate policies
The TIMER and IMAGE models were used to develop the baseline scenario assuming no climate policies. This scenario, developed on the basis of elements of the POLES baseline scenario and the IMAGE SRES A1b and B2 scenarios, is further referred as the Common Poles IMAGE baseline (CPI). The baseline assumes a continued process of globalisation, medium technology development and a strong dependence of fossil fuels. The results of this analysis are described in Chapter 3.
2.2.2 Development of global emission profiles for stabilising GHG
concentration levels
Next, on the basis of the baseline, the IMAGE model was used to develop different emission profiles for six (groups of) greenhouse gases (CO2, CH4, N2O, SF6, HFC and PFCs) to lead to a stabilisation of the greenhouse gas concentration in the atmosphere. Two alternative levels were explored, i.e. stabilising greenhouse gases at 550 CO2-equivalent and 650 CO2-equivalent5, respectively. Up to 2012, the global emissions of both profiles are based on the assumption that most Annex I countries will implement their respective Kyoto targets (including use of flexible instruments) while the USA will implement the objectives of the Bush Climate Action Plan (see (van Vuuren et al., 2002)). All other regions will follow the baseline. After 2012, global emissions will start to diverge from the baseline – to reach the maximum allowable emissions in order to meet the concentration targets. The profiles are all expressed in CO2-equivalent emissions using 100 year GWPs (IPCC, 2001b)6. The results of the development of the baseline and the overall emission profiles are described in Chapter 3.
2.2.3 Development of climate regimes and evaluation of emission
allowances
The FAIR model uses the baseline scenario (greenhouse gas emissions, population and income) and the emission profiles to distribute the global emission reduction objective over the different regions according to the different climate regimes, i.e. the PCC and the MS variants. The results of each of these climate regimes and their variants were assessed in terms of emission reduction objectives by region and are further described in Chapter 4.
5 The CO
2-equivalent concentration is a measure of the radiative forcing of all Kyoto greenhouse gases in the
atmosphere. The concept is explained in detail in Chapter 3.
6 It should be noted that in the development of the profiles (rather arbitrary) assumptions were made on the
reduction targets for the different GHG gases. Further on in the analysis, however, the profiles are used only in terms of total CO2-equivalent emissions: the actual share of reductions for the different gases are in Chapter
2.2.4 Technical and cost evaluation of the different regimes
In step 4, the emission reduction objectives were implemented in terms of actual emission reductions in the different regions, assuming a least-cost approach and including the use of flexible mechanisms (emissions trading and CDM projects) in the context of each regime. The abatement costs and emissions trading model, FAIR 2.0, were used to determine the internal market equilibrium permit price (permit price), the reductions in traded emissions and the total regional abatement costs. This is done using Marginal Abatement Costs (MAC) curves for the different regions, gases and sources. A MAC curve reflects the costs of abating the last ton of CO2-equivalents, thereby describing the potential and costs of the different abatement options considered. The calculated permit price is used as a carbon tax in the TIMER energy model to determine the implementation of the emission reductions in the energy system. Several partial steps can be recognised within step 4. For example, information for each important source of GHG on the emissions reduction potential and its costs, available within IMAGE and TIMER, is provided to FAIR. This includes
information on CO2 emission reduction in the energy/industry system, information on the sinks potential and the activity levels, and assumed technology improvement for non-CO2 emissions. Next, the abatement costs and level of emission trading within FAIR were determined given the different MAC curves and the conditions of trading market. Finally, the permit price was sent on to the TIMER model. The results are described in detail in Chapter 5.
2.2.5 Assessment of implications for climate change and regional air
pollution
The final emission for each stabilisation level (after determining the changes in emission levels in the energy/industry system and taking into account the abatement action for land-use related sources) was finally evaluated in terms of its climate consequences in IMAGE. These climate consequences may be somewhat different from those of the original profiles due to different reduction actions for the different gases and the fact that changes in the energy system also change emissions of other gases such as sulphur dioxide (a cooling agent) and nitrogen oxides7.
Finally, the potential co-benefits in terms of reduced regional air pollution as result of changes in the energy system were evaluated for the two different profiles. First, we evaluated the changes in emissions of sulphur dioxide and nitrogen oxide for the different global regions using the results of the TIMER model. Next, we downscaled the results of the three Asian TIMER regions to the level of different countries in order to evaluate in more detail the consequences for sulphur emissions in Asian countries using the RAINS-Asia model (Amann et al., 2000; IIASA, 2000). In this analysis, particular attention was paid to changes in the exceedance of the critical loads for acidification. The results of this analysis are described in Chapter 6.
7 These extra emission reductions are not taken into account in the abatement costs and emissions trading
Box 2.1. Short description of the main models used
FAIR 2.0
The FAIR 2.0 model is a decision-support tool designed to quantitatively explore a range of alternative climate regimes for differentiation of future commitments in international climate policy and link these to targets for climate protection. The model consists of three integrated sub-models: a simple climate model, an emission
allocation model and a abatement costs and emissions trading model. The climate model calculates greenhouse gas concentrations and climate change parameters for the different emission scenarios. The emission allocation model calculates the regional emission allowances on the basis of different climate regimes, stabilisation profiles and baseline scenarios. Finally, the abatement costs and emissions trading model determines the international permit price, the tradable emission permits and the total abatement costs in any emissions trading market, assuming a cost-optimal
solution based on marginal abatement cost curves.
TIMER 1.0
TIMER is a system dynamics energy model. The model simulates the consumption and production of energy in 17 world regions, and the related energy and industrial emissions. Implementation of CO2 mitigation is generally modelled in TIMER on the basis of a carbon tax. The introduction of such a tax generates several responses within the model, including induced investments in energy efficiency, price-induced fossil fuel substitution, changes in the trade patterns of (fossil) fuels, and price-induced acceleration of investments in non-fossil options such as wind/solar energy, nuclear energy and biofuels.
IMAGE 2.2
The IMAGE 2.2 modelling framework consists of a set of linked and integrated models, which collectively describe important elements in the cause−response chain of global environmental change. The main objectives of the model are to contribute to scientific understanding, in particular, of the linkages between the various subsystems and their uncertainties; further, the model should support decision-making by
quantifying the relative importance of major processes and interaction in the cause-response chain. The framework and its sub-models have been described in detail in several publications (Alcamo et al., 1998; IMAGE-team, 2001). Important elements of IMAGE include its description of emissions of greenhouse gases and regional air pollutants, and outlines on climate change and land-use change. Socio-economic processes are usually modelled at the level of 17 world regions, while climate, land-use and several environmental parameters are modelled at a 0.5 by 0.5 degree resolution.
RAINS-Asia 7.52
RAINS-Asia provides a consistent framework for the analysis of emission reduction strategies for sulphur dioxide emissions in large parts of Asia. On the basis of calculated emissions, the model is able to estimate acidification risks. In RAINS, a non-linear optimisation is used to identify the cost-minimal combination of measures, taking into account regional differences in emission control costs and atmospheric dispersion characteristics (Amann et al., 1999; IIASA, 2000).
2.3 Strengths and weaknesses of the current approach
We used a set of linked models as described in section 2.1 in our analysis. The approach taken has several strengths and weaknesses. The main strengths:
• Taken collectively, the models used provide a full, and detailed, description of the sources of GHG emissions and the different options for abatement. The system also has a high level of integration between energy/industrial emissions and emissions from land use in relation to environmental changes.
• The approach used considers all six Kyoto GHGs, allowing for full flexibility in abatement of these gases (so-called multi-gas approach) and in other options such as sinks.
• The description of costs of climate policies using an approach based on marginal abatement costs is transparent and flexible, allowing for a description of emission trading, including possible limitations in the use of flexible instruments (e.g. transaction costs and accessibility of reduction options).
• All of the sub-models used have been fully documented and employed in scientific and policy applications (e.g. IPCC’s Third Assessment Report).
• Integration of the IMAGE model allows us to indicate the direct climate consequences of regimes, while taking account of the uncertainties on climate sensitivity.
The main weaknesses of our approach are:
• The models have a system-dynamic orientation, in which economic changes have not been fully integrated. The costs calculated only represent the direct-cost effects based on MAC curves but not the various linkages and rebound effects via the economy or impacts of carbon leakage; i.e. there is no direct link with macro-economic indicators such as GDP losses or other measures of income of utility loss.
• The fact that the models are linked, and not integrated, also posses certain limitations. One of them is that we need to use an approach based on Global Warming Potentials (see Chapter 3 for a full discussion) to evaluate the cost-effectiveness of reduction options. At the same time, however, this is completely consistent with the way climate policies are currently formulated (e.g. Kyoto Protocol, climate policies of the USA); at the moment, no alternatives for actual climate policies seem to be available.
3 Global emission constraints and baseline emission
scenario assumptions
3.1 Introduction
In 1996 the EU Council adopted as its long-term (EU) climate policy objective the aim to prevent a global mean temperature increase beyond 2 degrees Celsius over its pre-industrial level. To explore the global effort required to meet this objective, we have developed two alternative greenhouse gas emission profiles that would result in a stabilisation of the concentration of greenhouse gases at respective levels of 550 and 650 ppmv carbon dioxide equivalents (Eickhout et al., 2003)See also Box 3.1 for an explanation of the concepts of CO2-equivalent concentrations and CO2-equivalent emissions.
This chapter will provide a description of the main assumptions used for constructing these greenhouse gas stabilisation profiles and the baseline used in this study. It will also evaluate the emission reduction burden resulting from the baseline and the emission profiles.
The profiles in this chapter cover all six greenhouse gases covered in the Kyoto Protocol (CO2, CH4, N2O, HFCs, SF6, PFCs) in a so-called multi-gas approach. Most earlier work on mitigation scenarios and climate regimes, including our previous report on this issue (den Elzen et al., 2003b), focussed on CO2 only. Although CO2 is by far the main GHG in terms of its contribution to climate change, a full multi-gas approach can result in significantly different insights, mainly on the timing of emission reductions. These different insights result from gas-specific abatement costs and atmospheric lifetimes.
3.2 The baseline scenario
In order to identify options to meet the EU climate target and to assess their economic consequences, it is necessary to rely on a consistent baseline projection that reflects what
may happen if no further climate action were taken. RIVM and IEPE, therefore took on the
task of developing a new baseline, called the Common POLES-IMAGE (CPI) baseline, to explore the implications of different options for differentiating future commitments using both models. This baseline describes the development in the main driving forces
(population and economic growth) and environmental pressures (energy, industrial and land-use emissions) for 1995-2100. The baseline is constructed by combining elements of the POLES reference scenario (Criqui and Kouvaritakis, 2000) and the IMAGE 2.2 A1b and B2 scenarios (IMAGE-team, 2001).
The baseline scenario describes a world in which globalisation and technology development continue to be an important factor for economic growth, although not as strong as assumed in the IPCC A1b scenario ((IMAGE-team, 2001; Nakicenovic et al., 2000)), for example. Economic growth can therefore be described as medium (per capita yearly growth rate of 2 to 3%) in almost all regions. As growth is greater in low-income regions than in high-income regions, the relative gap between the regions will be reduced. However, for economic growth to occur, regions will need to have a sufficient level of institutional development and stability. In the scenario it is assumed that in the first 2-3 decades, these conditions will not be met in Sub-Saharan Africa; as a result this region will clearly lag behind in terms of income growth.
However, the current barriers to economic development are gradually reduced in this same period– and from 2025/2035 onwards the region ‘takes off’ in terms of its development, similar to what we have seen for Asian countries in the past. The results of the most important driving forces by region are indicated in Table 3.18. The assumptions for population are based on the UN medium projections up to 2030, as implemented in the POLES reference scenario. For the period of 2030-2100, the UN long-term medium projection as implemented for the IMAGE B2 scenario (IMAGE-team, 2001) was used. In this population scenario the global population stabilises at a level of 9.5 billion by 2100.
Table 3.1: Main driving forces of the CPI baseline by regions Population
(in mill.)
Per Capita Income (in
PPP €1995 per year)9 Per CapitaIncome
(growth rates) 1995 2025 2050 1995 2025 2050 1995-2025 2025-2050 Canada & USA 296 362 391 25604 42520 55757 1.7% 1.1%
Enlarged EU 505 499 450 17128 34534 50107 2.4% 1.5% CIS 293 298 273 1747 5323 14750 3.8% 4.2% Oceania 28 40 46 15469 30054 43397 2.2% 1.5% Japan 125 121 111 41052 65270 90424 1.6% 1.3% Latin America 476 690 800 3591 6779 12144 2.1% 2.4% Africa 719 1346 1831 613 873 1761 1.2% 2.8% ME & Turkey 219 378 483 3282 6371 12577 2.2% 2.8% South Asia 1245 1865 2160 356 1560 4060 5.0% 3.9% SE & E Asia 1798 2293 2439 1392 7404 16930 5.7% 3.4% World 5706 7891 8984 4931 9052 14413 2.0% 1.9% Source: IMAGE 2.2
With the projected increase in population and income, primary energy use will also
continue to grow in almost all regions. World-wide, primary energy use increases by about 75% in 1995-2025 and by another 40% in the2025-2050 period, almost all of this growth occurs in non-Annex I regions. Oil continues to be the most important energy carrier until 2040. After 2040 both natural gas and coal take over this position with particularly gas becoming the dominant energy carrier.
As a result, energy-related carbon dioxide emissions increase sharply in contrast to the the slowdown in emission increase increase at the end of the last century due. This slowdown was, in particular, due to to the sharp reductions in emissions in the Former Soviet Union and Eastern Europe following their economic decline. Another factor is the reduction in the CO2 emissions in China in the second half of the nineties. However, the increase in energy use described above cause carbon dioxide emissions to increase from 21.6 GtCO2 in 1995 to 39.5 GtCO2 in 2025, and 54.7 GtCO2 in 2050 (see Table 2.2 and Figure 2.1) and continue to be the major source of GHG emissions. After 2050, stabilising population levels also slow down further growth in carbon dioxide emissions. The share of non-Annex I countries in energy-related carbon dioxide emissions increases from 37% in 1995 to 45% in 2025 and to 66% in 2050.
8 For comparability of the modelling results, all results are presented for an aggregate of 10 world regions.
The composition of these regions is given in Appendix I.
9 GDP levels of different countries are normally compared on the basis of conversion to a common currency
(mostly US$) using Market Exchange Rates (MER). However, this is known to underestimate the real income levels of low-income countries. Therefore, an alternative conversion has been developed on the basis of purchasing power parity (PPP). In this article, we have usually used PPP-based GDP estimates, but where required, MER-based estimates for comparison are used.
Using the land-use projections of IMAGE 2.2 (IMAGE-team, 2001)),we can assess total GHG emissions too (including land-use related emissions and non-CO2 greenhouse gas emissions). In general, population growth and shifts to more luxurious diets lead to an additional need for agricultural land in the first half of century, despite improvements in agricultural production. Later, further productivity gains result in a surplus of agricultural land, in particular, land in high-income regions that can be converted into forest areas. As a result, carbon dioxide emissions from land use increase slightly between 1995 and 2040, but decrease afterwards. Most of the land-use related emissions originate in developing regions, in particular, due to population growth that leads to a higher agricultural demand and, hence, deforestation. Consequently, the share from non-Annex I countries in total anthropogenic greenhouse gas emissions is larger than that of energy-related CO2
emissions, increasing from 48% in 1995 to 65% in 2025, and 71% in 2050. Methane and nitrous oxide emissions increase up to 2060, after which they remain more-or-less constant. Finally, industrial emissions, including particularly the high GWP gases and process-related carbon dioxide emissions from cement production and feedstocks, increase slowly over the whole century – but remain relatively small compared to other sources.
Table 3.2: Main model results of the CPI baseline by region
Primary energy use (in PJ per year)
CO2 emissions
(in GtCO2 per year)
GHG emissions (in GtCO2-eq per
year) *
1995 2025 2050 1995 2025 2050 1995 2025 2050 Canada & USA 91848 121405 128373 6.10 8.09 8.40 7.55 9.50 9.58 Enlarged EU 66070 83380 86702 4.36 5.10 5.32 5.38 6.00 6.05 FSU 37276 51960 57174 2.32 3.24 3.59 3.20 4.50 4.71 Oceania 4754 7955 9675 0.33 0.54 0.64 0.53 0.79 0.87 Japan 18866 22851 22480 1.26 1.48 1.41 1.37 1.58 1.51 Latin America 21763 49891 88932 1.18 2.89 5.11 2.33 4.54 7.00 Africa 19940 43168 79215 0.79 2.32 4.52 1.60 4.17 7.32 ME & Turkey 15065 41306 67132 1.06 2.85 4.36 1.35 3.69 5.73 South Asia 25175 62628 116495 0.97 3.79 7.46 2.11 5.54 9.44 SE & E Asia 71984 168736 251999 4.62 11.36 16.03 6.64 14.42 19.28 World 372742 653278 908176 22.99 41.65 56.83 32.06 54.74 71.48
*: The GHG included here are the six Kyoto gases: CO2, CH42O, SF6, PFCs and HFCs. However, the F-gases are excluded from the
regional figures as only global estimates are made. Thus the regional subtotals do not add up to the world total.
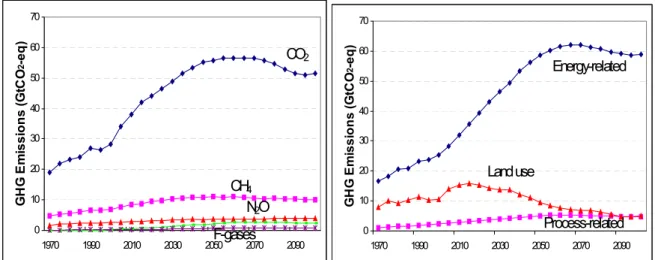
Source: IMAGE 2.2 0 10 20 30 40 50 60 70 1970 1990 2010 2030 2050 2070 2090 GH G E m is s io n s ( G tC O 2-e q ) CO2 CH4 N2O F-gases 0 10 20 30 40 50 60 70 1970 1990 2010 2030 2050 2070 2090 GH G E m is s io n s ( G tC O 2 -e q ) Energy-related Land use Process-related
Figure 3.1: Greenhouse gas emissions in carbon-equivalents by gas (left) and sector (right). Source: IMAGE 2.2