003633
This is a publication of:
National Institute for Public Health and the Environment
P.O. Box 1 | 3720 BA Bilthoven The Netherlands
www.rivm.nl
March 2012
Emissions of transboundary air pollutants in the Netherlands 1990-2010
Informative Inventory Report 2012
Report 680355008 / 2012
Emissions of transboundary air pollutants in the Netherlands, 1990-2010. Explanation on the yearly set of emission data. Between 1990 and 2010 emissions of air pollutants in the
Netherlands have decreased. This concerns sulfur dioxide, nitrogen oxides, non-methane volatile organic compounds (NMVOC), carbon monoxide, ammonia, heavy metals and persistent organic pollutants (POP’s). The downward trend is in particular attributable to cleaner fuels, cleaner cars and to emission reductions in the industrial sectors.
This was found in the explanation from the RIVM on the emission data submission, the Informative Inventory Report (IIR) 2012. Every year the Emission Inventory team – under direction of the RIVM - submits emission data for the government following obligations to the United Nations (UNECE) and the European Commission. The emission data set is a succession of years, from 1990 till the most recent submitted data.
B.A. Jimmink | P.W.H.G. Coenen | R. Dröge|
G.P. Geilenkirchen | A.J. Leekstra | C.W.M. van der Maas | R.A.B. te Molder | C.J. Peek | J. Vonk | D. Wever
Emissions
of air
pollutants
Informative Inventory Report 2012
Netherlands
Informative Inventory
Report 2012
B.A. Jimmink, P.W.H.G. Coenen1, R. Dröge1, G.P. Geilenkirchen2, A.J. Leekstra, C.W.M. van der Maas, R.A.B. te Molder,
C.J. Peek2, J. Vonk, D. Wever
1 Netherlands Organisation for Applied Scientific Research (TNO) 2 Netherlands Environmental Assessment Agency (PBL)
Emissions of transboundary air pollutants in the Netherlands 1990-2010 Informative Inventory Report 2012
Contacts:
Benno Jimmink (PBL) (benno.jimmink@pbl.nl) Wim.van.der.Maas (RIVM) (wim.van.der.maas@rivm.nl)
This report has been compiled by order and for the account of the Directorate-General for the Environment, of the Dutch Ministry Infrastructure and the Environment, within the framework of the project Emissieregistratie M680355, ‘Netherlands Pollutant Release & Transfer Register’. Report prepared for submission in accordance with the UNECE Convention on Long-Range Transboundary Air Pollution (CLRTAP) and the European Commission.
RIVM report 680355008 / 2012 ©RIVM 2012
National Institute for Public Health and the Environment (RIVM), PO Box 1, 3720 BA Bilthoven, the Netherlands; Tel: +31-30-274 35 26; Fax: +31-30-278 75 31; www.rivm.nl/en
Acknowledgements
Many colleagues from a number of organisations (CBS, EC-LNV, LEI, Alterra, NL Agency, PBL, RIVM and TNO) have been involved in the annual update of the Netherlands Pollutant Release & Transfer Register (PRTR), also called the Emission Registration (ER) system, which contains emissions data on about 350 pollutants. The emission calculations are performed by members of the ER ‘Task Forces’. This is a major task, since the Netherlands’ inventory contains many detailed emission sources. Subsequently, the emissions and activity data of the Netherlands’ inventory are converted into the NFR source categories and contained in the Excel files. The description of the various sources, the analysis of trends and
uncertainty estimates (see Chapters 2 to 9) were made in co-operation with the following emission experts: Mr. Gerben Geilenkirchen (transport), Mr. Peter Coenen, Mr. Harm ten Broeke and Mrs. Rianne Dröge (energy), Mr. Kees Peek (industrial processes, solvents and product use), Mr. Jan Vonk and Mrs. Sietske van der Sluis (agriculture). We are particularly grateful to Mrs. Marian Abels, Mr. Jan de Ruiter, Mr. Bert Leekstra and Mr. Dirk Wever, for their contribution to data processing, chart production and quality control. For his continued support we acknowledge Mr. J. Wijmenga in particular, from The Directorate for Climate Change, Air Quality and Noise of the Dutch Ministry of Infrastructure and Environment. For the design and lay-out of this report we thank the RIVM’s graphic department, in particular Mr. Martin Middelburg and Mrs. Marjolein Niebeek. We greatly appreciate the contributions of each of these groups and individuals to this Informative Inventory Report as well as the contributions of the external reviewers that provided comments on the draft report.
Rapport in het kort
Emissies van luchtverontreinigende stoffen in
Nederland, 1990-2010. Toelichting op de jaarlijkse reeks emissiecijfers.
Tussen 1990 en 2010 is in Nederland de uitstoot van luchtverontreinigende stoffen gedaald. Het betreft de uitstoot van zwaveldioxide, stikstofoxiden, niet-methaan vluchtige organische stoffen (NMVOS), koolmonoxide, ammoniak, fijn stof (PM10), zware metalen en persistente
organische stoffen (POP’s). Deze neerwaartse trend is vooral toe te schrijven aan de introductie van schonere auto’s en brandstoffen, en aan emissiebeperkende maatregelen bij industriële sectoren.
Dit blijkt uit de toelichting van het RIVM op de
Nederlandse emissiecijfers van grootschalige luchtveront-reinigende stoffen, het Informative Inventory Report (IIR) 2012. Deze cijfers worden jaarlijks onder regie van het RIVM geleverd aan de Verenigde Naties (UNECE) en de Europese Commissie. De emissiecijfers beslaan een reeks jaren, vanaf 1990 tot het meest recente jaar. Dit keer zijn ook de geografische verdelingen van de emissiecijfers gerapporteerd, waartoe Europese lidstaten elke vijf jaar zijn verplicht.
Nieuwe inzichten in de emissies van motorfietsen en bromfietsen
Door de jaren heen resulteren nieuwe methoden om de emissies te berekenen in nauwkeurigere uitkomsten. De grootste verbetering heeft dit verslagjaar plaatsgevonden in de emissieberekening van bromfietsen en motorfietsen in Nederland. Deze emissies zijn berekend met een nieuw model dat beter rekening houdt met het motorvermogen en de leeftijd van de bromfietsen en motorfietsen. Het nieuwe model laat zien dat vooral oudere motorfietsen en bromfietsen meer fijn stof (PM10) uitstoten dan eerder
werd verwacht. Ook de uitstoot van stikstofoxiden ligt iets hoger dan eerder werd berekend. Motoren en bromfietsen leveren echter maar een kleine bijdrage aan de totale uitstoot van stikstofoxiden en fijn stof van wegverkeer in Nederland.
Oude bromfietsen blijken ook meer koolwaterstoffen uit te stoten dan eerder werd gedacht, maar nieuwe brom-fietsen blijken juist wat schoner. Als gevolg hiervan dalen de emissies van koolwaterstoffen sneller dan eerder werd berekend: van 25 kiloton in 1990 tot 4 kiloton in 2010.
Uitstoot van stikstofoxiden door vrachtverkeer hoger dan gedacht
Ook de uitstoot van stikstofoxiden door vrachtverkeer in Nederland is opnieuw berekend, en wel op basis van nieuwe inzichten in de uitstoot van zogenoemde Euro-IV vrachtauto’s. Deze aanduiding verwijst naar de Europese wetgeving voor de uitstoot van schadelijke stoffen door vrachtauto’s. Euro-IV vrachtauto’s zijn tussen 2005 en 2008 verkocht in Nederland. Uit metingen blijkt dat de uitstoot van stikstofoxiden door deze vrachtauto’s op snelwegen hoger is geweest dan eerder werd gedacht. Tegelijkertijd blijken er in Nederland iets minder Euro-IV vrachtauto’s rond te rijden dan eerder werd verondersteld: door een subsidieregeling zijn er vanaf 2006 al schonere vrachtauto’s verkocht die aan strengere normen voldeden (Euro-V). Toch is de uitstoot van stikstofoxiden door vrachtverkeer in 2010 nu circa 5 kiloton hoger dan eerder werd berekend.
Daarnaast is nauwkeuriger inzicht verkregen in het aandeel van de diverse categorieën trucks in het totale Nederlandse vrachtwagenpark.
Trefwoorden: emissies, grootschalige luchtverontreiniging, emissieregistratie
Abstract
Emissions of transboundary air pollutants in the Netherlands, 1990-2010. Explanation of the annual series of emission data
Emissions of air pollutants in the Netherlands have decreased over the 1990–2010 period. This concerns emissions of sulfur dioxide, nitrogen oxides, non-methane volatile organic compounds (NMVOC), carbon monoxide, ammonia, particulate matter (PM10), heavy metals and
persistent organic pollutants (POPs). The downward trend may be attributed in particular to cleaner fuels, cleaner car engines and to emission reductions in the industrial sectors.
This has become apparent from RIVM’s explanation of Dutch emission data on transboundary air polluting substances, in the Informative Inventory Report (IIR) 2012. Every year, the RIVM submits emission data to the United Nations Economic Commission for Europe (UNECE) and the European Commission. The figures consist of emission data on a series of years, from 1990 up to the most recent year. Moreover, this year’s submission also includes data on the spatial distribution of emissions, which must be reported on every five years by all European Member States.
New insights into emissions from motorcycles and mopeds
New methods of calculating emissions, over the years, have led to ever more accurate results. This year, the largest improvement was made in emission calculations for motorcycles and mopeds in the Netherlands. Emissions were calculated using a new model that takes engine capacity and the age of motorcycles and mopeds more into account. This new model has shown that older motorcycles and mopeds produce higher levels of particulate matter (PM10) than estimated before. Levels of
nitrogen oxide emissions also proved to be higher than calculated earlier. However, in the Netherlands, emissions from motorcycles and mopeds only represent a small share of total nitrogen oxide and particulate matter emissions from road transport.
In addition, although older mopeds were shown to emit more hydrocarbons than previously estimated, newer mopeds appeared somewhat cleaner. This has resulted in a faster decrease in hydrocarbon emissions than had been previously calculated: from 25 kilotonnes in 1990 to 4 kilotonnes in 2010.
Levels of nitrogen oxide emissions from freight transport higher than expected
Nitrogen oxide emissions from freight transport in the Netherlands have also been recalculated based on new insights into the emissions from so-called Euro-IV trucks. This term refers to the EU directive on emissions of harmful substances from freight transport. Measurements have shown that nitrogen oxide emission levels from these trucks along motorways were higher than previously estimated. In addition, it was also shown that there are slightly fewer of these Euro-IV trucks on the Dutch roads than previously assumed; since as early as 2006, due to a subsidy regulation, cleaner trucks have been sold that comply with more stringent standards (Euro-V). Despite this fact, in 2010, the level of nitrogen emissions from freight transport was around 5 kilotonnes higher than previously calculated. Furthermore, a more accurate insight was obtained in the share of the various categories of trucks within the Dutch national fleet of trucks.
Key words: emissions, transboundary air pollution, emission inventory
Contents
Acknowledgements 3
Rapport in het kort 5
Abstract 6
1 Introduction 9
1.1 National inventory background 9
1.2 Institutional arrangements for inventory preparation 10
1.3 The process of inventory preparation 10
1.4 Methods and data sources 13
1.5 Key source analysis 13
1.6 Reporting, QA/QC and archiving 13
1.7 Uncertainties 15
1.8 Explanation on the use of notation keys 17
1.9 Missing sources 18
2 Trends in emissions 19
2.1 Trends in national emissions 19
2.2 Trends in sulphur dioxide (SO2) 21
2.3 Trends in nitrogen oxides (NOx) 21
2.4 Trends in ammonia (NH3) 22
2.5 Trends in non-methane volatile organic compounds (NMVOC) 22
2.6 Trends in PM10 23
2.7 Trends in PM2.5 23
2.8 Trends in Pb 24
3 Energy 25
3.1 Overview of sector 25
3.2 Public Electricity and heat (1A1a) 26
3.3 Industrial Combustion (1A1b, 1A1c and 1A2) 28
3.4 Small Combustion (1A4ai, 1A4bi, 1A4ci and 1A5a) 30
3.5 Fugitives (1B) 33
4 Transport 35
4.1 Overview of the sector 35
4.2 Civil Aviation 36
4.3 Road Transport 38
4.4 Railways 45
4.5 Waterborne navigation 47
4.6 Non-road mobile machinery 50
5 Industry 57
5.1 Overview of the sector 57
5.2 Mineral production (2A) 59
5.3 Chemical industry (2B) 60
5.4 Metal production (2C) 60
5.5 Other Production Industry (2D) 61
5.6 Other production, consumption, storage, transportation or handling of bulk products (2G) 62
6 Solvents and product use 63
6.1 Overview of the sector 63
6.2 Paint Application (3A) 64
6.3 Other solvents use (3D) 65
7 Agriculture 67
7.1 Overview of the sector 67
7.2 Manure management 68
7.3 Agricultural soils 71
8 Waste 73
8.1 Overview of the sector 73
8.2 Waste incineration 74
9 Other 77
10 Recalculations and other changes 79
10.1 Recalculations of the 2010 submission 79
10.2 Improvements 79
10.3 Effect of recalculations and improvements on 1990 and 2008 emission levels 80
11 Projections 83
11.1 Energy 84
11.2 Transport 88
11.3 Industry 90
11.4 Solvent and Product use 90
11.5 Agriculture 91
12 Spatial distributions 93
12.1 Background for reporting 93
12.2 Methodology for disaggregation of emission data 93
12.3 Maps with geographically distributed emission data 94
References 99
The United Nations Economic Commission for Europe’s’ Geneva 1979 Convention on Longe-Range Transboundary Air Pollution (CLRTAP) was accepted by the Netherlands in 1982. Under the Convention parties are obligated to report emission data to the Conventions’ Executive Body in compliance with the implementation of the Protocols to the Convention (also accepted by the Netherlands). The annual Informative Inventory Report (IIR) on national emissions of SO2, NOX, NMVOC, CO, NH3 and various heavy
metals and POP is prepared using the Guidelines for Estimating and Reporting Emission Data under the CLRTAP (UNECE, 2009).
The Netherlands’ IIR 2012 is based on data from the national Pollutant Release and Transfer Register (PRTR). The IIR contains information on the Netherlands’ emission inventories for the years 1990 to 2010, including descrip-tions of methods, data sources, QA/QC activities carried out and a trend analysis. The inventory covers all anthro-pogenic emissions to be reported in the Nomenclature for Reporting (NFR), including individual polycyclic aromatic hydrocarbons (PAHs), which are to be reported under persistent organic pollutants (POP) in Annex IV. Moreover, this year, the spatial distributions of emission data have been reported, this has to be done every five years. A chapter on the followed methodology has therefore been included.
1.1 National inventory background
Emission estimates in the Netherlands are registered in the national Pollutant Release and Transfer Register (PRTR). This PRTR database is the national database for sectorial monitoring of emissions to air, water and soil. The database was set up to monitor pollutants to support national environmental policy as well as to report to the framework of National Emission Ceilings (EU), the CLRTAP, and to monitor the greenhouse gas emissions in conform-ance with United Nations Framework Convention on Climate Change (UNFCCC) and the Kyoto Protocol (National System). The PRTR encompasses the process of data collection, processing and registration, and reporting on emission data for some 350 compounds. Emission data (for the most important pollutants) and documentation can be found at www.prtr.nl.Instead of using the defaults from the EMEP/EEA air pollutant emission inventory guidebook (EEA, 2009), the Netherlands often applies country-specific methods to obtain monitoring data and emission factors. The emission estimates are based on official statistics of the Netherlands (e.g. on energy, industry and agriculture) and environmental reports by companies in the industrial sectors. Both nationally developed and internationally recommended emission factors have been used.
1
1.2 Institutional arrangements for
inventory preparation
The Dutch Ministry of Infrastructure and Environment (IenM) has the overall responsibility for the emission inventory and submissions to CLRTAP. A Pollutant Release and Transfer Register (PRTR) system has been in operation in the Netherlands since 1974. Since 2010, the Ministry of IenM has outsourced the full coordination of the PRTR to the Emission Registration team (ER team) at the National Institute for Public Health and the Environment (RIVM). The main objective of the PRTR is to produce an annual set of unequivocal emission data, that is up to date, complete, transparent, comparable, consistent and accurate. Emission data are produced in annual (project) cycles (RIVM, 2011). Various external agencies contribute to the PRTR by performing calculations or submitting activity data (see next section). In addition to the RIVM, the following institutes contribute to the PRTR:
• Netherlands Environmental Assessment Agency (PBL); • Statistics Netherlands (CBS);
• Netherlands Organisation for Applied Scientific Research (TNO);
• RWS Centre for Water Management (RWS-WD); • RWS Centre for Transport and Navigation (RWS-DVS); • Deltares;
• Alterra WUR;
• Wageningen UR Livestock Research;
• NL Agency (Waste management department); • Agricultural Economics Research Institute (LEI);
• Fugro-Ecoplan, which co-ordinates annual environmen-tal reporting (AER) by companies.
Each of the contributing institutes has its own responsibil-ity and role in the data collection, emission calculations and quality control. These are laid down in general agreements with RIVM and in annual project plans.
1.3 The process of inventory
preparation
Data collection
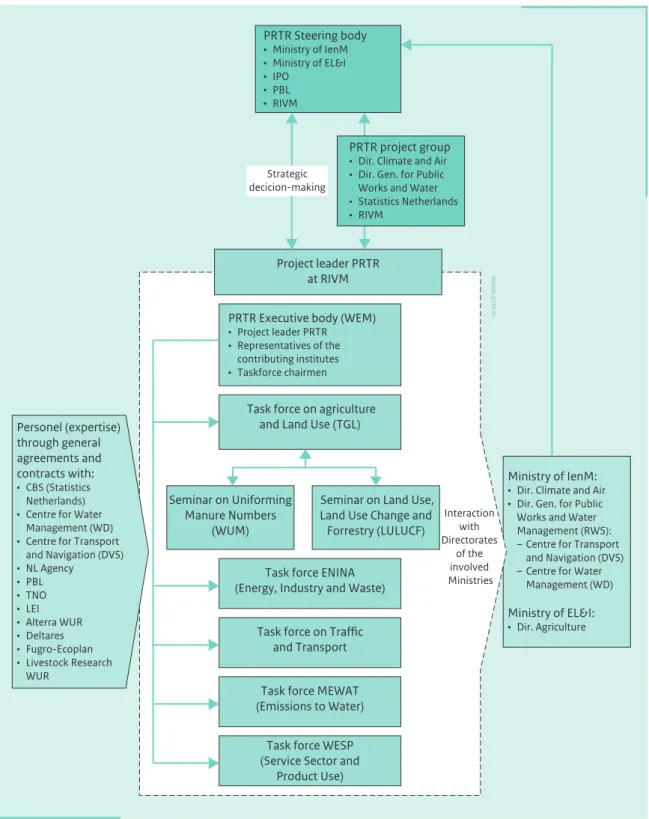
For the collection and processing of data (according to pre-determined methods), the PRTR is organised accord-ing to task forces. The task forces consist of sector experts of the participating institutes. Methods are compiled on the basis of the best available scientific views. Changes in scientific views lead to changes in methods, and to recalculation of historical emissions. The following task forces are recognised (see Figure 1.1):
• Task Force on Agriculture and Land Use;
• Task Force on Energy, Industry and Waste Management - ENINA;
• Task Force on Traffic and Transportation; • Task Force on Water - MEWAT;
• Task Force on Service Sector and Product Use - WESP. Every year, after collection of the emission data, several quality control checks are performed by the task forces during a yearly ‘trend analysis’ workshop. After approval by participating institutes, emission data are released for publication (www.prtr.nl). Subsequently, these data are disaggregated to regional emission data for national use (e.g. 5x5 km grid, municipality scale, provincial scale and water authority scale).
1.3.1 Point-source emissions
As result of the Netherlands’ implementation of the EU Directive on the European Pollutant Release and Transfer Register (EPRTR), about 400 companies, representing even more facilities, are legally obligated to annually submit their emissions of pollutants when they exceed a certain threshold. For some pollutants lower thresholds have been set in the Dutch implementation of the EPRTR directive (VROM, 2008). This has been done to assure that the total reported amount of the main pollutants for each subsector meets approximately 80% of the subsector total. This criterion has been set as safeguard for the quality of the supplementary estimate for Small and Medium-sized Enterprises (SMEs).
As from 1 January 2010, the above-mentioned companies can only submit their emissions as part of an Annual Environmental Report (AER), electronically. All these companies have emission monitoring and registration systems with specifications in agreement with the competent authority. Usually, the licensing authorities (e.g. provinces, central government) validate and verify the reported emissions. Information from the AERs is stored in a separate database at the RIVM and formally remains property of the companies involved.
Data on point-source emissions in the AER database are checked for consistency by the task forces. The result is a selection of validated data on point-source emissions and activities, which are then stored in the PRTR database (ER-I). The ER-I data is combined with supplementary estimates for Small and Medium-sized Enterprises (SMEs). Several methods are applied for calculating these emissions. TNO has derived emission factors for NOx
emissions from small installations, for instance (Van Soest-Vercammen et al., 2002), while, for other substanc-es, the Implied Emission Factors (IEFs) derived from the AERs are applied to calculate sector emissions.
Figure 1.1 The organisational arrangement of the Netherlands Pollutant Release and Transfer Register (PRTR). www .p rtr .n l Ministry of IenM:
• Dir. Climate and Air • Dir. Gen. for Public Works and Water Management (RWS): – Centre for Transport and Navigation (DVS) – Centre for Water Management (WD) Ministry of EL&I: • Dir. Agriculture PRTR Steering body • Ministry of IenM • Ministry of EL&I • IPO • PBL • RIVM Personel (expertise) through general agreements and contracts with: • CBS (Statistics Netherlands) • Centre for Water Management (WD) • Centre for Transport and Navigation (DVS) • NL Agency • PBL • TNO • LEI • Alterra WUR • Deltares • Fugro-Ecoplan • Livestock Research WUR Project leader PRTR at RIVM
PRTR Executive body (WEM)
• Project leader PRTR • Representatives of the contributing institutes • Taskforce chairmen
Task force on agriculture and Land Use (TGL)
Task force ENINA (Energy, Industry and Waste)
Task force on Traffic and Transport
Task force MEWAT (Emissions to Water)
Task force WESP (Service Sector and
Product Use) Seminar on Uniforming
Manure Numbers (WUM)
Seminar on Land Use, Land Use Change and Forrestry (LULUCF) Interaction with Directorates of the involved Ministries Strategic decicion-makingStrategic decicion-making PRTR project group
• Dir. Climate and Air • Dir. Gen. for Public Works and Water • Statistics Netherlands • RIVM
1.3.2 Data storage
In cooperation with the contributing research institutes, emission data are collected and stored in a database managed by the RIVM.
Emission data from the ER-I database and from collec-tively estimated industrial and non-industrial sources are stored in the PRTR database (see Figure 1.2). The PRTR database, consisting of a large number of geographically distributed emission sources (about 700), contains complete annual records of emissions in the Netherlands.
Each emission source includes information on the Standard Industrial Classifi cation code (SBI code) and industrial subsector, separate information on process and combustion emissions, and the relevant environmental compartment and location. These emission sources can be selectively aggregated, per NFR category.
Figure 1.2 The data fl ow in the Netherlands Pollutant Release and Transfer Register.
Data flow in the Netherlands Pollutant Release and Transfer Register (PRTR) (Electronic) Annual Environmental Reports (AER) (Individual facilities) AER database ER-I database Collective industrial sources Area/diffuse sources Activity data Emission factors (Literature, measurements) (Task forces PRTR) Geographical distribution data PRTR-database Statistics Netherlands etc. (Task forces PRTR) (Task forces PRTR) (Task forces PRTR) CRFreporter CRFs LULUCF and KP Data CRF connector CRFreporter Reporting
(RIVM and others) (NL Agency)Upload
Review and Approval (IenM and UNFCCC) NIR LULUCF and KP Data
Overall co-ordination of QA/QC (improvements) (NL agency) www .p rtr .n l
1.4 Methods and data sources
Methods used in the Netherlands are documented in several reports and protocols, and in meta-data files, available fromwww.prtr.nl
. However, some reports are only available in Dutch. For greenhouse gases (www. greenhousegases.nl), particulate matter (PM) and all emissions related to mobile sources, the documentation has been translated in English.In general, two emission models are used in the Netherlands:
• A model for emissions from large point sources (e.g. large industrial and power plants), which are registered separately and supplemented with emission estimates for the remainder of the companies within a subsector (based mainly on IEFs from the individually registered companies). This is the so-called bottom up method. • A model for emissions from diffuse sources (e.g. road
transport, agriculture), which are calculated from activity data and emission factors from sectorial emission inventory studies in the Netherlands (e.g. SPIN documents produced by the ‘Co-operation project on industrial emissions’).
1.5 Key source analysis
Following recommendations 9 and 10 from the Stage 3 in-depth review report for the Netherlands (UNECE, 2010), a trend assessment was carried out for the emission inventory of all components, in addition to a level assessment, to identify key source categories. In both approaches key source categories were identified using a cumulative threshold of 80%. Key categories are those which, when summed together in descending order of magnitude, add up to more than 80% of the total level (EEA, 2009). The level assessments were performed for both the latest inventory year 2010, as well as for the base year of the inventory, 1990. The trend assessments aim to identify categories for which the trend is significantly different from that of the overall inventory. See Appendix 1 for the actual analysis.
1.6 Reporting, QA/QC and archiving
ReportingThe Informative Inventory Report is prepared by the inventory compiling team at RIVM (RIVM-NIC), with contributions by experts from the PRTR task forces.
QA/QC
The RIVM has an ISO 9001:2008 based QA/QC system in place. The PRTR quality management is fully in line with the RIVM QA/QC system. Part of the work for the PRTR is
done by external agencies (other institutes). QA/QC arrangements and procedures for the contributing institutes are described in annual project plan (RIVM, 2011). The general QA/QC activities meet the international inventory QA/QC requirements described in chapter 6 of the EMEP inventory guidebook (EEA, 2009)
There are no sector-specific QA/QC procedures in place within the PRTR. In general, the following QA/QC activities are performed:
Quality assurance (QA)
QA activities can be summarised as follows:
• For the energy, industry and waste sectors, emission calculation in the PRTR is based mainly on AERs by companies (facilities). The companies themselves are responsible for the data quality; the competent authorities (in the Netherlands, mainly provinces and local authorities) are responsible for checking and approving the reported data, as part of the annual quality assurance;
• As part of the RIVM-quality system internal audits are performed at the CMM as part of the ISO certification; • Furthermore, there are annual external QA checks on
selected areas of the PRTR system.
Quality Control (QC)
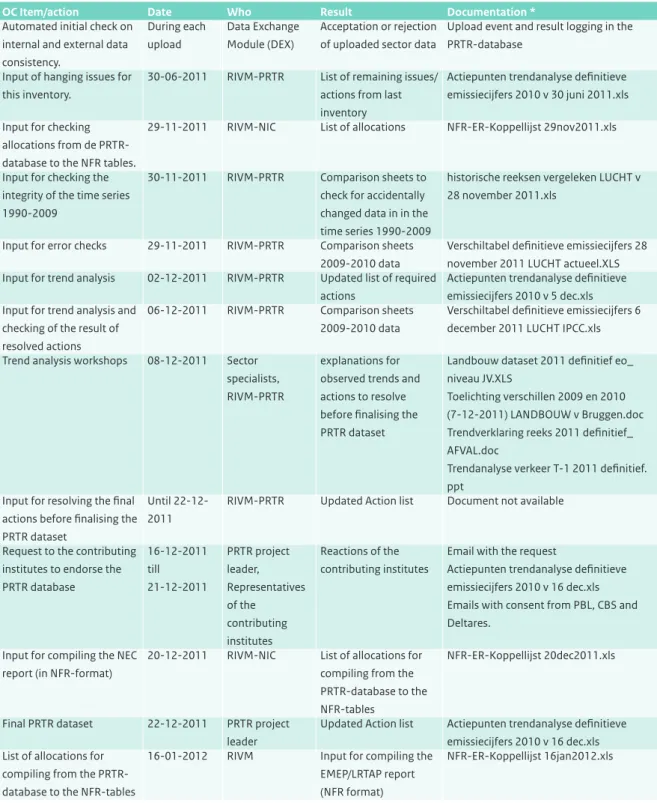
A number of general QC checks have been introduced as part of the annual work plan of the PRTR (for results see table 1.2). The QC checks built into the work plan focus on issues such as consistency, completeness and accuracy of the emission data. The general QC for the inventory is largely performed within the PRTR as an integrated part of the working processes. For the 2011 inventory the PRTR task forces filled in a standard-format database with emission data from 1990 to 2010. After an automated first check of the emission files, by the data exchange module (DEX) for internal and external consistency, the data becomes available to the specific task force for checking consistency and trend (error checking, comparability, accuracy). The task forces have access to information on all emissions in the database, by means of a web-based emission reporting system, and are facilitated by the ER-team with comparable information on trends and time series. Several weeks before a final data set is fixed, a trend verification workshop is organised by the RIVM (see Text box 1.1). Results of this workshop, including actions for the taskforces to resolve the identified clarification issues, are documented at RIVM. Required changes to the database are then made by the taskforces.
Table 1.1 Key items of the verification actions data processing 2011 and NRF/IIR 2012.
OC Item/action Date Who Result Documentation *
Automated initial check on internal and external data consistency. During each upload Data Exchange Module (DEX) Acceptation or rejection of uploaded sector data
Upload event and result logging in the PRTR-database
Input of hanging issues for this inventory.
30-06-2011 RIVM-PRTR List of remaining issues/ actions from last inventory
Actiepunten trendanalyse definitieve emissiecijfers 2010 v 30 juni 2011.xls Input for checking
allocations from de PRTR-database to the NFR tables.
29-11-2011 RIVM-NIC List of allocations NFR-ER-Koppellijst 29nov2011.xls
Input for checking the integrity of the time series 1990-2009
30-11-2011 RIVM-PRTR Comparison sheets to check for accidentally changed data in in the time series 1990-2009
historische reeksen vergeleken LUCHT v 28 november 2011.xls
Input for error checks 29-11-2011 RIVM-PRTR Comparison sheets 2009-2010 data
Verschiltabel definitieve emissiecijfers 28 november 2011 LUCHT actueel.XLS Input for trend analysis 02-12-2011 RIVM-PRTR Updated list of required
actions
Actiepunten trendanalyse definitieve emissiecijfers 2010 v 5 dec.xls Input for trend analysis and
checking of the result of resolved actions
06-12-2011 RIVM-PRTR Comparison sheets 2009-2010 data
Verschiltabel definitieve emissiecijfers 6 december 2011 LUCHT IPCC.xls Trend analysis workshops 08-12-2011 Sector
specialists, RIVM-PRTR
explanations for observed trends and actions to resolve before finalising the PRTR dataset
Landbouw dataset 2011 definitief eo_ niveau JV.XLS
Toelichting verschillen 2009 en 2010 (7-12-2011) LANDBOUW v Bruggen.doc Trendverklaring reeks 2011 definitief_ AFVAL.doc
Trendanalyse verkeer T-1 2011 definitief. ppt
Input for resolving the final actions before finalising the PRTR dataset
Until 22-12-2011
RIVM-PRTR Updated Action list Document not available
Request to the contributing institutes to endorse the PRTR database 16-12-2011 till 21-12-2011 PRTR project leader, Representatives of the contributing institutes Reactions of the contributing institutes
Email with the request
Actiepunten trendanalyse definitieve emissiecijfers 2010 v 16 dec.xls Emails with consent from PBL, CBS and Deltares.
Input for compiling the NEC report (in NFR-format)
20-12-2011 RIVM-NIC List of allocations for compiling from the PRTR-database to the NFR-tables
NFR-ER-Koppellijst 20dec2011.xls
Final PRTR dataset 22-12-2011 PRTR project leader
Updated Action list Actiepunten trendanalyse definitieve emissiecijfers 2010 v 16 dec.xls List of allocations for
compiling from the PRTR-database to the NFR-tables
16-01-2012 RIVM Input for compiling the EMEP/LRTAP report (NFR format)
NFR-ER-Koppellijst 16jan2012.xls
Archiving and documentation
Internal procedures are agreed on (e.g., in the PRTR work plan) for general data collection and the storage of fixed data sets in the PRTR database, including the documenta-tion/archiving of QC checks. As of 2010, sector experts can store relating documents (i.e. interim results, model runs, etc.) on a central server at the RIVM. These documents then become available through a limited-access website. Moreover, updating of monitoring protocols for substanc-es under the CLRTAP is one of the prioritisubstanc-es within the PRTR system. Emphasis is put on documentation of methodologies for calculating SOx, NOx, NMVOC, NH3, PM10
and PM2.5. Methodologies, protocols and emission data
(including emissions from large point sources on the basis of Annual Environmental Reports), as well as such emission reports as the National Inventory Report (UNFCCC) and the Informative Inventory Report (CLRTAP), are made available on the website of the PRTR:
www.prtr.nl
.Each institution involved in the PRTR is responsible for QA/ QC aspects related to reports based on the annually fixed database.
1.7 Uncertainties
Uncertainty assessments constitute a means to either provide the inventory users with a quantitative assess-ment of the inventory quality or to direct the inventory preparation team to priority areas, where improvements are warranted and can be made cost-effective. For these purposes, quantitative uncertainty assessments have been carried out since 1999. However, awareness of
uncertain-ties in emission figures was expressed earlier in the PRTR in so-called quality indices and in several studies on industrial emissions and generic emission factors for industrial processes and diffuse sources. To date, the Dutch PRTR gives only one value per type of emission (calculation result, rounded off to three significant digits). The information on the uncertainty about emission figures presented here is based on the TNO report ‘Uncertainty assessment of NOx, SO2 and NH3 emissions in the
Netherlands’ (Van Gijlswijk et al., 2004), which presents the results of a Tier-2 ‘Monte Carlo’ uncertainty assessment. This uncertainty assessment is based on emissions in the year 2000. Since then, several improvements in activity data and methods (e.g. total N to TAN; see Chapter 6) have been implemented. Therefore, it is necessary to update the uncertainty assessment. This is foreseen within the next years and results will be presented in the IIR in question. Then also a more detailed uncertainty analyses as suggested by the ERT in their Stage 3 in-depth review will be provided (UNECE, 2010).
1.7.1 Quantitative uncertainty
Uncertainty estimates on national total emissions have been reported in the Dutch Environmental Balances since 2000 (PBL, 2009). These estimates were based on uncertainties per source category, using simple error propagation calculations (Tier 1). Most uncertainty estimates were based on the judgement of RIVM/PBL emission experts. A preliminary analysis on NMVOC emissions showed an uncertainty range of about 25%. Van Gijlswijk et al., 2004) assessed the uncertainty in the contribution from the various emission sources to total
Text box 1.1 Trend verification workshops
About a week in advance of a trend analysis meeting, a snapshot from the database is made available by RIVM in a web-based application (Emission Explorer, EmEx) for checks by the institutes involved, sector and other experts (PRTR task forces) and the RIVM PRTR-team. In this way the task forces can check for level errors and consistency in the algorithm/method used for calculations throughout the time series. The task forces perform checks for relevant gases and sectors. The totals for the sectors are then compared with the previous years’ data set. Where significant differences are found, the task forces evaluate the emission data in more detail. The results of these checks form the subject of discussion at the trend analysis workshop and are subsequently documented.
Furthermore, the PRTR-team provides the task forces with time series of emissions per substance for the individual sub sectors. The task forces examine these time series. During the trend analysis for this inventory the emission data were checked in two ways: 1) emissions from 1990 to 2009 from the new time series were compared with the time series of last year’s inventory and 2) the data for 2010 were compared with the trend development per gas since 1990. The checks of outliers are performed on a more detailed level of the sub-sources in all sector back-ground tables:
• annual changes in emissions; • annual changes in activity data;
• annual changes in implied emission factors and • level values of implied emission factors.
Exceptional trend changes and observed outliers are noted and discussed at the trend analysis workshop, resulting in an action list. Items on this list have to be processed within 2 weeks or be dealt with in next year’s inventory.
acidification (in acidification equivalents) according to the Tier-2 methodology (estimation of uncertainties per source category using Monte Carlo analysis). See Table 1.2 for results. A comparison was also made between the Tier-1 and Tier-2 methodologies. This was not straightfor-ward, as the two studies used a different knowledge collection. The 2000 Tier-1 analysis used CLRTAP default uncertainties for several NOx processes, which explains the difference with the 1999 Tier-1 results. For NH3, the difference between the 2000 Tier 1 and Tier 2 can be explained by taking non-normal distributions and dependencies between individual emission sources per animal type into account (both are violations of the Tier-1 assumptions: effects encapsulated in the 1999 Tier-1 analysis). The differences for SO2 and total acidifying
equivalents are small. The conclusion drawn from this comparison is that focusing on the order of magnitude of the individual uncertainty estimates, as in the RIVM (2001) study, provides a reasonable first assessment of the uncertainty of source categories.
The RIVM (2001) study draws on the results from an earlier study on the quality of nitrogen oxide (NOx) and sulphur
dioxide (SO2) emissions, as reported by individual
companies for point sources under their national reporting requirements. In addition to providing quantitative uncertainty estimates, the study yielded important conclusions. For example, it was concluded that a limited number of facilities showed high uncertainties (e.g. 50% or more for NOx), which could be reduced with little extra
effort, and that companies generally have a lack of knowledge on the uncertainty about the emissions they report.
In the study by Van Gijlswijk et al. (2004), emission experts were systematically interviewed on quantitative uncer-tainties, which provided simultaneous information on the reliability and quality of the underlying knowledge base. For processes not covered by interviews, standard default uncertainties, derived from the Good Practice Guidance for CLRTAP emission inventories, were used (Pulles and Van Aardenne, 2001). The qualitative knowledge (on data validation, methodological aspects, empirical basis and proximity of data used) was combined into a score for data strength, based on the so-called NUSAP approach (Van der Sluijs et al., 2003; Van der Sluijs et al., 2005). The qualitative and quantitative uncertainties were combined in so-called diagnostic diagrams that may be used to identify areas for
Table 1.2 Uncertainty (95% confidence ranges) in acidifying compounds and for total acidifying equivalents for emissions in 1999 (RIVM, 2001) and 2000 (Van Gijlswijk et al., 2004).
Component Tier 1 for 1999 Tier 1 for 2000 Tier 2 for 2000
NH3 ± 17% ± 12% ± 17%
NOx ± 11% ± 14% ± 15%
SO2 ± 8% ± 6% ± 6%
Total acid equivalents ± 9% ± 8% ± 10%
Figure 1.3 NUSAP diagnostic diagram indicating strong and weak elements in the available knowledge on acidifying substances.
0,0 0,5 1,0 1,5 2,0 2,5 3,0 Strength (average pedigree score) 0,00
0,05 0,10 0,15 0,20
Rank correlation squared
1 NH3 from dairy cows, manure application
2 NOx from mobile sources agriculture
3 NOx from agricultural soils
4 NH3 from pigs farmed for meat, manure application
5 NOx from gasoline passenger cars, along freeways
6 NH3 from dairy cows, animal housing and storage
7 NOx from articulated trucks, along freeways
8 NH3 from breeding stock pigs, manure application
9 NH3 from calves and yearlings, manure application
10 NH3 from synthetic fertilizer application
www.prtr.nl 1 2 3 4 5 6 7 8 9 10 zoneSafe Danger zone
improvement, since the diagrams indicate strong and weak parts of the available knowledge (see Figure 1.3). Sources with a relatively high quantitative uncertainty and weak data strength are thus candidates for improvement. To effectively reduce uncertainties, their nature must be known (e.g. random, systematic or knowledge uncertain-ty). A general classification scheme on uncertainty typology is provided by Van Asselt (2000).
1.8 Explanation on the use of notation
keys
The Dutch emission inventory covers all relevant sources specified in the CLRTAP that determine the emissions to air in the Netherlands. Because of the long history of the inventory it is not always possible to specify all subsectors in detail. This is the reason why notation keys are used in the emission tables (NFR). These notation keys will be explained in tables 1.3 to 1.5.
Table 1.3 The Not Estimated (NE) notation key explained.
NFR code Substance(s) Reason for
reporting NE
1A3ai(ii) All Not in PRTR
1A3aii(i) All Not in PRTR
1A3 NH3, Cd - PCBs Not in PRTR 2B2 NOx Not in PRTR 4B2 NOx, NH3 Not in PRTR 4B7 NOx, NH3,DIOX Not in PRTR 6A NOx, SO2, NH3 Not in PRTR 6B NOx, NMVOC, SO2, NH3 Not in PRTR
Table 1.4 The Included Elsewhere (IE) notation key explained.
NFR09 code Substance(s) Included in NFR
code
1A3aii(i) All 1A3ai(i)
1A3e All 1A2fi, 1A4cii,
1B2b 1B1a TSP, PM10, PM2.5 2G
1B2c All 1B2b, 1B2aiv
2A2 NOx, NMVOC, SO2 2A7d
2A5 NMVOC 2A7d
2A6 NOx, NMVOC, SO2 2A7d
2B1 NMVOC, NH3 2B5a 2B2 NH3 2B5a 2B4 NMVOC 2B5a 2C2 All 1A2a 2C5f All 1A2b 3C NMVOC 2B5a 4B3 NOx 4B4 4B9c NOx, NH3, TSP, PM10, PM2.5 4B9b 4B9d NOx, NH3, TSP, PM10, PM2.5 4B9b 4D1a NOx 11C 4D2c NOx 11C 4D2c NH3 4B
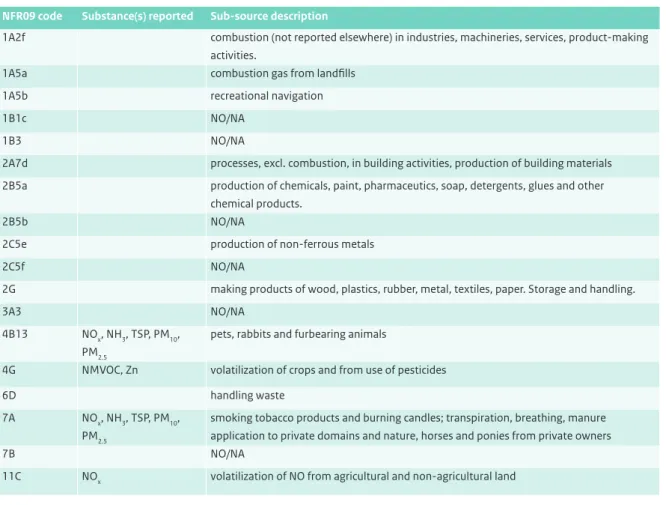
Table 1.5 Sub-sources accounted for in reported ‘other’ codes, with ‘NO/NA’ meaning ‘not occurring or not applicable’.
NFR09 code Substance(s) reported Sub-source description
1A2f combustion (not reported elsewhere) in industries, machineries, services, product-making activities.
1A5a combustion gas from landfills
1A5b recreational navigation
1B1c NO/NA
1B3 NO/NA
2A7d processes, excl. combustion, in building activities, production of building materials 2B5a production of chemicals, paint, pharmaceutics, soap, detergents, glues and other
chemical products.
2B5b NO/NA
2C5e production of non-ferrous metals
2C5f NO/NA
2G making products of wood, plastics, rubber, metal, textiles, paper. Storage and handling.
3A3 NO/NA
4B13 NOx, NH3, TSP, PM10, PM2.5
pets, rabbits and furbearing animals
4G NMVOC, Zn volatilization of crops and from use of pesticides
6D handling waste
7A NOx, NH3, TSP, PM10, PM2.5
smoking tobacco products and burning candles; transpiration, breathing, manure application to private domains and nature, horses and ponies from private owners
7B NO/NA
11C NOx volatilization of NO from agricultural and non-agricultural land
1.9 Missing sources
The Netherlands emission inventory covers all important sources.
2.1 Trends in national emissions
The emissions of all substances showed a downward trend in the 1990-2010 period (see Table 2.1). The major overall drivers for this trend are:
• emission reductions in the industrial sectors; • cleaner fuels and
• cleaner cars.
Road transport emissions have decreased 84% since 1990 for NMVOC, 55% for PM, 56% for NOx and 98% for SO2,
despite a growth in traffic of 20%. The decrease is mainly attributable to European emission regulations for new road vehicles. For PM and NOx, standards have been set
for installations by tightening up the extent of emission stocks of heating installations (BEES). In meeting these requirements Dutch industrial plants have realised a reduction of 92% in PM emissions and 60% in NOx
emissions, since 1990. The drivers for the downward emission trend for specific substances will be elaborated in more detail in the next section.
2
Trends in
emissions
Table 2.1 Total national emissions, 1990-2010.
Main Pollutants Particulate Matter Priority Heavy Metals
NOx CO NMVOC SOx NH3 TSP PM10 PM2.5 Pb Cd Hg Year Gg Gg Gg Gg Gg Gg Gg Gg Mg Mg Mg 1990 566 1124 477 192 355 90 68 44 336 2.1 3.5 1995 472 915 338 130 208 68 50 33 159 1.1 1.4 2000 398 756 238 73 161 46 39 24 33 0.9 1.0 2005 346 659 177 65 140 40 33 19 35 1.7 0.9 2009 280 580 152 37 125 35 30 16 37 1.8 0.6 2010 276 577 151 34 122 35 29 15 44 2.5 0.7 1990-2010 period 1) -290 -548 -327 -158 -233 -55 -39 -29 -293 0.4 -2.8 1990-2010 period 2) -51% -49% -68% -82% -66% -61% -57% -66% -87% 20% -80% 1) Absolute difference in Gg 2) Relative difference to 1990 in %
POPs Other Heavy Metals
DIOX PAH As Cr Cu Ni Se Zn Year g I-Teq Mg Mg Mg Mg Mg Mg Mg 1990 743 20.0 1.5 9.9 69.2 75.3 0.4 220.7 1995 69 9.7 1.0 6.6 69.6 86.6 0.3 142.0 2000 30 3.8 1.1 3.1 70.7 18.7 0.5 91.0 2005 31 3.8 1.5 2.3 74.8 10.7 2.6 84.2 2009 29 4.1 0.8 1.5 79.8 3.0 0.9 91.6 2010 30 3.7 0.8 1.6 81.9 1.8 1.5 105.6 1990-2010 period 1) -712 -16.3 -0.6 -8.3 12.7 -73.5 1.1 -115.1 1990-2010 period 2) -96% -81% -42% -84% 18% -98% 289% -52% 1) Absolute difference in Gg 2) Relative difference to 1990 in %
2.2 Trends in sulphur dioxide (SO
2)
The Dutch SOx emissions (reported as SO2) decreasedby 158 Gg in the 1990-2010 period, corresponding to 82% of the national total in 1990 (Figure 2.1). Main contributions to this decrease came from the energy, industry and transport sectors. The use of coal declined and major coal-fired electricity producers installed flue-gas desulphurisation plants. The sulphur content in fuels for the (chemical) industry and traffic was also reduced. At present the industry, energy and refining sector (IER) is responsible for 93% of the national SO2 emissions.
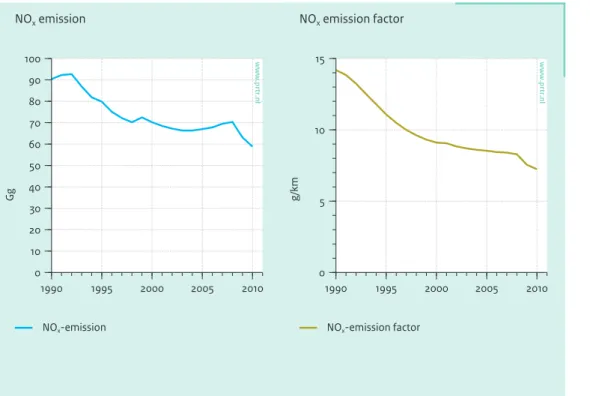
2.3 Trends in nitrogen oxides (NO
x)
The Dutch NOx emissions (NO and NO2, expressed as
NO2) decreased by 290 Gg in the 1990-2010 period,
corresponding to 51% of the national total in 1990 (Figure 2.2). Main contributors to this decrease were the road-transport and energy sectors. The emissions per vehicle decreased significantly in this period, but the effect on total emissions was partially counterbalanced by an increase in number and mileages of vehicles. The shares of the different NFR categories in the national total did not change significantly.
Figure 2.1. SO2 emission trend, 1990-2010.
1990 1995 2000 2005 2010 0 50 100 150 200 Gg 6 Waste 1A3 Transport 2 Industrial processes 1A2 Industrial & Small Combustion 1A1a Energy 1A1b Refining
www.prtr.nl
Figure 2.2 NOx emission trend, 1990–2010.
1990 1995 2000 2005 2010 0 100 200 300 400 500 600 Gg Other 1A2 Industry 1A1 Energy 1A3 Transport www.prtr.nl
2.4 Trends in ammonia (NH
3)
The Dutch NH3 emissions decreased by 233 Gg in the
1990-2010 period, corresponding to 66% of the national total in 1990 (Figure 2.3). This decrease was due to emission reductions from agricultural sources. The direct emissions from animal husbandry decreased slightly as a result of decreasing animal population and measures to reduce emissions from animal houses. Application emissions decreased because of measures taken to reduce the emissions from applying manure to soil and to reduce the total amount of N applied to soil. At present over 90% of Dutch NH3 emissions come from agricultural sources.
2.5 Trends in non-methane volatile
organic compounds (NMVOC)
The Dutch NMVOC emissions decreased by 327 Gg in the 1990-2010 period, corresponding to 68% of the national total in 1990 (Figure 2.4). All major source categories contributed to this decrease: transport (introduction of catalysts and cleaner engines), product use (intensive programme to reduce NMVOC content in consumer products and paints) and industry (introducing emission abatement specific for NMVOC).Figure 2.3 NH3 emission trend, 1990–2010.
1990 1995 2000 2005 2010 0 100 200 300 400 Gg Other 4 Other agricultural 4B9 Poultry 4B8 Swine 4B1 Cattle www.prtr.nl
Figure 2.4 NMVOC emission trend, 1990–2010.
1990 1995 2000 2005 2010 0 100 200 300 400 500 Gg Other 2 Industrial processes 3 Solvents 1A3 Transport www.prtr.nl
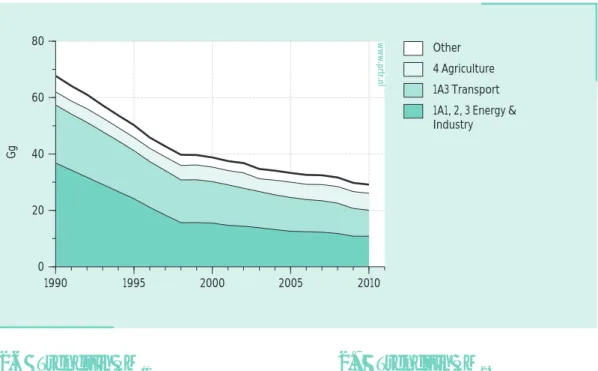
Figure 2.5 PM10, emission trend, 1990–2010. 1990 1995 2000 2005 2010 0 20 40 60 80 Gg Other 4 Agriculture 1A3 Transport 1A1, 2, 3 Energy & Industry
www.prtr.nl
Figure 2.6 PM2.5 emission trend, 1990–2010.
1990 1995 2000 2005 2010 0 10 20 30 40 50 Gg Other 1A3 Transport 2 Industrial processes 1A Energy www.prtr.nl
2.6 Trends in PM
10Dutch PM10 emissions decreased by 39 Gg in the 1990-2010
period, corresponding with 57% of the national total in 1990 (Figure 2.5). The major source categories contributing to this decrease are:
• industry (combustion and process emissions), due to cleaner fuels in refineries and the side-effect of emission abatement for SO2 and NOx , and
• traffic and transport.
PM10 emissions from animal husbandry in agriculture did
not change significantly; neither did the emissions from consumers (1A4bi).
2.7 Trends in PM
2.5PM2.5 emissions are also included in the 2012 submission
to UNECE. These emissions are calculated as a specific fraction of PM10 by sector (based on Visschedijk et al.,
1998). PM2.5 emissions in the Netherlands decreased by
29 Gg in the 1990-2010 period, corresponding with 66% of the national total in 1990 (Figure 2.6). The two major source categories contributing to this decrease were the industrial sector (combustion and process emissions), due to cleaner fuels in refineries and the side-effect of emission abatement for SO2 and NOx and the transport
2.8 Trends in Pb
Lead (Pb) emissions in the Netherlands decreased by 293 Mg in the 1990-2010 period, corresponding with 87% of the national total in 1990 (Figure 2.7). This decrease is attributable to the transport sector, where, due to the removal of Pb from gasoline, the Pb emissions collapsed. The remaining sources are industrial process emissions, in particular from the iron and steel industry.
Figure 2.7 Pb, emission trend 1990-2010.
1990 1995 2000 2005 2010 0 100 200 300 400 Mg Other 1A3 Transport 2 Industrial processes 1A Energy www.prtr.nl
3.1 Overview of sector
This sector includes all stationary combustion emissions from electricity production and industry. Furthermore, they include fugitive emissions from the energy sector.
About 80% to 100% of the NOx, SO2, PM10 and NH3
emissions from stationary combustion (categories 1A1, 1A2, 1A4 and 1A5) are based on environmental reports by large industrial companies. The emission data in the Annual Environmental Reports (AERs) are from direct emission measurements or calculations based on fuel input and emission factors.
As for most developed countries, the energy system in the Netherlands is largely driven by the combustion of fossil fuels. In 2010, natural gas supplied about 47% of the total primary fuels used in the Netherlands, followed by liquid fuels (37%) and solid fossil fuels (9%). The contribution of non-fossil fuels, including renewables and waste streams, is rather limited. Figure 3.1 shows the energy supply and energy demand in the Netherlands.
3
3.2 Public Electricity and heat
production (1A1a)
3.2.1 Source category description
In this sector, one source category is included: Public Electricity and Heat Production (1A1a). This sector consists mainly of coal-fired power stations and gas-fired cogene-ration plants, with many of the latter being operated as joint ventures with industries. Compared to other countries in the EU, nuclear energy and renewable energy (biomass and wind) provide a small amount of the total primary energy supply in the Netherlands.
Figure 3.1 Energy supply and demand in the Netherlands. For the years 1990 – 1994, only the total fuel use is shown
1990 1994 1998 2002 2006 2010 0 1000 2000 3000 4000 PJ N CV /y ea r Nuclear energy Electricity Biomass and waste Solid fuels Liquid fuels Gaseous fuels www .p rtr .n l Energy supply 1990 1994 1998 2002 2006 2010 0 1000 2000 3000 4000 PJ N CV /y ea r
Fuel use (total) Fuel use Energy Sector Fuel use Transport Fuel use Industry Sector Fuel use Residential, Institutional and Commercial Transformation losses Non-energy consumption www .p rtr .n l Energy demand
Table 3.1 Key sources in the Public Electricity and heat (NFR 1A1a) sector. Category / Sub-category Pollutant Contribution to total in 2010 (%) 1A1a Public
electricity and heat production SOx 19.8 NOx 9.5 TSP 1.8 PM2.5 1.5 Cd 7.3 Hg 32
3.2.2 Key sources
3.2.3 Overview of shares and trends in
emissions
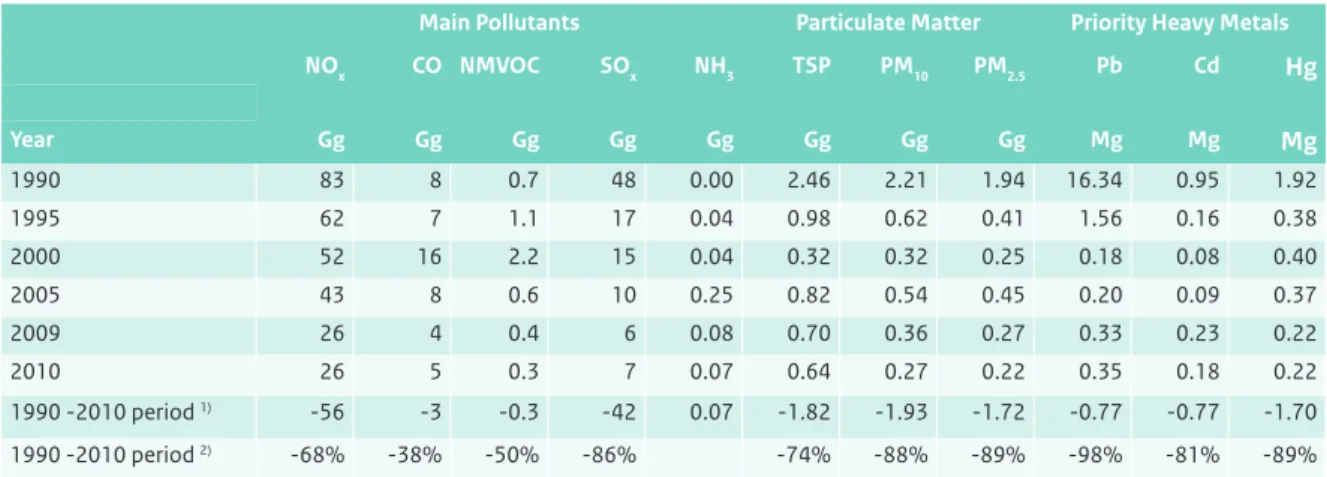
An overview of the trends in emissions is shown in Table 3.2. For almost all pollutants, emissions decreased between 1990 and 2010, while fuel consumption increased by 50% over the same period. The emissions from the main pollutants decreased by 1% to 85%, while emissions from other pollutants decreased by 21% to 98%. The decrease in emissions has partly been caused by a shift from coal to gas consumption. Furthermore, the decrease in emissions has been caused by technological improve-ments. The only pollutant for which emissions have increased is Se. This is a result from a re-allocation of the emissions from waste combustion from 6C to 1A1a.
3.2.4 Activity data and (implied) emission
factors
Emission data are based on Annual Environmental Reports and collectively estimated industrial sources. For this source category, 80% to 100% of the emissions are based
on Annual Environmental Reports. For estimation of emissions from collectively estimated industrial sources, National Energy Statistics (from Statistics Netherlands) are combined with implied emission factors from the Environmental Reports.
3.2.5 Methodological issues
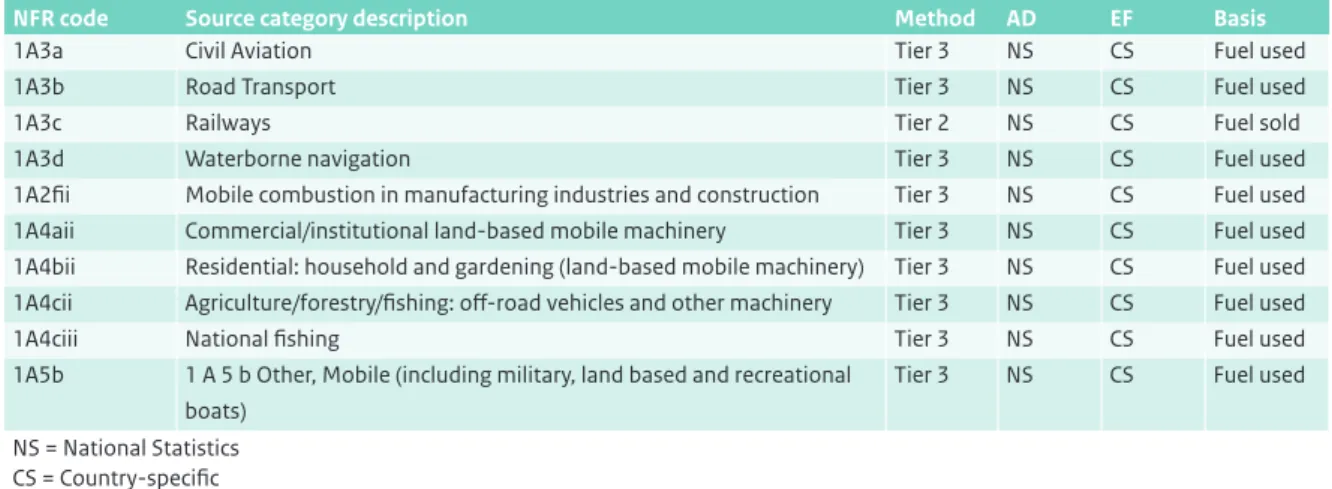
Emissions are based on data in Annual Environmental Reports (AERs) from individual facilities (Tier-3 methodo-logy). The emissions and fuel consumption data in the AERs are systematically examined for inaccuracies by checking the resulting implied emission factors. If environmental reports provide data of high enough quality, the information is used for calculating an ‘implied emission factor’ for a cluster of reporting companies (aggregated by SBI code) and the emission factor ER-I. These emission factors are fuel and sector dependent.
Table 3.2 Overview of trends in emissions from 1A1a Public Electricity and Heat Production.
Main Pollutants Particulate Matter Priority Heavy Metals
NOx CO NMVOC SOx NH3 TSP PM10 PM2.5 Pb Cd Hg Year Gg Gg Gg Gg Gg Gg Gg Gg Mg Mg Mg 1990 83 8 0.7 48 0.00 2.46 2.21 1.94 16.34 0.95 1.92 1995 62 7 1.1 17 0.04 0.98 0.62 0.41 1.56 0.16 0.38 2000 52 16 2.2 15 0.04 0.32 0.32 0.25 0.18 0.08 0.40 2005 43 8 0.6 10 0.25 0.82 0.54 0.45 0.20 0.09 0.37 2009 26 4 0.4 6 0.08 0.70 0.36 0.27 0.33 0.23 0.22 2010 26 5 0.3 7 0.07 0.64 0.27 0.22 0.35 0.18 0.22 1990 -2010 period 1) -56 -3 -0.3 -42 0.07 -1.82 -1.93 -1.72 -0.77 -0.77 -1.70 1990 -2010 period 2) -68% -38% -50% -86% -74% -88% -89% -98% -81% -89%
1) Absolute difference in Gg 2) Relative difference to 1990 in %
POPs Other Heavy Metals
DIOX PAH As Cr Cu Ni Se Zn Year g I-Teq Mg Mg Mg Mg Mg Mg Mg 1990 568.0 0.17 0.50 0.62 2.05 2.49 0.02 40.66 1995 6.0 0.05 0.20 0.37 0.44 1.41 0.05 3.34 2000 0.1 0.00 0.08 0.19 0.17 0.08 0.45 0.26 2005 0.7 0.01 0.15 0.32 0.28 1.91 1.67 0.44 2009 1.7 0.01 0.09 0.09 0.14 0.18 0.84 8.83 2010 1.2 0.01 0.12 0.05 0.14 0.20 1.33 11.04 1990-2010 period 1) -566.8 -0.16 -0.38 -0.57 -1.92 -2.30 1.31 -29.63 1990-2010 period 2) -99.8% -92% -76% -92% -93% -92% -73%
EF ER-I (SBI category, fuel type) =
Emissions ER-I (SBI category, fuel type)
Energy use ER-I (SBI category, fuel type)
where:
EF = emission factor
ER-I = Emission Registration database for individual companies
Next, total combustion emissions in this SBI category are calculated from the energy use according to the NEH (Netherlands Energy Statistics), multiplied by the implied emission factor.
ER-I_SBI_emission (SBI category, fuel type) = EF ER-I (SBI category, fuel type)
* Energy NEH (SBI category, fuel type)
3.2.6 Uncertainties and time-series consistency
Uncertainties are explained in Section 1.7.
3.2.7 Source-specific QA/QC and verification
The emissions and fuel consumption data in the AERs are systematically examined for inaccuracies by checking the resulting implied emission factors. If environmental reports provide data of sufficient quality (see Section 1.3 on QA/QC), the information is used.
3.2.8 Source-specific recalculations
There were no source-specific recalculations in this submission.
3.2.9 Source-specific planned improvements
There are no source-specific planned improvements.
3.3 Industrial Combustion (1A1b, 1A1c
and 1A2)
3.3.1 Source category description
This source category consists of the following categories: • 1A1b ‘Petroleum refining’;
• 1A1c ‘Manufacture of solid fuels and other energy industries’;
• 1A2a ‘Iron and Steel’; • 1A2b ‘Non-ferrous Metals’; • 1A2c ‘Chemicals’;
• 1A2d ‘Pulp, Paper and Print’;
• 1A2e ‘Food Processing, Beverages and Tobacco’; • 1A2fi ‘Other’.
The sector 1A2fi includes industries for mineral products (cement, bricks, other building materials, glass), textiles, wood and wood products, machinery.
3.3.2 Key sources
Key sources in this sector are presented in Table 3.3.
Table 3.3 Key sources in the Industrial Combustion (NFR 1A1b, 1A1c and 1A2) sector.
Category / Sub-category Pollutant Contribution
to total in 2010 (%) 1A1b Petroleum refining SOx
NOx NMVOC CO PM10 TSP PM2,5 PAH 37.6 2.0 1.0 1.1 1.0 1.1 1.5 0.7 1A1c Manufacture of solid
fuels and other energy industries
NOx 1.7
1A2a Stationary combustion in manufacturing industries and construction: Iron and steel
SOx NOx CO 11.3 2.1 14.3 1A2b Stationary Combustion in manufacturing industries and construction: Non-ferrous metals SOx CO Dioxins 6.6 2.2 5.4 1A2c Stationary combustion in manufacturing industries and construction: Chemicals SOx NOx NMVOC CO Pb Cd Dioxins 6.2 4.6 2.4 2.1 6.7 51.0 12.9 1A2d Stationary combustion in manufacturing industries and construction: Pulp, Paper and Print
-
-1A2e Stationary combustion in manufacturing industries and construction: Food processing, beverages and tobacco SOx NOx 1.5 1.0 1A2fi Stationary combustion in manufacturing industries and construction: Other NOx NMVOC CO PAH 2.4 1.3 0.9 2.4
3.3.3 Overview of shares and trends in
emissions
An overview of the trends in emissions is shown in Table 3.4. Emissions have reduced since 1990 for most pollu-tants, except for some heavy metals and for dioxins. Reductions in emissions of main pollutants have been caused by improvements in abatement techniques. Increases in some other pollutants have been caused by increases in fuel use. Emission reduction of SO2 and PM10
are mainly caused by shifts in fuel use by refineries from oil to natural gas. However, economic recovery also caused an increase in NOx emissions compared to 2009.
3.3.4 Activity data and (implied) emission
factors
Petroleum refining (1A1b)
All emission data have been based on Annual Environmental Reports.
Manufacture of solid fuels and other energy industries (1A1c)
Emission data have been based on Annual Environmental Reports and collectively estimated industrial sources.
Iron and steel (1A2a)
All emission data have been based on Annual Environmental Reports and registered in the ER-I database.
Non-ferrous metals (1A2b)
Emission data have been based on Annual Environmental Reports and collectively estimated industrial sources. For this source category the percentage of SO2 emissions,
based on annual reports, is 100%.
Chemicals (1A2c)
Emission data have been based on Annual Environmental Reports and collectively estimated industrial sources. For this source category, the percentages of emissions based on annual reports are about 100% for SO2, 90% for NOx,
75% for CO and 100% for Pb, Cd and dioxins.
Table 3.4 Overview of trends in emissions from Industrial Combustion.
Main Pollutants Particulate Matter Priority Heavy Metals
NOx CO NMVOC SOx NH3 TSP PM10 PM2.5 Pb Cd Hg Year Gg Gg Gg Gg Gg Gg Gg Gg Mg Mg Mg 1990 101 267 34.7 110 0.58 8.95 8.12 5.01 1.89 0.14 0.18 1995 78 215 20.0 90 0.32 7.00 6.67 4.32 4.27 0.20 0.08 2000 49 161 7.4 46 0.05 6.33 6.22 4.26 0.04 0.01 0.11 2005 49 154 9.8 46 0.06 2.09 1.88 1.43 0.01 0.00 0.00 2009 39 115 9.7 27 0.57 1.19 0.91 0.65 1.68 0.67 0.02 2010 40 124 8.5 24 0.45 0.77 0.53 0.39 3.08 1.28 0.02 1990 -2010 period 1) -61 -143 -26.3 -86 -0.13 -8.17 -7.59 -4.62 1.20 1.15 -0.16 1990 -2010 period 2) -60% -53% -76% -78% -22% -91% -93% -92% 63% 835% -91% 1) Absolute difference in Gg 2) Relative difference to 1990 in %
POPs Other Heavy Metals
DIOX PAH As Cr Cu Ni Se Zn Year g I-Teq Mg Mg Mg Mg Mg Mg Mg 1990 0.01 0.87 0.17 2.49 1.39 64.60 0.04 2.95 1995 0.02 0.09 0.23 3.14 2.82 79.41 0.05 58.95 2000 0.00 0.00 0.00 0.51 0.15 17.40 0.00 24.28 2005 0.87 0.10 0.78 0.08 0.09 6.50 0.08 0.51 2009 3.12 0.09 0.01 0.10 1.07 1.39 0.01 9.11 2010 5.69 0.12 0.01 0.14 1.13 0.02 0.12 9.81 1990 -2010 period 1) 5.68 -0.75 -0.16 -2.34 -0.27 -64.58 0.08 6.87 1990 -2010 period 2) 59372% -86% -92% -94% -19% -100% 174% 233% 1) Absolute difference in Gg 2) Relative difference to 1990 in %
Pulp, paper and print (1A2d)
All emission data have been based on Annual Environmental Reports and registered in the ER-I database.
Food processing, beverages and tobacco (1A2e) Emission data have been based on Annual Environmental Reports and collectively estimated industrial sources.
Other (1A2f)
This sector includes all combustion emissions from the industrial sectors not belonging to the categories 1A2a to 1A2e. Emission data have been based on Annual Environmental Reports and collectively estimated industrial sources.
For some of the above mentioned categories, emissions were not entirely available from the AERs. For these sectors, emissions were calculated using National Energy Statistics (NEH) and implied emission factors from the environmental reports.
3.3.5 Methodological issues
For all sectors, emissions have been based on data in AERs from individual facilities (Tier-3 methodology). The emissions and fuel consumption data in AERs were systematically examined for inaccuracies by checking the resulting implied emission factors. If environmental reports provided data of high enough quality, the information was used for calculating an ‘implied emission factor’ for a cluster of reporting companies (aggregated by SBI code) and the emission factor ER-I. These emission factors are fuel and sector dependent.
EF ER-I (SBI category, fuel type) =
Emissions ER-I (SBI category, fuel type)
Energy use ER-I (SBI category, fuel type)
where:
EF = emission factor
ER-I = Emission Registration database for individual companies
Total combustion emissions in this SBI category have been calculated from the energy use in the NEH (Netherlands Energy Statistics), multiplied by the implied emission factor.
ER-I_SBI_emission (SBI category, fuel type) = EF ER-I (SBI category, fuel type)
* Energy NEH (SBI category, fuel type)
3.3.6 Uncertainties and time-series consistency
Uncertainties are explained in Section 1.7.
3.3.7 Source-specific QA/QC and verification
The emissions and fuel consumption data in the AERs were systematically examined for inaccuracies by checking the resulting implied emission factors. If the environmen-tal reports provided data of high enough quality (see Section 1.3 on QA/QC), the information was used.
3.3.8 Source-specific recalculations
There were no source-specific recalculations in this submission.
3.3.9 Source-specific planned improvements
There are no source-specific planned improvements.
3.4 Small Combustion (1A4ai, 1A4bi,
1A4ci and 1A5a)
3.4.1 Source-category description
Source category 1A4 ‘Other sectors’ comprises the following subcategories:
• 1A4ai ‘Commercial and Institutional Services’. This sector comprises commercial and public services, such as banks, schools and hospitals, trade, retail and communication. It also includes the production of drinking water and miscellaneous combustion emissi-ons from waste handling activities and from wastewater treatment plants.
• 1A4bi ‘Residential’. This sector refers to domestic fuel consumption for space heating, water heating and cooking. About three-quarters of the sector’s consump-tion of natural gas are used by space heating.
• 1A4ci ‘Agriculture/Forestry/Fishing: Stationary’. This sector comprises stationary combustion emissions from agriculture, horticulture, greenhouse horticulture, cattle breeding and forestry.
• 1A5a ‘Other stationary’. This sector includes stationary combustion of waste gas from dumping sites.
3.4.2 Key sources
3.4.3 Overview of shares and trends in emissions An overview of the trends in emissions is shown in Table 3.6. Emissions of all pollutants have decreased since 1990, while fuel use increased in the 1A4 category by 20%. Because of the cold winter of 2009/2010, the fuel use and the consequent emissions in 2010 are higher than in 2009.
Table 3.5 Key sources in the Small Combustion (NFR 1A4 and 1A5) sector.
Category / Subcategory Pollutant Contribution to total of
2009 (%) 1A4ai Commercial/institutional, stationary NOx
NMVOC
4.8 1.0
1A4bi Residential, stationary SOx
NOx NMVOC CO TSP PM10 PM2.5 Hg Dioxins PAH 1.7 4.6 6.2 10.2 10.1 5.7 10.3 3.5 18.6 77.7
1A4ci Agriculture/forestry/fishing, stationary NOx
NMVOC
4.2 1.2