NATURAL CAPITAL ACCOUNTING
FOR MAINSTREAMING
BIODIVERSITY IN PUBLIC POLICY
Natural Capital Policy Forum – 26–27 November 2018
Background Report
Arjan Ruijs, Michael Vardon
13 December 2018Contents
ABSTRACT
3
1
INTRODUCTION
4
2
INTERNATIONAL BIODIVERSITY POLICY FRAMEWORKS
7
3
POTENTIAL CONTRIBUTIONS OF NCA TO BIODIVERSITY-RELATED
POLICIES
9
3.1 Biodiversity policies, policy questions and accounts 9
3.2 Relevant analytical methods 14
4
EXPERIENCES WITH NCA FOR BIODIVERSITY-RELATED
POLICY-MAKING
16
5
CONCLUSIONS
24
ACKNOWLEDGEMENTS
25
REFERENCES
26
APPENDIX 1: LINKS BETWEEN AICHI TARGETS AND SEEA ACCOUNTS28
Abstract
This report provides an overview of current and potential uses of natural capital accounting for biodiversity-related policy. The list of potential uses of the accounts is long, with many types of accounts from the System of Environmental-Economic Accounting (SEEA), both the Experimental Ecosystem Accounting and Central Framework, and the System of National Accounts relevant for assessing the importance of biodiversity for economic production, wealth and human well-being, as well as the effects of various government policies on biodiversity. Which accounts are most
relevant depends on the policy and the policy questions raised. Accounting can be applied to obvious areas of biodiversity policy, such as the establishment and management of conservation areas. In addition, they are also useful for policies on sustaining the supply of ecosystem services, building resilient ecosystems and safeguarding food supply from agricultural biodiversity, or for policies promoting the sustainable use of ecosystem services by economic actors.
The ecosystem extent accounts have many policy uses, as do the ecosystem services and ecosystem condition accounts, and, together, these can be used to assess the effectiveness of existing biodiversity-related policies. The species accounts are especially useful for determining the effectiveness of policies aimed to protect rare and endangered species. The water, mineral and forestry accounts from the SEEA Central Framework or the supply and use tables from the System of National Accounts can be relevant for policy questions related to the impacts of resource exploitation or economic activity on biodiversity. These accounts allow comparison between the benefits of economic activity and the costs of biodiversity protection, and provide data for
modelling the impacts of various policies. Furthermore, the environmental protection expenditure accounts are useful for keeping track of the effectiveness of public and private environmental protection expenditures.
The more advanced analytical approaches are not yet widely used, nor are analyses that combine multiple accounts to show synergies or trade-offs between biodiversity and economic changes, or changes in ecosystem resilience.
To more fully exploit the potential of ecosystem accounting, a number of issues should be addressed. These include:
• Integrating the accounts into national information systems and ensuring that the base data are regularly updated, just like the many other updates, such as on the economy and society, by statistical organisations.
• Ensuring demand-side guidance is provided to help policymakers and analysts understand how these accounts could be used. The list of possible accounts is long, and that of their possible applications for indicator development, analysis or policy use is even longer.
• Encouraging more practical experience in how the accounts could be used for trend analysis, econometric analysis, input-output analysis and bioeconomic modelling. Building the accounts is important, but actually using them is equally important, to provide insight into possible applications for policymakers. This requires external support for developing countries and closer cooperation between policymakers, account compilers and researchers in all countries. A key aspect of ecosystem accounting is that it combines economic and biodiversity data. In this way, accounting can be used for implementing the National Biodiversity Strategy and Action Plans (NBSAPs) and refining existing or developing new strategies to conserve biodiversity. Maybe even more importantly, ecosystem accounting also shows the importance of biodiversity for the
economy and can highlight the risks of biodiversity decline to the economy and human well-being, more generally. Finally, while there are challenges in producing biodiversity-related accounts, the work to date shows that producing them is possible and that the key task now is to embed biodiversity accounting into the machinery of government.
1 Introduction
This report provides a brief overview of how natural capital accounts—set up according to the System of Environmental-Economic Accounting (SEEA; UN et al., 2014a,b)—can be or are currently already used to inform biodiversity-related polices. It discusses, from a policy perspective, how Natural Capital Accounting (NCA) can be used both to inform policymakers and to identify common biodiversity-related questions they may have, and how NCA can be used in answering these questions. These questions may refer to biodiversity conservation or may be about the coherency between biodiversity policies and other policy fields and the economic importance of the
sustainable use of biodiversity. The report is based on a literature review and a short questionnaire sent out to statistical institutes of various countries.1
The objective of this report is to provide a starting point for discussions about what government authorities, businesses and others can do to further integrate natural capital accounts and natural capital assessments into their biodiversity-related policies and related decision-making processes. The United Nations (UN) and Convention on Biological Diversity (CBD) define biodiversity as:
‘the variability among living organisms from all sources including, inter alia, terrestrial, marine and other aquatic ecosystems and the ecological complexes of which they are part; this includes diversity within species, between species and of ecosystems’ (UN et al., 2014b, www.cbd.int). Biodiversity is a key determinant of ecosystem health, functioning and resilience (Santamaria and Mendez, 2012) and therefore essential for sustaining ecosystem services and human well-being. Yet, biodiversity levels are still declining, among other things due to deforestation, land-use changes, unsustainable land and water use, climate change and pollutant emissions to the air, water and land (GBO, 2014). For that reason, accounting for biodiversity, and explicitly showing ‘the dependencies of human economic activity, and human well-being more broadly, on ecosystems and biodiversity and the wide variety of priced and unpriced services they provide’ (Vardon et al., 2018) is important for delivering sustainable development.
Protecting biodiversity and the sustainable use of biodiversity are at the core of the Aichi targets of the CBD. These objectives are also covered in the Sustainable Development Goals, and, since the Millennium Ecosystem Assessment (2005), are high on the agenda of many governments and businesses around the world. More and more, it is recognised that the protection of biodiversity is increasingly recognised to have many benefits and as a necessary condition for lifting people out of poverty and improving wealth (World Bank, 2018). However, there is still a long way to go to mainstream biodiversity into day-to-day policies and governance decisions of governments and business.
Government authorities and businesses need information if they are to mainstream biodiversity into policy-making. This, for example, includes information about the trends in ecosystems and species occurrence, abundance and distribution. And, maybe even more importantly, it also includes information about the impacts or externalities of land and resource use related to
biodiversity and about the importance of biodiversity for maintaining resilient ecosystems and the delivery of ecosystem services (incl. agricultural production, renewable resources, fisheries and water availability). Moreover, it also includes information on the broad range of benefits of conservation decisions and the effectiveness of current expenditures on biodiversity.
The SEEA provides an integrated framework for organising biodiversity-related statistics into a series of accounts. Biodiversity-related natural capital accounts provide a framework for collecting, systematically storing and regularly presenting this type of information (Hamilton, 2013).
Standardised biodiversity-related accounts are being developed as part of SEEA Experimental Ecosystem Accounting (SEEA-EEA) (UN et al., 2014b; and see Text box 1). As SEEA-EEA is linked to the System of National Accounts (SNA), it integrates biodiversity information into national-level accounting frameworks and reporting systems. It, thus, allows for analysing trends in biodiversity, biodiversity use and the importance of its protection and use in the economy and society, more generally.
Box 1: Natural capital accounting and the System of Environmental-Economic Accounting
The System of Environmental-Economic Accounting (SEEA) is the internationally agreed methodology for natural capital accounting. The SEEA Central Framework (SEEA-CF) (UN et al., 2014a) and SEEA Experimental Ecosystem Accounts (SEEA-EEA) (UN et al., 2014b) contain the standard concepts, definitions, classifications, accounting rules and tables for producing internationally comparable statistics on the environment and ecosystems and their relationship with the economy. They guide the compilation of consistent and comparable statistics and indicators for policy-making, analysis and research.
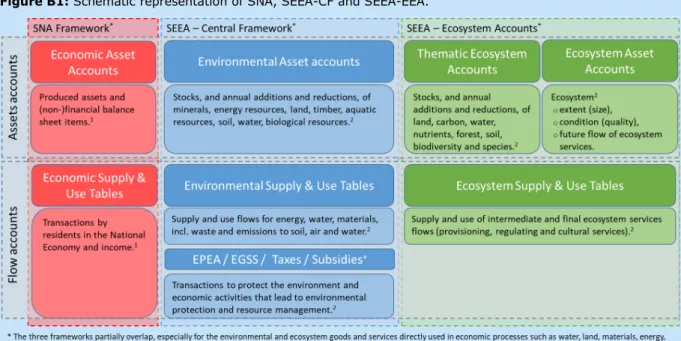
The SEEA-CF enables compiling physical and monetary accounts for a range of natural resources, such as minerals, timber and fisheries, and linking these to the System of National Accounts. It distinguishes between supply and use tables representing flows of natural capital from suppliers to users, asset accounts representing stocks of natural capital and the annual additions or withdrawals and functional accounts representing, for instance, environmental protection expenditures (see Figure B1). SEEA-EEA add accounts that summarise information about the extent and condition of ecosystems, the status of biodiversity, and their changing capacity to operate as a functional unit and deliver a flow of ecosystem services. Some resources are included in both SEEA-CF and SEEA-EEA, such as land, water and agricultural production.
The SEEA supply and use tables, in physical and monetary terms, record the flows of natural inputs, products, ecosystem services and residuals within the economy as well as those between the environment and the economy. These include, for instance, water and energy used in production processes, pollination and soil formation necessary for primary production, and waste flows to the environment. Asset accounts, in physical and monetary terms, measure the natural resources available and changes in the available amount of these resources due to extraction, natural growth and regrowth, and other reasons. These include mineral, timber, aquatic, soil, water and land resources. SEEA-EEA (UN et al., 2014b) and related technical guidance (UN, 2017) add to these asset accounts for biodiversity, ecosystems and future and current flows of ecosystem services (see also Box 2 in Section 3.1). These help to track the impacts of land-use changes on some of the key inputs of primary production. Environmental protection expenditure accounts record the many environment-related transactions between industries, households and governments. Examples include green investments, jobs related to conservation or climate action, soil restoration and recycling.
Figure B1: Schematic representation of SNA, SEEA-CF and SEEA-EEA.
This report discusses, from a policy perspective, how accounts can help policymakers to address biodiversity-related policy questions. Section 2 first provides an overview of relevant international biodiversity policy frameworks that guide most of the national biodiversity-related policies. Section
3 provides an overview of the accounts and discusses their various applications. A growing number of countries is experimenting with natural capital accounts to inform their biodiversity-related policies, and Section 4 discusses a number of recent examples. These experiences may inform other countries about the opportunities these accounts provide for compiling policy-relevant indicators to monitor biodiversity changes, or for using them as input into policy analysis. Chapter 5 draws conclusions and describes lessons learned.
2 International biodiversity policy frameworks
Biodiversity is relevant to a range of policy areas. Conservation and the sustainable use of natural resources, such as forests and fish, are key policy areas. Increasingly there is recognition of the importance of biodiversity to other parts of the economy and human well-being. For example, the importance of: insect pollination to agriculture (e.g. Allsopp et al., 2008); natural areas and green spaces for human health (e.g. Aerts et al., 2018); and the importance of well-functioningecosystems for the sustained availability of clean water (e.g. Bennett et al., 2009).
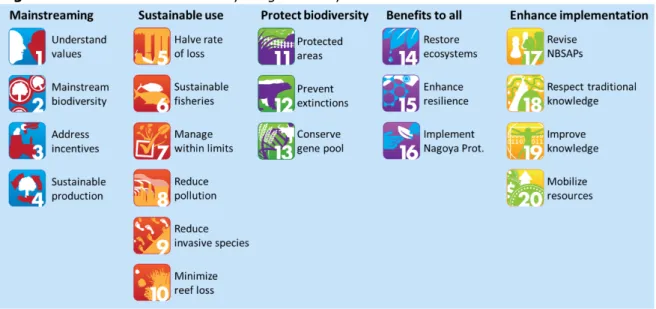
While biodiversity is applicable to a range of policy areas, the Strategic Plan for Biodiversity 2011– 2020, agreed at the 10th meeting of the Convention on Biological Diversity (CBD) in Nagoya, forms the backbone of biodiversity policies, worldwide. This plan includes an ambitious set of 20 targets, the Aichi Biodiversity Targets—see Figure 1 and Appendix 1. These targets contribute to five strategic goals:
A. Address the underlying causes of biodiversity loss by mainstreaming biodiversity across government and society (targets 1–4),
B. Reduce the direct pressures on biodiversity and promote sustainable use (targets 5–10), C. Improve the status of biodiversity by safeguarding ecosystems, species and genetic
diversity (targets 11–13),
D. Enhance the benefits to all from biodiversity and ecosystem services (targets 14–16), and E. Enhance implementation through participatory planning, knowledge management and capacity
building (targets 17–20).
Figure 1: The 20 Aichi Biodiversity Targets set by the CBD
Source: www.cbd.int, Icons: © BIP/SCBD
The two targets that especially focus on mainstreaming biodiversity into national policy-making processes are targets 2 and 17. Target 2 aims on the one hand at integrating biodiversity values into national and local development and poverty reduction strategies and planning processes. On the other hand, it aims at incorporating biodiversity values into national accounting and reporting systems. Target 17 specifies the formulation and implementation of National Biodiversity Strategy and Action Plans (NBSAPs). This is one of the key instruments to motivate countries to formulate biodiversity policies. To date, 190 out of 196 parties to the CBD have developed NBSAPs and have made a start to mainstream them into the activities of those sectors whose activities can impact biodiversity.
A second important policy driver are the Sustainable Development Goals (SDGs). The SDGs, adopted by the UN in 2015, are an ambitious set of seventeen development goals for all countries, covering all dimensions of sustainability. The SDGs recognise that sustainable development
requires integration of all pillars of sustainability into policy frameworks and programmes, including biodiversity protection. SDG 15, ‘life on land’, especially calls to halt biodiversity loss, to integrate biodiversity into development and poverty reduction strategies and to integrate it into accounting systems. Directly or indirectly all SDGs relate to biodiversity. This may be obvious for SDG 6 on ‘clean water and sanitation’, 12 on ‘responsible consumption and production’, 13 on ‘climate action’ and 14 on ‘life below water’. Also related to biodiversity, either because they depend on its
sustainable use or because they impact upon it are: SDG 2 on ‘zero hunger’; SDG 3 on ‘good health and well-being’; SDG 7 on ‘clean energy’; SDG 8 on ‘decent work and economic growth’; SDG 9 on ‘industry, innovation and infrastructure’; and SDG 11 on ‘sustainable cities and communities’.
These key policy drivers influence biodiversity protection policies and policies to improve
sustainable use of biodiversity globally. A general element in the Aïchi targets and the SDGs is to mainstream biodiversity into policy through action plans and to integrate biodiversity into
accounting and reporting systems. This is necessary for increasing awareness, monitoring progress, learning about causes of biodiversity loss or unsustainable use, and assessing the impacts of proposed policies. The next section shows how countries are making progress on this.
3 Potential contributions of NCA to
biodiversity-related policies
The potential benefits of biodiversity-related accounts are manifold (UN et al., 2014b; UNEP-WCMC 2015). They are important for monitoring the status of biodiversity and for international reporting obligations related to the Sustainable Development Goals, the Aichi targets and climate change. But the possible use of biodiversity-related accounts go beyond reporting. As policies are increasingly considered in a more integrated and multidisciplinary fashion, ecological and biodiversity information will be used to identify issues, assess policy options and analyse the success or otherwise of existing policy or management.
In this, the biodiversity-related accounts can provide information that is needed for the assessment of sustainable economic growth, the contribution of ecosystems and their services to such growth as well as overall human well-being. This is achieved by linking the biodiversity and ecosystem accounts to standard economic accounts, allowing the tracking of interdependencies between the economy and the environment. Potentially, the accounts can be used for a broad range of biodiversity-related policy questions including, for example, adequacy of budget allocations to restore or protect biodiversity or economic incentives related to the stimulation of land management changes leading to the enhancement of different baskets of ecosystem services. Accounting for biodiversity may also be used in more general policies, including those related to sustainable production and consumption or to the use of alternative sources of energy and other resources. Finally, as the biodiversity accounts are spatially explicit, they allow for the assessment of policy responses at fine geo-spatial scales, and can be used, for example, for identifying and protecting hotspot areas, managing river basins or enhancing sustainability of agricultural land use (UN et al., 2014b).
To systematically consider how the ecosystem accounts can benefit biodiversity-related policies we will now discuss which biodiversity-related policy questions are pertinent, how the accounts can be of help, and what analytical methods are needed.
3.1
Biodiversity policies, policy questions and accounts
In this section, we distinguish between policy categories being implemented in relation to biodiversity, as well as the key policy questions that arise through the policy cycle. First, we distinguish the following three categories of biodiversity-related policies.
A. Protecting biodiversity, focusing on protection programmes for species and ecosystems and the selection of suitable areas to designate as protected area.
B. Sustaining the supply of ecosystem services and building resilient ecosystems by safeguarding agricultural biodiversity. These policies relate to the instrumental role of biodiversity and especially aim for maintaining the ecosystem conditions and for protecting the genes, species and ecosystems that are necessary for a sustained supply of ecosystem services. It includes for example the protection of bee populations for pollination, the protection of soil biodiversity to maintain soil productivity, the protection of hedges and vegetation that provide habitat to insects controlling pests and fungus, and the enhancement and organisation of protected areas to sustain eco-tourism. These services provide the necessary conditions for food production and eco-tourism.
C. Stimulating a sustainable use of ecosystem services and preventing further declines of biodiversity. These policies aim for preventing pollution crossing key thresholds or planetary boundaries and for preventing unsustainable land use, resource exploitation or harvest levels that exceed natural regeneration rates. This refers especially to policies regulating water use, industrial emissions, mining, agricultural land use, fisheries and forestry. It may include policies limiting emissions to soil, air and water, limiting water use in periods of water scarcity,
regulating the use of hazardous inputs and equipment and sustainably managing harvest concessions.
In short, policy category A concentrates on species and ecosystem protection for sake of their
intrinsic value. Policy category B considers protection of functional biodiversity, whereas policy
category C considers the regulation of economic activities that directly or indirectly result in
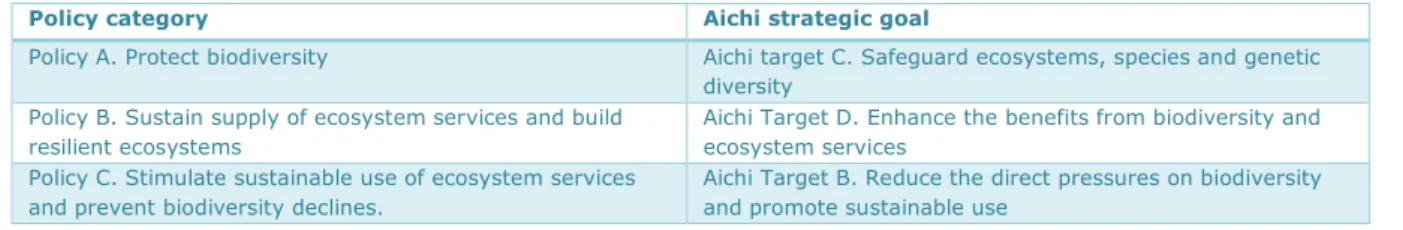
biodiversity decline. Table 1 gives the links between these policy categories and the Aichi targets.
Table 1: Relation between the policy categories and the Aichi targets
Policy category Aichi strategic goal
Policy A. Protect biodiversity Aichi target C. Safeguard ecosystems, species and genetic diversity
Policy B. Sustain supply of ecosystem services and build resilient ecosystems
Aichi Target D. Enhance the benefits from biodiversity and ecosystem services
Policy C. Stimulate sustainable use of ecosystem services and prevent biodiversity declines.
Aichi Target B. Reduce the direct pressures on biodiversity and promote sustainable use
Note: See Section 2 for a description of the Aichi targets.
Policy analysts and policymakers need information for identifying which issues of the above policy categories are relevant in their situation and for preparing, implementing and monitoring policy instruments. We distinguish between three types of policy questions that arise throughout the policy cycle:
1. What is the status and are the trends in biodiversity and sustainable biodiversity use? 2. What are possible trade-offs and synergies of biodiversity policies?
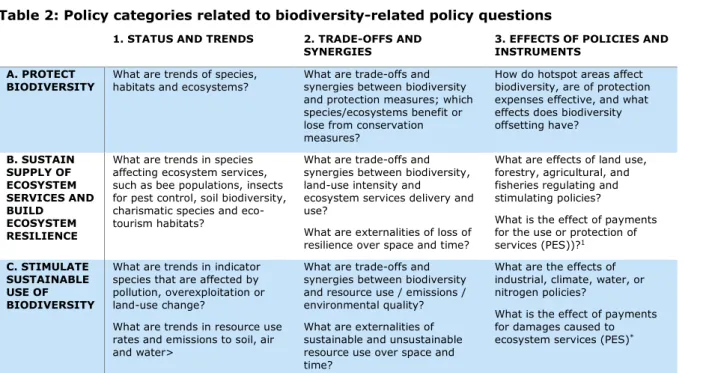
3. What are the envisaged effects of biodiversity-related policies and policy instruments? Table 2 gives examples of policy questions that may be raised for the three categories of
biodiversity policies presented in Table 1. The questions listed in this table are not exhaustive but they give an idea about the possible questions that can be raised for each policy category. For monitoring the evolution of biodiversity and biodiversity use, policy analysts and policymakers firstly need insights into status and trends of biodiversity, species diversity, species abundance, species relevant for the delivery of ecosystem services, environmental pressures, resource use, emission levels, etc. This is necessary for identifying where problems are most pressing, what to protect, and which pressures are causing biodiversity decline. It is also necessary for raising awareness at the beginning of the policy cycle and for assessing policy success or failure at the end of the policy cycle.
Secondly, for preparing effective policies, policy analysts and policymakers need understanding of the trade-offs and synergies between the multiple effects of their policies. How is biodiversity impacted by changes in land use, resource exploitation or emissions and how do ecosystem services depend on biodiversity? Knowing this, they can assess whether the net benefits of conserving land for biodiversity outweigh those of converting land to other uses (e.g. agriculture), especially if externalities across space and time and social aspects are properly included.
Finally, for ex ante analysis of policy plans, questions relate to where to locate protected areas or how effective or efficient are expenses incurred to demarcate/designate protected areas. For this, policy analysists would also like to learn how the behaviour of people changes with policies aimed at promoting sustainable biodiversity use or punishing or prohibiting behaviour that damages biodiversity. This covers a broad range of possible industrial policies, especially on forestry, agricultural and fisheries, as well as those that promote ecosystem services, mitigating climate change and managing water. All these can be done through a range of standard policy instruments including subsidies, taxes, and regulations.
Table 2: Policy categories related to biodiversity-related policy questions
1. STATUS AND TRENDS 2. TRADE-OFFS AND
SYNERGIES 3. EFFECTS OF POLICIES AND INSTRUMENTS
A. PROTECT
BIODIVERSITY What are trends of species, habitats and ecosystems? What are trade-offs and synergies between biodiversity and protection measures; which species/ecosystems benefit or lose from conservation measures?
How do hotspot areas affect biodiversity, are of protection expenses effective, and what effects does biodiversity offsetting have? B. SUSTAIN SUPPLY OF ECOSYSTEM SERVICES AND BUILD ECOSYSTEM RESILIENCE
What are trends in species affecting ecosystem services, such as bee populations, insects for pest control, soil biodiversity, charismatic species and eco-tourism habitats?
What are trade-offs and synergies between biodiversity, land-use intensity and
ecosystem services delivery and use?
What are externalities of loss of resilience over space and time?
What are effects of land use, forestry, agricultural, and fisheries regulating and stimulating policies?
What is the effect of payments for the use or protection of services (PES))?1
C. STIMULATE SUSTAINABLE USE OF BIODIVERSITY
What are trends in indicator species that are affected by pollution, overexploitation or land-use change?
What are trends in resource use rates and emissions to soil, air and water>
What are trade-offs and synergies between biodiversity and resource use / emissions / environmental quality? What are externalities of sustainable and unsustainable resource use over space and time?
What are the effects of industrial, climate, water, or nitrogen policies?
What is the effect of payments for damages caused to ecosystem services (PES)*
1 PES policies can be part of policy category B and C. Under policy category B, they stimulate biodiversity enhancing behaviour, whereas under category C they punish biodiversity damaging behaviour.
A broad range of accounts can be useful for answering the above questions; accounts from the System of National Accounts, natural capital accounts from the SEEA-CF and ecosystem accounts from the SEEA-EEA (see Box 1). Those unfamiliar with natural capital accounting will almost certainly not understand which accounts are relevant for their situation or where to start applying natural capital accounts to biodiversity-related policies. To address this, Table 3 shows which accounts are useful for which policy questions and which policy categories. This overview is not necessarily complete, but provides an overview of the main biodiversity-related policy questions. For status and trends, the key accounts are those on biodiversity, ecosystem extent, land use and
land cover. Box 2 explains in more detail which accounts can be distinguished for tracking changes
in biodiversity. Other accounts are also useful for signalling whether rates of resource use exceed regeneration rates. In this, the supply and use tables of resources such as energy, water, materials and ecosystem services are important, as are the waste and emissions accounts that show the hazardous substances released to air, water and soil and the amounts of waste dumped into the environment. Finally, the monetary environmental activity accounts and the information from the
System of National Accounts are relevant for estimating resource efficiency, i.e. to calculate
whether more or fewer resources are used or waste is produced to generate a certain economic return. Chapter 4 discusses which countries are currently experimenting with these accounts. Box 2: Accounting for changes in biodiversity
Biodiversity has many dimensions and there is no single indicator that captures all of them. The CBD agreed that the state of biodiversity can be measured using trends for four indicators (UN et al., 2014b): a) extent of selected ecosystems, b) abundance and distribution of selected species, c) status of threatened species and d) genetic diversity. Information on the basic steps and choices necessary for producing accounts for these indicators is given in the SEEA-EEA (UN et al., 2014b), guidelines by UNEP-WCMC (2015, 2016) and SEEA-EEA Technical Recommendations (UN, 2017). Indicators for biodiversity accounting have also been explored in general by Garnåsjordet et al. (2012) and by Remme et al. (2016).
The basis of the ecosystem extent accounts are the land cover accounts, supplemented with a range of data on various ecosystem characteristics. So far, there is no internationally accepted classification for ecosystem types and the SEEA-EEA Technical Recommendations (UN, 2017) shows a basic set of nine (9) ecosystem types. It is almost certain that for policy or management applications of biodiversity accounts more detailed classifications of ecosystems will be required. For example, Conservation International et al. (2016) had 17, Eigenraam et al. (2013) 23 and Keith et al. (2017) 47.
For preparing species accounts, species can be grouped by taxonomy (e.g. mammals, birds, insects), species extinction risk as per the IUCN species status classifications or national counterparts or other characteristics (e.g. distribution area, reproductive strategy). A key finding of Bond and Vardon (2018) was that species accounts needed to show more than just conservation status and that groupings of species by endemic/non-endemic or specialist/generalist were useful.
What dimensions are useful to show within species accounts depends very much on the policy question. This also includes choices regarding spatial unit size and aggregation, measurement approaches (e.g. remote sensing data, measures on the ground, or both) and classifications. For example, if species accounts are used for conservation purposes, UNEP-WCMC (2016) recommends setting up accounts for threatened species, endemic species, migratory species or phylogenetically unique species. For accounts to monitor ecosystem services, it is advised to set up accounts for species that deliver direct use benefits (e.g. for consumption, recreation, or that are culturally or socially important) or for species that provide indirect use benefits (e.g. pollination, water purification, carbon sequestration, hazard protection, pest control, soil formation). Finally, for analysing ecosystem condition, it is advised to use accounts considering keystone species and species groups that are important for ecosystem functioning (e.g. nitrogen fixing plants, herbivores, predators), which help to signal unsustainable use of biodiversity.
Data availability is one of the major barriers to setting up biodiversity accounts, especially for species accounts. Land-use and land-cover accounts can be reasonably well compiled based on remote sensing data. Combined with modelling or detailed sampling data, ecosystem-extent accounts can be made. However, for species accounts, spatially explicit species data are needed at a resolution that is suitable for management, is temporally relevant, and comparable to a defined reference condition (UNEP-WCMC, 2015). Few species have such data available, and it often requires years and many volunteers to collect such data (see e.g. Bond and Vardon, 2018). For accounts on species abundance, primary data availability may be particularly problematic. For that reason, Schipper et al. (2017) experimented with the use of GLOBIO model data of the Mean Species Abundance indicator to set up mean species abundance accounts for Mexico.
Trade-offs and synergies pertain policy questions relating to the dependency of biodiversity on different land uses and the dependency of human activity and wellbeing on biodiversity—i.e. the natural resources (e.g. timber, fish, medicines) and ecosystem services biodiversity provides. For this, data from the biodiversity accounts are related to data from several of the SEEA-CF and -EEA accounts, depending on the specific question. For example, biodiversity data may be compared with data from the land-use/land-cover accounts to learn how different land uses and land management activities affect biodiversity and from the monetary environmental activity accounts to assess the effectiveness of environmental management expenditure. For the reverse case, of economic activity dependant on biodiversity, the natural resource and ecosystem service accounts are key, showing how agricultural, timber and fish production as well as water quality and
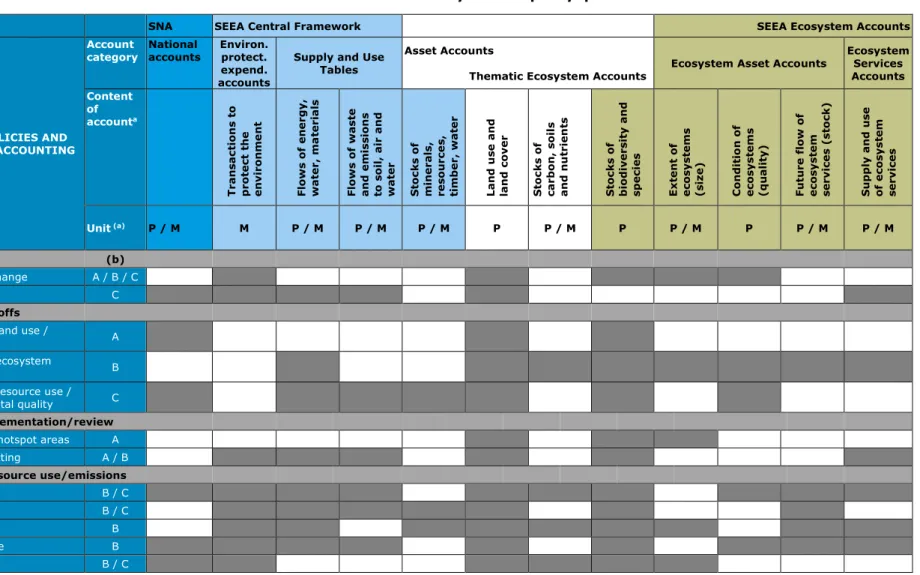
Table 3: Overview of SEEA-CF or -EEA accounts that are useful for biodiversity-related policy questions. *
Notes: * The black cells show which accounts can be applied for answering the respective policy questions. The white cells indicate that the accounts do not provide relevant information for that policy question. The accounts coloured green and blue are covered both in the SEEA-CF and SEEA-EEA. a) P = in physical terms, M = in monetary terms; b) A = Policies to protect biodiversity, B = Policies to sustain supply of ecosystem services and build resilient ecosystems, C = Policies to stimulate sustainable use of ecosystem services.
SNA SEEA Central Framework SEEA Ecosystem Accounts
BIODIVERSITY POLICIES AND NATURAL CAPITAL ACCOUNTING
Account
category National accounts Environ. protect. expend. accounts
Supply and Use Tables
Asset Accounts
Thematic Ecosystem Accounts Ecosystem Asset Accounts
Ecosystem Services Accounts Content of accounta T ra n sa ct io n s t o p ro te ct t h e env ir o nm e nt Flow s of e n er gy , w at er, m a te ria ls Flow s of w as te an d e m is sion s to s oil, a ir a n d w at er S to ck s o f m in era ls , re sou rc e s, tim b er, w at er La n d u se a n d la n d c ov er S to ck s o f ca rb on , s oil s and n u tr ie n ts S to ck s o f b iod iv ers it y a n d spec ies E xt en t o f ec o sy st em s (s iz e) C on d it io n of ec o sy st em s (q u alit y) Fu tu re f low of ec o sy st em se rv ic es ( st o ck ) S u ppl y a n d u se o f e co sy st em se rv ic es Unit (a) P / M M P / M P / M P / M P P / M P P / M P P / M P / M
Status and trends (b)
Biodiversity / species change A / B / C
Resource efficiency C
Synergies and trade-offs
Relation biodiversity – land use /
protection A
Relation biodiversity – ecosystem
services use B
Relation biodiversity – resource use /
emissions / environmental quality C
Policy response/implementation/review
Determine and protect hotspot areas A
PES / biodiversity offsetting A / B
Policies to restrict resource use/emissions
- Nitrogen policy B / C
- Water policy B / C
- Forestry policy B
- Sustainable agriculture B
The effects of biodiversity-related policy instruments also can be investigated via accounts. As will be shown in Section 4, not many countries use the accounts for these purposes. For example, for selecting hotspot areas, spatially explicit biodiversity accounts, ecosystem extent and condition
accounts and land-use accounts are useful, showing areas suitable for protection. Furthermore, two
widely used economic instruments to protect biodiversity are Payments for Ecosystem Services (PES) and Biodiversity Offsetting and accounts can be used to analyse the impacts of such policy instruments. Here, the land-use/land-cover and biodiversity accounts are key, along with the
ecosystem services accounts that relate resource use or emissions to biodiversity impacts. The environmental activity accounts track the financial or budgetary consequences of such
programmes. Finally, a broad range of policy instruments exists that regulate particular resource uses or polluting activities with the objective of reducing negative impacts to the environment or stimulating positive impacts. For this, biodiversity accounts and land-use/land-cover accounts are key. These are supplemented with supply and use tables, asset accounts, ecosystem services
accounts, and the environmental protection expenditure accounts, depending on the activity or
sector on which they focus. For example, for policies on reducing nitrogen deposition, information is needed from the energy (fuel mix), emissions, agricultural and land-use accounts.
3.2
Relevant analytical methods
To analyse the policy questions (Tables 2 and 3), policy analysists can choose from a broad set of approaches. The three types of policy questions identified—status and trend, synergies and trade-offs, and policy effects—each require different approaches. In general, the analysis of policy effects is analytically much more demanding than the analysis of status and trends. Table 4 shows which types of analysis may be useful for which questions.
For analysing status and trends of biodiversity change and resource efficiency, numerous indicators can be directly taken from the accounts (Annex 1). This may include international reporting
obligations about biodiversity, specific species or habitats, or about biodiversity protection expenditure. Similarly, resource efficiency indicators can directly be computed from the economic data in the System of National Accounts and the information on biodiversity in the natural capital accounts. Regression analysis can be used to trace trends in resource efficiency or supply of ecosystem services and relate this to trends in biodiversity change.
More detailed regression or econometric analysis can provide evidence about synergies and trade-offs between biodiversity on the one hand and land use, ecosystem services supply, resource use and ecosystem conditions on the other. For instance, the accounts provide the necessary data to estimate causal relationships between:
• biodiversity status and budgetary expenditures, • biodiversity status and land-use intensity, • fruit production and pollination services, • soil biodiversity and net primary production, • land cover and carbon sequestration,
• water use efficiency and ecosystem conditions, or
• economic growth, sectoral energy use and carbon emissions.
As will be discussed in the next section, there are only few examples of countries using the
accounts for these purposes so far. Yet, they are very suitable for these purposes. The consistency of the accounts—in terms of economic sector, ecosystem categories, or spatial boundaries— enables analysts to take data from multiple accounts. This is not usually possible with data taken from multiple data sources that use different concepts, sources and methods.
Ecosystem Services, biodiversity offsetting or expanding protecting areas—costs, biodiversity impacts and economic development impacts can be estimated from the accounts. Similarly, for ex ante policy assessments, bio-economic models can be applied that use information from the accounts as input.
Several modelling approaches use the natural capital accounts, often in the form of a Social Accounting Matrix, to calibrate the model. An example includes the Integrated Environmental-Economic Model (IEEM) (Banerjee et al., 2016). Other approaches, can use information from the natural capital accounts for estimating functions that relate, for example, land use to species abundance or economic development to ecosystem conditions. Many of these approaches can also be used to explore future scenarios of change, cost-benefit analysis of future investments, or assessing impacts of biodiversity-related policies.
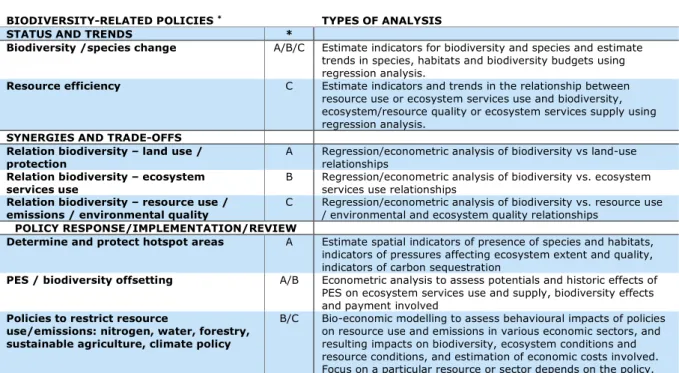
Table 4: Overview of analytical approaches
BIODIVERSITY-RELATED POLICIES * TYPES OF ANALYSIS
STATUS AND TRENDS *
Biodiversity /species change A/B/C Estimate indicators for biodiversity and species and estimate
trends in species, habitats and biodiversity budgets using regression analysis.
Resource efficiency C Estimate indicators and trends in the relationship between
resource use or ecosystem services use and biodiversity, ecosystem/resource quality or ecosystem services supply using regression analysis.
SYNERGIES AND TRADE-OFFS
Relation biodiversity – land use /
protection A Regression/econometric analysis of biodiversity vs land-use relationships
Relation biodiversity – ecosystem
services use B Regression/econometric analysis of biodiversity vs. ecosystem services use relationships Relation biodiversity – resource use /
emissions / environmental quality C Regression/econometric analysis of biodiversity vs. resource use / environmental and ecosystem quality relationships
POLICY RESPONSE/IMPLEMENTATION/REVIEW
Determine and protect hotspot areas A Estimate spatial indicators of presence of species and habitats,
indicators of pressures affecting ecosystem extent and quality, indicators of carbon sequestration
PES / biodiversity offsetting A/B Econometric analysis to assess potentials and historic effects of
PES on ecosystem services use and supply, biodiversity effects and payment involved
Policies to restrict resource
use/emissions: nitrogen, water, forestry, sustainable agriculture, climate policy
B/C Bio-economic modelling to assess behavioural impacts of policies on resource use and emissions in various economic sectors, and resulting impacts on biodiversity, ecosystem conditions and resource conditions, and estimation of economic costs involved. Focus on a particular resource or sector depends on the policy. Note: * Policy categories: A = related to biodiversity protection; B = related to sustaining supply of ecosystem services and to building resilient ecosystems; C = related to stimulating sustainable use of ecosystem services.
4 Experiences with NCA for biodiversity-related
policy-making
This section briefly outlines the current situation of compilation and use of biodiversity-related accounts. A global assessment of environmental economic accounting (UNCEEA, 2018) concluded that the number of countries experimenting with ecosystem accounts remains limited. About 14 countries officially compile SEEA-EEA accounts or modules. However, about 40 countries are experimenting with the SEEA-EEA accounts, often on a subnational level or not by national statistical agencies. A group of countries is also planning to initiate ecosystem services accounts. Many more countries compile accounts from the SEEA-CF but developed and developing countries focus on different areas. Developing countries focus on energy, water, environmental protection expenditures, timber and land accounts, whereas the developed countries focus on energy, material flow, and environmental taxes and subsidy accounts.
Table 5 lists examples of countries experimenting with the SEEA experimental ecosystem
accounts.2 The table shows that experience is growing but that, so far, the accounts have not been
used to their full potential. This is understandable given that the ecosystem accounting guidelines are still very recent (see Text boxes 1 and 2).
Among the countries that already use ecosystem accounts for policy are: • Mexico that uses it for monitoring purposes;
• Peru that applies the accounts for assessing the economy-wide effects of ecosystem degradation and;
• The Philippines that use their ecosystem accounts for assessing the importance of its mangroves for, among other things, coastal protection and fisheries (Table 5).
The Peruvian example is interesting as the species, ecosystem extent, ecosystem condition and ecosystem services supply and use tables for the area of San Martin in Peru show equity issues associated with access to resources, impacts of degradation and trends of threatened species and of sustainable ecosystem use (Conservation International, 2016; Portela et al., 2018; UNEP-WCMC, 2016). Indicators from these tables are deemed critically important for biodiversity conservation and sustainable water use, allowing for more holistic resource management, enabling improved monitoring and policy implementation. Importantly, the accounts were produced to make explicit the importance of natural capital to the economy.
In Australia, ecosystem accounting was used in: the Central Highlands of Victoria to assess the economic and ecological impacts of conserving versus those of exploiting the area (Keith et al., 2017); in the Great Barrier Reef region to assess the relationship between the environmental condition of the area and economic and other benefits (ABS, 2015, 2017); and for informing the public about the status and trends of environmental change in the State of the Environment Report of the Australian Capital Territory (Smith et al., 2017).
In other countries, such as South Africa, produced ecosystem extent accounts are used for spatial planning purposes, for example, for locating new protected areas and for identifying strategic water source areas (Driver et al., 2015). This experience shows that the accounts allow for more holistic and integrated land-use planning, that better consider biodiversity and the impacts of land-use management on biodiversity. The United Kingdom uses the ecosystem accounts to monitor changes in ecosystem services supplied and, so far, they have dedicated studies for protected
areas as well as for particular ecosystems (farmland, fresh water and woodland) and for urban areas.
As the examples of Australia, Peru, the Philippines, South Africa and the United Kingdom show, several of the policy applications are at the subnational level. Also notable is that in some cases the policy applications are performed outside of the statistical offices and government agencies. Many of the ecosystem accounts currently produced are experimental, with the objective to gain experience with the SEEA-EEA guidelines and not yet with a clear policy use in mind. This refers to the search for classifications of ecosystem, land cover or species, for indicators and units, the spatial and temporal scales that are relevant for policy-making and data sources that are practical and trustworthy. In this way, experience is gained with setting up accounts for species, ecosystem extent, ecosystem condition and ecosystem services.
For instance, the ecosystem accounts in Uganda show that by overlaying information on land-use decisions from the ecosystem extent accounts and information from the species accounts, entry points can be identified for biodiversity protection and eco-tourism policies in Uganda (UNEP-WCMC and IDEEA, 2017). The Mexican ecosystem extent, ecosystem condition and ecosystem services accounts provide information about soil and vegetation, at different points in time and at different spatial scales—nationwide, state-wide, municipal and special studies for Natural Protected Areas and Ramsar Sites. For ecosystem condition accounts, they focus on the ‘priority components’ soil, water, carbon and biodiversity. For biodiversity, they use an Ecological Integrity Index that measures the importance of the existence, protection and conservation of biodiversity, as well as the consequences of its decline or disappearance. Next, they present supply-and-use tables of ecosystem services in physical units and hybrid tables and experiment with tables in monetary terms, showing the relationship between ecosystems and the economy. Furthermore, Bond and Vardon (2018) set up butterfly accounts to experiment with alternative species classifications and spatial categories.
In addition, the European Commission pushes the member states to set up natural capital and ecosystem services accounts. Several experiments are being undertaken to set up ecosystem accounts, such as the ecosystem services, carbon and biodiversity accounts by Statistics
Netherlands (yet to be published), to set up EU wide species accounts (UNEP-WCMC, 2017) or to set up monetary and physical ecosystem services supply-and-use tables for pollination and outdoor recreation (Vallecillo et al., 2018).
Table 5 shows that many countries use the SEEA Central Framework accounts for biodiversity-related questions. Among the most popular accounts are the land, water, forest and mineral accounts. Among other things, they are used for assessing whether water, land or forest management practices are conducive to sustainable growth and resilience. In Sweden, the land accounts are used to identify which landowners are responsible for biodiversity management on a specific plot, while in Botswana water accounts have been used to assess the water needs of wildlife on which a large tourism industry relies (Vardon et al., 2017b). Indonesia has used natural capital accounting in their medium-term development plan, which is committed to sustainable development and Indonesia’s green growth trajectory. In this, the natural capital accounts are linked to a number of socio-economic issues, including forest resource management, water use, food production and security, and environmental degradation.
Several countries also integrate biodiversity more in the environmental protection expenditure accounts (EPEA) and in the environmental goods and services sector (EGSS). This includes France, Germany and Sweden. Sweden is working on environmental protection expenditure accounts and accounts of environmentally motivated subsidies with specific breakdowns for biodiversity and landscape. Sweden has also published land accounts that connect statistics on land use with economic actors and that can be used for analysing investments done in the agricultural sector.3
3 See http://www.scb.se/mi1302-en and
area/environment/environmental-accounts-and-sustainable-development/system-of-environmental-and-economic-These breakdowns also help to learn more about the importance of the environment and ecosystems for the wider economy. France, for example, uses their accounts for a new wealth indicator, that goes beyond GDP (Service d’information du Gouvernement, 2017).
These examples show that monitoring and trend analysis are among the first policy uses of
biodiversity-related accounts. This may be monitoring threatened species or changes in ecosystem extent or condition. It may also be related to changes in land use or in water or forest
management, both of which relate to economic activities having negative impacts on biodiversity. Table 5 shows that only few countries use the accounts for monitoring how changes in the
biodiversity affect the supply of ecosystem services. Moreover, the examples in Table 5 show that only a few countries use the accounts for the more data demanding policy questions, such as showing the economic importance of biodiversity, evaluating the impacts of economic activity on biodiversity, analysing impacts of different policy options using modelling or scenario exercises. For this type of use to gain momentum, more countries need to compile the accounts, for longer timeframes, along with developing the expertise for analysing them.
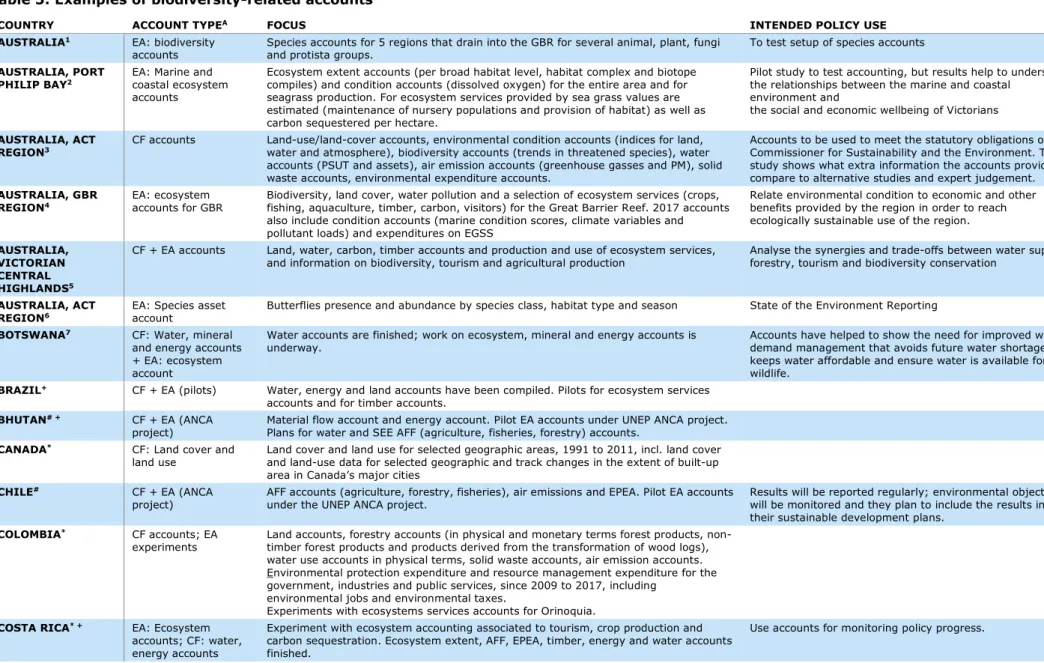
Table 5: Examples of biodiversity-related accounts
COUNTRY ACCOUNT TYPEA FOCUS INTENDED POLICY USE
AUSTRALIA1 EA: biodiversity
accounts Species accounts for 5 regions that drain into the GBR for several animal, plant, fungi and protista groups. To test setup of species accounts AUSTRALIA, PORT
PHILIP BAY2 EA: Marine and coastal ecosystem
accounts
Ecosystem extent accounts (per broad habitat level, habitat complex and biotope compiles) and condition accounts (dissolved oxygen) for the entire area and for seagrass production. For ecosystem services provided by sea grass values are estimated (maintenance of nursery populations and provision of habitat) as well as carbon sequestered per hectare.
Pilot study to test accounting, but results help to understand the relationships between the marine and coastal
environment and
the social and economic wellbeing of Victorians AUSTRALIA, ACT
REGION3 CF accounts Land-use/land-cover accounts, environmental condition accounts (indices for land, water and atmosphere), biodiversity accounts (trends in threatened species), water
accounts (PSUT and assets), air emission accounts (greenhouse gasses and PM), solid waste accounts, environmental expenditure accounts.
Accounts to be used to meet the statutory obligations of the Commissioner for Sustainability and the Environment. The study shows what extra information the accounts provide, compare to alternative studies and expert judgement. AUSTRALIA, GBR
REGION4 EA: ecosystem accounts for GBR Biodiversity, land cover, water pollution and a selection of ecosystem services (crops, fishing, aquaculture, timber, carbon, visitors) for the Great Barrier Reef. 2017 accounts
also include condition accounts (marine condition scores, climate variables and pollutant loads) and expenditures on EGSS
Relate environmental condition to economic and other benefits provided by the region in order to reach ecologically sustainable use of the region. AUSTRALIA,
VICTORIAN CENTRAL
HIGHLANDS5
CF + EA accounts Land, water, carbon, timber accounts and production and use of ecosystem services,
and information on biodiversity, tourism and agricultural production Analyse the synergies and trade-offs between water supply, forestry, tourism and biodiversity conservation AUSTRALIA, ACT
REGION6 EA: Species asset account Butterflies presence and abundance by species class, habitat type and season State of the Environment Reporting
BOTSWANA7 CF: Water, mineral
and energy accounts + EA: ecosystem account
Water accounts are finished; work on ecosystem, mineral and energy accounts is
underway. Accounts have helped to show the need for improved water demand management that avoids future water shortages, keeps water affordable and ensure water is available for wildlife.
BRAZIL+ CF + EA (pilots) Water, energy and land accounts have been compiled. Pilots for ecosystem services
accounts and for timber accounts.
BHUTAN# + CF + EA (ANCA
project) Material flow account and energy account. Pilot EA accounts under UNEP ANCA project. Plans for water and SEE AFF (agriculture, fisheries, forestry) accounts.
CANADA* CF: Land cover and
land use Land cover and land use for selected geographic areas, 1991 to 2011, incl. land cover and land-use data for selected geographic and track changes in the extent of built-up area in Canada’s major cities
CHILE# CF + EA (ANCA
project) AFF accounts (agriculture, forestry, fisheries), air emissions and EPEA. Pilot EA accounts under the UNEP ANCA project. Results will be reported regularly; environmental objectives will be monitored and they plan to include the results in their sustainable development plans.
COLOMBIA* CF accounts; EA
experiments Land accounts, forestry accounts (in physical and monetary terms forest products, non-timber forest products and products derived from the transformation of wood logs), water use accounts in physical terms, solid waste accounts, air emission accounts. Environmental protection expenditure and resource management expenditure for the government, industries and public services, since 2009 to 2017, including
environmental jobs and environmental taxes.
Experiments with ecosystems services accounts for Orinoquia.
COSTA RICA* + EA: Ecosystem
accounts; CF: water, energy accounts
Experiment with ecosystem accounting associated to tourism, crop production and carbon sequestration. Ecosystem extent, AFF, EPEA, timber, energy and water accounts finished.
COUNTRY ACCOUNT TYPEA FOCUS INTENDED POLICY USE
EUROPEAN UNION8 EA: accounts for
pollination and outdoor recreation
Experimental accounts at the EU level, currently focusing on outdoor recreation and
crop pollination, looking at service potential, demand and use in a spatially explicit way. Test how to set up these accounts, and how they differ per type of account
FRANCE* CF: Environmental
protection
expenditure accounts; Forest accounts
Focus on biodiversity in the environmental protection expenditure accounts; Forest
accounts Used for calculating a new indicator on wealth: the artificialised land ratio
GERMANY* CF: Environmental protection expenditure accounts, environmental goods and services; EA experiments
EPEA shows expenditure concerning ‘Protection of biodiversity and landscape’ (CEPA 6). Environmental goods and services sector (EGSS) with data on turnover, exports, gross value added and employment of corporations—except corporations of the agricultural sector—concerning protection of biodiversity and landscape (CEPA 6). Experiments with ecosystems and ecosystem services accounts.
GUATEMALA9 CF accounts Forest, water, fisheries, subsoil resources (hydro carbons, metallic, minerals,
non-metallic minerals) Accounts are used in modelling studies with IEEM, dealing with forestry and the SDGs.
INDIA+ CF + EA (pilots) Land, water, minerals, forest (asset) accounts of the SEEA-CF and pilot projects with
ecosystem accounts
INDONESIA10 + CF (SISNERLING) SISNERLING contains timber, energy and mineral resources asset accounts,
land-use/land-cover accounts in Sumatra and Kalimantan, water accounts for a watershed in Java, and EPEA/EGSS statistics. Currently work on land and water accounts.
Experiment with account for peatlands,
Uses accounts in its medium-term development plan
NETHERLANDS, LIMBURG PROVINCE11
EA for broad selection of ecosystem services and ecosystem condition and extent accounts
Physical supply of ecosystem services (crops, fodder, meat, groundwater, PM10 capture, carbon sequestration, recreation, nature tourism), ecosystem condition accounts, and monetary supply and use tables of ecosystem services.
Monitor interdependencies between ecosystems and economic activities
NETHERLANDS12 EA for broad selection
of ecosystem services and ecosystem condition and extent accounts
Biodiversity and condition accounts, monetary accounts for the EGSS and EPEA
containing information on expenditures related to biodiversity and landscape protection Test setup and usefulness of classifications
MAURITIUS# + CF + EA (pilots under
the ANCA project) Material flow, water, energy and air emission accounts. Within the ANCA project, they pilot ecosystem accounts on ecosystem extent, ecosystem condition, water and biodiversity.
MEXICO13 EA: Biodiversity
account and ecosystem extent account
Ecosystem extent per ecosystem type and mean species abundance per ecosystem
type Test applicability of the GLOBIO model for preparing species abundance accounts
MEXICO* EA: extent, condition
and ecosystem services accounts.
Land account and ecosystem extent (coverage of soil and vegetation and changes over time for several scales); Condition accounts (for soil, water, carbon and biodiversity, and an ecological integrity index); Supply and use accounts of ecosystem services (in physical units, hybrid tables and experiments with valuation)
Obtain indicators for monitoring changes in biodiversity and ecosystem services
COUNTRY ACCOUNT TYPEA FOCUS INTENDED POLICY USE
the status and trends of threatened species, as well as the status of ecosystems.
PHILIPPINES15 CF + EA: Minerals and
ecosystem services accounts
Mineral accounts to learn about the value of subsoil assets; mangrove accounts and ecosystem and water accounts for the Laguna Lake basin to learn about the value of ecosystem services.
Mangrove accounts help the policy dialogue on the benefits of mangroves for coastal zone protection, disaster risk management, fisheries and tourism.
P.R. CHINA+% CF + EA (pilot) Natural resources balance sheets on land, forestry, water and mineral resources
(equivalent to the SEEA-CF asset account). Pilots in eight areas from 2015–2016, and currently expanded to the national level. Currently piloting ecosystem accounts in 2 pilot provinces, Guangxi and Guizhou, for 6 ecosystem types (agricultural land, forest, grassland, inland water ecosystem, urban, marine). To be completed by 2020.
Energy accounts have their highest policy priority. Their main policy drive is on eco-compensation and ‘ecological civilisation’ for sustainable development.
RWANDA9 CF: Water and land
accounts Water and land accounts in Rwanda Land accounts used for improving resource management.
SOUTH AFRICA16 EA: Land and
ecosystem extent accounts
Land cover accounts, ecosystem extent accounts and land accounts Test setup of these accounts and search for useful classifications. Showed that land cover not always corresponds with ecosystem unit.
SOUTH AFRICA17 EA: River extent and
condition accounts Extent accounts and condition accounts for South Africa’s river ecosystems. Condition accounts showing the degree of modification using an aggregate ecological condition category and an ecological condition index. Extent accounts based on length of the river network, per river and river type.
Test the setup of the accounts (classifications and scale) and their use for monitoring and trend analysis of ecosystem conditions.
SWEDEN18 CF: Land accounts Link land ownership to habitat type To be used to define actors whose actions impact
biodiversity and identify who is responsible for biodiversity management on each piece of land
SWEDEN19 CF: Monetary
environmental protection accounts
Environmental protection expenditure accounts—specific breakdowns available for biodiversity and landscape expenditures since 2016; Environmentally motivated subsidies for the period 2000–2017.
For monitoring expenditures and subsidies.
SWEDEN20 EA: Land accounts
including some ecosystem services and biodiversity
Land accounts by industry and experiments with ecosystem accounts (sequestration,
blueberry production) and biodiversity accounts (groups of organisms per habitat) Test the possibilities to setup the accounts
UGANDA21 EA: Ecosystem and
biodiversity accounts Land cover, ecosystem extent, 3 NTFPs, Chimpanzees, Elephants Provide insight in state and trends in ecosystems and biodiversity in Uganda
UNITED KINGDOM22 EA: Ecosystem
accounts for protected areas
Extent and condition accounts of 6 pilot areas, physical and monetary ecosystem services flow accounts (crops, livestock, wild foods, drinking water, timber, energy, air quality, flood protection, climate regulation, recreation, aesthetic). Condition accounts contain biomass/carbon, biodiversity (butterfly abundance and richness), accessibility (trail length, tranquillity) and conservation status (sites of favourable special scientific interest). Also studies available on land cover, land use and carbon stocks.
Test setup of the accounts (classifications and scale) and their use for monitoring, trend analysis, identifying hotspot areas and decision-support tools.
UNITED KINGDOM23 CF: UK Natural
Capital Accounts Ecosystem services accounts for the period 1997–2015 in physical and monetary terms, including energy (renewable and non-renewable), minerals, timber, crops, fish, water, air filtration, sequestration, recreation.
Test the setup of the accounts and monitor changes in ecosystem services
UNITED KINGDOM24 EA: Ecosystem
accounts for farmland, freshwater and woodland
Ecosystem extent account, condition account, physical and monetary ecosystem services accounts and value of future flow of ecosystem services. Ecosystem services include crops, water, fish, timber, hydro and solar, peat, sequestration, air pollutant removal, recreation, and education.
Test the setup of the accounts and monitor changes in ecosystem services
UNITED KINGDOM25 EA: Ecosystem
accounts for urban areas
Ecosystem extent (for various classifications), condition (favourable/ unfavourable;
COUNTRY ACCOUNT TYPEA FOCUS INTENDED POLICY USE
timber, sequestration, air filtration, noise regulation, urban cooling, recreation, aesthetic interactions, physical health) for urban areas.
VIETNAM# CF + EA (within ANCA
project) One-time compilation of material flow and timber account. One-time pilot project with ecosystem services supply. Part of ANCA project.
ZAMBIA* Water accounts Physical and monetary supply and use tables for water. Preliminary forest accounts are
being finalised Accounts to be used for assessing whether water management practices are conducive to sustainable and resilient growth
Note: A) CF = from SEEA Central Framework, EA = from SEEA-EEA.
Note on sources: The information in this table was compiled by the authors based on the survey sent to countries and literature reviewed. * From own survey; + from UNCEEA (2018); % from personal communication with UNSD; # from ANCA project – http://www.teebweb.org/areas-of-work/advancing-natural-capital-accounting/; 1) Bond et al., 2013; 2) Eigenraam et al., 2016; 3) Smith et al., 2017; 4) ABS, 2015, 2017; 5) Keith et al. 2017; 6) Bond and Vardon, 2018; 7) Department of Water Affairs, 2017; 8) Vallecillo et al., 2018; 9) from WAVES Partnership website; 10) WAVES Partnership, 2017; 11) De Jong et al., 2016; 12) Statistics Netherlands, to be published; 13) Schipper et al., 2017; 14) Conservation International, 2016; 15) WAVES Partnership, 2016; 16) Driver et al., 2015; 17) Nel and Driver, 2015; 18) Steinbach and Palm, 2014; 19) www.scb.se; 20) Statistics Sweden, 2017; 21) UNEP-WCMD & IDEEA, 2017; 22) White et al., 2015; 23) ONS, 2017a; 24) ONS, 2017b; 25) ONS, 2018.
Two final observations are that, the examples show that most countries are not yet at the stage where SEEA-related issues can be referenced explicitly in legislation or biodiversity strategies; they may currently be used for that, but not very visibly. Furthermore, less attention seems to be paid to species abundance accounts and, to our knowledge, no attempts have been made to generate genetic diversity accounts. For this information to find their way in policy, more experimental accounts are needed. Species abundance accounts may be especially important if overall biodiversity change is to be monitored more carefully.