DECARBONISATION OPTIONS
FOR LARGE VOLUME ORGANIC
CHEMICALS PRODUCTION,
LYONDELLBASELL ROTTERDAM
Charlotte Yong, Andrew Keys
18 January 2021Decarbonisation options for Large Volume Organic Chemicals Production, LyondellBasell Rotterdam
© PBL Netherlands Environmental Assessment Agency; © TNO The Hague, 2021
PBL publication number: 4533
TNO project no. 060.33956 / TNO 2020 P11920
Authors
Yong, C.M.F and Keys, A.
MIDDEN project coordination and responsibility
The MIDDEN project (Manufacturing Industry Decarbonisation Data Exchange Network) was initiated and is also coordinated and funded by PBL and ECN part of TNO (which is named TNO Energy Transition after 1-1-2020). The project aims to support industry, policymakers, analysts, and the energy sector in their common efforts to achieve deep decarbonisation. Correspondence regarding the project may be addressed to:
D. van Dam (PBL), Dick.vanDam@pbl.nl, or S. Gamboa Palacios (TNO), silvana.gamboa@tno.nl.
This publication is a joint publication by PBL and TNO Energy Transition and can be
downloaded from: www.pbl.nl/en. Parts of this publication may be reproduced, providing the source is stated, in the form: Yong, C. and Keys, A. (2021), Decarbonisation options for large volume organic chemicals production, LyondellBasell Rotterdam. PBL Netherlands
Environmental Assessment Agency and TNO Energy Transition, The Hague.
PBL Netherlands Environmental Assessment Agency is the national institute for strategic policy analysis in the fields of the environment, nature and spatial planning. PBL contributes to improving the quality of political and administrative decision-making by conducting outlook studies, analyses and evaluations in which an integrated approach is considered paramount. Policy relevance is the prime concern in all of PBL’s studies. PBL conducts solicited and unsolicited research that is both independent and scientifically sound.
TNO Energy Transition has a twofold mission: to accelerate the energy transition and to strengthen the competitive position of the Netherlands. TNO conducts independent and internationally leading research and we stand for an agenda-setting, initiating and supporting role for government, industry and NGOs.
The report was offered for review to LyondellBasell but LyondellBasell did not comment on the content of the report. PBL and TNO remain responsible for the content. The decarbonisation options and parameters are explicitly not verified.
Contents
Summary 4
INTRODUCTION
6
Scope 6
1 LYONDELLBASELL IN THE NETHERLANDS
8
1.1 LyondellBasell in the Netherlands 8
1.2 Maasvlakte Site 9
1.3 Botlek Site 10
2 CURRENT PROCESSES & OPERATIONS AT LYONDELLBASELL
13
2.1 Current Processes and Operations at Maasvlakte Site 13
2.2 Current Processes and Operations at Botlek Site 22
3 FEEDSTOCKS, PRODUCTS AND APPLICATIONS
39
3.1 Feedstocks 39
3.2 Products and Applications 41
4 OPTIONS FOR DECARBONISATION
46
4.1 Fuel Substitution for Steam Production 46
4.2 CO2 Capture and Storage or Re-Use 51
4.3 Use of Residual Energy 53
4.4 Feedstock Substitution 54
5 DISCUSSION
57
REFERENCES
60
FINDINGS
Summary
LyondellBasell operates a total of three production sites and one deep-water terminal in the Port of Rotterdam. This report focuses on the Botlek and Maasvlakte sites only. The
production sites have a diverse product portfolio as summarised below:
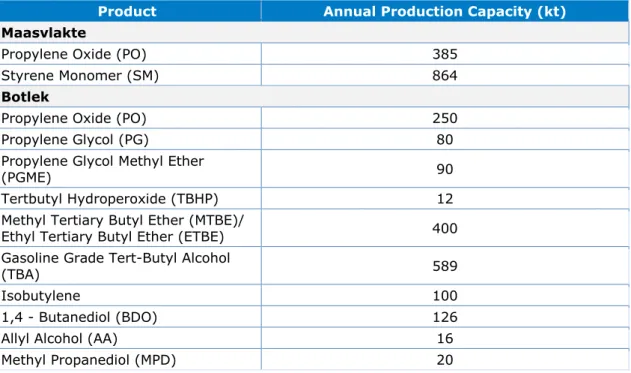
Table 1. Annual production capacity of products in the Maasvlakte and Botlek sites
Product Annual Production Capacity (kt)
Maasvlakte
Propylene Oxide (PO) 385
Styrene Monomer (SM) 864
Botlek
Propylene Oxide (PO) 250
Propylene Glycol (PG) 80
Propylene Glycol Methyl Ether
(PGME) 90
Tertbutyl Hydroperoxide (TBHP) 12
Methyl Tertiary Butyl Ether (MTBE)/
Ethyl Tertiary Butyl Ether (ETBE) 400
Gasoline Grade Tert-Butyl Alcohol
(TBA) 589
Isobutylene 100
1,4 - Butanediol (BDO) 126
Allyl Alcohol (AA) 16
Methyl Propanediol (MPD) 20
These products are mainly used as intermediate chemicals, of which their derivatives are used for a wide range of applications, such as pharmaceutical products, paints and coatings, packaging materials and as gasoline additives. They are produced through six main chemical processes in Botlek and one main process in Maasvlakte.
The plant-wide integration allows optimised product flows across production processes and operating sites, as well as cascaded steam usage across process units. There is also a high integration between the production sites and the neighbouring utility companies, making scope 2 emissions (indirect emissions for generating electricity, external steam supply, etc.) an important source of emissions. The chemical processes are energy-intensive, primarily in the form of process steam consumption. The overall steam consumption amounts to around 8 PJ per year at each production site. The electricity consumption is calculated to be 0.5 and 0.9 PJ per year and waste fuel consumption are calculated to be 2.6 and 5 PJ per year, respectively, in Maasvlakte and in Botlek. The Maasvlakte and Botlek sites have reported scope 1 emissions (direct emissions of the production plant) of 13 and 327 kt CO2 and
calculated scope 1 and 2 emissions of 416 and 620 kt of CO2, respectively, of which 88% are
accounted for by steam, electricity and waste fuel consumption.
Several decarbonisation opportunities have been identified, in reducing both scope 1 and 2 emissions. The greatest potential is realised through decarbonising the high-temperature steam production. Applicable measures include the utilisation of electrode boilers, hydrogen combustion, (solid) biomass combustion, as well as through post-combustion carbon capture
and storage. Other possible measures include integrated heat pumps in distillation columns. Usage of alternative low-carbon and/or bio-based feedstocks can provide a carbon reduction over the entire value chain, accountable as scope 3 emissions.
FULL RESULTS
Introduction
This report describes the current situation for the Large Volume Organic Chemicals (LVOC) production in the Netherlands and the options and preconditions for its decarbonisation. Specifically, for LyondellBasell. The study is part of the MIDDEN project (Manufacturing Industry Decarbonisation Data Exchange Network). The MIDDEN project aims to support industry, policymakers, analysts, and the energy sector in their common efforts to achieve deep decarbonisation. The MIDDEN project will update and elaborate further on options in the future, in close connection with the industry.
Scope
The Dutch Large Volume Organic Chemicals (LVOC) production is spread across multiple chemical companies and production sites. These are, for example, Shell Moerdijk, Shell Pernis and LyondellBasell.1 The scope of this research will focus on the manufacturing of
LVOC by LyondellBasell at its production sites, in Botlek and Maasvlakte.
The processes covered by this research are:
• Co-production of propylene oxide (PO) and styrene monomer (SM) (including ethylbenzene production through benzene alkylation process)
• Co-production of propylene oxide (PO) and tert butyl alcohol (TBA) (including isomerisation of n-butane)
• Propylene glycol (PG) production through the hydrolysis of propylene oxide (PO) • Production of propylene glycol methyl ether (PGME) from propylene oxide (PO) • Production of 1,4-butanediol (BDO), allyl alcohol & methyl propanediol (MPD) from
propylene oxide (PO)
• Production of isobutylene through dehydration of tert butyl alcohol (TBA)
• Production of methyl tertiary-butyl ether (MTBE)/ ethyl tertiary butyl ether (ETBE) from isobutylene and methanol/ethanol
Products offered by LyondellBasell’s production sites at Botlek and Maasvlakte are:
The main options for decarbonisation include:
• Fuel Substitution - electrode boiler, hydrogen combustion, (solid) biomass combustion • CO2 Capture and Storage or Re-Use – post combustion CO2 capture
1 The corresponding MIDDEN reports can be found on
https://www.pbl.nl/en/publications/decarbonisation-options-for-large-volume-organic-chemicals-production-shell-moerdijk and
https://www.pbl.nl/en/publications/decarbonisation-options-for-large-volume-organic-chemical-production-shell-pernis.
• Propylene Oxide (PO) • Styrene Monomer (SM)
• Propylene Glycol (PG) • Gasoline Grade Tert-Butyl Alcohol (TBA)
• Propylene Glycol Methyl Ether (PGME) • Isobutylene • Tertbutyl Hydroperoxide (TBHP) • Butanediol (BDO) • Methyl Tertiary-Butyl Ether (MTBE) • Allyl Alcohol (AA)
• Use of Residual Energy – Circular Steam Project, integrated heat pump in distillation columns
• Feedstock Substitution – sustainable alternatives for ethylene, propylene and methanol.
Reading guide
Section 1 provides a general introduction to LyondellBasell’s operations in the Netherlands and more specifically, its operations in Botlek and Maasvlakte. Section 2 describes the current situation and processes present at LyondellBasell’s Botlek and Maasvlakte sites. Section 3 describes the relevant feedstocks and products of these processes, while options for decarbonisation are systematically evaluated in Section 4. The feasibility of and
1 LyondellBasell in the
Netherlands
1.1 LyondellBasell in the Netherlands
LyondellBasell is one of the largest chemical companies in the world, with saleable products including chemicals, polymers, fuels, and technologies. As a multinational company, its operations are widespread across the globe with manufacturing facilities in America, Europe and Asia (LyondellBasell, 2020). In the Netherlands, LyondellBasell has in total of three manufacturing facilities and a deep-water terminal (i.e. Europoort Terminal). These operating facilities are all located within the Port of Rotterdam industrial cluster, as shown in Figure 1. Table 2 summarises the three manufacturing sites in terms of their economic impact, site area, employee number and the scope 1 CO2 emissions (direct emissions of the production
plant) as registered with the Dutch Emission Authority (Dutch Emissions Authority, 2020).
Figure 1 Locations of LyondellBasell’s operating sites in Maasvlakte, Europoort, Botlek and Moerdijk, relative to the City of Rotterdam (LyondellBasell, 2014)
Table 2 Site-specific information in terms of site area, employee number, economic impact and CO2 emissions on scope 1 basis (Dutch Emissions Authority, 2020; LyondellBasell, 2020; LyondellBasell, 2020; LyondellBasell, 2020)
Site Registered Name
Site Area (‘103m2) Employee Number Economic Impact (million EUR)2 CO2 Emissions (kt) Botlek Lyondell Chemie Nederland B.V. 480 435 289 327
Maasvlakte Lyondell Bayer Manufacturing
Maasvlakte VOF 600 260 289 13
Moerdijk Basell Benelux B.V. 340 146 45 11
LyondellBasell’s reported emissions only account for 2% of the overall scope 1 emissions from the Dutch chemical industry. However, these emission figures only include the scope 1 emissions, hence there is a significant underestimation of the total CO2 emissions across the
product value chains. LyondellBasell’s strategic location at the Port of Rotterdam industrial cluster allows material and utility sharing between the neighbouring companies, through steam and product pipelines. Many of the required utilities (i.e. steam and electricity) and materials are not produced on-site. Hence, its scope 2 emissions (indirect emissions for generating electricity, external steam supply, etc.) and scope 3 emissions (other indirect emissions that occur in the value chain) are significant.
This research focuses only on the Botlek and Maasvlakte production sites. The scoping is made based on the sites’ economic impacts, which are substantially larger than the Moerdijk site. The two sites are described further in the following subsections.
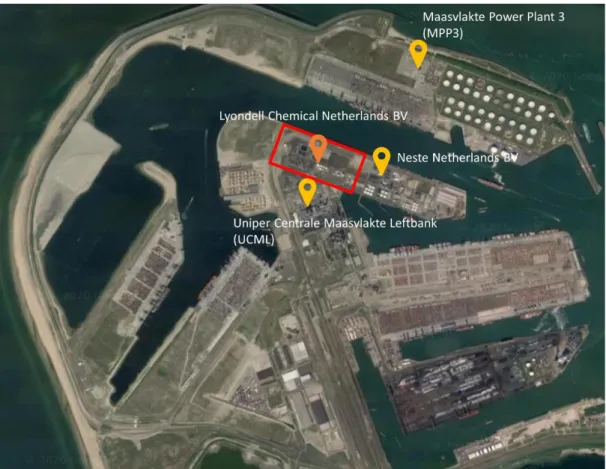
1.2 Maasvlakte Site
The Maasvlakte production site started its operations in 2003 and is a joint venture between LyondellBasell and Covestro (formerly called Bayer MaterialScience). The two companies each own 50 per cent of the plant and its production, with LyondellBasell acting as the operator. The site houses other different functional buildings such as storage park,
laboratory, office building and maintenance workshops. In addition, there are also on-site rail track and truck terminal and a deep-sea harbour (LyondellBasell, 2020). The location of the production site within the Maasvlakte region is as shown in Figure 2.
The Maasvlakte site has only two main end-products – propylene oxide (PO) and styrene monomer (SM), produced using its proprietary PO/SM technology. The PO/SM plant is also currently the largest in the world. Table 3 shows the two products manufactured at the Maasvlakte site and their respective annual production capacity. It is also noted in (Chemical Technology, n.d.), a large portion of LyondellBasell’s share of PO is used to supply feedstock to the butanediol (BDO) plant at the Botlek site.
2 Estimate includes yearly total for goods & services purchased and employee pay and benefits, excluding raw
materials purchased (basis 2016). This is converted from USD to EUR based on an average exchange rate of 1.11 EUR/USD in 2016.
Figure 2 LyondellBasell’s Maasvlakte site within the Maasvlakte region. Image is sourced and adapted from Google Maps.
Table 3 Products manufactured at the Maasvlakte site and their respective annual production capacity in kilotonnes, as estimated based on (Port of Rotterdam, 2016; Tebodin, 2017)
Product Annual Production Capacity (kt)
Propylene Oxide (PO) 385
Styrene Monomer (SM) 864
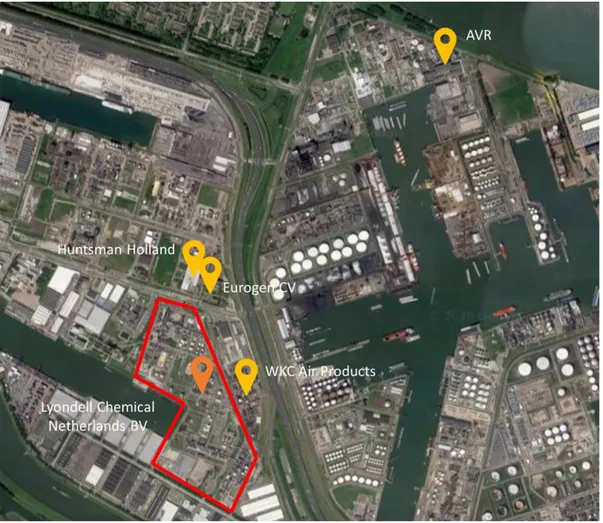
1.3 Botlek Site
This production site has the longest history out of all LyondellBasell’s operations in the Netherlands. Located in Botlek, Rotterdam, it has an independent harbour and site-owned train and truck terminal. It is also linked to the Maasvlakte production site by two 7 km pipelines (LyondellBasell, 2020). Figure 3 shows the location of the production within the Botlek region, as well as relative to a few important stakeholders of LyondellBasell’s operations within the Rotterdam region, i.e. WKC Air Products and Eurogen C.V.
Figure 3 LyondellBasell’s Botlek site relative to other relevant industrial sites within the Botlek region. Image is sourced and adapted from Google Maps.
The facility was first built in 1972, producing propylene oxide (PO) and tert-butyl alcohol (TBA) through its proprietary PO/TBA technology. The site has since expanded in 1980 to also produce C4 (i.e. isobutylene), propylene glycol (PG), propylene glycol methyl ether (PGME), methyl tertiary-butyl ether (MTBE) and ethyl tertiary butyl ether (ETBE). In 2002, it became equipped with the world’s largest 1,4-butanediol (BDO) plant. The most recent expansion was in 2015, which saw an increase in butane isomerisation capacity and the addition of two on-site steam boilers (LyondellBasell, 2020). Figure 3 shows the whole suite of products produced in the Botlek production site (Port of Rotterdam, 2016). Some of the products are intermediate or by-products of the main production processes. At the same time, some are used as input materials for the other processes. The material relationships between the different processes are further described in 2.2 and as illustrated in Figure 7.
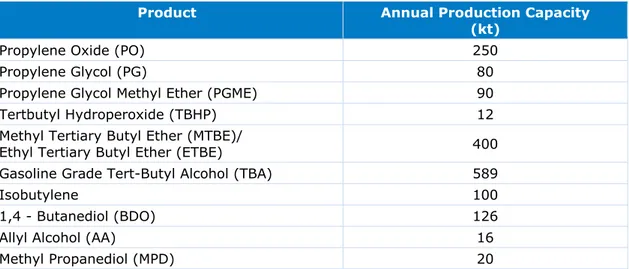
Table 4 The suite of products manufactured at the Botlek site and their respective annual production capacity in kilotonnes (Port of Rotterdam, 2016)
Product Annual Production Capacity
(kt)
Propylene Oxide (PO) 250
Propylene Glycol (PG) 80
Propylene Glycol Methyl Ether (PGME) 90
Tertbutyl Hydroperoxide (TBHP) 12
Methyl Tertiary Butyl Ether (MTBE)/
Ethyl Tertiary Butyl Ether (ETBE) 400
Gasoline Grade Tert-Butyl Alcohol (TBA) 589
Isobutylene 100
1,4 - Butanediol (BDO) 126
Allyl Alcohol (AA) 16
2 Current Processes &
Operations at
LyondellBasell
LyondellBasell produces a wide suite of chemical products through in total seven chemical processes. The Maasvlakte site has only one main chemical production process – the propylene oxide/styrene monomer (PO/SM) co-production process. On the other hand, the Botlek site has a total of six main chemical processes.
This chapter will elaborate on the main chemical processes present in both production sites in Maasvlakte and Botlek. The elaboration includes a process description of the processes, as well as their respective energy and material flows. Besides, the main external utilities supplied to LyondellBasell are identified and described. On an important note, the current process information is gathered from public sources, and is not verified by LyondellBasell.
2.1 Current Processes and Operations at Maasvlakte Site
2.1.1 Current Processes
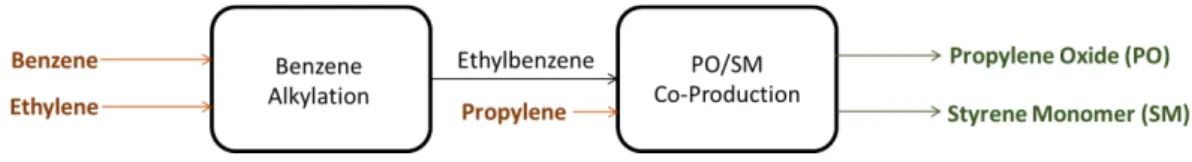
LyondellBasell’s Maasvlakte operation site produces only two main products: propylene oxide (PO) and styrene monomer (SM) through its proprietary PO/SM co-production technology. The process utilises the ethylbenzene (EB) produced on-site through the benzene alkylation process between benzene and ethylene. The high-level material flow is as illustrated in Figure 4, while the two processes are separately described the later sub-sections.
Figure 4 High level material flow in the benzene alkylation and PO/SM co-production processes
2.1.1.1.
Benzene Alkylation Process
The benzene alkylation process utilises liquid benzene and gaseous ethylene as the raw input materials. It can be further differentiated into three main successive reaction steps:
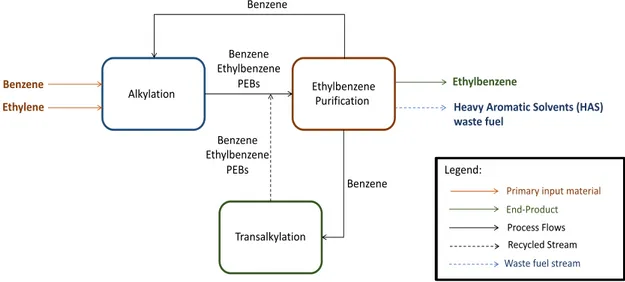
alkylation, ethylbenzene (EB) purification and transalkylation. The process is schematically illustrated in
Figure 5. Unless stated otherwise, the process is further elaborated based on (Tebodin, 2017), where a detailed process description and process flow diagram can be found.
Figure 5 Simplified process flow diagram of the benzene alkylation process
Alkylation
Alkylation is an exothermic reaction between ethylene and benzene into ethylbenzene. In addition, some of the ethylene further react with (di)ethylbenzene to form polyethylbenzenes (PEBs). The liquid phase reaction takes place in two serially-connected reactors at a
temperature range between 200°C to 250°C and pressure of 26 to 28 bar(g), in the
presence of zeolite catalyst. The alkylation process can be described using the main reaction formulas below:
1) 𝐶6𝐻6(𝐵𝑒𝑛𝑧𝑒𝑛𝑒) + 𝐶2(𝐸𝑡ℎ𝑦𝑙𝑒𝑛𝑒) ⟹ 𝐶8𝐻10(𝐸𝑡ℎ𝑦𝑙𝑏𝑒𝑛𝑧𝑒𝑛𝑒) ∆𝐻 = −113𝑘𝐽/𝑚𝑜𝑙
2) 𝐶8𝐻10(𝐸𝑡ℎ𝑦𝑙𝑏𝑒𝑛𝑧𝑒𝑛𝑒) + 𝐶2(𝐸𝑡ℎ𝑦𝑙𝑒𝑛𝑒) ⟹ 𝐶6𝐻4(𝐶2𝐻5)2 (𝐷𝑖𝑒𝑡ℎ𝑦𝑙𝑏𝑒𝑛𝑧𝑒𝑛𝑒) ∆𝐻 = −113𝑘𝐽/𝑚𝑜𝑙
3) 𝐶6𝐻4(𝐶2𝐻5)2 (𝐷𝑖𝑡ℎ𝑦𝑙𝑒𝑛𝑧𝑒𝑛𝑒) + 𝐶2(𝐸𝑡ℎ𝑦𝑙𝑒𝑛𝑒) ⟹ 𝐶6𝐻3(𝐶2𝐻5)3 (𝑇𝑟𝑖𝑒𝑡ℎ𝑦𝑙𝑏𝑒𝑛𝑧𝑒𝑛𝑒) ∆𝐻 = −113𝑘𝐽/𝑚𝑜𝑙
Ethylbenzene (EB) Purification
The effluent from the alkylation unit are then fed into a succession of three distillation columns. The Benzene Column allows the recovery of excess benzene, which is sent to the alkylation unit and the transalkylation unit. The desired product, EB, is recovered from the EB column and later used as input material for the PO/SM co-production process. An EB/PEB stream is recovered from the PEB Column and sent to the transalkylation unit. The bottom product, the heavy aromatic solvent (HAS) stream, is instead exported as fuel.
Transalkylation
Transalkylation reaction is a heat-neutral reaction between PEBs and benzene to form EB. The reaction takes place at around 215 oC and 22 bar(g), in the presence of zeolite catalyst.
The effluent from the transalkylation unit containing unreacted benzene and PEBs is again recycled and purified through the distillation columns. The transalkylation process can be described using the main reaction equations below:
1) 𝐶6𝐻5(𝐶2𝐻5)2 (𝐷𝑖𝑒𝑡ℎ𝑦𝑙𝑒𝑛𝑧𝑒𝑛𝑒) + 𝐶2𝐻6(𝐵𝑒𝑛𝑧𝑒𝑛𝑒) = 2 𝐶6𝐻5(𝐶2𝐻5) (𝐸𝑡ℎ𝑦𝑙𝑏𝑒𝑛𝑧𝑒𝑛𝑒)
2) 𝐶6𝐻5(𝐶2𝐻5)3 (𝐷𝑖𝑡ℎ𝑦𝑙𝑒𝑛𝑧𝑒𝑛𝑒) + 𝐶2𝐻6(𝐵𝑒𝑛𝑧𝑒𝑛𝑒) = 3 𝐶6𝐻5(𝐶2𝐻5) (𝐸𝑡ℎ𝑦𝑙𝑏𝑒𝑛𝑧𝑒𝑛𝑒)
Material and Energy Flows for Benzene Alkylation Process
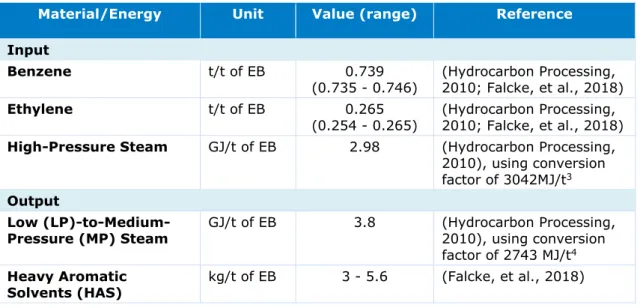
Table 5 summarises the material and energy flows for the benzene alkylation process. They are based on the Badger EBMax process described in (Hydrocarbon Processing, 2010), which matches closely with the process described above. The exothermic benzene alkylation process also produces steam of lower quality, which is assumed to be recovered and used in
Alkylation Ethylbenzene Purification Transalkylation Ethylbenzene Benzene Ethylene Benzene Benzene Ethylbenzene PEBs Benzene Ethylbenzene PEBs
Heavy Aromatic Solvents (HAS) waste fuel
Primary input material
Waste fuel stream
Process Flows Recycled Stream
End-Product Legend:
the PO/SM co-production process. Value ranges for the benzene and ethylene input are sourced from (Falcke, et al., 2018), where the input amount shall differ based on the purity of the input streams. Benzene and ethylene are purchased from steam cracking facilities within the region and are transported through ship and pipeline (CE Delft, 2012). The HAS product, together with other waste fuels from the PO/SM co-production process, are exported as waste fuels to external parties.
Table 5 Material and energy flows for the benzene alkylation unit
2.1.1.2.
Propylene Oxide (PO)/ Styrene Monomer (SM) Co-Production
Process
The PO/SM co-production process utilises the ethylbenzene produced in the Benzene Alkylation unit as the primary feedstock. Other raw input materials include propylene and hydrogen. The PO/SM can be further divided into seven main successive production units as shown in Figure 6. Unless stated otherwise, the process is further elaborated based on (Tebodin, 2017), where a detailed process description and process flow diagrams can be found.
3 This assumes that the steam is provided at a pressure level of 50 bar(g) and 340 °C (Sluis, 2014) 4 This assumes that the steam is provided at a saturated pressure level of 4.5 bar(g) (Tebodin, 2017)
Material/Energy Unit Value (range) Reference
Input
Benzene t/t of EB 0.739
(0.735 - 0.746) (Hydrocarbon Processing, 2010; Falcke, et al., 2018)
Ethylene t/t of EB 0.265
(0.254 - 0.265) (Hydrocarbon Processing, 2010; Falcke, et al., 2018) High-Pressure Steam GJ/t of EB 2.98 (Hydrocarbon Processing,
2010), using conversion factor of 3042MJ/t3
Output
Low
(LP)-to-Medium-Pressure (MP) Steam GJ/t of EB 3.8 (Hydrocarbon Processing, 2010), using conversion factor of 2743 MJ/t4
Heavy Aromatic
A ir EB
EB
a
n
d
M
B
A
/A
C
P
Se
p
ar
at
ion
M
B
A
D
eh
yd
ra
ti
o
n
MB A A CPO
xi
d
at
ion
EBC
o
n
ce
n
tr
at
io
n
Ep
o
xi
d
at
io
n
P
O
P
u
rif
ic
at
ion
P O MB A A CP EB EB H P MB A A C P EB P ro p yl e n e MB A A C P EBH
yd
ro
ge
n
at
io
n
SM A C P MB A H2 M B A A C P EB EB H P C ru d e P O Fu e l g as P ro p ane Fu e l g as Li q u id F u el s Li q u id F u e l Li q u id F ue l Fuel g as Inp u t m at e ri al s W as te f ue l s tr e am s R e cy cl e d S tr ea m s P ro ce ss F lo w s En d -P ro d u ct s Le ge n d :Oxidation
Oxidation is the first chemical reaction step of the PO/SM process. Ethylbenzene (EB) is oxidised into ethylbenzene hydroperoxide (EBHP), methylbenzyl alcohol (MBA) and
acetophenone (ACP). The input material, EB, is fed from the EB and MBA & ACP separation unit. The oxidation reaction takes place within two oxidation reactors that are connected in series, at an operating temperature of around 148 °C and operating pressure of 2.4 to 2.7
bar(g). The air, which contains oxygen necessary for the reaction, is brought to the operating pressure with an electric compressor and fed into the reactors through spargers. The chemical reactions are as described using the reaction equations below.
Main exothermic reactions:
1) 𝐶8𝐻10 (𝐸𝐵) + 𝑂2⟹ 𝐶8𝐻10𝑂2 (𝐸𝐻𝐵𝑃) ∆𝐻 = −101𝑘𝐽/𝑚𝑜𝑙
2) 𝐶8𝐻10 (𝐸𝐵) +12𝑂2⟹ 𝐶8𝐻10𝑂 (𝑀𝐵𝐴) ∆𝐻 = −190𝑘𝐽/𝑚𝑜𝑙 3) 𝐶8𝐻10 (𝐸𝐵) + 𝑂2⟹ 𝐶8𝐻8𝑂 (𝐴𝐶𝑃) + 𝐻2𝑂 ∆𝐻 = −390𝑘𝐽/𝑚𝑜𝑙
The final liquid product from the reactors is then fed to the concentration unit. On the other hand, the off-gas is cooled in the economiser where the residual EB is condensed,
fractionated and recycled back to the oxidation reactors. The remaining non-condensable is scrubbed with a stream of MBA/ACP to recover EB, which the stream is then sent to the EB and MBA & ACP separation unit. A wastewater stream containing acids and peroxides are sent to a lye processing system.
Concentration
The objective of the concentration unit is to increase the EBHP content in the stream fed from the oxidation unit, from 8% to 35% by weight. The concentration process is conducted in two concentrators, which are connected in series and operated in a vacuum condition.
Epoxidation
The concentrated EBHP is reacted highly exothermically with propylene to form PO and ACP as the main products. At the same time, MBA and ACP are formed as the by-products, and later used in the styrene production unit. The epoxidation occurs in two epoxidation reactors that are connected in series, with operating temperature and pressure of around 93-110 °C and 41 bar(g), catalysed by molybdenum catalyst. The reactions are as follows:
1)
𝐶
8𝐻
10𝑂
2(𝐸𝐵𝐻𝑃) + 𝐶
3𝐻
6⟹ 𝐶
3𝐻
6𝑂 (𝑃𝑂) + 𝐶
8𝐻
10𝑂 (𝑀𝐵𝐴) ∆𝐻 = −209𝑘𝐽/𝑚𝑜𝑙
2) 𝐶8𝐻10𝑂2 (𝐸𝐵𝐻𝑃) ⟹ 𝐶8𝐻10𝑂 (𝑀𝐵𝐴) +12𝑂23) 𝐶8𝐻10𝑂2 (𝐸𝐵𝐻𝑃) ⟹ 𝐶8𝐻8𝑂 (𝐴𝐶𝑃) + 𝐻2𝑂
Following the epoxidation reaction in the reactors, the epoxidate stream is sent for
distillation. The distillation process produces streams of fuel gas and propane-by products, which are exported or sold as fuel. This also produces a crude PO stream and a bottom product containing EB/MBA and ACP. Besides, a liquid stream is also produced and sent for the caustic water wash treatment.
PO Purification
The crude PO is then upgraded to saleable product of a purity of 99.9%, through a series of six extractive distillation columns. A few heat integration points are set up to utilise the recovered heat from the extractant circulatory system. Low-pressure steam is also utilised in three of the distillation columns, in addition to the recovered heat. The distillation stage also produces a fuel gas stream and two liquid fuel streams.
EB and MBA/ACP Separation
The EB and MBA & ACP Separation unit is fed with three streams from the Epoxidation unit, Oxidation unit and the ACP Hydrogenation unit. The streams are subsequently distilled to separate the EB, higher hydrocarbons and other residues from the MBA/ACP stream. The EB is separated through vacuum distillation, sent for caustic treatment and eventually used as an input for the Oxidation unit, along with the fresh EB stream from the Benzene Alkylation unit. The final MBA/ACP stream is used as a feed for the MBA Dehydration and SM
Purification unit. The separation process also produces salt-containing wastewater stream (referred internally as RFO-637) which is sent to AVR for incineration (CE Delft, 2012), as well as a glycolic fuel stream.
MBA Dehydration and SM Purification
The MBA in the final MBA/ACP stream fed from the EB and MBA/ACP separation unit is dehydrated to form styrene monomer (SM) in this unit. The MBA dehydration process is an endothermic reaction and takes place in the presence of a strong organic acid catalyst, the Para Toluene Sulfonic Acid (PTSA). The dehydrogenation takes place in two parallel reactors, at an operating temperature of 200 °C and pressure of 310 mbar(g). The main dehydration reaction and other side-reactions are as described by the chemical equations below: 1) 𝐶8𝐻10𝑂 (𝑀𝐵𝐴) ⟹ 𝐶8𝐻8 (𝑆𝑡𝑦𝑟𝑒𝑛𝑒) + 𝐻2𝑂 ∆𝐻 = +146𝑘𝐽/𝑘𝑔
2) 𝐶8𝐻10𝑂(𝑀𝐵𝐴) ⟹ 𝐶8𝐻10(𝐸𝐵) + 𝐻𝑒𝑎𝑣𝑖𝑒𝑠
3) 2𝐶8𝐻8 (𝑆𝑀) ⟹ 𝐶16𝐻16 (𝑠𝑡𝑦𝑟𝑒𝑛𝑒 𝑑𝑖𝑚𝑒𝑟)
The vapour effluent is fed to a lye and water wash treatment and a series of distillation steps. This results in a pure stream of SM, a separated stream of MBA/ACP sent to the ACP Dehydrogenation unit, as well as liquid fuel.
ACP Hydrogenation
The hydrogenation of ACP into MBA occurs over fixed catalyst beds of copper oxide. The reactors are connected in series, with operating conditions ranging from 16 to 21 mbar(g) and 49 to 62 °C. It is also fed with an equal amount of EB from the storage tank and the required hydrogen is fed through a pipeline, supplied by an external party. Prior to the main hydrogenation process, the MBA/ ACP from the MBA Dehydration and SM Purification unit is first sent to a fractionator to separate out the heavy hydrocarbons through vacuum
distillation, to prevent catalyst poisoning. The bottom product is then cooled and exported as fuel. The exothermic chemical reaction between ACP and hydrogen is as described by the chemical equation below:
𝐶8𝐻8𝑂 (𝐴𝐶𝑃) + 𝐻2⟹ 𝐶8𝐻10𝑂 (𝑀𝐵𝐴) ∆𝐻 = −50𝑘𝐽/𝑚𝑜𝑙
Other side reactions include: 1) 𝐶8𝐻8 (𝑆𝑀) + 𝐻2⟹ 𝐶8𝐻10 (𝐸𝐵)
2) 𝐶8𝐻8𝑂 (𝑀𝐵𝐴) + 2𝐻2⟹ 𝐶8𝐻10 (𝐸𝐵) + 𝐻2𝑂
The hydrogenate from the reactors is then sent to a flash drum to remove the waste gas. The remaining hydrogenate is recycled to the EB and MBA/ACP Separation unit.
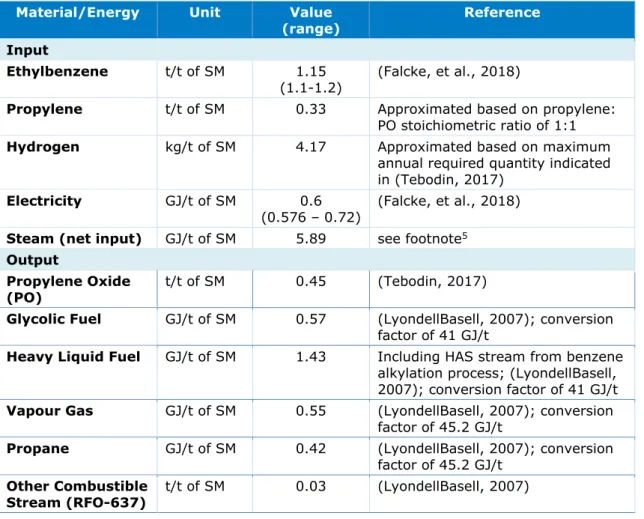
Material and Energy Flows for the PO/SM Co-Production Process
Table 6 summarises the energy and material flows for the PO/SM co-production process. The required ethylbenzene is produced on-site through the benzene alkylation process. Propylene is sourced from steam cracking facilities and is transported through ship and pipeline (CE
Delft, 2012), while hydrogen is sourced via pipeline from Air Liquide (de Kruif, 2004). A number of waste fuel streams are identified, which the energy content is approximated based on indicative amount provided in (LyondellBasell, 2007) for the year 2006. The heavy liquid fuel output also includes the HAS stream from the benzene alkylation process. The glycolic fuel, heavy liquid fuel and vapour gas streams are sent to the UCML CHP plant as replacement fuel, while the propane stream is sold to the regular fuel market (CE Delft, 2012). On the other hand, the RFO-637 is sent to AVR Rozenburg as combustible fuel for the incineration of the caustic wastewater (CWW). The processes generally produce around 220 kt of CWW per year (LyondellBasell, 2007).
Table 6 Material and energy flows for the PO/SM co-production process
Material/Energy Unit Value
(range) Reference
Input
Ethylbenzene t/t of SM 1.15
(1.1-1.2) (Falcke, et al., 2018)
Propylene t/t of SM 0.33 Approximated based on propylene: PO stoichiometric ratio of 1:1 Hydrogen kg/t of SM 4.17 Approximated based on maximum
annual required quantity indicated in (Tebodin, 2017)
Electricity GJ/t of SM 0.6
(0.576 – 0.72) (Falcke, et al., 2018) Steam (net input) GJ/t of SM 5.89 see footnote5
Output
Propylene Oxide
(PO) t/t of SM 0.45 (Tebodin, 2017)
Glycolic Fuel GJ/t of SM 0.57 (LyondellBasell, 2007); conversion factor of 41 GJ/t
Heavy Liquid Fuel GJ/t of SM 1.43 Including HAS stream from benzene alkylation process; (LyondellBasell, 2007); conversion factor of 41 GJ/t Vapour Gas GJ/t of SM 0.55 (LyondellBasell, 2007); conversion
factor of 45.2 GJ/t
Propane GJ/t of SM 0.42 (LyondellBasell, 2007); conversion factor of 45.2 GJ/t
Other Combustible
Stream (RFO-637) t/t of SM 0.03 (LyondellBasell, 2007)
2.1.2 Annual Material & Energy Consumption and CO
2Emissions
2.1.2.1.
Annual Material & Energy Consumption & Waste Fuel Production
Table 7 and Table 8 shows an estimation of the annual material and energy consumption for both the benzene alkylation and PO/SM co-production process. The figures are estimated based on the SM production capacity of 864 kt and the energy consumption values (on per unit tonne of product basis) indicated in Table 5 and Table 6.
5 Net steam input for the PO/SM Co-production refers to net steam input from external utility
company(ies). This assumes a gross steam input of 11.16 GJ/t SM (value range between 11.16 and 14.04 GJ/t of SM (Hydrocarbon Processing, 2010)), as well as utilisation of recovered heat from benzene alkylation process and PO/SM process, with an amount of 4.19 (Hydrocarbon Processing, 2010) and 1.08 (Falcke, et al., 2018) GJ/t of SM, respectively.
Table 7 Annual material usage for the PO/SM co-production process
Input Material Annual Input
(kt/year)
Benzene 730
Ethylene 260
Propylene 280
Hydrogen 4
Table 8 Annual energy usage for the PO/SM co-production process
Steam (PJ/year) Electricity (PJ/year) Total (PJ/year) 7.9 0.5 8.4
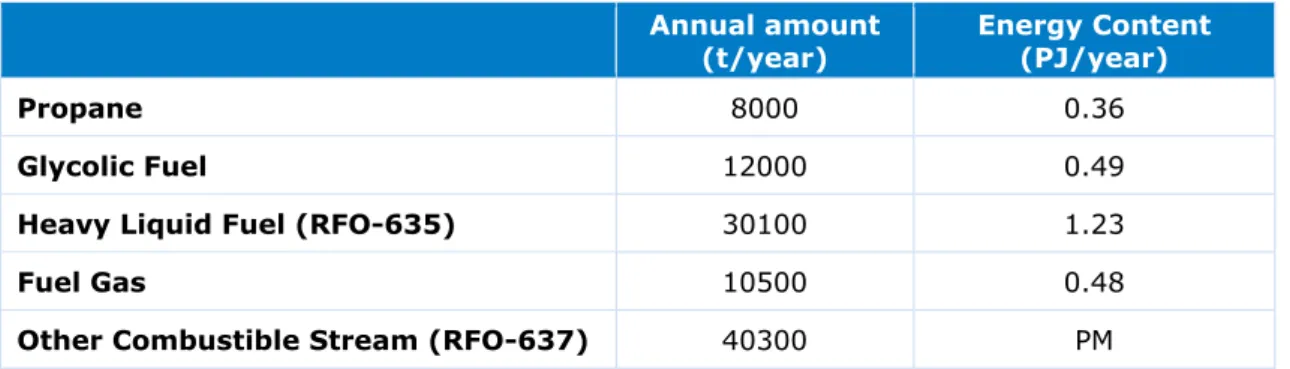
The amount of waste streams is estimated based on the statistics provided for 2006 in (LyondellBasell, 2007) and the (expected) increased in the original production capacity by 35% (Tebodin, 2017). These also provide valuable fuel streams if the production site withdraws its dependency on the external utility companies. The RFO-637 stream is used as combustible fuel stream for caustic wastewater incineration.
Table 9 Estimated amount of waste fuel streams from Maasvlakte site
Annual amount
(t/year) Energy Content (PJ/year)
Propane 8000 0.36
Glycolic Fuel 12000 0.49
Heavy Liquid Fuel (RFO-635) 30100 1.23
Fuel Gas 10500 0.48
Other Combustible Stream (RFO-637) 40300 PM
2.1.2.2.
Supply of Utilities
The main utilities required for the production of PO and SM through benzene alkylation and PO/SM co-production processes are electricity and medium-to-high pressure steam. These are exclusively sourced from the neighbouring utility sites, namely the Utility Centre Maasvlakte Leftbank (UCML) and Maasvlakte Power Plant 3 (MPP3). These two utility sites are owned by Uniper (formerly known as E.ON Benelux).
UCML was established in 2003 and consists of a gas-fired CHP (gas turbine equipped with a heat recovery steam generator (HRSG)) and direct-fired boilers (European Environment Agency, 2020; Sluis, 2014). It was primarily set up to produce processing steam for LyondellBasell’s Maasvlakte site and is connected to Maasvlakte site through a 25kV electricity cable (Energiekamer). Rated at 70 MW electricity output and 375 t/hour steam output (Uniper, n.d.), UCML also provides utilities to NesteOil and LNG GATE Terminal (Clingendael International Energy Programme (CIEP), 2017). MPP3, recently commissioned in 2017, is a coal and biomass (maximum of 30%) co-combustion power plant rated at 1070 MW. Besides, the new plant also produces steam and cooling water for nearby businesses, including LyondellBasell (Port of Rotterdam, 2018; Santen & Boere, 2016).
An integrated steam system of four steam pressure levels6 is established at the Maasvlakte
site to enable cascaded use of steam. For example, the high pressure (HP) steam condensate from one process is connected to the medium pressure (MP) steam system for use in other processes (Tebodin, 2017). The utility sites receive waste fuel streams, namely the glycolic fuel, fuel gas and heavy fuel from LyondellBasell’s Maasvlakte site as replacement fuel (CE Delft, 2012; Port of Rotterdam, 2018). Nevertheless, the exact proportion of the steam and electricity sourced from the two different sites, as well as the proportion of the fuel streams received by them, are not known from public sources.
2.1.2.3.
Annual CO
2Emissions
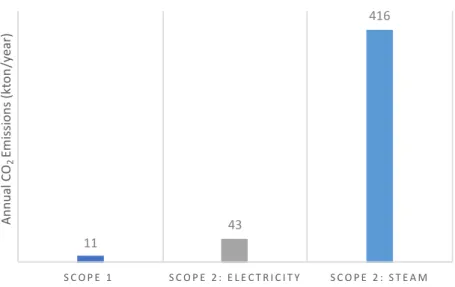
Figure 6 shows the annual CO2 emissions for the Maasvlakte production site. Scope 1
emissions refer to their reported emissions for the year 2019 (Dutch Emissions Authority, 2020). As there are no on-site steam boilers or furnaces, the scope 1 emissions could likely be attributed to the flaring, catalytic converter and thermal combustor systems (Tebodin, 2017).
The exact proportions of steam supply from UCML and MPP3, as well as their respective steam and electricity emission factors are not known. Therefore, the scope 2 emissions are estimated based on a gas-fired CHP electrical and steam thermal efficiency of 36% and 49%7, respectively. This hence refers to electricity and steam emission factors of 85.4 and
52.8 kg/GJ, respectively, as determined based attribution method suggested in (European Commission, 2018) (See Appendix for the attribution formula).
Figure 6 Estimated annual scope 1 and 2 emissions for the Maasvlakte site
2.1.2.4.
Wastewater Treatment
The production processes in Maasvlakte produces a significant amount of caustic wastewater (CWW). This CWW is first treated and then sent for further processing, i.e. incineration. The incineration was performed at AVR Rozenburg8 (IndustriePerspectief, n.d.), which received
6 The four steam pressure levels are HP (50 bar(g)), MP (20 bar(g)), LP (4.5 bar(g)), and LLP(2.5
bar(g).
7 Based on reference efficiencies for a 45MWe GT in (Cogeneration Observatory and Dissemination
Europe (CODE2), 2014).
8 The waste treatment contract between LyondellBasell (Maasvlakte) and AVR is said to have expired
in 2019. 11 43 416 S C O P E 1 S C O P E 2 : E L E C T R I C I T Y S C O P E 2 : S T E A M A n n u al CO 2 Em is si o n s ( kt o n /y ea r)
approximately 220 kt of CWW from the Maasvlakte site through pipeline, as well as combustible waste streams from Maasvlakte and Botlek sites (Tebodin, 2017). The CWW, which contains a large amount of salt, was incinerated using the combustible waste streams and a significant amount of primary fuels (e.g. natural gas, oil), raising the temperature of the flue gas to a temperature of over 1200°C (CE Delft, 2012; Tebodin, 2017). The produced steam from the incineration was then used by AVR Rozenburg to produce electricity (fed to the grid) and processing steam for other industrial consumers (Tebodin, 2017). An energy savings and carbon reduction project, namely Circular Steam Project, is planned to begin operation in 2020 to process the CWW alternatively and in-house, as further described in 4.3.1.
2.2 Current Processes and Operations at Botlek Site
2.2.1 Current Processes
LyondellBasell’s Botlek production site produces a wide range of chemical products (see Table 4). The production facility started with the propylene oxide/tert butyl alcohol (PO/TBA) co-production process in 1972 and has since then expanded to incorporate five other main production processes. These other chemical processes utilise the PO and TBA as their input materials to subsequently produce saleable end products or input material for another process (Chemical Technology, n.d.; LyondellBasell, 2007). The material relationships of the different chemical processes at the Botlek production site are illustrated in Figure 7. To further explain, part of the PO produced from the PO/TBA process is utilised as input materials for other chemical processes on-site, producing propylene glycol (PG), propylene glycol methyl ether (PGME), as well as in the Butanediol (BDO) process. The remaining PO is sold as final products to external parties. The TBA is either further purified and sold as gasoline grade TBA or further processed into isobutylene, the precursor chemical for the on-site production of methyl tertiary-butyl ether (MTBE) and ethyl tertiary butyl ether (ETBE). The co-product, tertbutyl hydroperoxide (TBHP), is purified into saleable end-product at a much lower capacity of around 12kt annually.
The six main chemical processes to be described in this subchapter are as follows:
2.2.1.1. Propylene oxide/tert butyl alcohol (PO/TBA) co-production (including the isomerisation of n-butane)
2.2.1.2. Production of propylene glycol (PG)
2.2.1.3. Production of propylene glycol methyl ether (PGME) 2.2.1.4. Production of isobutylene
2.2.1.5. Production of methyl tertiary butyl ether (MTBE) and ethyl tertiary butyl ether (ETBE)
2.2.1.6. Production of 1,4-butanediol (1,4-BDO), allyl alcohol & methyl propanediol (MPD) Associated with the PO/TBA process are the TBHP purification process and the TBA
purification process. The TBHP purification process utilises part of the effluent stream from the PO/TBA process to produce a concentrated TBHP solution. The TBA purification process instead purifies the crude TBA into gasoline grade TBA. The processes adopted for the TBHP purification and TBA purification in LyondellBasell’s operation is however not known, hence not further described in this report.
The material and energy flows for the individual processes are included in their respective subsections. Additionally, the overall annual material and energy consumption, as well as waste fuel production are further detailed in 2.2.2.1.
Is om eri sa ti o n o f n -b u ta n e Is ob u ta n e O xi d at ion P ro p yl en e Ep o xi d at io n P O/ TB A d is ti lla ti o n D eh yd ra ti o n Et h e ri fi ca ti on H yd ro ly si s P ro p o xy la ti o n Is o m e ri sa ti o n H yd ro fo rm yla ti on & H yd ro ge n at io n P u ri fic at io n o f TB H P P u ri fi ca ti o n o f TB A P O P u rif ic at io n TB H P Is o b u ty le n e G as o lin e g ra d e TB A P u ri fi ed P O P ro p yl en e G ly co l P ro p yl en e G ly co l E th er B D O a n d M P D A lly l A lc o h ol M ix ed b u ta n e P ro p yl en e M TB E/ ET B E M et h an o l/ Et h an o l W at e r P O /T B A c o -p ro d u ct ion & is o m e ri sa ti on o f n -b u ta n e P ro d u ct io n o f p ro p yl en e gl yc o l P ro d u ct io n o f p ro p yl en e g ly co l e th er P ro d u ct io n o f a lly l a lc o h ol , b u ta n ed iol ( B D O ) an d m et h yl p ro p an e d io l ( M P D ) P ro d u ct io n o f is o b u ty le n e P ro d u ct io n o f m et h yl te rt b u ty l e th e r/ et h yl t er t b u ty l e th er Sy n th e si s G as & H2 P ro p yl en e o xi d e fr o m M aa sv la kt e P ro ce ss e s: P u ri fi ed PO TB A Is o bu ty le n e F igur e 7 M at er ia l fl ow s of the che mical proce sse s a t the Bot lek produ ct ion sit e ( adapt ed f rom ( Ly on de ll Ba se ll , 200 7) )
2.2.1.1.
Propylene Oxide/Tert Butyl Alcohol (PO/TBA) Co-Production
Process
The co-production process produces PO and TBA as the main co-products, as well as tert butyl hydroperoxide (TBHP) as the by-product. The process utilises propylene and isobutane as the main raw input materials. The isobutane feedstock is obtained from LyondellBasell’s on-site butane isomerisation facility, which isomerises mixed butane stream into isobutane (LyondellBasell, 2007). The isomerisation process is further described later.
The PO/TBA co-production process can be further differentiated into two main successive units, the Isobutane Oxidation unit and the Propylene Epoxidation unit. The processing units are schematically presented in Figure 8 and further described in the following paragraphs based on (Ghanta, Fahey, Busch, & Subramaniam, 2013) unless stated otherwise. This process description is said to be reflecting LyondellBasell’s conventional PO/TBA process in the United States.
Figure 8 Process flow of the PO/TBA co-production process (Ghanta, Fahey, Busch, & Subramaniam, 2013)
Isobutane Oxidation
This stage involves the exothermic oxidation reaction between isobutane and oxygen to form TBHP and the major co-product, TBA. The TBHP and the TBA will then be fed to the second unit, propylene epoxidation, of which TBHP will further react with propylene to form propylene oxide. The oxidation occurs in a non-catalytic liquid phase in six parallelly-arranged continuous stirred tank reactors (CSTR), with typical conditions of 3 MPa and 135 °C. The reaction has an average residence time of 10 hours. The oxygen concentration in the liquid is kept below 4-7 mol%. The chemical reactions forming TBHP and TBA can be
described with the chemical equations below (Ghanta, 2008):
1) 𝐶4𝐻10 (𝐼𝑠𝑜𝑏𝑢𝑡𝑎𝑛𝑒) + 𝑂2⟹ 𝐶4𝐻10𝑂2 (𝑇𝐵𝐻𝑃) ∆𝐻 = −251.5 𝑘𝐽/𝑚𝑜𝑙
2) 𝐶4𝐻10(𝐼𝑠𝑜𝑏𝑢𝑡𝑎𝑛𝑒) + 1
2 𝑂2⟹ 𝐶4𝐻10𝑂 (𝑇𝐵𝐴) ∆𝐻 = −208.5 𝑘𝐽/𝑚𝑜𝑙
The exothermic reaction also vaporises part of the mixture, which is partially condensed to recover the isobutane back to the reactors. The liquid fraction of the reactors, containing both unreacted reactants and products, are sent to a series of distillation columns where TBA and TBHP are recovered from other by-products. Cooling water is used in the condensers in all the distillation columns.
Propylene Epoxidation
TBHP formed in the Isobutane Oxidation unit is reacted with propylene in four parallelly-arranged stirred tank reactors to form propylene oxide and TBA. The epoxidation reaction occurs over a residence time of 2 hours, with operating conditions of 3.5 MPa and 121 °C, in the presence of a homogeneous molybdenum-based catalyst. The exothermic epoxidation reaction can be described using the chemical equation below (Ghanta, 2008):
𝐶3𝐻6 (𝑃𝑟𝑜𝑝𝑦𝑙𝑒𝑛𝑒) + 𝐶4𝐻10𝑂2 (𝑇𝐵𝐻𝑃) ⟹ 𝐶3𝐻6𝑂 (𝑃𝑂) + 𝐶4𝐻10𝑂 (𝑇𝐵𝐴)
Following the epoxidation reaction, the liquid effluent is sent to a series of distillation column where PO and crude TBA are separated out from the remaining mixture. The distillation stages also allow the catalyst solution and unreacted propylene to be recovered, while crude PO is further purified in the presence of octane as an extractive agent (LyondellBasell, 2007; U.S. Patent No. 5,133,839, 1992). Referring to Figure 8, the Separation Column, Propane Stripper and PO Purification Column are chilled with normal cooling water, while Propylene Stripper and Crude PO Column are cooled with chilled water.
Isomerisation of n-Butane
The butane isomerisation process serves to isomerise straight-chain n-butane into isobutane. The isobutane is then used as the input material for the PO/TBA co-production process. As indicated in (Staatscourant, 2012), LyondellBasell has an isomerisation capacity of 80 tonnes per hour. There are several different process configurations, differing in ways such as the type of catalyst utilised (i.e. zeolite or chloride-promoted), reaction temperatures, separator equipment used (i.e. separation based on boiling points or molecular size). These variations can be found described in (Coker, 2007; Siemens AG, 2016; Barthe, Chaugny, Roudier, & Delgado Sancho, 2015; Robinson & Hsu, 2017). Nonetheless, the exact process configuration utilised in the Botlek site is not known.
In general, the mixed-butane feedstock is first dried and then fed to the isomerisation reactors. The operating conditions differ depending on the type of catalyst used. Hydrogen gas is also added to inhibit the formation of olefins/carbon deposits (Barthe, Chaugny, Roudier, & Delgado Sancho, 2015; Robinson & Hsu, 2017). Following the isomerisation process, the light ends are fractionated and exported as fuel gas or sent to a recovery unit. Depending on the process configuration, the remaining stream, which contains unconverted n-butane, may or may not be sent to an additional separation column to recycle the unreacted n-butane (Barthe, Chaugny, Roudier, & Delgado Sancho, 2015). The recycling of unconverted n-butane shall lead to a yield between 95-98%, or otherwise, an 80%
conversion rate (Barthe, Chaugny, Roudier, & Delgado Sancho, 2015).
Material and Energy Flows for PO/TBA Co-Production Process & Isomerisation of n-Butane
This section elaborates on the energy and material flows for the PO/TBA co-production process, as well as the n-butane isomerisation process, as shown in Table 10 and Table 11. The isobutane feedstock is provided by the on-site butane isomerisation capacity, which utilises mixed butane stream obtained from an external party (Staatscourant, 2012). The propylene feedstock is supplied from steam cracking installations through ship and pipeline (CE Delft, 2012), while the oxygen is supplied by Air Products.
As noted in the butane isomerisation process description above, the exact process configuration used by LyondellBasell is not known. A wide range of utility requirements is provided for the isomerisation of C4-C6 feedstock in (Barthe, Chaugny, Roudier, & Delgado Sancho, 2015), covering a spectrum of possible process configurations. The utility
the recycling process(es) involved. The mixed butane feed input is calculated based on an assumed yield of 95%. The annual mixed butane feedstock (see Table 17) is calculated
assuming all isobutane required for the PO/TBA process is provided by the isomerisation unit.
Table 10 Material and energy flows of the PO/TBA process
Material/Energy Unit Value Reference
Input
Isobutane t/t of PO 1.94
Approximated based on isobutane conversion efficiency of 100%, TBHP molar selectivity (based on isobutane consumption) of 53.4% and TBHP conversion rate of 98% and PO molar selectivity (based on TBHP consumption) of 98.5% (Ghanta, Fahey, Busch, &
Subramaniam, 2013)
Propylene t/t of PO 0.72
Approximated based on conversion efficiency and molar selectivity of 100%, and propylene: PO stochiometric ratio of 1:1 (Ghanta, Fahey, Busch, & Subramaniam, 2013)
Oxygen t/t of PO 0.79 Approximated based on TBHP:O2 and TBA:O2
stochiometric ratio of 1:1 and 1:0.5
Electricity GJ/t of PO 2.77 (Ghanta, Fahey, Busch, & Subramaniam, 2013)
Steam GJ/t of PO 17.58
Approximated based on steam input parameter provided in (Ghanta, Fahey, Busch, &
Subramaniam, 2013)9 and conversion factor of
3042 MJ/t10
Table 11: Material and energy flows of the butane isomerisation process
Material/Energy Unit Value
(range) Reference
Input
Mixed butane t/t of
isobutane 1.05
Approximated based on assumed yield of 95% (Barthe, Chaugny, Roudier, & Delgado Sancho, 2015)
Electricity GJ/t of isobutane (0.07-0.108) 0.09 (Barthe, Chaugny, Roudier, & Delgado Sancho, 2015)
Steam GJ/t of isobutane (0.91-1.83) 1.37
Approximated based on steam input parameter provided in (Barthe, Chaugny, Roudier, & Delgado Sancho, 2015)11 and
conversion factor of 3042 MJ/t10
2.2.1.2.
Production of Propylene Glycol (PG)
The production of propylene glycol (PG) utilises the propylene oxide (PO) produced on-site through the PO/TBA co-production process, as the main input material. PG is produced through the direct hydrolysis of PO with water. The process flow is schematically represented in Figure 9, consisting of the hydrolysis reactors, dehydration columns and distillation
9 Steam input of 5.78 t/t of PO (Ghanta, Fahey, Busch, & Subramaniam, 2013).
10 This assumes that the steam is provided at a pressure level of 50 bar(g) and 340 °C (Sluis, 2014). 11 Steam input range of 0.3 – 0.6 t/t of isobutane (Barthe, Chaugny, Roudier, & Delgado Sancho,
columns. The process is further described in the following paragraphs, primarily based on (Sullivan, 2012) unless stated otherwise.
Figure 9 Process flow diagram in producing PG through the hydrolysis of PO. a) Hydrolysis reactors; b) Dehydration columns; c – e) Vacuum distillation columns (as adapted from (Sullivan, 2012)).
PO and water are fed into the two serially-arranged reactors at a molar ratio of 1:15, where the hydrolysis occurs without the presence of a catalyst. The excessive amount of water limits the formation of dipropylene glycol (DPG) and tripropylene glycol (TPG) (Martin & Murphy, 2000). The initial operating conditions are at 125 °C and approximately 2 MPa, of which the reactor temperature rises to 190 °C due to the exothermic reaction. The hydrolysis reaction can be described with chemical equations (Valbert, Zajacek, & Orenbuch, 1993) below:
𝐶3𝐻6𝑂 (𝑃𝑂) + 𝐻2𝑂 ⟹ 𝐶3𝐻8𝑂2 (𝑃𝐺) ∆𝐻 = −351 𝑘𝐽/𝑚𝑜𝑙
The reaction effluent generally consists of PG, DPG and TPG in the ratio of 100:10:1
(Sullivan, 2012), which shall vary depending on the propylene oxide to water ratio. Following the reaction, the liquid effluent is first fed to dehydration columns. Water is stripped off from the effluent and is recycled back to the reactors. The remaining stream is fed to a series of vacuum distillation columns, where PG, DPG and TPG are separated from each other. The heavy residues, consisting of heavier glycols, can be used as fuel (Martin & Murphy, 2000).
Material and Energy Flows for PG Production
Table 12 summarises the material and energy flows for the production of PG, on per unit tonne of PG basis, as sourced from (Dunn, et al., 2015). The numbers provided in the literature are as modelled by the authors using Aspen Plus with Peng-Robin thermodynamic property method. 90% of the steam consumption is consumed by the distillation columns.
a a b b c d e Propylene glycol Dipropylene glycol Tripropylene glycol
Primary input material
Waste fuel stream
Process Flows Recycled Streams End-Product Legend: Heavies Propylene oxide Water
Table 12 Material and energy flows for the production of PG
Material/Energy Unit Value Reference
Input
Propylene Oxide
(PO) t/t of PG 1.10 (Dunn, et al., 2015), which assumed conversion rate to PG of 89% Electricity GJ/t of PG 0.11 (Dunn, et al., 2015)
Steam GJ/t of PG 9.28 Approximated based on primary fuel input in (Dunn, et al., 2015) using boiler efficiency of 80%12
2.2.1.3.
Production of Propylene Glycol Methyl Ether (PGME)
Propylene glycol methyl ether (PGME) is synthesised through the propoxylation reaction between methanol and propylene oxide (PO) (LyondellBasell, 2017; LyondellBasell, 2007). The PO is manufactured on-site through the PO/TBA process. The reaction occurs in a closed system, at operating conditions of 94 to 180 °C and 26 bar (Munn, et al., 2006). Various types of acid and alkali-based catalysts can be used (Trent, 2001). The reaction is
exothermic with the heat of reaction ranging between -80 to -100 kJ/ mol (Barnicki, 2017). The reaction also produces by-products including dipropylene glycol methyl ether (DPGME), tripropylene glycol methyl ether (TPGME), and other heavier ethers (Barnicki, 2017; Trent, 2001). It is noted that 2-methoxy-1-propanol will also form, which can be recovered and converted into PGME (Munn, et al., 2006). The main reaction is described with the chemical equation as follows:
𝐶3𝐻6𝑂 (𝑃𝑂) + 𝐶𝐻3𝑂𝐻 ⟹ 𝐶4𝐻10𝑂2 (𝑃𝐺𝑀𝐸)
The reactor effluent is then fed to a series of distillation columns. The excess methanol is recovered and recycled to the reactor from the first column. The remaining effluent is then further distilled into different ether streams (Munn, et al., 2006; Barnicki, 2017). The bottom product, containing the catalyst solution, is recycled and reused or incinerated (Munn, et al., 2006; Falcke, et al., 2018).
Material and Energy Flows for PGME Production
Table 13 summarises the material and energy flows for the production of PGME, on per unit tonne of PGME basis. The energy inputs are as approximated in (Sutter, 2007) for the production of ethylene glycol methyl ether (EGME), based on a large chemical production plant in Germany. The EGME is formed from the reaction between ethylene oxide and ethanol. Nevertheless, it is assumed that the energy input values are applicable for the production of PGME, as the two processes shares a similar process flow and differ from each other within a relatively narrow range of operating conditions (Barnicki, 2017).
12 As assumed in (Dunn, et al., 2015).
Table 13 Material and energy flows for the production of PGME
Material/Energy Unit Value Reference
Input
Propylene Oxide
(PO) t/t of PGME 0.76
approximated based on conversion efficiency of 100% and molar selectivity of 85% (Barnicki, 2017)
Methanol t/t of PGME 0.42
approximated based on PGME: methanol stoichiometric ratio of 1:1, conversion efficiency of 100% and molar selectivity of 85%
Electricity GJ/t of PGME 1.2 (Sutter, 2007)
Steam GJ/t of PGME 1.6
approximated from primary fuel input provided in (Sutter, 2007) with
assumed natural gas boiler efficiency of 80%
2.2.1.4.
Production of Isobutylene
The production of isobutylene at LyondellBasell’s Botlek site is through the dehydration process of tert butyl alcohol (TBA). The TBA is formed from the PO/TBA co-production process, as described in 2.2.1.1. The produced isobutylene is then used as the input material to produce methyl tertiary-butyl ether (MTBE) and ethyl tertiary butyl ether (ETBE) through etherification process (as described in 0) or sold as a final product.
The dehydration process can be carried out in the liquid or vapour phase (with a temperature between 260 and 370 °C), while the latter requires higher-cost equipment and more energy. In addition, different types of catalyst and an azeotroping agent may be used, depending on the process design (Weissermel & Arpe, 2003; Europe Patent No. EP0712824A1, 1996). The process described below is a liquid phase dehydration reaction, based on a European patent assigned to ARCO Chemical Technology, L.P. (currently known as LyondellBasell) (Europe Patent No. EP0712824A1, 1996) unless stated otherwise.
The TBA is dehydrated into isobutylene and water endothermically, in the presence of para toluene sulfonic acid (PTSA) catalyst. The dehydrator is operated at a temperature of 160 °C and pressure of approximately 14 bar (IHS Markit, 2013). The reversible reaction can be described with the chemical equation (Honkela, Ouni, & Krause, 2004) as follows:
𝐶4𝐻10𝑂 (𝑇𝐵𝐴) ⇌ 𝐶4𝐻8 (𝐼𝑠𝑜𝑏𝑢𝑡𝑦𝑙𝑒𝑛𝑒) + 𝐻2𝑂 ∆𝐻 = 26 − 34 𝑘𝐽/𝑚𝑜𝑙
Following that, the stream is sent to the separation zone for further phase separation. The cooled reaction mixture consists of three phases, a vapour stream, an organic-rich layer and a water-rich layer. The vapour stream, made up of 96.4% of isobutylene, is separated from the liquid condensate as the final product. The organic-rich condensate is recycled back to the dehydrator, while the water-rich layer is removed as a wastewater stream.
Material and Energy Flows for Isobutylene Production
Table 14 summarises the material and energy flows for the production of isobutylene, on per unit tonne of isobutylene basis. The energy consumption data is sourced from (Lassacher, Fazeni-Fraisl, & Lindorfer, 2018). The process assessed in (Lassacher, Fazeni-Fraisl, &
Lindorfer, 2018) has however assumed the use of a zeolite-based catalyst with phosphoric acid, instead of a PTSA catalyst.
Table 14: Material and energy flows for the production of isobutylene
Material/Energy Unit Value Reference
Input
Tert butyl alcohol
(TBA) t/t of isobutylene 1.43
Approximated with conversion efficiency of 98% and stream purity of 94.5% (Europe Patent No. EP0712824A1, 1996)
Electricity GJ/t of
isobutylene 0.22 (Lassacher, Fazeni-Fraisl, & Lindorfer, 2018)
Steam GJ/t of
isobutylene 14.21
(Lassacher, Fazeni-Fraisl, & Lindorfer, 2018); equivalent to 5.1 tonnes of steam at 13.79 bar
2.2.1.5.
Production of Methyl Tertiary Butyl Ether (MTBE) and Ethyl
Tertiary Butyl Ether (ETBE)
LyondellBasell’s Botlek site has a total annual production capacity of 400 kt for both methyl tertiary butyl ether (MTBE) and ethyl tertiary butyl ether (ETBE), though the proportions of the two products are not known (Port of Rotterdam, 2016). The production processes of MTBE and ETBE are similar in terms of the reaction process (Domingues, Pinheiro, & Oliveira, 2017; Weissermel & Arpe, 2003) and only require slight configuration modifications (Barthe, Chaugny, Roudier, & Delgado Sancho, 2015), as further explained below. MTBE is produced through the etherification process between isobutylene and methanol, while ETBE forms from the reaction between isobutylene and ethanol.
Part of the required isobutylene is sourced from the on-site isobutylene production unit (as described in 0), which has an annual capacity of 100 kt. The remaining input is expected to be supplemented by external party. The methanol and ethanol are sourced from external parties. In addition, bio-based ethanol is also used to produce bio-ETBE, of which the capacity is not known. The etherification process described below is generally applicable for the MTBE production process, primarily based on (Barthe, Chaugny, Roudier, & Delgado Sancho, 2015) unless stated otherwise.
MTBE production
The process configuration may either involve two reactors in a so-called conventional process (Figure 10) or combination of a reactor and a reactive distillation column in a so-called reactive distillation process (Figure 11), prior to further distillation. In both process configurations, the etherification reaction between methanol and isobutylene is catalysed using an acidic ion exchange resin catalyst and operated under the pressure of 14 bar(g) and a temperature range of 45-90 °C (Hydrocarbon Processing, 2010; Barthe, Chaugny, Roudier, & Delgado Sancho, 2015). The etherification reaction can be described with the chemical equation (Zhang, Hidajat, & Raj, 2001) below:
𝐶4𝐻8 (𝐼𝑠𝑜𝑏𝑢𝑡𝑦𝑙𝑒𝑛𝑒) + 𝐶𝐻3𝑂𝐻 (𝑚𝑒𝑡ℎ𝑎𝑛𝑜𝑙) ⇌ 𝐶5𝐻12𝑂 (𝑀𝑇𝐵𝐸) ∆𝐻 = −37.3 𝑘𝐽/𝑚𝑜𝑙
The effluent is then fed into either a reactive distillation column or a second reactor, allowing a second-time reaction to take place, maximising the conversion rate to over 99%. In the process where reactive distillation column is used, the ether stream is recovered as the bottom product from the reactive distillation column. Whereas in the conventional process,
the effluent is fed to the debutaniser for MTBE recovery. Subsequently, the effluent from either the distillation column or the debutaniser is fed to a water wash column where methanol readily dissolves in the water solvent and the raffinate is removed. The resulting methanol-water mixture is then distilled, and the recovered methanol stream is recycled back to the first reactor. The use of pervaporation membrane as a separation method is also noted in (Weissermel & Arpe, 2003).
The process employed at LyondellBasell’s Botlek site is likely to be a conventional process, where adiabatic fixed bed reactors are used (Hamid & Ali, 2004). It is also mentioned in (Europe Patent No. EP0671394A1, 1995), that the reaction occurs in the presence of a sulfonic acid catalyst, under operating conditions of 50 °C and 14 bar.
ETBE production
It is noted in (Barthe, Chaugny, Roudier, & Delgado Sancho, 2015) that the MTBE unit may be used to produce ETBE with minor modifications. The modifications include increasing the bottom temperature in the catalytic column, adjusting the temperatures in ethanol/water column and increasing the capacity of the column and cooler.
Figure 10 A simplified process flow diagram, adapted from an Uhde (Edeleanu) MTBE process utilising two serially connected reactors shown in (Hydrocarbon Processing, 2010) D e bu ta n is e r W at e r W ash C o lu mn M e tha n o l/ W ate r se p ara ti o n M TB E R ea ct o rs
Primary input material
Waste stream Process Flows Recycled Streams End-Product Legend: Methanol Isobutylene MTBE BB Raffinate
Figure 11 Process flow diagram of a simplified MTBE plant utilising reactive distillation column. Taken from Figure 2.16 in (Barthe, Chaugny, Roudier, & Delgado Sancho, 2015)
Material and Energy Flows for the ETBE/MTBE Production
Table 15 summarises the material and energy flows for the production of MTBE/ETBE, on per unit tonne of product basis. The ETBE process is likely to require a higher amount of
processing heat content than a MTBE process.
Table 15 Material and energy flows for the production of MTBE/ETBE
Material/Energy Unit (range) Value Reference
Input
Isobutylene t/t of
MTBE 0.65
approximated with conversion efficiency of 99% (Barthe, Chaugny, Roudier, & Delgado Sancho, 2015) and molar selectivity of 99.5% (Hydrocarbon Processing, 2010)
Methanol t/t of
MTBE 0.36 approximated based on MTBE: methanol stoichiometric ratio of 1:1
Isobutylene t/t of ETBE 0.45
approximated with conversion efficiency of 99% (Barthe, Chaugny, Roudier, & Delgado Sancho, 2015) and molar selectivity of 99.5% (Hydrocarbon Processing, 2010)
Ethanol t/t of ETBE 0.56 approximated based on ETBE: ethanol stoichiometric ratio of 1:1
Electricity GJ/t of
MTBE (0.04-0.07) 0.06 (Barthe, Chaugny, Roudier, & Delgado Sancho, 2015)
Steam GJ/t of
MTBE (2.9-5.7) 4.3
Approximated based on steam input parameter provided in (Barthe, Chaugny, Roudier, & Delgado Sancho, 2015) 13 and
conversion factor of 2863 MJ/t14
13 Equivalent to 1.5 t (range between 1-2 t) of steam input per tonne of MTBE (Barthe, Chaugny,
Roudier, & Delgado Sancho, 2015)