DECARBONISATION OPTIONS
FOR LARGE VOLUME ORGANIC
CHEMICAL PRODUCTION,
SHELL PERNIS
Tatiana Block, Silvana Gamboa Palacios, Ton van Dril
20 October 2020
Decarbonisation options for Large Volume Organic Chemical Production, Shell Pernis
© PBL Netherlands Environmental Assessment Agency; © TNO The Hague, 2020
PBL publication number: 4274
TNO project no. 060.33956 / TNO 2020 P11409
Authors
Block, T.J.; Gamboa Palacios, S.; Van Dril, A.W.N.
MIDDEN project coordination and responsibility
The MIDDEN project (Manufacturing Industry Decarbonisation Data Exchange Network) was initiated and is also coordinated and funded by PBL and TNO EnergieTransitie. The project aims to support industry, policymakers, analysts, and the energy sector in their common efforts to achieve deep decarbonisation. Correspondence regarding the project may be addressed to:
D. van Dam (PBL), Dick.vanDam@pbl.nl or S. Gamboa Palacios (TNO), Silvana.GamboaPalacios@tno.nl.
This publication is a joint publication by PBL and TNO EnergieTransitie and can be
downloaded from: www.pbl.nl/en. Parts of this publication may be reproduced, providing the source is stated, in the form: Block, T.J., Gamboa Palacios, S., Van Dril, A.W.N. (2020), Decarbonisation options for Large Volume Organic Chemical Production, Shell Pernis. PBL Netherlands Environmental Assessment Agency and TNO EnergieTransitie, The Hague. PBL Netherlands Environmental Assessment Agency is the national institute for strategic policy analysis in the fields of the environment, nature and spatial planning. PBL contributes to improving the quality of political and administrative decision-making by conducting outlook studies, analyses and evaluations in which an integrated approach is considered paramount. Policy relevance is the prime concern in all of PBL’s studies. PBL conducts solicited and unsolicited research that is both independent and scientifically sound. TNO EnergieTransitie has a twofold mission: to accelerate the energy transition and to strengthen the competitive position of the Netherlands. TNO conducts independent and internationally leading research and we stand for an agenda-setting, initiating and supporting role for government, industry and NGOs.
This report was reviewed by Shell, as far as the descriptions of the production facilities is concerned. All energy efficiency improvement and decarbonisation options and related parameters are determined by PBL and TNO and have explicitly not been verified by Shell. PBL and TNO remain responsible for the content.
Contents
Summary 4
INTRODUCTION
6
1
SHELL NEDERLAND CHEMIE PERNIS
7
1.1 Location 7
1.2 History 8
1.3 Main Activities 8
2
SNC–PERNIS PROCESSES
9
2.1 Main manufacturing processing routes in SNC-Pernis 11
2.2 Energy Consumption in SNC-Pernis manufacturing plants 24
2.3 Material and energy balances 25
2.4 EU ETS carbon dioxide emissions 28
3
SNC-PERNIS MAIN PRODUCTS AND APPLICATION
30
3.1 Feedstocks 31
3.2 SNC – Pernis Main Products and Uses 34
4
OPTIONS FOR DECARBONISATION
43
4.1 Electrification Technology 44
4.2 Blue and green hydrogen 46
4.3 Ultra-Deep geothermal (UDG) heat 47
4.4 Energy efficiency 48
4.5 Feedstock replacement 49
4.6 Carbon capture, sequestration and utilisation CCS(U) 53
5
DISCUSSION
56
FINDINGS
Summary
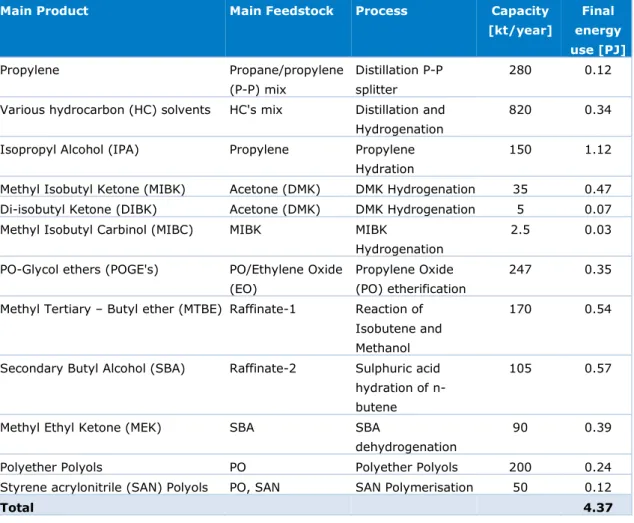
This MIDDEN report covers the production of chemicals at the Pernis location of Shell Nederland Chemie (SNC). The scope excludes the Shell refinery, which is covered by the MIDDEN report related to the Dutch refineries (Oliveira & Schure, 2020). The table below shows the different products, processes, feedstocks and capacities of SNC Pernis. The total energy use for these processes amounts to 4.4 PJ/year, subdivided in 3.1 PJ steam, 0.5 PJ hot oil, 0.4 PJ electricity and 0.2 PJ fuel gas.
Table S.1 Production capacities at the Pernis location of Shell Nederland Chemie
Main Product Main Feedstock Process Capacity
[kt/year] Final energy use [PJ] Propylene Propane/propylene (P-P) mix Distillation P-P splitter 280 0.12
Various hydrocarbon (HC) solvents HC's mix Distillation and
Hydrogenation
820 0.34
Isopropyl Alcohol (IPA) Propylene Propylene
Hydration
150 1.12
Methyl Isobutyl Ketone (MIBK) Acetone (DMK) DMK Hydrogenation 35 0.47
Di-isobutyl Ketone (DIBK) Acetone (DMK) DMK Hydrogenation 5 0.07
Methyl Isobutyl Carbinol (MIBC) MIBK MIBK
Hydrogenation
2.5 0.03
PO-Glycol ethers (POGE's) PO/Ethylene Oxide
(EO)
Propylene Oxide (PO) etherification
247 0.35
Methyl Tertiary – Butyl ether (MTBE) Raffinate-1 Reaction of
Isobutene and Methanol
170 0.54
Secondary Butyl Alcohol (SBA) Raffinate-2 Sulphuric acid
hydration of n-butene
105 0.57
Methyl Ethyl Ketone (MEK) SBA SBA
dehydrogenation
90 0.39
Polyether Polyols PO Polyether Polyols 200 0.24
Styrene acrylonitrile (SAN) Polyols PO, SAN SAN Polymerisation 50 0.12
Total 4.37
Energy supply is closely linked to the adjacent Shell Pernis refinery. The direct emissions reported for the chemical activities amount to 30.3 kilotonnes (kt) CO2 in 2018. Around half
of these emissions come from fuel combustion for the furnaces, the other half from combustion of residual gases.
Decarbonisation options to address direct emissions include CCS and avoiding combustion of fuel in furnaces by electric heating. As far as residual flows are combusted, alternative uses of these flows could be investigated. Hydrogen for hydrogenation could be supplied by green or blue hydrogen, thus avoiding emissions in hydrogen production from fossil fuels.
Hydrogen may also be an alternative fuel for combustion in furnaces. Energy efficiency may still have room for improvement by further optimising the systems for process heating, including distillation and drying. Electrification may be part of these efforts, by applying heat
pumps, or replacing steam driven compressors by electrically driven ones. Also geothermal energy is an option for renewable heat generation.
Biobased feedstocks can be further applied for several of the processes at SNC Pernis. For the imported methanol and acetone (DMK) feedstocks, there are biobased versions available. For products such as polyols and propylene glycol ethers, there are alternative processes using biobased glycerol.
FULL RESULTS
Introduction
This report describes the current situation for the Pernis location of Shell Nederland Chemie (SNC). It deals with the production of several basic chemicals in the Netherlands and the options and preconditions for its decarbonisation. The study is part of the MIDDEN project (Manufacturing Industry Decarbonisation Data Exchange Network). The MIDDEN project aims to support industry, policymakers, analysts, and the energy sector in their common efforts to achieve deep decarbonisation. The MIDDEN project will update and elaborate further on options in the future, in close connection with the industry.
Scope
Products include: Propylene; Various Hydrocarbon Solvents; Methyl Tertiary – Butyl ether; Secondary Butyl Alcohol; Methyl Ethyl Ketone; Isopropyl Alcohol; Methyl Isobutyl Ketone; Di-isobutyl Ketone; Methyl Isobutyl Carbinol; Propylene Oxide Glycol ethers; Polyether Polyols; Styrene acrylonitrile (SAN) Polyols.
Production processes include: distillation; hydrogenation; dehydrogenation; hydration; etherification; polymerisation.
The main options for decarbonisation are: electrification; biobased feedstocks; CCS. The decarbonisation strategy is strongly dependent on the decarbonisation of the Shell refinery at Pernis.
Reading guide
Chapter 1 introduces Shell Nederland Chemie at Pernis. Chapter 2 describes the current situation for the production processes, and chapter 3 describes the feedstocks, products and applications of these processes, while options for decarbonisation are systematically
quantified and evaluated in chapter 4. The feasibility of and requirements for those decarbonisation options are discussed in chapter 5.
1 Shell Nederland
Chemie Pernis
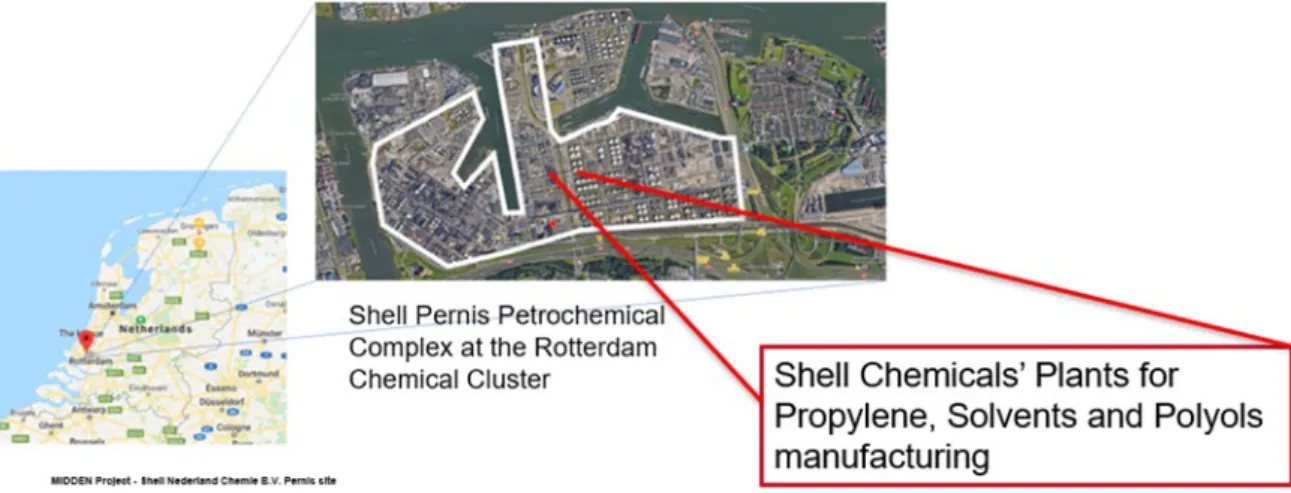
1.1 Location
Shell Pernis petrochemical complex is located in the Industrial Area in the Port of Rotterdam It is comprised by the refinery (owned and operated by Shell Nederland Raffinaderij B.V.) and the chemicals plants of Shell Nederland Chemie B.V. (SNC), where crude oil is processed into usable products such as gasoline, kerosene, diesel and raw materials for the chemical industry. Both refinery and chemicals sites at Pernis occupy a total area of 550 hectares (Shell, 2019a), surrounded by large and small residential areas like Pernis, Hoogvliet,
Spijkenisse,Rhoon/Poortugaal, Vlaardingen and Schiedam. The Shell refinery itself is covered in the MIDDEN report related to the refineries (Oliveira & Schure, 2020).
Figure 1 Pernis Petrochemical complex location
In addition to the chemical plants in Pernis, SNC owns a second site located in Moerdijk (which is covered in another MIDDEN report (Wong & Van Dril, 2020)), approximately at 33 km distance from Pernis, between the industrial centres of Antwerp and Rotterdam. In the late 1960’s, the Pernis site ran out of space for the installation of new chemical plants, therefore the acquisition of the site in Europoort near Moerdijk was required due to the growing demand for chemical products. The sites of Pernis and Moerdijk are interconnected by underground pipelines to facilitate the exchange of feedstocks and products (Public Affairs department of Shell Nederland Raffinaderij B.V., 2003).
1.2 History
Shell Chemicals history began in The Netherlands in 1929, with the establishment of a partnership named “NV Mekog” manufacturing ammonia from coke-oven gas. In 1936, the refinery came on stream at Pernis and since then, Shell has been manufacturing a growing number of petroleum products from crude oil at this location. In 1949, the petrochemical plants came into operation, where raw materials for PVC were produced, as well as Teepol, an industrial detergent (Shell, 2019b). In 1959, the chemical branch was transferred to SNC. Over the years, regular investments have been made at Pernis to expand the capacity of propylene production, for example, and to enhance product quality. The latest additions are the propylene oxide glycol ether plant, on-stream in 2001, and a polymer polyols plant, on stream in mid-2003 (Shell, 2019b; Port of Rotterdam Authority, 2019). In the last two decades, a number of petrochemical plants in Pernis were sold to new owners and/or dismantled e.g. isoprene and styrene rubber were dismantled in 2010. The lubricants plant was closed in 2014 (Engineeringnet, 2019). Other plants on the Pernis site are: Shin Etsu (production of PVC) and Hexion UK Ltd (basic chemicals) (Port of Rotterdam Authority, 2019). “SNC continues to supply many of the feedstocks for these plants, and both SNC and
SNR (Shell Nederland Raffinaderij) provide various services to these new owners” (Public
Affairs department of Shell Nederland Raffinaderij B.V., 2003).
1.3 Main Activities
The SNC Pernis manufacturing plants are operated by Shell owned companies or by partners within joint ventures. SNC Pernis manufactures basic and intermediate chemicals to sell in large volumes to other chemicals companies or industries. The main products are lower olefins, chemical solvents, hydrocarbon solvents, and polyols (Shell, 2019c).
SNC Pernis is part of a fully integrated petrochemical complex with connections to and from the Shell Refinery, SNC Moerdijk, other plants located in the vicinity of their site and other transport systems for their products. More detailed descriptions of the processes and manufactured products at SNC – Pernis site are included in chapter 2 and 3 in this report.
2 SNC–Pernis
Processes
Shell Chemicals has played a significant role in the growth of the global petrochemicals sector and have developed an important number of their own key manufacturing processes (Shell, 2019c). In this chapter, the main manufacturing processes taking place in SNC Pernis are described, followed by a brief description of the energy system in these plants and the corresponding carbon dioxide emissions.
A total of 12 main chemical manufacturing processes take place in SNC Pernis in two locations namely, “Chemie, Oplosmiddelen en Derivaten” (COD) and “Chemie, verlading en polyolen” (CVP). The raw material flows come from the adjacent Shell Refinery and SNC-Moerdijk, as well as from external suppliers.
Table 1 presents a list of the main products manufactured by SNC Pernis categorized by type.
Table 1 Overview of main products and processes in SNC Pernis site (Shell, 2019c; Port of Rotterdam Authority, 2019)
Main Product Category Location Main Feedstock Process Capacity
kt/year
Propylene Lower
Olefin
COD Propane/ propylene
(P-P) mix Distillation P-P splitter 280 Various Hydrocarbon (HC) solvents Hydrocarb on Solvent
COD HC's mix Distillation and
Hydrogenation 820 Isopropyl Alcohol (IPA) Chemical Solvents
COD Propylene Propylene
Hydration 150 Methyl Isobutyl Ketone (MIBK) Chemical Solvents
COD Acetone (DMK) DMK Hydrogenation 35
Di-isobutyl Ketone (DIBK)
Chemical Solvents
COD Acetone (DMK) DMK Hydrogenation 5
Methyl Isobutyl Carbinol (MIBC)
Chemical Solvents
COD MIBK MIBK
Hydrogenation 2.5 PO-Glycol ethers (POGE's) Chemical Solvents
COD PO/Ethylene Oxide
(EO)
Propylene Oxide (PO) etherification
247 Methyl Tertiary –
Butyl ether (MTBE)
Chemical Solvents
COD Raffinate-1 Reaction of
Isobutene and Methanol 170 Secondary Butyl Alcohol (SBA) Chemical Solvents
COD Raffinate-2 Sulphuric acid
hydration of n-butene
105
Methyl Ethyl Ketone (MEK)
Chemical Solvents
COD SBA SBA
dehydrogenation
90
Polyether Polyols Polyols CVP PO Polyether Polyols 200
Styrene acrylonitrile (SAN) Polyols
Figure 2 illustrates the activities taking place on the SNC-Pernis premises by showing the products, processes and the in- and output flows. These include interaction with the refinery, the SNC-Moerdijk site, third parties located either in the Netherlands (e.g. Port of Rotterdam) or abroad such as the interaction with liquified gas products from Shell Qatar or the supply of feedstock from Europe.
In general, the production of chemical feedstock in the refineries, from fossil fuel materials, typically involve endothermic processes demanding a large amount of energy for both endothermic reactions as well for separation and purifications processes. However, the subsequent processes downstream in the production chain, as the ones occurring at SNC- Pernis site, go from high to low energy level products with mostly exothermic chemical reactions and relatively high yields (Matar & Hatch, 2000).
2.1 Main manufacturing processing routes in SNC-Pernis
This report section has been divided in four subsections considering what has been identified as “production routes” or main material flows as shown in Figure 2. The definition of these routes is based on the main feedstocks groups and their conversion processes into final commercial products, namely, C-3’s stream from the refinery, the C4’s mix (Raffinate - 1) stream from Moerdijk, imported dimethyl ketone (DMK or Acetone) and Propylene Oxide from Moerdijk.Among the first two groups of process routes, one may find processes that are usually considered to take place in the refinery, for example, propane-propylene distillation, continuous distillation of hydrocarbon solvents and MBTE synthesis (Barthe, Chaugny, Rouidier, & Delgado Sancho, 2015). They are included in this study because these processes were excluded from the MIDDEN study on refineries (Oliveira & Schure, 2020).
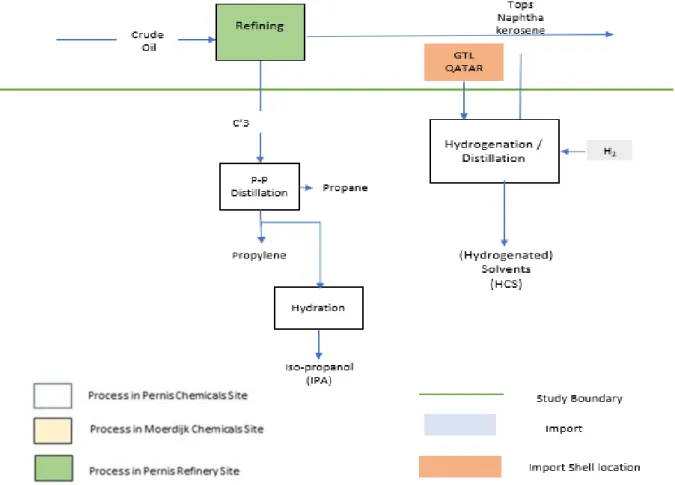
2.1.1 C3’s and refinery streams processing route
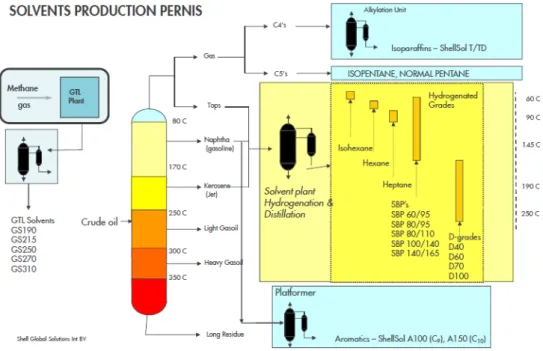
Figure 3 displays the process to be described in this sub-section, distillation on C3’s mix from SNR and distillation and for some products Hydrogenation of GTL from Qatar and C5 cuts and naphtha from the refinery. Propylene hydration for the propylene of Isopropyl alcohol (IPA) is also included.
Figure 3 C3’s and other Refinery streams processing route
Catalytic cracker feed Distillation (High Purity Propylene)
Distillation is a separation process of liquid mixtures based on their boiling points or relative volatility. It is physical separation process not a chemical reaction (Perry & Green, 1997). In petrochemical plants and refineries, distillation is commonly used to separate olefins, for example ethane/ethylene, propane/propylene, and butane/butene. It is also used to upgrade refinery grade product into a polymer grade propylene, a more diverse and commercial end-product.
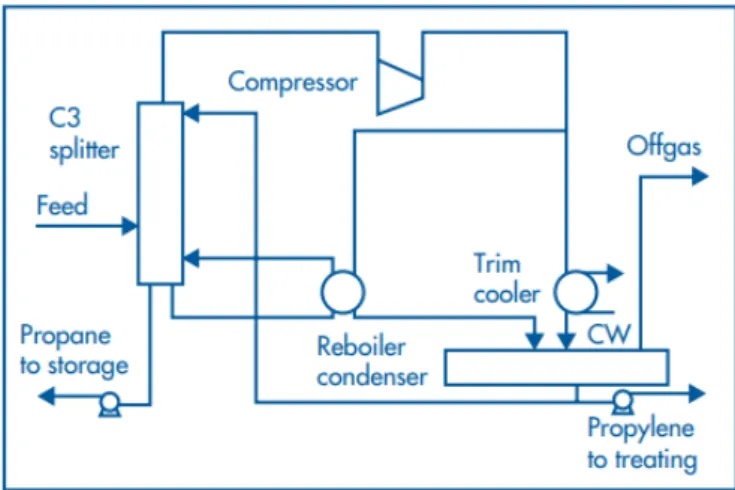
The purifying units are usually referred to as splitters or superfractionators, as they contain a number of separations stages (Koch-Glitsch L.P., 2019). The propane/propylene (C3) splitter in SNC-Pernis produces polymer grade propylene (98 to 99.9% purity) from a feed (60 to 95% propylene) from catalytic crackers of the refinery and third parties. The splitter contains various columns and purification beds, including the main columns with heat pump (Shell, 2019d; Obenaus, Droste, & Neumeister, 2010; Shell Global Solutions B.V., 2019).
The propane/propene splitter is equipped with a heat pump (compressor) which supplies the energy required for the separation of the propane and propylene. This heat pump runs at a fixed speed, and it is driven by an electro motor, which represents the highest energy consumption of this unit.
Figure 4 Distillation Process Flow diagram of C3 splitters with heat pump technology (Shell Global Solutions B.V., 2019)
The produced propylene serves as feed for the production of IPA, acrylonitrile (ACN) and epichlorohydrin (ECH). The latter is manufactured in the plants of Hexion B.V. which are also located at the SNC Pernis site. Propylene is also feedstock for the production of propylene oxide (PO) in SNC Moerdijk. This in turn is returned to Pernis for the production of polyols and POGE. The remaining propylene is pumped into the propylene grid to Botlek, Moerdijk and Antwerp. The produced propane is sent back to the refinery.
Continuous Distillation of Hydrocarbon mixture (Hydrocarbon Solvents) Hydrocarbon Solvents (HCS) are generally manufactured by the continuous distillation of crude oil, similar to the process used for motor fuels. The resulting hydrocarbon solvents contain paraffinic, naphthenic and aromatic components in various proportions. The
composition of individual products within this group is determined by the refining parameters (Shell, 2019e).
At SNC-Pernis, solvents from hydrocarbons are produced in the HCS units, manufacturing both low-aromatic and high-aromatic solvents. Isoparaffinic, iso and normal pentanes, and aromatic solvents are produced in SNR premises. The feedstock for the HCS units comes from SNR, Shell Rheinland (Germany) and Shell Qatar Gas to Liquid (GTL) plants. The HCS are manufactured in two major stages, hydrogenation and distillation. The
hydrogenation reaction leads to the conversion to low-aromatic products. The remaining light hydrocarbon and any remaining hydrogen and hydrogen sulphide are then removed in a stripper1 by distillation. Except for high aromatic solvents (>99% aromatics), all HCS are
de-aromatised by hydrogenation.
After intermediate storage, the bottom product is further processed in three distillation units where the low-aromatic intermediates are separated according to their boiling ranges. Additionally, any high-aromatic material that has not passed through the hydrogenation unit (HGU) is distilled in a fourth unit as well. The temperature range of these operations varies from 60 to 250 °C, as illustrated in Figure 5.
1 Steam Stripping is essentially a physical separation process where one or more components are removed from a liquid stream by a vapour stream (steam). Steam strippers allow for the removal of heavy soluble organic compounds that air strippers cannot remove. The temperature of these columns is usually very close to the boiling point of water. This is commonly done in a tray or packed tower (College of Chemical Engineering at University of Michigan, 2019 a).
Figure 5 Schematic representation of High and Low paraffinic Hydrocarbons Solvent Production in Shell Chemicals Pernis (Shell Global Solutions B.V., 2018) Hydrogenation of aromatics is exothermic, so the HGU does not consume much energy. The process energy consumption is determined by the fractioning of low and high aromatic hydrocarbon solvents in distillation units. Separation processes using conventional heat integrated distillation units with furnaces, gas turbines and boilers, are energy intensive processes. The energy requirements may change on a yearly basis, due to the variability in composition of the raw materials (a hydrocarbon mixture) and the market product demands. Direct hydration of propylene to produce Isopropyl alcohol (IPA)
Isopropyl Alcohol is produced by the chemical grade propylene direct hydration. The modern route avoids the need for sulphuric acid, as it is the case in - older - indirect production methods based on refinery grade propylene. Worldwide, a relatively small amount of IPA is produced by the hydrogenation of acetone in the liquid phase. This process is only suitable where excess acetone is available (Papa, 2002)
Direct hydration is more commonly used in Europe and it consists of the reaction of
propylene and water, either in gas phase or in liquid phase. It is applied in the preparation of ethanol from ethylene, and the manufacturing of isopropyl alcohol from propylene, the production of tertbutyl alcohol from isobutene, and production of SBA (2-butanol) from a mixture of butenes (Raffinate II) (Falcke, et al., 2017). More information on the latter is given in the next subsection (2.1.2) of this chapter.
The direct hydration of propylene is carried out according to the following reversible equation:
Equation 1 Propylene hydration to Iso-propylene Alcohol (Nawaz, 2017, p. 1)
The reaction is exothermic, the heat of the reaction calculated from available thermochemical data is about 12 kcal/mol (approx. 50 kJ/mol) over a range of 127 to 326 °C in vapour phase (Tokuyama Soda, 1973).
From the operational point of view, the liquid phase process is carried out at pressures of 80-100 bar and 150 °C whereas the vapour phase reaction is generally carried out at
approximately 180 °C and 35 bar (Falcke, et al., 2017) or 200 °C and 25 bar over a catalyst (Matar & Hatch, 2000).
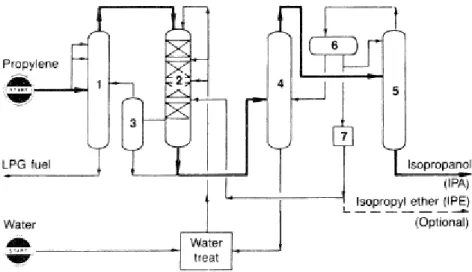
Figure 6 shows a typical process diagram for the manufacturing of IPA at liquid phase conditions where: (1) propylene recovery column, (2) reactor, (3) residual gas separation column, (4) aqueous isopropanol azeotropic distillation column, (5) drying column, (6) isopropyl ether separator, (7) isopropyl ether extraction (Petrochemical Handbook, 1991).
”An isopropanol yield of 93.5% can be realized at 75% propylene conversion. The only important by-product is diisopropyl ether (about 5%)” (Matar & Hatch, 2000, p. 227)
Figure 6 A flow diagram for the Liquid Phase Hydration of propylene to the isopropanol process (Petrochemical Handbook, 1991)
At SNC-Pernis, part of the propylene stream from the C3 splitter is fed together with reaction water into a circulation stream of reactants. The reaction product is led to a washing tower where the non – converted propene is removed and recycled. Subsequently, IPA is obtained from the aqueous solution by distillation, where components such as di-isopropyl ether (IPE), normal propyl alcohol (NPA) and an excess amount of water are removed. Since IPA and water constitute an azeotropic mix, cyclohexane is used as entrainer for separation in a closed cycle.
In the IPA manufacturing process, a large part of the energy use is determined by a medium pressure steam turbine driving a compressor used to circulate reactants. The rest steam is used for the separation of the reaction products from the reactor. Medium Pressure (MP) steam networks typically operate within pressures values ranging from 7-20 bar whilst temperatures vary within 200-350 °C (Barthe, Chaugny, Rouidier, & Delgado Sancho, 2015).
2.1.2 C4’s stream processing routes
C4’s hydrocarbon stream from the refinery or from steam cracking units comprises a mix of
butane and butenes. The latter are unsaturated olefinic hydrocarbons (alkenes) and are frequently referred to as “butylenes”. There are four butene isomers: 1-butene, cis-2-butene, trans-2-butene and 2-methyl propene isocis-2-butene, also known as “isobutylene”. Butenes cannot be found separately in nature and cannot be separated by distillation since their boiling points are very similar (Obenaus, Droste, & Neumeister, 2010). Therefore the separation of isobutylene from a mix of C4 hydrocarbons is usually integrated in the
manufacturing of MTBE and in other cases, with the production of sec-butanol and MEK for maximizing product yields (Streich, Geng, & Renger, 2016). An overview of the C4 stream process route is depicted in Figure 7, from the C4’s mix to Sec-Butanol and the Methyl– Ethyl–Ketone production routes.
Figure 7 From C4’s mix to Sec-Butanol and Methyl – Ethyl – Ketone production routes Etherification of C4’s mix (Raffinate -1) to Methyl tert-butyl ether (MTBE) There are multiple variations of commercial processes to produce MTBE. Most commercially available processes are comparable, and consist of a reaction and a refining section
(Winterberg, Schulte-Körne, Peters, & Nierlich, 2010)
Generally, MTBE is produced from the reaction of isobutene and methanol. MTBE synthesis is an exothermic liquid phase reversible reaction. Typically, five reactions occur in the synthesis of MTBE, the main reaction is presented in equation 2. According to the reviewed literature, the MTBE yield may vary in between 83 % (Nawaz, 2017) and 98% (Matar & Hatch, 2000). The reaction occurs in the presence of an acidic ion-exchange resin catalyst at temperatures between 38-93 °C and a pressure range of 7 to 14 bar (Institute for Health and Consumer Protection, 2002).
Equation 2 Isobutene and Methanol Reaction (Nawaz, 2017, p. 1)
Table 2 Typical composition (in wt. %) of Raffinate-1 and 2 related to integrated steam cracking, the Hüls MTBE synthesis process and isobutane removal (Obenaus, Droste, & Neumeister, 2010)
The reaction consists in the synthesis of MTBE by the etherification of isobutene contained in Raffinate-1, with methanol, resulting in a new stream with almost non isobutene content, also called Raffinate 2. In the distillation phase, the raffinate 2 is then fractioned to separate
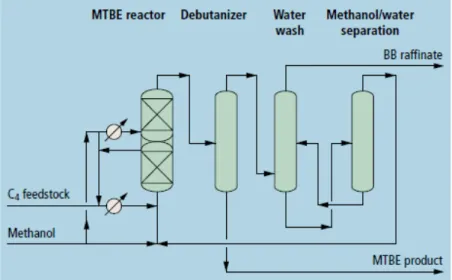
isobutane together with water. Through selective hydrogenation, Raffinate-2 is then stripped the residues 1-3 butadiene present, ending with a typical composition of about 60 to 90 wt.% of linear butenes and butane (Winterberg, Schulte-Körne, Peters, & Nierlich, 2010). Table 2 also shows the typical composition of raffinate 2 after isobutane removal. A version of the Raffinate-1 etherification process flowsheet is presented in Figure 8, licensed by Uhde GmbH (Gulf Publishing Company, 2004).
Figure 8 Uhde GmbH. MTBE production processes (Gulf Publishing Company, 2004) In SNC-Pernis the produced MTBE is sent to the refinery or exported. It is mainly used as additive in the transport fuel production process. The resulting Raffinate 2 (Shell, 2019d) is a chemical building block used in the manufacture of secondary butyl alcohol (SBA) and methyl ethyl ketone (MEK) as described in the following sub-sections.
From Raffinate 2 indirect hydration to Sec-butyl alcohol (SBA)
All alkenes react with water in the presence of dilute sulfuric acid to produce alcohols. SBA made by hydration is, after 1-3 butadiene, the second largest volume product from n-butenes (Obenaus, Droste, & Neumeister, 2010). Industrially, two variants of the hydration reaction are used, indirect and direct processes. The direct hydration process occurs in the gas phase (Falbe, Bahrmann, Lipps, & Mayer, 2013). At SNC-Pernis, SBA or 2-butanol is produced by the hydration of Raffinate-2 using the indirect process, in which the liquid-phase reaction takes place in two steps. The first step is the reaction of the feedstock with sulfuric acid at a temperature of 35 °C to form mono- and dialkylsulfatesi.e. fat acids. In the second step, the resulting mix (fat acids) is separated from residual gas in a phase separator to later be diluted with water (hydrolysis) and forming SBA. This raw SBA is upgraded to pure SBA to be fed to the MEK plant (Falbe, Bahrmann, Lipps, & Mayer, 2013). Reportedly, an 85 wt% alcohol yield could be realized. The main by-product is di-sec-butyl ether, which may be recovered (Matar & Hatch, 2000). The reactions are as follows:
Equation 3. Chemical Reactions for SBA manufacturing (Matar & Hatch, 2000, p. 222) The SBA production unit requires sulfuric acid to catalyse the hydrolysis reaction. The energy demand is driven by the amount of steam required in three steps of the process, these are:
(1) the amount of low pressure (LP) and medium pressure (MP) steam to recirculate sulfuric acid over the unit (Barthe, Chaugny, Rouidier, & Delgado Sancho, 2015). (2) LP steam required to remove sulfuric acid from the SBA and water mixture, and (3) the amount of LP steam required to separate SBA and water through vaporization. The latter is decisive for the energy consumption of the unit (Dennebos & Zwart, 2019). Usual operating ranges of
industrial low-pressure steam vary within a pressure range of 3.5 to 5 bar and temperatures in between 150 to 200 °C.
SBA dehydrogenation for the Synthesis of Methyl Ethyl Ketone (MEK) Methyl Ethyl Ketone (MEK) or 2-butanone is the second most commercialised ketone next to acetone. MEK is mainly produced by the dehydrogenation of SBA. By 2006, approximately 92% of all production capacities worldwide used this process technique (Hoell, et al., 2012).
Equation 4. SBA Chemical Reactions for MEK manufacturing (Environmental Protection Agency (EPA), 1994)
In the most commonly used production method, SBA dehydrogenation occurs in the vapour phase. The majority of the reaction takes place in furnaces at 400-550 oC and pressures
lower than 4 bar (ICIS, 2019b). Other authors indicate that typical conditions for this reaction are 220 to 450 oC and 1 to 6 bars (Barnicki, 2012). The alcohol vapour is then fed
into a multi-tubular reactor containing zinc or copper oxides as catalysts, and subsequently, the hydrogen is flashed off (ICIS, 2019b). Copper catalysts provide high selectivity, typically greater than 90% (Barnicki, 2012). After the hydrogen separation, the MEK is purified by distillation. “The main fraction (methyl ethyl ketone) is typically obtained at an 85 to 90
percent yield based on the mass of secondary butyl alcohol charged” (Environmental
Protection Agency (EPA), 1994, pp. 4-6). Another source reports a higher yield of
approximately 95% (Matar & Hatch, 2000). The produced hydrogen may be re-used, burned in a furnace, or flared. Figure 9 depicts a process technology developed by Deutsche Texaco based on dehydrogenation of anhydrous sec-butyl alcohol on a copper-based precipitation catalyst at 240–260 OC under normal pressure (Stahmer, 1984) (DE Patentnr. 1147933,
1958).
a) A multitube reactor; b) Evaporator; c) Condenser; d) Separator; e) Refrigerator; f) Distillation column system
Figure 9 Gas Phase dehydrogenation of sec-butyl alcohol developed by Deutsche Texaco (Hoell, et al., 2012)
The Environmental Protection Agency reports reactors to be maintained between 400°C and 550 °C at normal atmospheric pressures for conversion from secondary-butyl alcohol using a catalytic bed of zinc oxide or brass (zinc-copper alloy) (Environmental Protection Agency (EPA), 1994). For the manufacturing of MEK, most of the energy use is used to supply heat to the reactor where the indicated temperatures are required for the dehydrogenation process (Environmental Protection Agency (EPA), 1994). SNC is assumed to apply gas phase dehydrogenation technology.
Alternatively, a liquid phase technology for MEK manufacturing is also employed in Europe using Raney nickel or copper chromate at 150 oC, at atmospheric pressure (ICIS, 2019b).
The selectivity is typically three percent higher than the vapour phase process (Barnicki, 2012; Environmental Protection Agency (EPA), 1994). It also has a longer catalyst life, simpler product separation, and lower energy consumption than the vapour phase process (Environmental Protection Agency (EPA), 1994)
2.1.3 Acetone (DMK) processes route
At Shell Pernis Chemicals, the main feedstock to produce MIBK and DIBK is acetone supplied by a third party. MIBK is produced from acetone through a hydrogenation process with Diisobutyl ketone as by-product. The hydrogenation of (raw) MIBK is the process applied to manufacture methyl isobutyl carbinol (MIBC) (Shell, 2019f).
Figure 10 From DMK to MIBK, DIIBK and MIBC production routes
Methyl isobutyl ketone (MIBK) (4‐methyl‐2‐pentanone) is an industrially important solvent and chemical intermediate, and the third most produced acetone-derivative after methyl methacrylate and bisphenol-A. There are four different processes to produce MIBK: MIBK and DIBK can be co-produced by the catalysed reaction of hydrogen and acetone (DMK) and/or IPA. SNC currently does not apply IPA as feedstock. The other two routes are single or multi-step and multi-feed processes (Muthusamy & Fisher, 2019). The most commercial process with more than 60 percent of MIBK production is a three step process of aldol condensation of acetone and derivative intermediates diacetone alcohol and mesityl oxide (ICIS, 2019a), it implies the combination of three subprocesses such as condensation, dehydration and hydrogenation, and also separation and purification of intermediate
products (such as diacetone alcohol and mesityl oxide) to ultimately provide a relatively low conversion rate.
Hydrogenation is the main process unit used to manufacture MIBK and DIBK. Generally, the process involves elevated temperature and relatively high pressure in the presence of a catalyst (Speight, 2002). In hydrogenation processes, it is usually a best practice to heat the materials before they enter the reactor and have the reactor itself thermally insulated. Hydrogenation is usually an exothermic reaction, which requires temperature control (by heat removal) at the beginning of the reaction.
Di-isobutyl ketone (DIBK) is a heavy-end by-product of producing MIBK.Characterization of the production processes of MIBK/DIBK is deemed difficult since “The MIBK to DIBK ratio is
not constant and decreases as steps are taken to increase MIBK production by increasing reactant conversion” (Europe Patentnr. EP1931615A1, 2008). Additionally, the production
capacities tend to vary because some of the equipment used in the manufacture of MIBK can be used to manufacture other ketones as well.
The MIBK manufacturing process energy use is determined by the fuel required for heat generation and the energy required for compressors for the hydrogenation process (IHS-Markit, 2019 h; Speight, 2002).
2.1.4 Propylene Oxide Processing Routes
Ethylene oxide and mainly propylene oxide (also called epoxides) are processed in SNC– Pernis to manufacture glycol ethers through an etherification process using methanol, and depending upon the desired end product, ethanol might be added to the reaction. Epoxides may also follow a different production line for the manufacturing of polyols at the CVP location in the SNC-Pernis site as depicted in Figure 14.
Figure 11 From Propylene Oxide to Glycol Ethers and (SAN) Polyols
Epoxides etherification route to manufacture Glycol ethers
Glycol ethers are solvents that have been manufactured since the 1930’s. Glycol ethers are generally produced through the etherification of epoxides, there is a wide variety of this type of solvents because of the different proportion in which the epoxides can be mixed, in consequence, the end products (Glycol ethers) are classified in two groups depending upon the epoxide used for its production, namely E-series for ethylene based glycol ethers and P-series for those made out of propylene. The type of alcohol utilised, methanol or ethanol, also defines what type of glycol ether will be produced. For instance, the reaction of propylene oxide with methanol yields propylene glycol methyl ether (Barnicki, 2012).
SNC-Pernis produces glycol ethers and glycol ether acetates using propylene oxide (PO) as feedstock, which is manufactured by SNC-Moerdijk (Shell, 2019g). PO is added to an excess of alcohol in a reactor (methanol, ethanol). The process has two steps, reaction and
separation section. In a number of distillation towers, the reaction product is separated into mono or possibly di-propylene glycol ethers and heavy ends. The reaction conditions typically are in between 170 -220 °C and 1.0–1.5 MPa (10-15 bar) depending on the alcohol and epoxide. The etherification of an epoxide is an exothermic reaction, with an average heat of reaction of about -80 to -100 kJ/mole (Barnicki, 2012).
PO polymerisation for Polyether Polyols Manufacturing
Polyether polyols are manufactured in the CVP location through the catalytic polymerization of propylene oxide (PO)) and/or ethylene oxide (EO) (produced in SNC-Moerdijk). The most common catalyst is potassium hydroxide.
The process needs an initiator having active hydrogens, and a starter such as glycerine, sucrose, water, amines or mono-propylene glycol (MPG). SNC-Pernis has seven product lines for the manufacturing of different grades of polyols with specific applications based on their molecular weight.
Polyether polyols may be classified depending on their application in three main categories: coatings, adhesives, sealants and elastomers (CASE) polyols, flexible foams and rigid foams. CASE polyols are the result of the combination of mono propylene glycol and propylene oxide. Polyols for flexible foams are prepared by conducting a reaction of glycerine with propylene oxide (PO) and optionally, ethylene oxide (EO) or amine. Polyols for rigid foams are prepared by conducting a reaction of various basic raw materials, such as
trimethylolpropane or sucrose/sorbitol with propylene oxide (PO) (Ionescu, 2005). Recent research (Fernández-Dacosta, Stojcheva, & Ramirez, 2018) describes the
conventional polyether polyol manufacturing process as the reaction of propylene oxide (PO), glycerol (G) and mono-propylene glycol (MPG), equivalent to a CASE polyol, taking place at 135 °C and 3 bar. Double metal cyanide (DMC) is used as catalyst and recovered in a filter after the reaction. In a vacuum-stripping step (140 °C, 25 mbar) odours and other impurities are separated, and polyol is obtained as final product (40 °C, 1 bar). Figure 12 shows the process configuration.
Figure 12 Conventional CASE polyether polyol manufacturing process diagram (Fernández-Dacosta, Stojcheva, & Ramirez, 2018)
Propylene Polyether Polyols conversion to Styrene Acrylonitrile (SAN) Polymer Polyols
SAN Polymer production starts with the use of styrene, acrylonitrile and a macromer usually presented in the form of pellets or beads. Figure 13 shows a continues bulk polymerization process developed by Toyo Engineering Corp (Gulf Publishing Company, 2010). The temperature in the reactor is carefully monitored and kept constant in order to meet a steady flow condition. At the exit of the reactor, the mixture is preheated and transported to a devolatilizer in which the separation of volatile components from the polymer mix by evaporation under vacuum conditions occurs. Finally, a viscous liquid polymer is produced and delivered to clients. At Pernis the product is not extruded and cut into pellets.
Figure 13 SAN Polymer process developed by Toyo Engineering Corp (TOYO) (Gulf Publishing Company, 2010; Gulf Publishing Company, 2004)
At SNC-Pernis, the SAN beads are produced in a batch process with styrene, acrylonitrile, a catalyst and the stabilizer as ingredients, and polyol as solvent. Hereby the polymer is 'graved' on the stabilizer. If desired, the result can be diluted with extra polyol. The dilution process is quite critical, as a relatively high viscosity is required to improve the suspension stability but also should be low enough for processability. In order to minimise storage capacity requirements, Shell uses inline blending for all polyols. This means that the components are stored separately. The dosing pumps that assemble the end product also pump it directly into a tanker ship or a truck. Static mixers in the discharge pipes ensure the necessary mixing controlled by pumps and valves. The main application of SAN polyols is the manufacturing of flexible foam (C2W, 2020).
SAN polymer polyols manufacturing consumes more energy than the polyol manufacture itself. In the Shell process unconverted styrene and acrylonitrile need to be stripped off as they are toxic compounds in the end application. This stripping involves evaporation with steam of the unconverted compounds, and subsequent incineration with roof combustors. with steam.
2.2 Energy Consumption in SNC-Pernis manufacturing
plants
Chemicals production processes require the use of principal utilities such as electricity, heat and cooling water. Heat can be provided to reactors or distillation units in a direct or indirect manner, the former by using dedicated furnaces and boilers, and the latter through heat oil and steam distribution systems. Electricity is required by electrical compressors, pumps control systems and valves. Typically, these plants are part of an integrated petrochemical and /or refining complex where central facilities provide the common utilities (Falcke et al., 2017; Falbe & al, 2013).
SNC-Pernis receives energy in the form of electricity, heat and gas from the refinery. The adjacent refinery supplies heat in the form of steam and thermal oil. The refinery also supplies fuel gas to fire furnaces and incinerators Energy Consumption in SNC-Pernis manufacturing plants.
The energy consumption levels are highly dependent on the feedstock composition, specific processes design and the desirable products and by-products of the petrochemical process. The total energy use of SNC plants in 2015 and its allocation per manufactured product (or group of) was provided by the company, this information is presented in Table 3.
Table 3 SNC plants total energy use in 2015 per groups of manufactured products, calculated based on Shell information on shares
Main Process Main Product Total Energy
Use SNC-Pernis
Energy Use Product Share
(TJprimary/y) (%)
Distillation P-P splitter Propylene 221 5
Distillation and Hydrogenation
HCS 397 8
Propylene Hydration IPA 1,678 34
DMK Hydrogenation MIBK
DMK Hydrogenation DIBK 1,060 22
MIBK Hydrogenation MIBC
Propylene Oxide (PO) etherification
POGE’s Reaction of Isobutene and
Methanol
MTBE Sulphuric acid hydration
of n-butene
SBA 1,060 22
SBA dehydrogenation MEK
TOTAL COD LOCATION 4,416 90
Propylene Oxide (PO) polymerisation
Polyether Polyols 491 10
SAN Polymerisation SAN Polyols
TOTAL CVP LOCATION 491 10
TOTAL ENERGY USE SNC-PERNIS 2015 4,907 100
The highest energy demand is regarded to the processes occurring at the COD location. The processes represent about 90% of the yearly total energy consumption of the chemical plants operated by SNC-Pernis. More specifically, the IPA, MIBK, SBA and MEK
the major distillation processes for propylene and hydrocarbon solvents manufacturing, which together consume about 13%. MTBE, Glycol-Ethers, and MIBC processes require approximately a quarter of the annual energy use of the COD location. The polyether and SAN polyols production in the CVP location is estimated to consume around 10% of the total energy demand in SNC-Pernis plants. Total primary energy consumption of the SNC–Pernis facilities in 2015 was 4,907 TJprim. Table 4 provides a breakdown of the energy use in these plants in which steam and hot oil delivered by the refinery represent together about 75% of the total primary energy use in one year (SNC, 2019).
Table 4 Primary Energy Consumption in SNC 2015 – Pernis (SNC, 2019) Energy Carrier Consumption (TJ) Primary Energy Consumption (%) Primary Energy
Steam 3,125 64
Electricity 1,018 21
Hot oil 545 11
Fuel gas 219 4
Total 4,907 100
For energy efficiency improvement, Shell Pernis uses an Energy Management System that helps operators identify processes with low efficiency by highlighting the five largest causes of inefficiency at any given time. With the help of this monitoring system, operators can find solutions more effectively and with higher added value (Shell, 2019a).
2.3 Material and energy balances
The estimations of energy balances for each process in this section are the result of the combination of actual energy use data for SNC-Pernis processes in 2015 (Table 3) and literature values shown in Table 5.
Table 5 Theoretical energy consumption values per ton of product for relevant LVOC manufacturing processes
Main Process Main
Product (GJ/ton) Total (GJ/ton) Steam Electricity (GJ/ton) (GJ/ton) Fuel SOURCE
Distillation P-P splitter Propylene - - - - -
Distillation and
Hydrogenation HCS - - - - -
Propylene Hydration IPA 10.69 5.4 0.09 5.2 (Neelis, Patel, Blok,
Haije, & Bach, 2007b)
DMK Hydrogenation MIBK - - - - -
DMK Hydrogenation DIBK - - - - -
MIBK Hydrogenation MIBC - - - - -
Propylene Oxide (PO)
etherification POGE’s - - - - -
Reaction of Isobutene
and Methanol MTBE 3.66 3.6 0.06 0 Haije, & Bach, 2007b) (Neelis, Patel, Blok,
Sulphuric acid
hydration of n-butene SBA 12.65 12 0.65 0 (Streich, Geng, & Renger, 2016)
SBA dehydrogenation MEK 6.91 6 0.05 0.86 (Streich, Geng, &
Renger, 2016) Propylene Oxide (PO)
polymerisation Polyether Polyols 1.42 1.29 0.13 0 Haije, & Bach, 2007b) (Neelis, Patel, Blok,
SAN Polymerisation SAN
The energy data of the processes are divided in three categories: complete information, partial information and very limited information (Figure 14).
Figure 14 Selection of processes for energy and material balance estimations. Processes with complete information were calculated and checked against the actual values. When only partial information was available an estimation was performed. For the processes with very limited information about material flows and/or energy use, assumptions were made.
To calculate annual energy flows, it is necessary to combine literature values with an estimate of the produced mass in a year or mass flows. The core inputs for the material balance are: plants capacity (in Table 3), the main product yields and annual capacity utilisation rate. Table 6 indicates the products yields found in the literature.
Table 6 Main product yields found in literature Main Process Main Product Main Product
Yield (%)
SOURCE
Distillation P-P splitter Propylene 98-99.92 (Shell Global Solutions B.V., 2018)
Distillation and Hydrogenation
HCS 60-80 (SNC, 2019)
Propylene Hydration IPA 94 (Matar & Hatch, Chemistry of
Petrochemical Processes, 2000)
DMK Hydrogenation MIBK
DMK Hydrogenation DIBK
MIBK Hydrogenation MIBC
Propylene Oxide (PO) etherification
POGE’s Reaction of Isobutene
and Methanol
MTBE 83-98 (Gulf Publishing Company, 2004; Matar
& Hatch, 2000) Sulphuric acid
hydration of n-butene
SBA 30-90 (Environmental Protection Agency (EPA),
1994; Matar & Hatch, 2000)
SBA dehydrogenation MEK 85-98 (Environmental Protection Agency (EPA),
1994) Propylene Oxide (PO)
polymerisation
Polyether Polyols
SAN Polymerisation SAN Polyols - -
2 Purity of the split propylene. The feed from the refinery contains 60-95% propylene.
Com ple te In for m at ion •IPA •MTBE •SBA •MEK
•Polyols Partial
in
for
m
at
ion •SAN polyols •PP- splitter •HCS •MIBK Ve ry lim ited in for m at ion •DIBK •MIBC •PO Glycol Ethers
The results for the material balance are summarized Table 7. Note that the numbers represent tentative estimates, and do not represent actual realisations. The yields per process shown in table 7 fall within the theoretical yield ranges shown in table 6. It was assumed that the capacity of the plant expressed in kt of product per year already includes the product yield and high selectivity. Therefore, product yield data are used only for the feedstock requirements. For the capital utilisation rate, (Neelis, Patel, Blok, Haije, & Bach, 2007b) suggests a typical value of 86% for the plants in the Netherlands. Shell indicates lower utilisation rates for HCS and IPA, which are set at 70%. Based on the material balance estimates, the total net hydrogen use of SNC Pernis is calculated at 7 kt per year.
Table 7. Material flow of main products at SNC-Pernis in 20153 Main Product Capacity
[kt/year] Capacity utilisation rate [%] Annual Production (kt/y) Estimated yields [%] Main feedstock Feedstock use (kt/y) Propylene 280 86% 241 98% P-P-mix 3074
Various HC solvents 820 70% 574 95% HC's mix 604
Isopropyl Alcohol (IPA) 150 70% 105 94% Propylene 78 Methyl Isobutyl Ketone (MIBK) 35 86% 30 93% Acetone (DMK) 38 Di-isobutyl Ketone (DIBK) 5 86% 4.3 93% Acetone (DMK) 5.7 Methyl Isobutyl Carbinol (MIBC) 2.5 86% 2.2 93% MIBK 2.3 PO-Glycol ethers (POGE's) 247 86% 212 85% PO/EO 1505 Methyl Tertiary – Butyl ether (MTBE)
170 86% 146 99% Raffinate-1 946
Secondary Butyl Alcohol (SBA)
105 86% 90 80% Raffinate-2 85
Methyl Ethyl Ketone (MEK) 90 86% 77 90% SBA 88 Polyether Polyols 200 86% 172 90% PO 191 Styrene acrylonitrile (SAN) Polyols 50 86% 43 90% PO, SAN 48
Based on the Shell data in Table 3 and Table 4, literature values in Table 5 and the mass flows in Table 7, a further allocation of final energy consumption to specific processes is made. For electricity, final energy use is calculated based on a primary factor of 2.3 as used in current energy efficiency monitoring. Final electricity use is estimated at around 10% of total use, except for the P-P-splitter heat pump and the SAN polyol compounding, where a 60% share is estimated. Direct fuel use is only reported for the MEK furnaces. The results are presented in Table 9.
The IPA production process (hydration) is the process with the highest energy consumption, SBA’s manufacturing process (dehydrogenation) ranks in second place. MTBE synthesis ranks third closely followed by MEK’s production process (hydrogenation). These results are
3 Figures in bold style were estimated to match the annual energy use, based on literature review; Sources: Capacities (Shell, 2019c; Port of Rotterdam Authority, 2019) and Capacity Utilisation Rate (Neelis, Patel, Blok, Haije, & Bach, 2007b).
4 Assuming 80% propylene in the P-P-mix. 5 Plus 100 kt methanol and ethanol. 6 Plus 59 kt methanol.
expected according to the description of the process in the reviewed literature (Speight, 2002; Matar & Hatch, 2000).
Table 8 Calculated energy use per process and energy carrier
Main Process Main
Product Steam and hot oil [PJ] Fuel [PJ] Electricity final use [PJ] Total final energy use [PJ]
Distillation P-P splitter Propylene 0.04 - 0.08 0.12
Distillation (and
Hydrogenation) HCS 0.30 - 0.04 0.34
Propylene Hydration IPA 1.11 - 0.01 1.12
DMK Hydrogenation MIBK 0.41 - 0.06 0.47
DMK Hydrogenation DIBK 0.06 - 0.01 0.07
MIBK Hydrogenation MIBC 0.03 - 0.00 0.03
Propylene Oxide (PO) etherification
POGE’s 0.31 - 0.04 0.35
Reaction of Isobutene and Methanol
MTBE 0.53 - 0.01 0.54
Sulphuric acid hydration of
n-butene SBA 0.51 - 0.07 0.57
SBA dehydrogenation MEK 0.17 0.22 0.00 0.39
Polyether Polyols Polyether
Polyols
0.22 - 0.02 0.24
SAN Polymerisation SAN
Polyols
0.04 - 0.08 0.12
Totals 3.73 0.22 0.42 4.37
2.4 EU ETS carbon dioxide emissions
In the overall petrochemical complex, a large number of units within SNC-Pernis contribute to the carbon dioxide emissions. Energy requirements, raw material composition, use of auxiliary materials and their chemical reactions are among the factors influencing the CO2
emissions of the manufacturing process and energy use. SNC uses chemical gas for heat generation. Further, SNC Pernis operates incinerators and flares for combustion of unwanted residuals (Public Affairs department of Shell Nederland Raffinaderij B.V., 2003).
The direct CO2 emissions from processes mainly originate from the fuel-fired furnace
operation at the SBA/MEK production units. These are fired with residual gases from the C3
PP-splitter. Additionally, CO2 emissions may be generated by gas flaring, yet on a
non-regular basis, as flaring is only used in start-up /shut-down operations and in case of
equipment failures. The main objective of flaring is to prevent unburnt fuel gas from entering the atmosphere. This allow for a safe shutdown or maintenance of plants. Hence the
undesired gas is burned and emissions are released at a height to avoid any annoyance to the neighbourhoods surrounding the facilities (Public Affairs department of Shell Nederland Raffinaderij B.V., 2003). A report by the Dutch National Institute for Public Health and the Environment (RIVM) indicates “Shell's environmental annual report does report the CO
emissions from some incinerators and from the processes (flaring)” (Mennen, Mooij, & van
Dijk, 2008, p. 54), however, the breakdown of these figures is not publicly disclosed (Mennen, Mooij, & van Dijk, 2008). The total CO2 emissions reported by SNC-Pernis to the
Dutch Emission Authority in 2018 are 30,323 tonnes/y (Permit number NL-201100012). It is assumed based on the RIVM report that emissions from flaring and incinerators are included in these figures.
Typically, the fuel used in integrated petrochemicals complexes are “refinery” gas and/or “chemical waste” gas. Table 10 includes the energy content and CO2 emissions factors
extracted from the “list of fuels and standard CO2 emission factors” for The Netherlands
published by The Netherlands Enterprise Agency (RVO) in 2018, following the 2006 IPPC guidelines for Emissions estimations (Zijlema, 2018). These values are country specific (Zijlema, 2018), but actual values are site specific. It is assumed the SNC plants use a fuel with characteristics resembling refinery gas.
Table 9 Energy content and CO2 emissions factors of Gas fuels used in Dutch refineries and chemical plants. (Zijlema, 2018)
Fuel Net Calorific Values
(MJ/kg)
CO2 emission factors
(kg CO2/GJ)
Refinery Gas 45.2 67.0
Chemical Waste Gas 45.2 62.4
The emission for the SNC-Pernis site in 2015 are 27,193 ton as reported in the EU ETS repository (Nederlandse Emissieautoriteit, 2019). The calculated direct emissions from the MEK process furnaces amount to 14 kt. The remaining emissions as shown in Table 11 are assumed to represent the residuals incineration in roof combustors and flares.
Table 10 Calculated results for CO2 emissions
Process 2015 CO(kt/y) 2 emission
SBA dehydration (MEK production) 14
Incinerators and other sources 13.2
3 SNC-Pernis main
products and application
The majority of the products manufactured in SNC–Pernis are intermediates for the rest ofthe chemical industry. The main products are propylene, chemical solvents from propylene and butene streams, and propylene oxide derivates (such as glycol ethers and polyols). Hydrocarbon solvents are also manufactured in these facilities. All these materials are key building blocks for the chemical industry to manufacture everyday products. In some processes, additional raw materials are combined with the main feedstock. The process integration and optimization may allow for certain low value streams or by products “to be
processed into sealable co-products or utilized as feedstock or fuels, thus eliminating the need for disposal.” (Falcke, et al., 2017, p. 60). For example, hydrogen may be recycled to
be used as feedstock in the hydrogenation process or propane and butane can be used as fuel gas or commercialized as such. Table 11 provides an overview of main feedstocks and products, as well as additional raw materials and some of the by-products present in the 12 processes operated by SNC–Pernis.
Table 11 Overview of feedstock and products for SNC-Pernis processes
Process Main
Feedstock Additional Raw Materials Main Product By-Product
Distillation P-P splitter C37 /import8 Polymer grade
Propylene Propane Distillation and Hydrogenation GTL 9; Tops/Naphtha Kerosene Cuts 7
Hydrogen Various HC solvents
Propylene Hydration Propylene Water Isopropyl Alcohol (IPA)
DMK reaction DMK import10 Hydrogen Methyl Isobutyl Ketone
(MIBK) Water
DMK reaction DMK import10 Hydrogen Di-isobutyl Ketone
(DIBK) Water
MIBK hydrogenation MIBK Hydrogen Methyl Isobutyl
Carbinol (MIBC) Propylene Oxide (PO)
etherification PO Methanol; Ethanol Propylene Glycol ethers
Reaction of Isobutene
and Methanol Raffinate-17 Methanol Methyl Tertiary – Butyl ether (MTBE) Raffinate 2 (75% butenes)
Sulphuric acid
hydration of n-butene Raffinate 2 Water, Sulfuric Acid Secondary Butyl Alcohol (SBA) Butane
SBA dehydrogenation SBA Methyl Ethyl Ketone
(MEK) Hydrogen
Propylene Oxide (PO)
etherification PO/EO Glycerine (flexible and CASE) Polyether Polyols
PO Rigid Polyols
7 Export from SNR- Pernis, 86% butenes
8 Import refers to feedstock provided by an external supplier 9 Import Shell Qatar
SAN Polymerisation Flexible Polyols Macromer, Acrylonitrile, Styrene1
Styrene acrylonitrile Polymer Polyols
This chapter will describe the most common applications, properties, and market value of the feedstocks and products handled at SNC-Pernis. For the main feedstocks and a few products listed in this section, recent technical developments in production methods are briefly
described, since they may have an influence in current and future market trends. Commodity prices are also indicated for those substances for which publicly open data is found.
3.1 Feedstocks
As presented in Table 12, three of the chemical building blocks come from manufacturing processes in SNC-Moerdijk, namely Raffinate-1, ethylene oxide and propylene oxide (Wong & Van Dril, 2020). Raw materials come also from the GTL plant in Qatar, SNR and Rhineland refineries, among others for the production of polymer grade propylene and hydrocarbon solvents. The feedstock materials that have not been included in previous MIDDEN studies, more specifically DMK or acetone, products from the Qatar GTL plant and methanol are briefly described in the following sub-sections.
3.1.1 Dimethyl Ketone (DMK) or Acetone
Acetone is an organic compound and it is the simplest example of the ketones. It is a colourless, volatile flammable liquid that is miscible with water and has a pungent, irritating and presents a relatively sweet odour (IHS-Markit, 2019 a).
Main Production Methods
Acetone is produced directly or indirectly from propylene or as a by-product from phenol production. Approximately 83% of acetone in The Netherlands is produced via the cumene process, the most frequently used method worldwide (VNCI, 2019).
Main Applications
Acetone is a chemical intermediate in the manufacture of some polymers, high molecular glycol, chemical solvents as MIBK and alcohols (such as IPA). Acetone serves as an
important solvent itself of most plastic and synthetic fibres, paints and varnishes. It is widely used in the pharmaceutical industry, for medical and for cosmetic applications; it is also used as a food additive and for packaging. Acetone is a heavy-duty degreaser. Familiar household uses of acetone are as the active ingredient in nail polish remover and as paint thinner (Petrochemicals Europe, 2019) (VNCI, 2019a).
Market Value and trends
In the last three years, the global acetone demand has been driven mainly for use as a solvent and for the production of methyl methacrylate (MMA) and bisphenol A (BPA) (IHS-Markit, 2019 a). The production of solvents from acetone represented 26% of the total worldwide demand in 2016 (Centre for Industry Education Collaboration, University of York., 2019).
In 2015, the European market price for acetone varied from 500 to 800 EUR/tonne, the lowest value reached at the end of the year due to oversupply (ICIS - Chemical Business, 2017).
Hydrogen is a colourless and odourless gas at normal conditions, it is non-toxic and does not cause environmental damage, therefore it is considered environmentally neutral (Shell Deutschland Oil GmbH, 2017). The boiling point is low (–252.76 °C) at normal pressure (1.013 bar); this is close to the absolute zero temperature of –273.15 °C.
Hydrogen gas (H2) has the highest energy content of any common fuel by weight and its
combustion properties make hydrogen an interesting combustion fuel.
In 2018, nearly 96% of all hydrogen was derived from fossil fuels, natural gas being the most commonly used feedstock (representing 49%), followed by liquid hydrocarbons at 29% and coal at 18%. Four percent of the total hydrogen production came from electrolysis and as a by-product from sources of hydrogen (IHS-Markit, 2019 b).
Main Applications
In the chemical industry, hydrogen is a fundamental building block for the synthesis of ammonia, representing about 55% of the total 2016 worldwide hydrogen production, and also for the production of methanol (10%), which takes place by means of the catalytic hydrogenation of carbon monoxide (University of York Centre for Industry Education
Collaboration, York, UK., 2019; Hydrogen Europe, 2019). The processing of intermediate oil products is another hydrogen application which takes place in refineries (representing about 25%) whereas hydrogen is used to process crude oil into refined fuels, such as gasoline and diesel, and also for removing contaminants, such as Sulphur from these fuels. The remaining 10% of the global hydrogen production is used in the manufacturing of polymers and other applications, like hydrogenation for solvents at SNC Pernis (Hydrogen Europe, 2019). Approximately 75% of the hydrogen currently consumed worldwide by oil refineries is supplied by large hydrogen plants that generate hydrogen from natural gas or other hydrocarbon fuels.
Hydrogen is increasingly seen as energy carrier. Hydrogen is a highly efficient, low-polluting fuel that can be used for transportation, heating, and power generation whereas it is
challenging to use electricity. Hydrogen from different origins, either blue or green hydrogen, could replace natural gas in the future depending on multiple factors, such as economic, governmental policies, safety, infrastructure and market regulations. For energy purposes, hydrogen can help industrial and electricity generation sectors to decarbonize without the need to make major investments themselves (Mulder, Perey, & Moraga, 2019).
Market Value and trends
The industrial sector is both the main producer and consumer of hydrogen, with more than 90% of market share amongst the EU28, and a total consumption of 7 Mt (Fraile, Lanoix, Maio, Rangel, & Torres, 2015).
Recent growth in both hydrogen global and European markets is driven primarily by regulations pertaining to the desulfurization of fuel used in transportation (i.e. diesel), the growth in transportation fuels, and a decrease in the crude oil quality, requiring more hydrogen for processing. Likewise, hydrogen generation as a by-product from crude processing is also decreasing because of poor quality crudes. This has caused refineries to look for hydrogen availability from external sources that are set up on-site or adjacent to the refining facilities. (IHS-Markit, 2019 b). Another reason for the worldwide increase in
hydrogen demand in refineries is the increased oil consumption in developing economies such as China and India (Hydrogen Europe, 2019).“Overall global demand for hydrogen for
“conventional” industrial is expected to increase at a rate of around 4–5% per year during the next five years, primarily as a result of demand from petroleum refinery operations, and the production of ammonia and methanol” (IHS-Markit, 2019 b).
Hydrogen prices are mainly determined by large industrial actors and depend on the purity of the product and the relative physical location from the production site to the final consumer’s location. The larger dedicated production plants are often joint ventures of a producer and consumer. Prices in joint ventures are assumed to be cost based with commonly used margins. Currently, prices are set via net back gas and oil formulas.
3.1.3 Methanol
Methanol is a light, colourless, volatile and flammable liquid. It is miscible in water and presents a distinctive odour. Methanol is considered toxic for human consumption. The boiling point of Methanol at atmospheric pressure is 64.7 °C.
There are many production methods for methanol. It can be produced from coal, natural gas, coke-oven gas, hydrogen and biomass, among other feedstocks. The main commercial production method is from synthesis gas (carbon monoxide and hydrogen), “syngas” might be derived from oil, coal or, increasingly, biomass. The latter is becoming central to the development of biorefineries as an intermediate in the conversion of biomass to useful products. For more information on methanol, biorefineries and biofuels in the Netherlands please refer to the MIDDEN study Decarbonisation Options for The Dutch Biofuels Industry (Khandelwal & van Dril, 2020).
Main Applications
As a chemical intermediate, the most important application is for manufacturing of Polymers (PTA, a precursor of PET plastics), followed by MTBE synthesis, acetic acid, glycol ethers and formaldehyde. Within the everyday uses are windshield cleaning fluid, gas line antifreeze, perfumes, food warming fuel, coy machine or printer toners.
The use of methanol as fuel for cars has increased rapidly in recent years, either as a liquid fuel or mixed with petrol in internal combustion engines cars. In China, a mix of 15 % methanol to petrol is used in cars without engine modification. A larger concentration (85%) of methanol (M85) can be used in vehicles with modified engines. The use of methanol as a fuel in China showed an annual increase of 25% annually from 2000 to 2015. (Centre for Industry Education Collaboration, University of York., 2019). In more recent developments, methanol is used in direct methanol fuel cells or, after reforming, in Proton-exchange Membrane (PEM) fuel cells also for mobility purposes. Moreover, fuel additives are produced from methanol, and it is used to trans-esterify vegetable oils to form methyl esters
(biodiesel) (Hydrogen Europe, 2019). Market Value and trends
Methanol is among the top five chemical commodities in the chemical sector. In between 2012 and 2017, world capacity for methanol expanded at an average rate of almost 5% per year, driven by new plants built in Northeast Asia. China alone accounted for 75% of the new additions over the same time period. The overall market expanded at an average rate of 6.5% per year over the last five years.
Despite the demand reduction of methanol for fuel applications, overall, the global demand increased mainly due to expansions in China in the methanol-to-olefins (MTO)/methanol-to-propylene (MTP) sector, which is the fastest growing downstream application. Other
relatively new applications include dimethyl ether (DME) and fuel blending (IHS-Markit, 2019 c).
Over the next three years, methanol consumption is expected to grow further, albeit at a slower average rate of about four percent per year. The continuing development of MTO/MTP