Total greenhouse gas (GHG) emissions from the Netherlands in 2016 increased by approximately 0.4%, compared with 2015 emissions. This increase was mainly the result of increased natural gas consumption for space heating. On the other hand, the emission of electricity production has declined.
In 2016, total GHG emissions (including indirect CO2 emissions and excluding emissions from Land use, land use change and forestry (LULUCF)) in the Netherlands amounted to 195.2 Tg CO2 eq. This is approximately 12.4% below the emissions in the base years1 (222.9 Tg CO2 eq.).
CO2 emissions were still above the level in the base year in 2016 (+1.8%). This increase was offset by the reduction since 1990 in emissions of methane, nitrous oxide and fluorinated gases (CH4, N2O and F-gases). This report documents the Netherlands’ annual submission for 2018 of its GHG emissions inventory in accordance with the 2006 IPCC Guidelines for National Greenhouse Gas Inventories (IPCC, 2006) provided by the United Nations Framework Convention on Climate Change (UNFCCC), the Kyoto Protocol (KP) and the European Union’s Greenhouse Gas Monitoring Mechanism.
The report includes explanations of observed trends in emissions; an assessment of the sources with the highest contribution to total national emissions (key sources) and the uncertainty in their emissions; an itemization of methods, data sources and emission factors (EFs) applied; and a description of the quality assurance system and the verification activities performed on the data.
1 1990 for CO
2, CH4 and N2O and 1995 for F-gases.
P.W.H.G. Coenen | M. van Zanten | P.J. Zijlema | E.J.M.M. Arets |
K. Baas | A.C.W.M. van den Berghe | E.P. van Huis | G. Geilenkirchen | M. ’t Hoen | M. Hoogsteen | R. te Molder | R. Dröge1 | J.A. Montfoort | C.J. Peek | J. Vonk | S. Dellaert | W.W.R. Koch
Greenhouse
Gas Emissions
in the Netherlands
1990-2016
National Inventory Report 2018
Committed to
health and sustainability
Published by:
National Institute for Public Health and the Environment
P.O. Box 1 | 3720 BA Bilthoven The Netherlands www.rivm.nl/en April 2018 RIVM Report 2018-0006 in the Netherlands 1990-2016
Greenhouse gas emissions in
the Netherlands 1990–2016
National Inventory Report 2018
Colophon
© RIVM 2018
National Institute for Public Health and the Environment (RIVM), P.O. Box 1, 3720 BA Bilthoven, Netherlands; Tel: +31-30-274 91 11; Fax: +31-30-278 75 31; www.rivm.nl/en.
Parts of this publication may be reproduced, provided acknowledgement is given to the ‘National Institute for Public Health and the Environment’, along with the title and year of publication.
DOI 10.21945/RIVM-2018-0006
P.W.H.G. Coenen1, M.C. van Zanten, P.J. Zijlema2, E.J.M.M. Arets6,
K. Baas3, A.C.W.M. van den Berghe7, E.P. van Huis4,
G. Geilenkirchen5, M. ’t Hoen5, M. Hoogsteen, R. te Molder, R. Dröge1,
J.A. Montfoort, C.J. Peek, J. Vonk, S. Dellaert1, W.W.R. Koch1
1 Netherlands Organization for Applied Scientific Research (TNO), P.O.
Box 80015, NL-3508 TA Utrecht
2 Netherlands Enterprise Agency (RVO.nl), P.O. Box 8242, NL-3503 RE
Utrecht
3 Statistics Netherlands (in Dutch: ‘Centraal Bureau voor de Statistiek’,
CBS), P.O. Box 24500, NL-2490 HA Den Haag
4 Dutch Emissions Authority (NEa), P.O. Box 91503, NL-2509 EC Den
Haag
5 PBL Netherlands Environmental Assessment Agency, P.O. Box 30314
NL-2500 GH Den Haag
6 Wageningen Environmental Research (Alterra) Wageningen UR, P.O.
Box 47 NL-6700 AA Wageningen
7 Rijkswaterstaat, P.O. Box 8242, NL-3503 RE Utrecht
Contacts:
Margreet van Zanten (RIVM) (margreet.van.zanten@rivm.nl)
Peter Zijlema (NIE / Netherlands Enterprise Agency (RVO.nl)) (Peter.Zijlema@rvo.nl)
This report has been compiled by order and for the account of the
Directorate-General for the Environment and International Affairs, within the framework of the project Emission Registration M/240037/15/NI, ‘Netherlands Pollutant Release & Transfer Register’. Report prepared for submission in accordance with the United Nations Framework
Convention on Climate Change (UNFCCC) and the European Union’s Greenhouse Gas Monitoring Mechanism [including electronic Common Reporting Format (CRF) Excel spreadsheet files containing the data for 1990 to 2016].
This is a publication of:
National Institute for Public Health and the Environment
P.O. Box 1 | 3720 BA Bilthoven The Netherlands
Acknowledgements
Many colleagues from a number of organizations (Statistics Netherlands (CBS), Wageningen University and Research (WUR), Netherlands
Enterprise Agency (RVO.nl), PBL Netherlands Environmental Assessment Agency, RIVM and TNO) have been involved in the annual update of the Netherlands Pollutant Release & Transfer Register (PRTR), also called the Emission Registration (ER) system, which contains emissions data on about 350 pollutants. The emissions calculations, including those for greenhouse gas (GHG) emissions, are performed by members of the ER Task Forces. This is a major task, since the Netherlands’ inventory contains details of many emissions sources.
The emissions and activity data of the Netherlands’ inventory were converted into the IPCC1 source categories contained in the Common
Reporting Format (CRF) tables, which form a supplement to this report. The description of the various sources, the analysis of trends and the uncertainty estimates (see Chapters 3 to 8) were made in cooperation with the following emissions experts: Eric Arets (KP and Land use), Guus van den Berghe (Waste), Jan-Peter Lesschen, Mart-Jan Schelhaas, Geerten Hengeveld and Peter Kuikman (Land use), Gerben
Geilenkirchen and Maarten ‘t Hoen (Transport), Romuald te Molder (key sources), Rianne Dröge (Energy and uncertainty assessment), Johanna Montfoort (Fugitive emissions), Kees Peek (Industrial processes and product use, data control, chart production), Kees Baas (Wastewater handling) and Jan Vonk and Sietske van der Sluis (Agriculture). In addition, Bas Guis provided pivotal information on CO2 emissions related
to energy use. This group also provided activity data and additional information for the CRF tables in cases where these were not included in the data sheets submitted by the ER Task Forces. We are particularly grateful to Bert Leekstra and Dirk Wever for their contributions to data processing, chart production and quality control.
We greatly appreciate the contributions of each of these groups and individuals to this National Inventory Report and supplemental CRF tables, as well as those of the external reviewers who provided comments on the draft report.
Synopsis
Greenhouse gas emissions in the Netherlands 1990–2016 Total greenhouse gas (GHG) emissions in the Netherlands in 2016 increased by approximately 0.2%, compared with 2015 emissions. This increase was mainly the result of increased natural gasconsumption for space heating. On the other hand, the emission of electricity production has declined.
In 2016, total GHG emissions (including indirect CO2 emissions and
excluding emissions from Land use, land use change and forestry (LULUCF)) in the Netherlands amounted to 195.2 Tg CO2 eq. This is
approximately 12.4% below the emissions in the base year2 (222.9 Tg
CO2 eq.).
CO2 emissions in 2016 were still above the level in the base year
(+1.6%). This increase was offset by the reduction since 1990 in emissions of methane, nitrous oxide and fluorinated gases (CH4, N2O
and F-gases).
This report documents the Netherlands’ annual submission for 2018 of its GHG emissions inventory in accordance with the 2006 IPCC
Guidelines for National Greenhouse Gas Inventories (IPCC, 2006) provided by the United Nations Framework Convention on Climate Change (UNFCCC), the Kyoto Protocol (KP) and the European Union’s Greenhouse Gas Monitoring Mechanism.
The report includes explanations of observed trends in emissions; an assessment of the sources with the highest contribution to total national emissions (key sources) and the uncertainty in their emissions; an itemization of methods, data sources and emission factors (EFs) applied; and a description of the quality assurance system and the verification activities performed on the data.
Keywords: greenhouse gases, emissions, trends, methodology, climate
2 1990 for CO
Publiekssamenvatting
Emissies van broeikasgassen tussen 1990 en 2016
In 2016 is de totale uitstoot van broeikasgassen van Nederland met ongeveer 0,2 procent gestegen ten opzichte van de uitstoot in 2015. Deze stijging komt vooral doordat er meer aardgas is verbruikt om ruimtes te verwarmen. Daarentegen staat dat de uitstoot van de electriciteitsproductie is afgenomen.
De totale uitstoot van broeikasgassen naar de lucht wordt uitgedrukt in CO2-equivalenten en bedroeg in 2016 195,2 miljard kilogram. Ten
opzichte van het zogeheten Kyoto-basisjaar (222,9 miljard kilogram CO2-equivalenten) is dit een afname van ongeveer 12,4 procent. Dit
basisjaar, dat afhankelijk van het broeikasgas 1990 of 1995 is, dient voor het Kyoto Protocol als referentiejaar voor de uitstoot van broeikasgassen.
De emissie van CO2 lag in 2014 voor het eerst onder het niveau van het
basisjaar 1990. Sindsdien is de CO2-uitstoot toegenomen met circa 5
procent en komt hij boven het niveau van het basisjaar 1990 (+1,6 procent) te liggen. Deze toename werd voor de totale emissie van broeikasgassen ruim gecompenseerd door de lagere emissies van methaan, distikstofoxide en gefluoreerde gassen (CH4, N2O en
F-gassen).
Dit blijkt uit een inventarisatie van broeikasgasemissies die het RIVM jaarlijks op verzoek van het ministerie van Economische Zaken en Klimaat (EZK) opstelt. Met deze inventarisatie voldoet Nederland aan de nationale rapportageverplichtingen voor 2018 van het Klimaatverdrag van de Verenigde Naties (UNFCCC), van het Kyoto Protocol en van het Bewakingsmechanisme Broeikasgassen van de Europese Unie.
De inventarisatie bevat verder trendanalyses voor de uitstoot van broeikasgassen in de periode 1990-2016, een analyse van belangrijkste emissiebronnen (‘sleutelbronnen’), evenals de onzekerheid in hun emissies. Daarnaast zijn in de inventarisatie de gebruikte
berekeningsmethoden beschreven, evenals databronnen en gebruikte emissiefactoren. Ten slotte bevat het een overzicht van het
kwaliteitssysteem en de validatie van de emissiecijfers door de Nederlandse Emissieregistratie.
Contents
Samenvatting — 17 Executive summary — 21 Part I: Annual inventory report — 31
1 Introduction — 33
1.1 Background information on greenhouse gas inventories and climate change — 33
1.2 A description of the national inventory arrangements — 35 1.2.1 Institutional, legal and procedural arrangements — 35
1.2.2 Overview of inventory planning, preparation and management — 36 1.2.3 Reporting, QA/QC, archiving and overall coordination — 37
1.3 Inventory preparation; data collection, processing and storage — 44 1.3.1 GHG and KP-LULUCF inventory — 44
1.3.2 Data collection — 45
1.3.3 Data processing and storage — 47
1.4 General description of methodologies (including tiers used) and data sources used — 48
1.4.1 GHG emissions inventory — 48 1.4.2 Data sources — 51
1.4.3 KP-LULUCF inventory — 52
1.5 Brief description of key categories — 52 1.5.1 GHG emissions inventory — 52
1.5.2 KP-LULUCF inventory — 53
1.6 General uncertainty evaluation, including data on the overall uncertainty of the inventory totals — 53
1.6.1 GHG emissions inventory — 53 1.6.2 KP-LULUCF inventory — 58
1.7 General assessment of completeness — 59 1.7.1 GHG emissions inventory — 59
1.7.2 KP-LULUCF inventory — 59
2 Trends in GHG emissions — 61
2.1 Emissions trends for aggregated GHG emissions — 61 2.2 Emissions trends by gas — 61
2.2.1 Carbon dioxide — 61 2.2.2 Methane — 62 2.2.3 Nitrous oxide — 63 2.2.4 Fluorinated gases — 63
2.2.5 Uncertainty in emissions specified by greenhouse gas — 64 2.3 Emissions trends by source category — 64
2.3.1 Uncertainty in emissions by sector — 65
2.4 Emissions trends for indirect greenhouse gases and SO2 — 65
3 Energy (CRF sector 1) — 67
3.1 Overview of sector — 67
3.1.1 GHG emissions from the Energy sector — 69 3.2 Fuel combustion (1A) — 73
3.2.3 Feed stocks and non-energy use of fuels — 77 3.2.4 Energy industries (1A1) — 77
3.2.5 Manufacturing industries and construction (1A2) — 86 3.2.6 Transport (1A3) — 102
3.2.7 Other sectors (1A4) — 121 3.2.8 Other (1A5) — 129
3.3 Fugitive emissions from fuels (1B) — 129 3.3.1 Solid fuels (1B1) — 130
3.3.2 Oil and natural gas (1B2) — 131 3.4 CO2 transport and storage (1C) — 134
3.5 International bunker fuels (1D) — 135
4 Industrial processes and product use (CRF sector 2) — 137
4.1 Overview of sector — 137 4.2 Mineral products (2A) — 141 4.2.1 Category description — 141 4.2.2 Methodological issues — 142
4.2.3 Uncertainties and time series consistency — 145 4.2.4 Category-specific QA/QC and verification — 146 4.2.5 Category-specific recalculations — 146
4.2.6 Category-specific planned improvements — 148 4.3 Chemical industry (2B) — 149
4.3.1 Category description — 149 4.3.2 Methodological issues — 155
4.3.3 Uncertainty and time series consistency — 157 4.3.4 Category-specific QA/QC and verification — 158 4.3.5 Category-specific recalculations — 158
4.3.6 Category-specific planned improvements — 158 4.4 Metal production (2C) — 158
4.4.1 Category description — 158 4.4.2 Methodological issues — 160
4.4.3 Uncertainty and time series consistency — 161 4.4.4 Category-specific QA/QC and verification — 161 4.4.5 Category-specific recalculations — 161
4.4.6 Category-specific planned improvements — 162
4.5 Non-energy products from fuels and solvent use (2D) — 162 4.5.1 Category description — 162
4.5.2 Methodological issues — 162
4.5.3 Uncertainty and time series consistency — 163 4.5.4 Category-specific QA/QC and verification — 163 4.5.5 Category-specific recalculations — 163
4.5.6 Category-specific planned improvements — 163 4.6 Electronics industry (2E) — 163
4.6.1 Category description — 163 4.6.2 Methodological issues — 164
4.6.3 Uncertainty and time series consistency — 164 4.6.4 Category-specific QA/QC and verification — 164 4.6.5 Category-specific recalculations — 164
4.6.6 Category-specific planned improvements — 164 4.7 Product use as substitutes for ODS (2F) — 164 4.7.1 Category description — 164
4.7.2 Methodological issues — 166
4.7.3 Uncertainty and time series consistency — 166 4.7.4 Category-specific QA/QC and verification — 167
4.7.5 Category-specific recalculations — 167
4.7.6 Category-specific planned improvements — 169 4.8 Other product manufacture and use (2G) — 169 4.8.1 Category description — 169
4.8.2 Methodological issues — 170
4.8.3 Uncertainty and time series consistency — 172 4.8.4 Category-specific QA/QC and verification — 172 4.8.5 Category-specific recalculations — 172
4.8.6 Category-specific planned improvements — 172 4.9 Other (2H) — 172
4.9.1 Category description — 172 4.9.2 Methodological issues — 173
4.9.3 Uncertainty and time series consistency — 173 4.9.4 Category-specific QA/QC and verification — 173 4.9.5 Category-specific recalculations — 173
4.9.6 Category-specific planned improvements — 173
5 Agriculture (CRF sector 3) — 175
5.1 Overview of the sector — 176 5.2 Enteric fermentation (3A) — 181 5.2.1 Category description — 181 5.2.2 Methodological issues — 181
5.2.3 Uncertainty and time series consistency — 185 5.2.4 Category-specific QA/QC and verification — 185 5.2.5 Category-specific recalculations — 185
5.2.6 Category-specific planned improvements — 185 5.3 Manure management (3B) — 186
5.3.1 Category description — 186 5.3.2 Methodological issues — 186
5.3.3 Uncertainty and time series consistency — 191 5.3.4 Category-specific QA/QC — 191
5.3.5 Category-specific recalculations — 191
5.3.6 Category-specific planned improvements — 191 5.4 Agricultural soils (3D) — 192
5.4.1 Category description — 192 5.4.2 Methodological issues — 192
5.4.3 Uncertainty and time series consistency — 197 5.4.4 Category-specific QA/QC — 197
5.4.5 Category-specific recalculations — 197
5.4.6 Category-specific planned improvements — 198 5.5 Liming (3G) — 198
5.5.1 Category description — 198
5.5.3 Uncertainty and time series consistency — 199 5.5.4 Category-specific QA/QC and verification — 199 5.5.5 Category-specific recalculations — 199
5.5.6 Category-specific planned improvements — 199
6 Land use, land use change and forestry (CRF sector 4) — 201
6.1 Overview of sector — 202
6.2 Land use definitions and classification systems — 208 6.3 Representation of land areas and land use databases — 211 6.4 Forest land (4A) — 214
6.4.1 Description — 214
6.4.3 Uncertainties and time series consistency — 221 6.4.4 Category-specific QA/QC and verification — 223 6.4.5 Category-specific recalculations — 223
6.4.6 Category-specific planned improvements — 223 6.5 Cropland (4B) — 223
6.5.1 Description — 223
6.5.2 Methodological issues — 224
6.5.3 Uncertainties and time series consistency — 224 6.5.4 Category-specific QA/QC and verification — 224 6.5.5 Category-specific recalculations — 224
6.5.6 Category-specific planned improvements — 224 6.6 Grassland (4C) — 225
6.6.1 Description — 225
6.6.2 Methodological issues — 226
6.6.3 Uncertainties and time series consistency — 228 6.6.4 Category-specific QA/QC and verification — 229 6.6.5 Category-specific recalculations — 229
6.6.6 Category-specific planned improvements — 229 6.7 Wetland (4D) — 229
6.7.1 Description — 229
6.7.2 Methodological issues — 230
6.7.3 Uncertainties and time series consistency — 230 6.7.4 Category-specific QA/QC and verification — 230 6.7.5 Category-specific recalculations — 230
6.7.6 Category-specific planned improvements — 230 6.8 Settlements (4E) — 230
6.8.1 Description — 230
6.8.2 Methodological issues — 231
6.8.3 Uncertainties and time series consistency — 231 6.8.4 Category-specific QA/QC and verification — 231 6.8.5 Category-specific recalculations — 232
6.8.6 Category-specific planned improvements — 232 6.9 Other land (4F) — 232
6.9.1 Description — 232
6.9.2 Methodological issues — 232
6.9.3 Uncertainties and time series consistency — 232 6.9.4 Category-specific QA/QC and verification — 233 6.9.5 Category-specific recalculations — 233
6.9.6 Category-specific planned improvements — 233 6.10 Harvested wood products (4G) — 233
6.10.1 Description — 233
6.10.2 Methodological issues — 233
6.10.3 Uncertainties and time series consistency — 235 6.10.4 Category-specific QA/QC and verification — 235 6.10.5 Category-specific recalculations — 235
6.10.6 Category-specific planned improvements — 235
7 Waste (CRF sector 5) — 237
7.1 Overview of sector — 237
7.2 Solid waste disposal on land (5A) — 239 7.2.1 Category description — 239
7.2.2 Methodological issues — 240
7.2.3 Uncertainty and time series consistency — 245 7.2.4 Category-specific QA/QC and verification — 246
7.2.5 Category-specific recalculations — 246
7.2.6 Category-specific planned improvements — 246 7.3 Biological treatment of solid waste (5B) — 246 7.3.1 Category description — 246
7.3.2 Methodological issues — 246
7.3.3 Uncertainty and time series consistency — 247 7.3.4 Category-specific QA/QC and verification — 247 7.3.5 Category-specific recalculations — 247
7.3.6 Category-specific planned improvements — 248 7.4 Waste incineration (5C) — 248
7.4.1 Category description — 248 7.4.2 Methodological issues — 248
7.4.3 Uncertainty and time series consistency — 249 7.4.4 Category-specific QA/QC and verification — 249 7.4.5 Category-specific recalculations — 249
7.4.6 Category-specific planned improvements — 249 7.5 Wastewater handling (5D) — 250
7.5.1 Category description — 250 7.5.2 Methodological issues — 251
7.5.3 Uncertainty and time series consistency — 257 7.5.4 Category-specific QA/QC and verification — 258 7.5.5 Category-specific recalculations — 258
7.5.6 Category-specific planned improvements — 259
8 Other (CRF sector 6) — 261
9 Indirect CO2 and NO2 emissions — 263
9.1 Description of sources — 263 9.2 Methodological issues — 263
9.3 Uncertainties and time series consistency — 263 9.4 Category-specific QA/QC and verification — 263 9.5 Category-specific recalculations — 263
9.6 Category-specific planned improvements — 264
10 Recalculations and improvements — 265
10.1 Explanation of and justification for the recalculations — 265 10.1.1 GHG emissions inventory — 265
10.1.2 KP-LULUCF inventory — 267
10.2 Implications for emissions levels — 267 10.2.1 GHG emissions inventory — 267
10.2.2 KP-LULUCF inventory — 269
10.3 Implications for emissions trends, including time series consistency — 269
10.3.1 GHG emissions inventory — 269 10.3.2 KP-LULUCF inventory — 271
10.4 Recalculations, response to the review process and planned improvements — 271
10.4.1 GHG emissions inventory — 271 10.4.2 KP-LULUCF inventory — 295
Part ll: Supplementary information required under Article 7, paragraph 1 — 297
11 KP-LULUCF — 299
11.1 General information — 299
11.1.1 Definition of forest and any other criteria — 299
11.1.2 Elected activities under Article 3, paragraph 4 of the Kyoto Protocol — 300
11.1.3 Description of how the definitions of each activity under Article 3.3 and each mandatory and elected activity under Article 3.4 have been implemented and applied consistently over time — 300
11.1.4 Description of precedence conditions and/or hierarchy among Article 3.4 activities and how they have been consistently applied in determining how land was classified — 301
11.2 Land-related information — 301
11.2.2 Methodology used to develop the land transition matrix — 301
11.2.3 Maps and/or database to identify geographical locations and the system of identification codes for geographical locations — 303
11.3 Activity-specific information — 305
11.3.1 Methods for carbon stock change and GHG emissions and removal estimates — 305
11.3.2 Changes in data and methods since the previous submission (recalculations) — 313
11.3.3 Uncertainty estimates — 314
11.3.4 Information on other methodological issues — 314 11.3.5 The year of the onset of an activity, if after 2013 — 314 11.4 Article 3.3 — 315
11.4.1 Information that demonstrates that activities under Article 3.3 began on or after 1 January 1990 and before 31 December 2020 and are directly human-induced — 315
11.4.2 Information on how harvesting or forest disturbance that is followed by the re-establishment of forest is distinguished from deforestation — 315 11.4.3 Information on the size and geographical location of forest areas that
have lost forest cover but are not yet classified as deforested — 315 11.4.4 Information related to the natural disturbances provision under Article
3.3 — 315
11.4.5 Information on harvested wood products under Article 3.3 — 318 11.5 Article 3.4 — 319
11.5.1 Information that demonstrates that activities under Article 3.4 have occurred since 1 January 1990 and are human-induced — 319 11.5.2 Information relating to Forest management — 319
11.6 Other information — 320
11.6.1 Key category analysis for Article 3.3 activities and any mandatory and elected activities under Article 3.4 — 320
11.7 Information relating to Article 6 — 321
12 Information on accounting of Kyoto units — 323
12.1 Information on accounting of Kyoto units 2016 — 323 12.1.1 Background information — 323
12.1.2 Summary of information reported in the SEF tables — 323 12.1.3 Discrepancies and notifications — 323
12.1.4 Publicly accessible information — 324
12.1.5 Calculation of the commitment period reserve (CPR) — 325 12.1.6 KP-LULUCF accounting — 325
12.1.7 Carry-over and PPSR — 325
13 Information on changes in the National System — 327
14 Information on changes in national registry — 329
14.1 Changes to national registry in 2017 — 329
15 Information on minimization of adverse impacts in accordance
with Article 3, paragraph 14 — 331 Annex 1 Key categories — 335
Annex 2 Assessment of uncertainty — 363
Annex 3 Detailed methodological descriptions of individual sources or sink categories — 372
Annex 4 CO2 : the national energy balance for the most recent
inventory year — 373
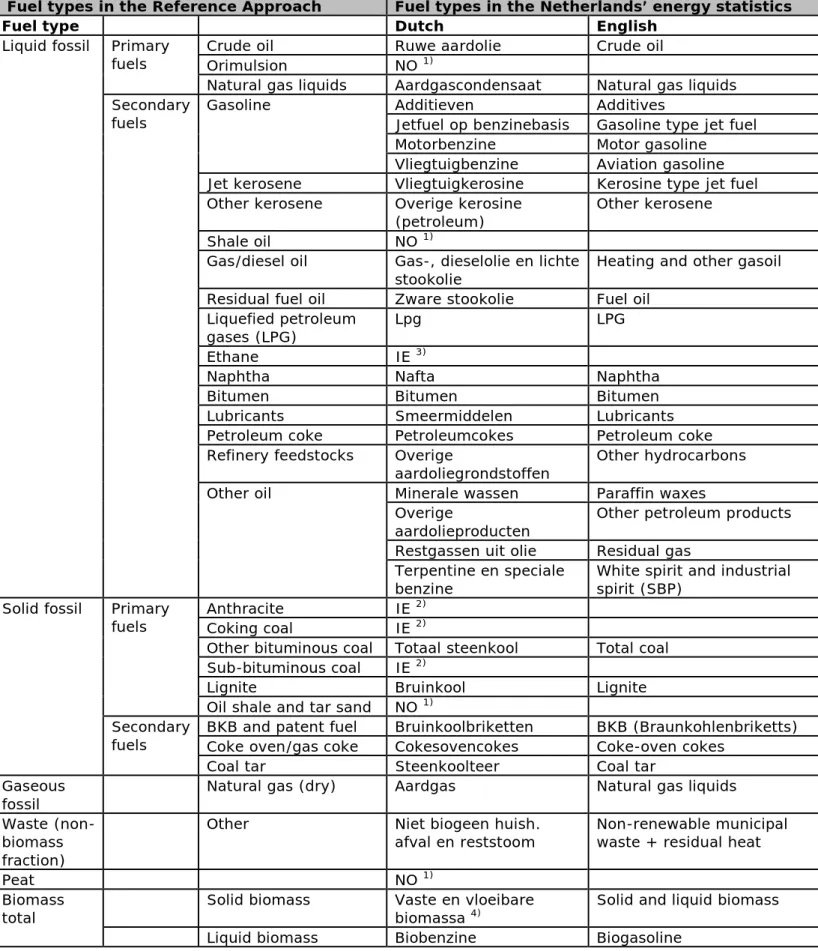
Annex 5 The Netherlands’ fuel list, version January 2018 — 380 Notes on the fuel list — 384
Annex 6 Assessment of completeness and (potential) sources and sinks — 389
Annex 7 Additional information to be considered as part of the NIR submission — 391
Annex 8 Chemical compounds, GWP, units and conversion factors — 392
Annex 9 List of abbreviations — 395 References — 398
Samenvatting
Het National Inventory Report (NIR) 2018 bevat de rapportage van broeikasgasemissies (CO2, N2O, CH4 en de F-gassen) over de periode
1990 tot en met 2016. De emissiecijfers in de NIR 2018 zijn berekend volgens de methoderapporten behorend bij het ‘National System’ dat is voorgeschreven in het Kyoto Protocol. In de methoderapporten zijn de berekeningswijzen vastgelegd voor zowel het basisjaar (1990 voor CO2,
CH4 en N2O en 1995 voor de F-gassen) als voor de emissies in de
periode tot en met 2016. De methoderapporten zijn opgenomen in Annex 7 en ook elektronisch beschikbaar op de website
http://www.rvo.nl/nie
National Inventory Report (NIR)
Dit rapport over de Nederlandse inventarisatie van broeikasgasemissies is op verzoek van het ministerie van Economische Zaken en Klimaat (EZK) opgesteld om te voldoen aan de nationale
rapportageverplichtingen in 2018 van het Klimaatverdrag van de Verenigde Naties (UNFCCC), het Kyoto Protocol en het
Bewakingsmechanisme Broeikasgassen van de Europese Unie. De emissies in dit rapport zijn berekend conform de
rapportagerichtlijnen van de UNFCCC en de 2006 IPCC Richtlijnen voor Nationale Broeikasgassen Inventarisatie3.
Dit rapport bevat de volgende informatie:
• trendanalyses voor de emissies van broeikasgassen in de periode 1990-2016;
• een analyse van zogenaamde sleutelbronnen en de onzekerheid in hun emissies volgens de ‘Benadering 1’-methodiek van de 2006 IPCC Richtlijnen;
• documentatie van gebruikte berekeningsmethoden, databronnen en toegepaste emissiefactoren;
• een overzicht van het kwaliteitssysteem en de validatie van de emissiecijfers voor de Nederlandse EmissieRegistratie;
• overzicht van de herberekeningen van de broeikasgasemissies als gevolg van de meest recente wijzigingen in de
berekeningsmethoden.
De NIR bevat ook de informatie die voorgeschreven is volgens artikel 7 van het Kyoto Protocol (deel 2 van dit rapport). Hiermee voldoet
Nederland aan alle rapportagerichtlijnen van de UNFCCC.
Een losse annex bij dit rapport bevat elektronische data over emissies en activiteit data in het zogenaamde Common Reporting Format (CRF), waar door het secretariaat van het VN-Klimaatverdrag om wordt
verzocht. In een aparte annex worden vanaf 2018 ook de methodiek rapporten meegeleverd. In de bijlagen bij dit rapport is onder meer een overzicht van sleutelbronnen en onzekerheden in de emissie
opgenomen.
3 Tot en met de NIR 2014 werden de emissies volgens richtlijnen uit 1996 berekend. Door de definitieverschillen zijn de cijfers uit de rapportages van vóór 2015 en deze NIR niet vergelijkbaar
De NIR gaat niet specifiek in op de invloed van het gevoerde
overheidsbeleid op de emissies van broeikasgassen; meer informatie hierover is te vinden in de Balans van de Leefomgeving 2016 (opgesteld door het Planbureau voor de Leefomgeving, PBL), de zevende Nationale Communicatie onder het Klimaatverdrag (NC7; EZK, 2017) en de derde Tweejaarlijkse Voortgangsrapportage (BR3; EZK, 2017).
Figuur ES.1 Broeikasgassen: emissieniveaus en emissietrends (exclusief LULUCF), 1990-2016.
Ontwikkeling van de broeikasgasemissies
De emissieontwikkeling in Nederland wordt beschreven en toegelicht in dit Nationale Inventarisatie Rapport. Figuur ES.1 geeft het
emissieverloop over de periode 1990-2016 weer. De totale emissies bedroegen in 2016 circa 195,2 Tg (Mton ofwel miljard kg) CO2
equivalenten en zijn daarmee circa 12,4 procent afgenomen in
vergelijking met de emissies in het basisjaar (222,9 Tg CO2 eq). De hier
gepresenteerde emissies zijn inclusief de indirecte CO2 emissies en
exclusief de emissies van landgebruik en bossen (LULUCF).
De emissie van CO2 is sinds 1990 met circa 1,6 procent toegenomen, de
emissies van de andere broeikasgassen zijn met circa 50 procent afgenomen ten opzichte van het basisjaar.
In 2016 steeg de CO2 emissie met circa 0,3 procent (ten opzichte van
het jaar 2015) Deze stijging komt vooral doordat er meer aardgas is verbruikt voor ruimteverwarming. Daarentegen is de uitstoot van de elektriciteitsproductie afgenomen. De emissie van CH4 steeg in 2016
licht ten opzichte van 2015, met ongeveer 0,8 procent. De N2O emissie
daalde in 2016 met circa 3 procent. De emissie van F-gassen steeg in 2016 met circa 3 procent ten opzichte van 2015. De totale emissie van broeikasgassen in 2016 ligt daarmee 0,2 procent hoger dan het niveau in 2015.
Box ES.1 Onzekerheden
De emissies van broeikasgassen kunnen niet exact worden gemeten of berekend. Onzekerheden zijn daarom onvermijdelijk. Het RIVM schat de onzekerheid in de jaarlijkse totale broeikasgasemissies op circa 3
procent. Dit is geschat op basis van informatie van emissie-experts in een eenvoudige analyse van de onzekerheid (volgens IPCC Benadering 1). De totale uitstoot van broeikasgassen ligt daarmee met 95 procent betrouwbaarheid tussen de 189 en 201 Tg (Mton). De onzekerheid in de emissietrend tussen het basisjaar (1990/1995) en 2016 is geschat op circa 2 procent; dat wil zeggen dat de emissietrend in die periode met 95 procent betrouwbaarheid ligt tussen de -10 en -14 procent.
Methoden
De methoden die Nederland hanteert voor de berekening van de broeikasgasemissies zijn vastgelegd in methoderapporten. Deze rapporten geven een gedetailleerde beschrijving van alle emissie schattingsmethoden voor alle stoffen in de EmissieRegistratie. Deze rapporten zijn opgesteld door deskundigen van de EmissieRegistratie (voor wat betreft de beschrijving en documentatie van de
berekeningsmethoden voor broeikasgassen) in nauwe samenwerking met de Rijksdienst voor Ondernemend Nederland (RVO.nl).
De methoderapporten zijn opgenomen in Annex 7 en ook elektronisch beschikbaar te vinden op http://english.rvo.nl/nie
Executive summary
ES1 Background information on greenhouse gas (GHG) inventories and climate change
This report documents the Netherlands’ annual submission for 2018 of its greenhouse gas (GHG) emissions inventory in accordance with the Guidelines provided by the United Nations Framework Convention on Climate Change (UNFCCC), the Kyoto Protocol (KP) and the European Union’s Greenhouse Gas Monitoring Mechanism.
These Guidelines, which relate to the 2006 IPCC Guidelines for National Greenhouse Gas Inventories (IPCC, 2006), provide a format for the definition of source categories and for the calculation, documentation and reporting of emissions. The Guidelines are aimed at facilitating verification, technical assessment and expert review of the inventory information by the independent Expert Review Teams (ERTs) of the UNFCCC. The inventories should, therefore, be transparent, consistent, comparable, complete and accurate, as specified in the UNFCCC
Guidelines for reporting, and be prepared using good practice. This National Inventory Report 2018 (NIR 2018), therefore, provides explanations of the trends in GHG emissions, activity data (AD) and (implied) emission factors (EFs) for the period 1990–2016. It also summarizes the methods and data sources used in Approach 1
assessments of uncertainty in annual emissions and in emissions trends; it presents an assessment of key sources of emissions following
Approaches 1 and 2 of the 2006 IPCC Guidelines and describes quality assurance and quality control (QA/QC) activities.
This report provides no specific information on the effectiveness of government policies for reducing GHG emissions. This information can be found in ‘Environmental balance 2016’ (biennial edition; in Dutch: ‘Balans van de Leefomgeving’) prepared by the Netherlands
Environmental Assessment Agency (PBL), the 7th National
Communication (NC7; EZK, 2017a) and the Third Biennial Report (BR3; EZK, 2017b).
The Common Reporting Format (CRF) spreadsheet files, containing data on emissions, activity data and implied emission factors (IEFs),
accompany this report. The complete set of CRF tables, as well as the NIR in PDF format and the methodology reports, are also available on the website http://english.rvo.nl/nie.
Climate Convention and Kyoto Protocol
This NIR is prepared as a commitment under the UNFCCC and under the Kyoto Protocol. Part II of the NIR focuses on the supplementary
information required by Article 7 of the Kyoto Protocol. One of the commitments is the development of a National System for GHG
emissions (Art. 5.1 of the Protocol). This National System, developed in the period 2000–2005, was reviewed by an ERT of the UNFCCC in April 2007 and was found to be in compliance with the requirements.
Key categories
To identify the ‘key sources’ (the source categories which constitute 95% of national emissions) according to the definition of the 2006 IPCC
Guidelines, national emissions are categorized according to the IPCC source categories list wherever possible. The IPCC Approach 1 method consists of ranking this list of source categories according to their contribution to both national total annual emissions (level assessment) and the national total trend (trend assessment). The results of this ranking are presented in Annex 1: 95% of the national total annual emissions derive from 29 key sources and 95% of the national total trend is due to 35 key sources, out of a total of 92 source categories. The two lists can be combined to give an overview of the source categories that are included in one or both of these groups. Next, the IPCC Approach 2 method for identifying the key sources is used; this requires incorporating the uncertainty in the emissions estimate of each of these sources before ranking them in relation to their share of total emissions. The result is a list of 46 key sources from the total of 92 source categories. Finally, after the inclusion of ten Land use, land use change and forestry (LULUCF) source categories in the key source analysis, four more key sources are found in the LULUCF sector.
Figure ES.2: Main elements in the GHG emissions inventory compilation process
Institutional arrangements for inventory preparation The GHG emissions inventory of the Netherlands is based on the national Pollutant Release and Transfer Register (PRTR). The inventory is compiled annually in accordance with a procedure that has been in operation since 2000, when the process of compiling the GHG inventory was transformed into a National System, in accordance with the
requirements of Article 5.1 of the Kyoto Protocol, under the leadership of the Netherlands Enterprise Agency (RVO.nl).
The National Institute for Public Health and the Environment (RIVM) has been contracted by the Ministry of Economic Affairs and Climate policy (EZK) to compile and maintain the PRTR and to coordinate the
preparation of the NIR and the completion of the CRF tables (see Figure ES.2). RVO.nl is designated by law as the National Inventory Entity (NIE) and coordinates the overall QA/QC activities and the
support/response to the UNFCCC review process. Methodology reports
Under the National System, in accordance with Article 5.1 of the Kyoto Protocol, the methodologies for calculating GHG emissions in the Netherlands were reassessed in 2005 and compared with UNFCCC and IPCC requirements.
From 2015 onwards, emissions data are reported according to the 2006 IPCC Guidelines (IPCC, 2006), implemented in accordance with the UNFCCC Reporting Guidelines. Therefore, the methodologies have been aligned with those Guidelines and described in methodology reports (which replace the former monitoring protocols). The present CRF/NIR is based on these methodology reports, which are part of the National System. The methodology reports are Part of the National GHG
submission and the references are included in Annex 7 and are available at the National System website http://english.rvo.nl/nie. The
methodology reports are reviewed by the NIE and approved by the chairperson of the PRTR Task Force concerned.
Organization of the report
This report is organized in line with the prescribed NIR format, starting with an introductory chapter, Chapter 1, which contains background information on the Netherlands’ process of inventory preparation and reporting; key sources and their uncertainties; a description of methods, data sources and emission factors (EFs); and a description of the quality assurance (QA) system, along with verification activities applied to the data. Chapter 2 provides a summary of trends in aggregated GHG emissions by gas and by principal source. Chapters 3 to 9 present detailed explanations of emissions in the different CRF sectors. Chapter 10 presents information on recalculations and improvements. In
addition, the report provides detailed information on key source categories and methodologies and other relevant details in nine annexes.
In Part II of this report, the supplementary information required under Article 7, paragraph 1 of the Kyoto Protocol is reported in five additional Chapters.
ES2 Summary of trends in national emissions and removals In 2016, total GHG emissions (including indirect CO2 emissions and
excluding emissions from LULUCF) in the Netherlands were estimated at 195.2 Tg CO2 equivalents (CO2 eq.). This is approximately 12.4% below
total emissions in the base years (222.9 Tg CO2 eq.). In the
Netherlands, the base year for emissions of CO2, CH4 and N2O is 1990,
and the base year for emissions of fluorinated gases (F-gases) is 1995. CO2 emissions (excluding LULUCF) increased by about 1.6% from 1990
to 2016. CH4 emissions in 2016 were 42% lower than 1990 levels,
Agricultural sector. N2O emissions decreased by 54% in 2016 compared
with 1990, mainly due to decreases in emissions from Agriculture and from Industrial processes and product use (IPPU). In contrast N2O
emissions from fossil fuel combustion (mainly from Transport)
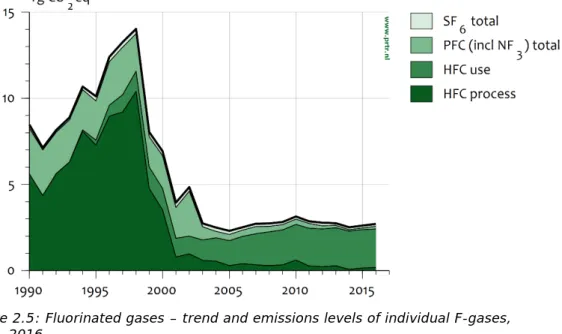
increased. The emissions of F-gases (HFCs, PFCs and SF6) decreased in
the period 1995 (chosen as the base year) to 2016 by 68%, 93% and 49%, respectively. Total emissions of all F-gases were approximately 73% lower than in 1995. A summary of these trends is given in Figure ES.3.
Figure ES.3: Overview of the trends in GHG emissions (excl. LULUCF) 1990– 2016
Between 2015 and 2016, CO2 emissions (excluding LULUCF) increased
by 0.5 Tg. Emissions of CH4 also showed a small increase of 0.15 Tg CO2
eq. between 2015 and 2016. In the same period, N2O emissions
decreased by just under 0.3 Tg CO2 eq. Emissions of HFCs, PFCs and SF6
did not change significantly in 2016. Total F-gas emissions increased by 0.1 Tg CO2 eq.
Overall, total GHG emissions increased by about 0.2% in comparison with 2015.
Total CO2 eq. emissions including LULUCF increased between 2015 and
2016 by 0.5 Tg to the level of 201.9 Tg CO2 eq.
ES3 Overview of source and sink category emissions estimates and trends
Tables ES.1 and ES.2 provide an overview of the emissions trends (in CO2 equivalents) per gas and per IPCC source category. The Energy
sector is by far the largest contributor to national total GHG emissions. Emissions from this sector were 2% higher than in 1990. Emissions from the LULUCF sector were 10% higher than in 1990. Emissions from the other sectors were lower than in the base year, the largest decreases being in IPPU, Waste and Agriculture.
Categories showing the largest increase in CO2-equivalent emissions
since 1990 are Transport (1A3) and Energy industries (1A1) (+9% and +27%, respectively).
Table ES.1: Summary of emissions trends per gas (Tg CO2 equivalents, including
indirect CO2 emissions) CO2 incl. LULUCF CO2 excl. LULUCF CH4 N2O HFCs PFCs SF6 Total incl. LULUCF Total excl. LULUCF Base year 169.2 163.1 32.0 17.7 7.6 2.3 0.3 229.0 222.9 1990 169.2 163.1 32.0 17.7 5.6 2.7 0.2 227.3 221.3 1991 177.6 171.5 32.4 17.9 4.4 2.6 0.1 235.0 228.9 1992 177.4 171.3 32.0 18.2 5.6 2.4 0.1 235.7 229.6 1993 177.6 171.4 31.5 18.5 6.3 2.4 0.1 236.5 230.2 1994 178.2 171.9 30.5 18.0 8.2 2.3 0.2 237.4 231.1 1995 179.7 173.5 29.8 17.9 7.6 2.3 0.3 237.5 231.3 1996 189.1 182.9 29.1 17.9 9.6 2.5 0.3 248.5 242.3 1997 181.8 175.7 27.9 17.7 10.2 2.8 0.3 240.7 234.5 1998 182.9 176.8 26.7 17.1 11.6 2.2 0.3 240.8 234.6 1999 177.5 171.4 25.5 16.4 6.0 1.8 0.3 227.4 221.2 2000 178.3 172.3 24.4 15.9 4.8 1.9 0.3 225.5 219.4 2001 183.4 177.4 23.7 14.9 1.9 1.8 0.3 226.0 219.9 2002 182.7 176.7 22.6 14.1 2.0 2.6 0.2 224.2 218.1 2003 186.3 180.1 21.9 13.9 1.8 0.8 0.2 224.8 218.6 2004 187.7 181.7 21.4 14.4 1.9 0.4 0.2 226.0 220.0 2005 183.7 177.8 20.0 14.3 1.7 0.4 0.2 220.3 214.4 2006 178.9 173.0 19.6 14.2 2.0 0.4 0.2 215.2 209.3 2007 178.7 172.9 19.7 12.6 2.1 0.4 0.2 213.8 207.8 2008 181.5 175.8 19.9 8.8 2.2 0.3 0.2 213.0 207.1 2009 176.4 170.4 19.6 8.6 2.4 0.3 0.1 207.5 201.4 2010 188.5 182.4 19.6 8.3 2.7 0.3 0.2 219.6 213.4 2011 175.5 169.4 19.0 8.1 2.5 0.3 0.1 205.5 199.3 2012 171.3 165.2 18.7 7.9 2.4 0.2 0.2 200.7 194.5 2013 171.5 165.0 18.6 8.1 2.5 0.1 0.1 201.0 194.5 2014 164.0 157.6 18.2 8.2 2.3 0.1 0.1 193.1 186.5 2015 171.8 165.3 18.4 8.5 2.4 0.1 0.1 201.4 194.8 2016 172.3 165.7 18.6 8.2 2.4 0.2 0.1 201.9 195.2
Table ES.2: Summary of emissions trends per sector (Tg CO2 equivalents,
including indirect CO2 emissions)
1. Energy 2. Ind. Processes and prod. use
3.
Agriculture 4. LULUCF 5. Waste Total incl. LULUCF Total excl. LULUCF Base year 158.6 25.1 25.0 6.1 14.2 229.0 222.9 1990 158.6 23.5 25.0 6.1 14.2 227.3 221.3 1991 167.0 22.3 25.3 6.2 14.3 235.0 228.9 1992 166.8 23.3 25.4 6.2 14.1 235.7 229.6 1993 167.1 24.4 25.0 6.3 13.7 236.5 230.2 1994 167.7 26.3 24.1 6.3 13.2 237.4 231.1 1995 169.3 25.3 24.1 6.2 12.6 237.5 231.3 1996 179.2 27.2 23.8 6.2 12.2 248.5 242.3 1997 171.1 28.2 23.4 6.1 11.8 240.7 234.5 1998 171.9 29.1 22.3 6.2 11.3 240.8 234.6 1999 166.3 22.8 21.8 6.1 10.4 227.4 221.2 2000 167.1 21.9 20.7 6.1 9.8 225.5 219.4 2001 172.8 17.6 20.2 6.1 9.3 226.0 219.9 2002 172.2 18.1 19.1 6.1 8.8 224.2 218.1 2003 175.7 15.9 18.7 6.3 8.2 224.8 218.6 2004 176.9 16.6 18.5 6.0 7.9 226.0 220.0 2005 173.0 16.6 18.4 6.0 6.4 220.3 214.4 2006 168.4 16.5 18.4 6.0 5.9 215.2 209.3 2007 168.7 15.4 18.1 6.0 5.5 213.8 207.8 2008 172.2 11.6 18.2 5.9 5.2 213.0 207.1 2009 167.2 11.3 18.0 6.1 4.9 207.5 201.4 2010 178.9 11.9 18.1 6.1 4.6 219.6 213.4 2011 165.5 11.8 17.7 6.2 4.3 205.5 199.3 2012 161.8 11.1 17.5 6.2 4.1 200.7 194.5 2013 161.5 11.1 18.0 6.6 3.9 201.0 194.5 2014 154.0 10.7 18.2 6.6 3.6 193.1 186.5 2015 161.4 11.1 18.8 6.7 3.4 201.4 194.8 2016 161.9 10.9 19.2 6.7 3.3 201.9 195.2
ES4 Other information
General uncertainty evaluation
The results of the uncertainty estimation according to the IPCC
Approach 1 uncertainty assessment are summarized in Annex 2 of this report. The Approach 1 estimation of annual uncertainty in CO2
-equivalent emissions results in an overall uncertainty of 3%, based on calculated uncertainties of 2% for CO2 (excluding LULUCF), 17% for
CH4, 41% for N2O and 41% for F-gases.
However, these figures do not include the correlation between source categories (e.g. cattle numbers for enteric fermentation and animal manure production), nor a correction for non-reported sources. The correlation between source categories can be included in an
Approach 2 uncertainty assessment. This submission includes the results of the Approach 2 uncertainty assessment (using Monte Carlo analysis).
The results show that the calculated uncertainty in the national emissions is of the same order of magnitude as the Approach 1 uncertainty assessment. Table ES.3 shows the currently estimated values for the Approach 1 and Approach 2 analyses.
Table ES.3: Approach 1 and Approach 2 uncertainty assessment of 2016 emissions (without LULUCF)
Greenhouse
gas Approach 1 annual
uncertainty Approach 2 annual uncertainty (Monte Carlo) Carbon dioxide 3% 3% Methane 17% 9% Nitrous oxide 41% 27% F-gases 41% 25% Total 3% 3%
From Table ES.3 it can be seen that the Approach 2 analysis for the national total shows the same uncertainty as the Approach 1 analysis. For non-CO2 GHG the Approach 2 uncertainties are lower than the
results from Approach 1, as they are now based on revised uncertainty estimates at the lowest source level.
Annex 2 summarizes the estimates of trend uncertainties in the period 1990–2016 calculated according to IPCC Approach 1 (IPCC, 2006). The result is a trend uncertainty in total CO2-equivalent emissions (excluding
LULUCF) for 1990–2016 (1995–2016 for F-gases) of ±2%. This means that the trend in total CO2-equivalent emissions between 1990 and 2016
(excluding LULUCF), which is calculated to be a 12.5% decrease, will be between a 10% decrease and a 14% decrease. Per individual gas, the trend uncertainties in total emissions of CO2, CH4, N2O and the total
group of F-gases have been calculated at ±2%, ±6%, ±7% and ±12%, respectively. More details of the trend uncertainty assessment can be found in Annex 2.
Completeness of the national inventory
The Netherlands’ GHG emissions inventory includes almost all sources identified by the 2006 IPCC Guidelines. The following very minor sources are not included in the inventory:
• CO2 from Asphalt roofing (2D3), due to missing activity data;
• CO2 from Road paving (2D3), due to missing activity data;
• CH4 from Enteric fermentation of poultry (3A4), due to missing
EFs;
• N2O from Industrial wastewater (5D2) and septic tanks, due to
negligible amounts;
• Part of CH4 from Industrial wastewater (5D2 sludge), due to
negligible amounts.
Precursor emissions (carbon monoxide (CO), nitrogen oxide (NOx),
non-methane volatile organic compounds (NMVOC) and sulphur dioxide (SO2)) from memo item ‘International bunkers’ (international transport)
Methodological changes, recalculations and improvements This NIR (2018) is based on the National System of the Netherlands, in accordance with Article 5.1 of the Kyoto Protocol. In past years, the results of various improvement actions have been implemented in the methodologies and processes of compiling the GHG emissions inventory of the Netherlands. Compared with the NIR 2017, some improvements of the inventory (including recalculations) have been undertaken in the last year. The rationale behind the recalculations is documented in Chapters 3–10.
Table ES.4 shows the results of recalculations in the NIR 2018 compared with the NIR 2017.
Table ES.4: Differences between the NIR 2018 and NIR 2017 due to
recalculations (Tg CO2 eq. including indirect CO2 emissions; F-gases: Gg CO2
eq.) Source 1990 1995 2000 2005 2010 2015 CO2 [Tg] NIR 2018 169.2 179.7 178.3 183.7 188.5 171.8 Incl. NIR 2017 169.0 179.5 178.0 183.3 188.8 171.9 LULUCF Difference 0.1% 0.1% 0.2% 0.2% -0.2% -0.1% CO2 [Tg] NIR 2018 163.1 173.5 172.3 177.8 182.4 165.3 Excl. NIR 2017 162.9 173.3 172.0 177.4 182.8 165.3 LULUCF Difference 0.1% 0.1% 0.2% 0.2% -0.2% -0.1% CH4 [Tg] NIR 2018 32.0 29.8 24.4 20.0 19.6 18.4 NIR 2017 32.3 30.3 25.1 20.5 20.1 19.0 Difference -1.1% -1.7% -2.8% -2.2% -2.6% -3.0% N2O [Tg] NIR 2018 17.7 17.9 15.9 14.3 8.4 8.6 NIR 2017 17.7 17.8 15.8 14.2 8.2 8.5 Difference 0.2% 0.5% 0.6% 0.6% 1.5% 1.6% PFCs NIR 2018 2663 2280 1903 366 314 104 [Gg] NIR 2017 2663 2280 1903 366 314 104 Difference 0.0% 0.0% 0.0% 0.0% 0.0% 0.0% HFCs NIR 2018 5606 7572 4764 1733 2677 2373 [Gg] NIR 2017 5606 7571 4765 1728 2666 2336 Difference 0.0% 0.0% 0.0% 0.3% 0.4% 1.6% SF6 NIR 2018 207 261 259 204 154 139 [Gg] NIR 2017 207 261 259 204 154 139 Difference 0.0% 0.0% 0.0% 0.0% 0.0% 0.5% Total NIR 2018 227.3 237.5 225.5 220.3 219.6 201.4 [Tg CO2 eq.] NIR 2017 227.5 237.7 225.8 220.3 220.3 202.0
Incl. LULUCF Difference -0.1% -0.1% -0.1% 0.0% -0.3% -0.3% Total NIR 2018 221.3 231.3 219.4 214.4 213.4 194.8 [Tg CO2 eq.] NIR 2017 221.4 231.5 219.7 214.4 214.2 195.2
Excl. LULUCF Difference -0.1% -0.1% -0.1% 0.0% -0.3% -0.2% Note: Base year values are indicated in bold.
Improving the QA/QC system
The QA/QC (quality assurance/quality control) programme is up to date and all procedures and processes meet National System requirements
(as part of the annual activity programme of the Netherlands’ PRTR). QA/QC activities needing to be undertaken as part of the National System are described in Chapter 1.
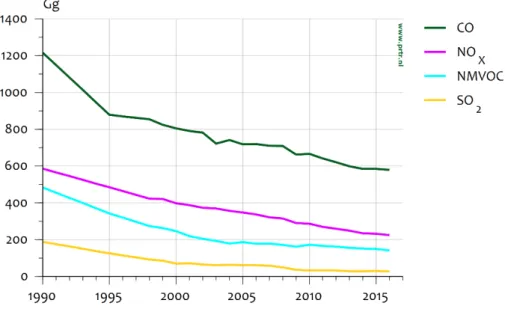
Emissions trends for indirect GHGs and SO2
Compared with 1990, CO and NMVOC emissions were reduced in 2016 by 52% and 71%, respectively. For SO2, the reduction was 86%; for
NOx, the 2016 emissions were 62% lower than the 1990 level. Table
ES.5 provides trend data.
Table ES.5: Emissions trends for indirect GHGs and SO2 (Gg)
1990 1995 2000 2005 2010 2015 2016
Total NOX 586 485 398 347 286 233 224
Total CO 1,216 879 805 718 666 585 580
Total NMVOC 483 343 246 186 172 149 141
1
Introduction
1.1 Background information on greenhouse gas inventories and
climate change
1.1.1 Background information on climate change
The United Nations Framework Convention on Climate Change
(UNFCCC) was ratified for the European part of the Netherlands in 1994 and took effect in March 1994. One of the commitments made by the ratifying Parties to the Convention was to develop, publish and regularly update national emissions inventories of greenhouse gases (GHGs). This national inventory report (NIR), together with the Common Reporting Format (CRF), represents the 2017 national emissions inventory of GHGs under the UNFCCC (Part I of this report) and under its Kyoto Protocol (Part II of this report).
Geographical coverage
The reported emissions are those that derive from the legal territory of the Netherlands. This includes a 12-mile zone out from the coastline and inland water bodies. It excludes Aruba, Curaçao and Sint Maarten, which are constituent countries of the Kingdom of the Netherlands. It also excludes Bonaire, Saba and Sint Eustatius, which since 10 October 2010 have been public bodies (openbare lichamen) with their own legislation that is not applicable to the European part of the Netherlands. Emissions from offshore oil and gas production on the Dutch part of the continental shelf are included.
1.1.2 Background information on the GHG emissions inventory
As indicated, this NIR documents the 2017 greenhouse gas emissions inventory for the Netherlands under the UNFCCC and under the Kyoto Protocol. The estimates provided in the report are consistent with the Intergovernmental Panel on Climate Change (IPCC) 2006 Guidelines for National Greenhouse Gas Inventories (IPCC, 2006). The methodologies applied to the Netherlands’ inventory are also consistent with the guidelines under the Kyoto Protocol and the European Union’s Greenhouse Gas Monitoring Mechanism.
For detailed assessments of the extent to which changes in emissions are due to the implementation of policy measures can be found in ‘Environmental balance 2016’ (biennial edition; in Dutch: ‘Balans van de Leefomgeving’), the 7th Netherlands National Communication under the United Nations Framework Convention on Climate Change (NC7: EZK, 2017) and the Third Biennial Report (BR3: EZK, 2017).
The Netherlands also reports emissions under other international agreements, such as the United Nations Economic Commission for Europe (UNECE), the Convention on Long Range Transboundary Air Pollutants (CLRTAP) and the EU’s National Emission Ceilings (NEC) Directive. All emissions estimates are taken from the Netherlands’ Pollutant Release and Transfer Register (PRTR), which is compiled by a special project in which various organizations cooperate. The GHG emissions inventory and the PRTR share underlying data, which ensures
consistency between the inventories and other internationally reported data. Several institutes are involved in the process of compiling the GHG emissions inventory (see also Section 1.3).
The NIR covers the seven direct GHGs included in the Kyoto Protocol: carbon dioxide (CO2), methane (CH4), nitrous oxide (N2O),
hydrofluorocarbons (HFCs), perfluorocarbons (PFCs) and sulphur
hexafluoride (SF6) (the last three are called the F-gases; NF3 is included
in the figure for PFCs but cannot be reported separately due to the confidentiality of the data).
Emissions totals for the GHGs, including indirect CO2 emissions, are
reported in this NIR.
Emissions of the following indirect GHGs are also reported: nitrogen oxides (NOx), carbon monoxide (CO), non-methane volatile organic
compounds (NMVOC) and sulphur oxides (SOx).
This report provides explanations of the trends in GHG emissions per gas and per sector for the 1990–2016 period and summarizes the methods used and data sources for: (a) Approach 1 assessments of the uncertainty in annual emissions and in emissions trends; (b) key source assessments following Approach 1 and Approach 2 of the 2006 IPCC Guidelines; (c) quality assurance and quality control (QA/QC) activities. Under the National System, in accordance with Article 5.1 of the Kyoto Protocol, the methodologies for calculating GHG emissions in the Netherlands were reassessed in 2005 and compared with UNFCCC and IPCC requirements. For the key sources and for sinks, the
methodologies and processes were elaborated into (about 40) monitoring protocols. These protocols, describing the methodologies according to the Revised 1996 IPCC Guidelines (IPCC, 1997), were annually revised, where necessary, and used until 2014. Adjustments to the protocols required an official announcement in the Government Gazette (Staatscourant).
From 2015 onwards, emissions data have been reported according to the 2006 IPCC Guidelines (implemented in accordance with the UNFCCC Reporting Guidelines). Therefore, the methodologies have been aligned with those Guidelines and are documented in five methodology reports, one for each PRTR Task Force. The present NIR is based on the
methodologies described in these methodology reports, which should be considered as part of the National System. The reports are an integral part of this submission (see Annex 7) and are available at the National System website http://english.rvo.nl/nie. The methodology reports are reviewed by the National Inventory Entity (NIE) and approved by the chairperson of the PRTR Task Force concerned.
In 2007, the UN performed an in-country initial review under the Kyoto Protocol. The review concluded that the Netherlands’ National System had been established in accordance with the guidelines and that it met the requirements. This was confirmed by the latest review from 2017. Information on the latest changes to the National System is reported in Chapter 13.
The structure of this report complies with the format required by the UNFCCC (FCCC/SBSTA/2004/8 and the latest annotated outline of the National Inventory report, including reporting elements under the Kyoto Protocol). It also includes supplementary information under Article 7 of the Kyoto Protocol. Part II of the NIR gives an overview of this
information.
Greenhouse gas (GHG) emissions are given in gigagrams (Gg) and teragrams (Tg) in this report. Global warming potential (GWP) weighted emissions of the GHGs are also provided (in CO2 equivalents), using
GWP values based on the effects of GHGs over a 100-year horizon, in accordance with UNFCCC Decision 24/CP.19 Annex III. The GWP of each individual GHG is given in Annex 7.
The Common Reporting Format (CRF) spreadsheet files accompany this report as electronic annexes. The CRF tables contain detailed
information on GHG emissions, activity data and (implied) emission factors (EFs) by sector, source category and GHG. The complete set of CRF tables and this report comprise the NIR, which is published on the website http://english.rvo.nl/nie.
Chapter 10 provides details of the recalculations performed since the last submission and the improvements made following the
recommendations of the latest reviews.
1.1.3 Background information on supplementary information required by Article 7 of the Kyoto Protocol
Part II of this report provides the supplementary information required by (Article 7 of) the Kyoto Protocol. This supplementary information on Land use, land use change and forestry according the Kyoto Protocol definitions (KP-LULUCF) pertains to activities under Article 3, paragraph 3, and Forest management, the mandatory activity under Article 3, paragraph 4, of the Kyoto Protocol. The Netherlands has not elected any other activities to include under Article 3, paragraph 4, of the Kyoto Protocol. Information on the accounting of Kyoto units is also provided in the SEF file: RITL1_NL_2016_CP_02.xlsx.
1.2 A description of the national inventory arrangements
1.2.1 Institutional, legal and procedural arrangements
The Ministry of Economic Affairs and Climate Policy (EZK) bears overall responsibility for climate change policy issues, including the preparation of the national GHG emissions inventory.
In December 2005, the Netherlands Enterprise Agency (RVO.nl) was designated by law as the National Inventory Entity (NIE), the single national entity required under the Kyoto Protocol. In addition to the coordination of the establishment and maintenance of a National System, the tasks of RVO.nl include overall coordination of improved QA/QC activities as part of the National System and coordination of the support/response to the UNFCCC review process. The National System is described in greater detail in the Seventh Netherlands National
Communication under the United Nations Framework Convention on Climate Change (NC7: EZK, 2017a).
The RIVM has been assigned by the EZK as the institute responsible for coordinating the compilation and maintenance of the pollutants emission register/inventory (PRTR system), which contains data on approximately 350 pollutants, including GHGs. The PRTR project system is used as the basis for the NIR and for the completion of the CRF tables.
1.2.2 Overview of inventory planning, preparation and management
The Dutch PRTR system has been in operation in the Netherlands since 1974. This system encompasses data collection, data processing and the registering and reporting of emissions data for approximately 350
policy-relevant compounds and compound groups that are present in air, water and soil. The emissions data are produced in an annual (project) cycle (RIVM, 2017). This system also serves as the basis for the national GHG emissions inventory. The overall coordination of the PRTR is outsourced by the EZK to the RIVM.
The main purpose of the PRTR project is the production of an annual set of unequivocal emissions data that is up to date, complete, transparent, comparable, consistent and accurate. In addition to the RIVM, various external agencies contribute to the PRTR by performing calculations or submitting activity data (see Box 1).
Box 1 Pollutant Release and Transfer Register (PRTR) project Responsibilities for coordination of the PRTR project
Major decisions on tasks and priorities are taken by the Steering Committee ER (SCER) by approval of the Annual Work Plan. This committee consists of representatives of the commissioning ministries, regional governments, the RIVM and the PBL.
The PRTR project leader at the RIVM acts as coordinator and is
responsible for the PRTR process; the outcomes of that process are the responsibility of the bodies involved. The collaboration of the various bodies is ensured by means of contracts, covenants or other
agreements. Task Forces
Various emissions experts from the participating organizations take part in the Task Forces that calculate national emissions from 650 emission sources. A formal agreement is drawn up by all the participating organizations. After intensive checking, national emissions figures are accepted by the leader of the PRTR project and the data set is stored in the Central Database.
The 650 emissions sources are logically divided into 55 work packages. An emissions expert is responsible for one or more work packages, the collection of the data and the calculation of the emissions. The experts are also closely involved in developing the methodologies to calculate the emissions. Work packages are grouped into five Task Forces, as described below.
Task Force on Energy, Industry and Waste Management (ENINA)
Covers emissions to air from the Industry, Energy production, Refineries and Waste management sector. ENINA includes emissions experts from the following organizations: RIVM, TNO, Statistics Netherlands (CBS),
Rijkswaterstaat Environment (Waste Management Department), Deltares and Fugro-Ecoplan.
Task Force on Transportation
Covers the emissions to soil and air from the Transportation sector (aviation, shipping, rail and road transport). The following organizations are represented: PBL, CBS, Rijkswaterstaat, Deltares and TNO.
Task Force on Agriculture
Covers the calculation of emissions to soil and airfrom agriculture. Participating organizations include RIVM, PBL, Wageningen University and Research Centre (WUR), Alterra, CBS and Deltares.
Task Force on Water (MEWAT)
Covers the calculation of emissions from all sectors to water. MEWAT includes Rijkswaterstaat, Deltares, PBL, RIVM, CBS and TNO.
Task Force on Consumers and other sources of emissions (WESP) Covers emissions caused by consumers, trade and services. The members are emissions experts from RIVM, TNO and CBS. 1.2.2.1 Responsibility for reporting
The NIR Part I is prepared by the RIVM as part of the PRTR project. Most institutes involved in the PRTR also contribute to the NIR (including CBS and TNO). In addition, the Netherlands Enterprise Agency (RVO.nl) is involved in its role as NIE. RVO.nl also prepares the NIR Part II and is responsible for integration and submission to the UNFCCC in its role as NIE. Submission to the UNFCCC takes place only after approval by the EZK.
1.2.2.2 Overview of the inventory preparation and management under Article 7 of the Kyoto Protocol
Following the annotated outline, the supplementary information, as required according to Article 2 of the Kyoto Protocol, is reported in the NIR Part II. This information is prepared by the RVO.nl using information from various other organizations involved, such as the NEa (Dutch Emissions Authority), the WUR and the EZK.
1.2.3 Reporting, QA/QC, archiving and overall coordination
The NIR is prepared by the RIVM with input from the relevant PRTR Task Forces and from RVO.nl. The preparation of the NIR also includes the documentation and archiving of statistical data for the estimates and QA/QC activities. The EZK formally approves the NIR before it is submitted; in some cases, approval follows consultation with other ministries. RVO.nl is responsible for coordinating QA/QC and responses to the EU and for providing additional information requested by the UNFCCC after the NIR and the CRF have been submitted. RVO.nl is also responsible for coordinating the submission of supporting data to the UNFCCC review process.
For KP-LULUCF, consistency with the values submitted for the Convention is assured by using the same base data and calculation structure. The data, as required in the KP-LULUCF CRF tables, are derived from these Convention calculations using specific aggregation to
the KP-LULUCF activities. The data and calculations are thus subject to the same QA/QC procedures (Arets et al., 2018).
The calculated values were generated using the LULUCF bookkeeping model at Wageningen Environmental Research (Alterra) and checked by the LULUCF sectoral expert. They were then sent to the GHG emission inventory, which entered the data into the CRF database for all sectors and checked them again. Any unexpected or incomplete values were reported to the LULUCF sectoral expert, checked and, if necessary, corrected.
1.2.3.1 Information on the QA/QC plan
The National System, in line with the Kyoto requirements, was finalized and established by the end of 2005. As part of this system, the Act on the Monitoring of Greenhouse Gases also took effect in December 2005. This Act required the establishment of the National System for the monitoring of GHGs and empowered the Minister of Economic Affairs and Climate Policy (EZK) to appoint an authority responsible for the National System and the National GHG Emissions Inventory. In a subsequent regulation, the Minister appointed RVO.nl as the NIE (National Inventory Entity, the single national entity required under the Kyoto Protocol). As part of its National System, the Netherlands has developed and implemented a QA/QC programme. This programme is assessed annually and updated, if necessary. The key elements of the current programme (RVO.nl, 2017) are summarized in this chapter, notably those relating to the current NIR.
1.2.3.2 QA/QC procedures for the CRF/NIR 2018
The system of methodology reports was developed and implemented in order to increase the transparency of the inventory (including
methodologies, procedures, tasks, roles and responsibilities with regard to inventories of GHGs). Transparent descriptions of all these aspects are included in the methodology reports for each gas and sector and in process descriptions for other relevant tasks in the National System. The methodology reports are assessed annually and updated, if necessary. Several QC issues relate to the NIR:
• The ERT recommended providing more information in the NIR, and this is now included in the methodology reports (which are an integral part of this 2018 submission, see Annex 7). The methodology reports sometimes refer to background
documentation. Most of the background documentation is in English and can be made available for review purposes. This does not diminish the constant attention given by the Task Forces to further improve the quality and transparency of the methodology reports.
• In 2017 the Netherlands started a special project for the
improvement of notation keys in the CRF tables. This resulted in much better filling of CRF with notation keys for the year 2015. In the preparation of this submission the explanations of the notation keys were improved but due to technical problems they are not yet included in the CRF, but are submitted for the year 2016 in a separate file Table9.xlsx.