The Netherlands in Europe: environmental performance in
perspective
Edward Vixseboxse, Bart Wesselink and Jos Notenboom1
How well are the Netherlands really doing on the issue of the environment? The
Environmental Performance Index (EPI) world list for 2006 says we’re doing rather poorly, at 27th place. The press have reacted immediately with critical pieces about Dutch
environmental policy, although in fact it is impossible to rank a country’s environmental performance with a single number. A new MNP overview of indicators, called the ‘European Benchmark Indicators’ (EBI ), clarifies the Netherlands’ environmental performance. This set of indicators allows for nuance when evaluating the environmental performance of EU countries.
The Netherlands in Europe
Many environmental problems aren’t confined to national borders. The EU saw the common benefit in solving environmental problems early on, and in 1972 the European Commission launched its first Environmental Action Programme. The 6th Environmental Action
Programme is currently in force, with European measures accounting for some 75% of the Netherlands’ environmental legislation. Within a short time, the European structure of environmental guidelines has contributed to better environmental quality in 25 EU countries. The disadvantages of being an early adopter
Because of its geographical situation, the Netherlands takes a great interest in highly protective European environmental measures. Since they target the sources of pollution and set the same limits for neighbouring countries, European-level environmental regulations are the most effective for the Netherlands. For a long time, the Netherlands and several other member states were the leaders in setting European environmental policy, out of self-interest and necessity. This lead is now starting to prove disadvantageous, however. The Dutch principle known as the “wet van de remmende voorsprong” (literally the “law of the braking lead”) teaches us, among other things, that it is more difficult to fit a European
environmental directive into an existing system of environmental regulations than to start afresh with directives from Brussels.
The “braking lead” idea raises the questions of how great this lead actually is, and of how hard the brake has been applied at this point.
Perspective
The 2006 EPI – compiled annually by the Universities of Yale and Columbia – ranks the Netherlands among the worst performing six countries of the European Union, and 27th world-wide. The reader interested in environmental matters could conclude from this achievement and the commentary surrounding it that the environment is in a pretty sorry state in the Netherlands, as the following pronouncements attest:
“We’ve become the dirty man of Europe” (Financiële Dagblad 25-01-2006, Gert Spaargaren, professor of Environmental Policy, Wageningen University)
“Netherlands environmental performance shameful” (Dutch Labour Party website) “The Netherlands scores badly on environment” (Financiële Dagblad, 25-01-2006)
The question is: is all of this criticism of the Netherlands’ environmental performance justified? To answer this question satisfactorily, we must put the Netherlands’ performance in perspective.
The past
The Netherlands has lost its historical position as environmental bellwether in Europe and the world. However, this is not surprising, as both the EU and its package of environmental measures have grown considerably. Acquiring a frontrunner position in European
environmental performance is much more difficult these days than previously.
Motivated by sheer self-interest, the Netherlands was one of the very first countries to develop environmental policy, first of all national, later European. It’s easy to be in the lead in a race with only a few contenders. If one racing cyclist rides his bicycle while the other is standing still, the first cyclist quickly takes the lead. The EU ‘pack’ has expanded from six member states in 1952 to fifteen in 1995 and currently numbers 25 countries. In a larger group, of course, it is more difficult for individuals to excel, especially if all the participants are training and preparing better. European environmental policy has gone through a tremendous evolution in just a few decades.
Country-specific characteristics
Country-specific characteristics also determine a country’s environmental performance. Demographic, geographic and socio-economic characteristics can differ greatly from
country to country and must be taken into account in any performance evaluation. Translated to the Dutch situation, this means that the following characteristics are relevant to the
country’s environmental performance:
• high population density with a high degree of urbanisation • much energy-intensive industry
• a highly developed transport and distribution sector • significant agricultural production
• its location in a low-lying river delta. Meaningful comparisons
The relatively low rank of the Netherlands in the EPI score can be largely explained by the use of indicators directly related to these country-specific characteristics. For example, countries with large natural areas and small cities, such as Sweden, score high on the EPI indicator ‘available natural area (woodlands etc)’. Highly urbanised countries with relatively few natural areas, such as the Netherlands, score badly.
It is more useful to compare environmental performance between countries with similar characteristics. Important determinants in the baseline situation of a country are population pressure and economic prosperity, growth, and structure, and regional situation. If, for example, the Netherlands were compared with other densely populated countries in the EPI, it would then come in 4th place (out of 18) behind Japan, Italy and Germany.
The European Union now numbers 25 countries, with such a wide range of economic development, growth and structure that the chosen standard or average used to assess performance can make a significant difference. It is more meaningful to compare the environmental performance of the Netherlands with an EU15 average, and that of a country such as Poland with an EU10 average.
Lastly, the measurement methods used also determine environmental performance.
Increasingly, policy makers are asking for a single ‘environmental index figure’ because it is simple to use and interpret. It is more or less the environmental counterpart to the GDP (Gross Domestic Product) figure used to indicate a country’s economic prosperity. Index figures, however, have limited value if they are not comparing like with like. They are also somewhat subjective, since the factors have been weighted. The EPI, for example, consists of six policy categories divided into sixteen indicators; not all have an equal share in determining the index. Ultimately, the category environmental health constitutes 50 percent of the value of the total index figure, with the other five each contributing ten percent. It’s not difficult to imagine a different choice of category or indicator yielding a totally different end result.
MNP European Benchmark Indicators (EBI)
Thus, there is actually no objective, uniform method for comparing environmental
performance between countries. Yet the Dutch Parliament is asking for a comparison of the Netherlands’ environmental performance with other EU countries. How can their request be met without encountering the pitfalls described above?
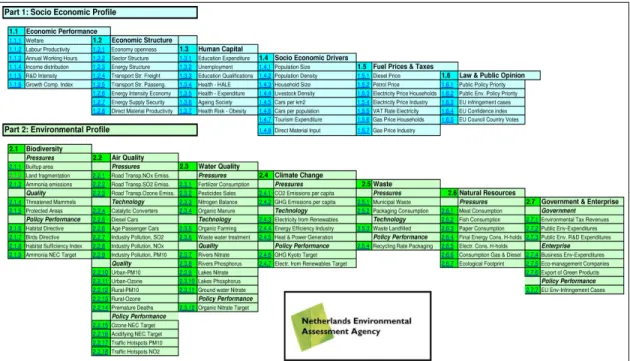
The Netherlands Environmental Assessment Agency (MNP) has put together a set of existing benchmark indicators (see Figure 1) so that the country’s environmental
performance can be placed in a European perspective. A socio-economic profile takes into account the specific characteristics of a country. The environmental profile is divided into recognisable categories each of which is divided into environmental pressures, clean technologies, environmental quality and policy performance in relation to European objectives. The PSR (Pressures, State and Response) categories and methods developed by the OECD can be recognised here. The indicators are not added up to arrive at a single index, as with the EPI, but provide the ingredients for a structured and nuanced comparative analysis between countries.
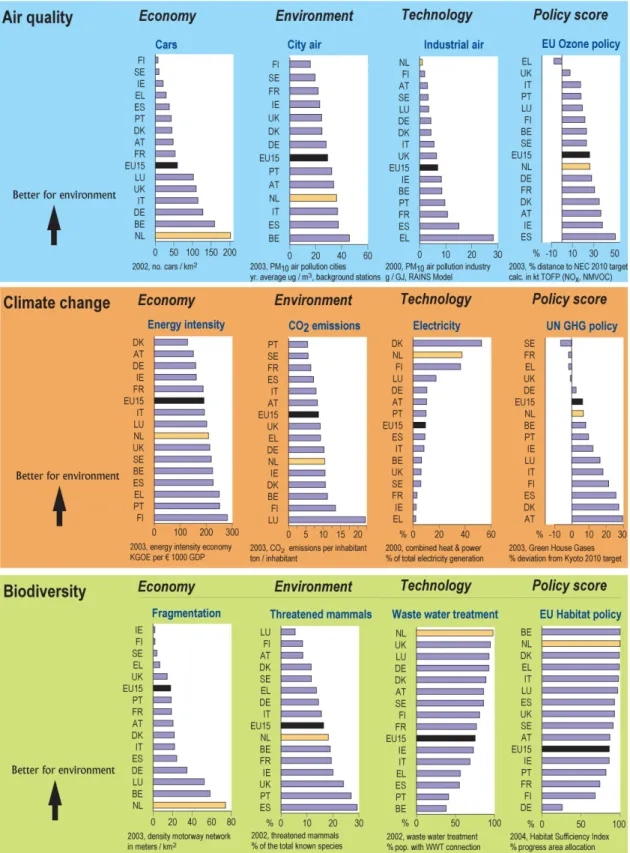
Below are three examples of this kind of analysis for the environmental dossiers Air Quality, Climate Change and Biodiversity (see Figure 2).
Air Quality The facts
One of the criteria for the quality of the air is the amount of fine particulate matter it contains. Since fine particulates constitute a health hazard, there has been a European standard for maximum concentrations of fine particulates in force since 1 January 2005. Most of these tiny particles in the air over the Netherlands originate in neighbouring countries. Using technologies such as tall smokestacks, we pollute our neighbours’ air, and they befoul ours. The main sources of fine-particulate pollution are the road transport and industrial sectors. Within the road transport sector, diesel-powered vehicles (cars, vans and lorries), cause the most pollution, in the form of soot.
The performance
The Netherlands is one of the most densely populated countries in Europe and has the highest car density. The resulting estimated premature death toll as a result of fine
particulates is also one of the highest in Europe. Our use of sophisticated technologies such as catalytic converters in cars and industrial air purification systems, as well as a relatively low proportion of diesel cars, puts us among the best in Europe. Despite all the policy efforts to the contrary, the air quality in the Netherlands, measured for fine particulates, is still medium to poor compared with the EU15 average. Dutch policy performance for achieving the European NOx and NMVOC emissions targets are at the EU15 average.
We can conclude from the above that, despite the use of beneficial technologies, high environmental pressure gives the quality of the air in the Netherlands a relatively poor score. The Netherlands’ policy performance is at the EU15 average in the air quality dossier. Climate change
The facts
Human activity is partly responsible for climate change, which is essentially a problem of energy. The burning of fossil fuels exacerbates the greenhouse effect. Solutions include raising energy efficiency, generating and using sustainable and nuclear energy and technological innovations that reduce greenhouse gas emissions.
The performance
The Netherlands has a great deal of heavy industry, which makes the energy intensity of the economy relatively high. This is partly why CO2 emissions in the Netherlands are relatively high. However, production is energy-efficient. Combined with its use of co-generation technology and the energy efficiency of its base-metal industry, this puts the Netherlands in the European top. The energy efficiency of Dutch power stations is somewhat better than the EU15 average. The amount of energy generated from sustainable sources, however, scores low. Measured against the Kyoto targets, the policy performance of the Netherlands is more or less at the EU15 average.
With regard to climate change, the Netherlands thus has high CO2 environmental pressure, good performance with regard to the use of new technology, relatively low sustainable energy generation and average policy performance.
Biodiversity The facts
Plants and animals are threatened with extinction world-wide, due to the reduction and fragmentation of habitats, pollution, overuse of natural resources (e.g. fish and timber) and climate change. Solutions that preserve nature include protecting species or areas or using them in a sustainable way. By consuming or using imported products such as meat, livestock feed and wood, the Dutch also influence nature in other countries.
The performance
Species and areas: the Netherlands is densely populated, which means that the amount of ‘natural’ area is relatively small and fragmented compared to other EU countries. Nowhere is the burden on nature from agricultural nitrogen as high as it is in the Netherlands. A great many mammals are threatened, but no more severely than in other EU countries. A relatively large share of Dutch ‘nature’ has a protected status and the Netherlands leads the EU in designating protected areas in the framework of the Bird and Habitat Directive.
Consumption: The Dutch eat less meat and fish than the EU15 average. Their use of paper (and thus wood as its ingredient), however, is relatively high. The Dutch performance on the ‘ecological footprint’ – a measure of the virtual surface area needed to provide for a
country’s lifestyle – is somewhat better than the EU15 average.
We can conclude from the above that the Dutch use an average share of the world’s natural resources. On the other hand, the amount of natural area in the Netherlands is slight and fragmented, but largely protected.
The Netherlands’ environmental performance
The Air Quality, Climate Change and Biodiversity dossiers show that the environmental performance of the Netherlands varies considerably. It is strongly influenced by the density of population, livestock, infrastructure and industry, otherwise known as country-specific factors. It is not surprising, therefore, that our performance on environmental pressure and environmental quality indicators is often below the EU15 average. In our use of clean technologies, however, we are among the best in Europe. As far as policy performance is concerned, the Netherlands in general performs at or above the EU15 average.
EBI limitations
The ‘European Benchmark Indicators’ is not a panacea. The indicator set was developed to aid in comparing environmental performance between European countries. It originated in a reasonably pragmatic way and is structured around a number of dossiers, such as those outlined above. The EBI indicators are accordingly not set in stone, but can be expanded or modified.
A striking observation while setting up the EBI was that the data, in particular for the aspect policy performance (see Figure 1), were not easily available or up to date. As an example, the latest officially published data from the European Commission about countries’ progress towards the targets set in the Nitrate Directive are for 1997!
Figure 2: The Netherlands’ environmental performance in Europe for the dossiers Air, Climate and Biodiversity.