This investigation has been performed by order and for the account of the Directorate General for Environmental Protection, Division Climatical Change and Industry and the Director Environmental Risks and Safety Division, within the framework of project 607165 Integrated Monitoring Area Lheebroekerzand (formerly 673710, 259101 and 607160), that is part of the UN-ECE International Cooperative Programme on Integrated Monitoring on Air Pollution Effects.
National Institute for Public Health and the Environment (RIVM), P.O. Box 1, 3720 BA Bilthoven, the Netherlands, Telephone: +31 - 30 - 274 91 11, Fax: +31 - 30 - 274 29 71
Interpretation of integrated monitoring data gathered at the Lheebroekerzand in the Netherlands.
E.A.M. Mathijssen-Spiekman, M.A.H. Wolters-Balk, D. de Zwart and F.G. Wortelboer
Mailing list
1 J. Sliggers (DGM-KvI)
2 S. Kleemola (Finnish Environment Institute, ICP-IM Programme Centre, Finland) 3 L. Lundin (Swedish Environmental Protection Agency, Chairman ICP-IM, Sweden) 4 A. Pacl (Czech Hydrometeorological Institute, NFP ICP-IM Czech Republic) 5 J. Sienkiewicz (Institute of Environmental Protection, NFP ICP-IM Poland) 6 M. Mirtl (Federal Environmental Agency, NFP ICP-IM Austria)
7 K.E. Nielsen (National Environmental Research Institute, NFP ICP-IM Denmark) 8 Baron Ir. F.W. van Tuijll tot Serooskerken (State Forestry Service :SBB)
9 P. Kerssies (State Forestry Service :SBB) 10 A. Henckel (State Forestry Service : SBB) 11 G. Warmerdan (State Forestry Service : SBB) 12 J. Streefkerk (State Forestry Service : SBB) 13 Dr. H. van Dam (AquaSense TEC)
14 A.F.M. van Hees (Alterra) 15 B. Hoentjen (Provincie Drenthe)
16 M.Fagel (Waterschap Reest en Wieden) 17 A.J. van Dijk (SOVON)
18 K. Veling (Dutch Butterfly Conservation) 19 C. van Swaay (Dutch Butterfly Conservation) 20 K.A. van Eerde
21 J. Kleine
22 Dr. J.W. Erisman (ECN)
23 Drs. J.H. Donner (Insecten Onderzoekbureau Donner) 24 Drs. J.H. Kuchlein (Tinea)
25 Depot of Dutch Publications and Dutch Bibliography 26 Board of Directors RIVM
27 Prof. Ir. N.D. van Egmond (RIVM) 28 Dr. Ir. G. de Mik (RIVM)
29 Ir. F. Langeweg (RIVM) 30 Dr. P. van Zoonen (RIVM) 31 Drs. J.H. Canton (RIVM) 32 Dr. D. van Lith (RIVM) 33 Ir. A.H.M. Bresser (RIVM) 34 Ir. R. van den Berg (RIVM) 35 Ir. H.J. van de Wiel (RIVM) 36 Drs. R.J.M. Maas (RIVM)
37 Department Information and Public Relations (RIVM) 38 Prof. Dr. J.P. Hettelingh (RIVM)
39 Dr. M. Posch (RIVM) 40 Dr. H.J.P.A.Verkaar (RIVM) 41 Dr. A.M. Breure (RIVM) 42 G.G. van Dijk (RIVM) 43 Dr. C.D. Mulder (RIVM) 44 R. van Veen (RIVM) 45 Dr. P. van Beelen (RIVM) 46 Drs. M.H. Broekman (RIVM) 47 Dr. F.A.A.M. de Leeuw (RIVM) 48 Ir. A. Stolk (RIVM)
49 Ir. W. van Duijvenbooden (RIVM) 50 Drs. J. Wiertz (RIVM)
51 Dr. Ir. J.R.M. Alkemade (RIVM) 52 H. Prins (RIVM)
53 D. Wever (RIVM)
54 H.L.J. van Maaren (RIVM) 55 R. Jeths (RIVM)
56 L. Gast (RIVM)
57 W.H. Willemsen (RIVM) 58 Dr. Ir. R.F.M.J. Cleven (RIVM)
59 Drs. R. Ritsema (RIVM) 60 Mrs. E. Smit (RIVM) 61 Mrs. G.W.M. Nagtegaal-Wouterse (RIVM) 62 Mrs. I. Eisen (RIVM) 63-66 Authors 67-68 Library RIVM
69 Bureau Reports Registration 70-100 Copies for participants ICP-IM 101-110 Bureau Reports Sales
Contents
ABSTRACT ...7
SAMENVATTING... 9
SUMMARY... 13
1. INTRODUCTION ... 17
1.1. BACKGROUND AND FRAMEWORK... 17
1.2. THE RIVM PROJECT: INTEGRATED MONITORING AREA LHEEBROEKERZAND... 17
1.3. OBJECTIVES OF THE PRESENT REPORT... 18
2. INTEGRATED MONITORING AREA LHEEBROEKERZAND... 19
2.1. THE SITE... 19 2.1.1. General description...19 2.1.2. Geomorphology ...20 2.1.3. Hydrology ...20 2.1.4. Vegetation ...21 2.2. THE MONITORING PROGRAMME... 21 2.3. THE MONITORING DATA... 22 3. TREND ANALYSIS... 25
3.1. MATERIAL AND METHOD... 25
3.1.1. Data preparation ...25
3.1.2. Statistical method...26
3.2. RESULTS AND DISCUSSION... 26
3.2.1. Biological variables...26
3.2.2. Chemical variables ...30
3.3. DISCUSSION ON TRENDS IN DIFFERENT COMPARTMENTS... 35
4. CORRELATION ANALYSIS... 41
4.1. MATERIAL AND METHOD... 41
4.1.1. Data preparation ...41
4.1.2. Statistical method...42
4.2. RESULTS AND DISCUSSION... 42
4.2.1. Inventory of birds (BB) ...45
4.2.2. Inventory of butterflies (BF) ...45
4.2.3. Inventory of leafminers and Trunk Epiphytes (LM and EP)...45
4.2.4. Lakewater biology (LB) ...45
4.2.5. Forest damage (FD)...46
5. CONCLUSIONS AND RECOMMENDATIONS ... 47
5.2. CONCLUSIONS CORRELATIONS... 48
5.3. RECOMMENDATIONS... 48
REFERENCES... 49
APPENDIX I AVAILABLE DATA WITH THEIR SOURCE... 53
APPENDIX II DATA HELD IN THE DATABASE OF THE LHEEBROEKERZAND... 55
APPENDIX III INFORMATION STORED IN THE DATABASE ... 57
APPENDIX IV GRAPHS OF TRENDS... 59
APPENDIX V GRAPHS OF CORRELATIONS... 71
A
BSTRACT
In 1993 the Dutch monitoring station Lheebroekerzand became part of the network of the International Co-operative Programme on Integrated Monitoring on Air Pollution Effects. The contribution of the Dutch monitoring activities was set up according to the Manual for Integrated Monitoring and was executed under supervision of the Laboratory for Ecotoxicology of the National Institute for Public Health and the Environment. From 1993 to 1999 a database was build up with data collected in the Lheebroekerzand. Data from studies carried out in the Lheebroekerzand before 1993 were obtained from co-operating organisations and institutes or found in literature.
The first objective of this study is to detect and estimate trends in the extensive amount of monitoring data of the chemical, physical and biological variables through time. The second objective is to determine whether correlations between biological and chemical monitoring data are present. Only biological variables showing a trend through time, and chemical variables related to the environmental themes acidification, eutrophication, desiccation and the presence of heavy metals are examined.
Results of the trend analysis of the biological variables show that there is no indication for a degradation of the bird, leafminer, epiphyte or macrofauna communities in the Lheebroekerzand. However the decrease in the total number of observed butterflies can be marked as an alarming situation. The condition of the trees is improving through time. The chemical concentrations of most pollutants indicate a downward trend in the different compartments of the ecosystem, with exception of ammonium, nitrate and sulphate in lakewater, the acidity of the lakewater and the concentration of lead in leaves and needles.
Correlations between biological and chemical variables are seen for the presence of butterflies with cadmium, lead and sulphur content in air and deposition and defoliation of the trees is correlated with sulphur, nitrogen and acidity in air and deposition. Substances responsible for acidification, eutrophication, desiccation and the presence of heavy metals in the ecosystem do not have a marked influence on the presence of birds, leafminers, epiphytes and macrofauna in the Lheebroekerzand. If the reduction in emissions in Europe will be continued in future years, it is to be expected that the amount of most chemical compounds in the compartments lakewater, leaves and needles will diminish in future as well.
S
AMENVATTING
In 1993 is het monitoring gebied in het Lheebroekerzand ingericht en opgenomen in het internationale netwerk van monitoring sites van het “International Co-operative Programme on Integrated Monitoring on Air Pollution Effects”. De monitoring werd uitgevoerd volgens de “Manual for Integrated Monitoring” onder supervisie van het Laboratorium voor Ecotoxicologie van het Rijksinstituut voor Volksgezondheid en Milieu. Van 1993 tot en met 1999 werd een database gevuld met resultaten van het eigen onderzoek. Vervolgens werd deze database aangevuld met resultaten van onderzoek uitgevoerd in het Lheebroekerzand voor 1993. Deze gegevens werden verkregen van samenwerkende organisaties en instituten of werden gehaald uit de literatuur.
De beschikbaarheid van de vele chemische, fysische en biologische gegevens verzameld in het Lheebroekerzand, biedt de mogelijkheid om na te gaan of er trends in de tijd en eventuele relaties tussen de variabelen zijn waar te nemen.
Het eerste doel van dit onderzoek is om na te gaan of er met de beschikbare monitoringgegevens trends in de tijd statistisch zijn aan te tonen. Het tweede doel is om, van de biologische variabelen waarvoor statistisch een trend in de tijd is aangetoond, na te gaan of er correlaties te vinden zijn met chemische variabelen. De correlatieanalyse is beperkt tot chemische variabelen die gerelateerd zijn aan de milieubeleidsthema’s verzuring, vermesting, verdroging en de aanwezigheid van zware metalen.
Het biologische gedeelte van het monitoringprogramma bestond uit een regelmatige inventarisatie van vogels, korstmossen, vlinders, bladmineerders en de vegetatie, evenals inventarisaties van de macrofauna aanwezig in het ven Kliplo en observaties aan naaldbomen ter bepaling van de vitaliteit. Het chemisch-fysische deel van het programma bestond uit meteorologische variabelen zoals temperatuur, luchtvochtigheid, hoeveelheid neerslag en instraling samen met chemische analyses van lucht, neerslag, bladeren, naalden, mossen, bodem, bodemwater, grondwater en venwater.
Resultaten en conclusies betreffende de trends in de tijd zijn:
ü Van de 69 voorkomende vogelsoorten vertoonden 8 soorten een afname in de tijd en 5 soorten een toename in de tijd. Het aantal soorten, het totaal aantal waargenomen individuen en de Shannon Wiener Diversity Index veranderden niet in de tijd.
ü Van de 24 waargenomen soorten vlinders vertoonden 4 soorten een afname in de tijd en geen van de soorten een toename. Het aantal soorten veranderde niet, maar het totaal aantal waargenomen individuen nam af in de tijd. De Shannon Wiener Diversity Index vertoonde een afnemende trend in de tijd.
ü Van de bladmineerders vertoonde één van de 18 soorten een afname in de tijd; de Shannon Wiener Diversity Index en het aantal soorten namen eveneens af in de tijd, maar het totaal aantal individuen veranderde niet.
ü Het aantal soorten korstmossen nam toe in de tijd.
twee een afname in de tijd vertoonden en vijf een toename te zien gaven. Het aantal soorten, het totaal aantal organismen en de Shannon Wiener Diversity Index veranderden niet.
ü In het monitoring programma “Forest Damage” is alleen een afnemende trend in de tijd waargenomen voor de variabele ontbladering.
ü Er is geen reden tot ongerustheid betreffende de aanwezigheid van vogels, bladmineerders, korstmossen en macrofauna in het Lheebroekerzand.
ü De afname van het totaal aantal geobserveerde vlinders geeft aanleiding tot verder onderzoek. ü De conditie van de bomen verbetert in de tijd.
ü Een groot deel van de chemische stoffen vertonen een afname in de tijd in de verschillende compartimenten van het ecosysteem.
ü Gedurende de gemeten periode vertonen concentraties van ammonium, nitraat en sulfaat in het venwater een toename in de tijd. Ook de zuurgraad vertoont een toenemende trend.
ü In bladeren en naalden is de afnemende trend voor lood zoals waargenomen in de overige compartimenten niet geconstateerd.
ü Als de afname in emissies in Europa gecontinueerd wordt in de komende jaren is het te verwachten dat ook de hoeveelheid anthropogene verbindingen in het venwater, de bladeren en de naalden gaan afnemen.
Resultaten en conclusies betreffende mogelijke correlaties tussen biologische en chemische variabelen zijn:
ü Stoffen verantwoordelijk voor verzuring, vermesting, verdroging en de aanwezigheid van zware metalen in het ecosysteem hebben, in de aanwezige concentraties in het Lheebroekerzand, geen aantoonbare invloed op de aanwezigheid van vogels, bladmineerders, korstmossen en macrofauna.
ü De aanwezigheid van de gemeten concentraties van cadmium, lood en zwavel in het Lheebroekerzand lijkt invloed te hebben op het voorkomen van vlinders.
ü Voor de variabele ontbladering gemeten in het monitoring programma “Forest Damage” is een correlatie gevonden met zwavel en stikstof in lucht en in regenwater, en met de zuurgraad van het regenwater. Dit kan er op wijzen dat verzuring en vermesting invloed hebben op de conditie van de bomen in het Lheebroekerzand.
Aanbevelingen:
ü Om meer overlappende data van biologische en chemische variabelen en langere tijdseries te verkrijgen moet de database uitgebreid worden met gegevens uit onderzoek voor 1993.
ü Indirecte correlaties tussen alle gemeten variabelen kunnen onderzocht worden.
internationale database van het ICP-IM.
ü Indien meer data beschikbaar zijn kan een multivariate analyse uitgevoerd worden. ü De afname van de vlinders dient nader onderzocht te worden.
ü Om de verbetering van het ecosysteem te kunnen blijven volgen in de tijd is monitoring in de toekomst noodzakelijk.
De resultaten van dit onderzoek bevestigen dat de genomen emissie beperkende maatregelen in Nederland effectief zijn geweest. Het herstel van het ecosysteem heeft daarentegen nog niet volledig plaatsgevonden.
S
UMMARY
In 1993 the Dutch monitoring station Lheebroekerzand became part of the network of the International Co-operative Programme on Integrated Monitoring on Air Pollution Effects. The contribution of the Dutch monitoring activities was set up according to the Manual for Integrated Monitoring and was executed under supervision of the Laboratory for Ecotoxicology of the National Institute for Public Health and the Environment. From 1993 to 1999 a database was build up with data collected in the Lheebroekerzand. Data from studies carried out in the Lheebroekerzand before 1993 was obtained from co-operating organisations and institutes or found in literature.
The availability of chemical, physical and biological data gathered at the Lheebroekerzand from 1993 to 1999, supplemented with data from studies from previous years, gives the opportunity to analyse and characterise the data for possible trends and correlations.
The first objective of this study is to detect and estimate trends in the extensive amount of monitoring data of the chemical, physical and biological variables through time. The second objective is to determine whether correlations between biological and chemical monitoring data are present. Only biological variables showing a trend through time, and chemical variables related to the environmental themes acidification, eutrophication, desiccation and the presence of heavy metals have been taken into account.
The biological monitoring activities consisted of a regular inventory of breeding birds, epiphytes, butterflies, leafminers and vegetation in the monitoring area, as well as inventories of aquatic macrofauna in the moorland pool Kliplo and observations on the performance of pine trees. The chemical-physical part included meteorological parameters like temperature, humidity, the amount of precipitation and irradiation, together with chemical analysis of organic and inorganic compounds in air, wet and dry deposition, mosses, leaves and needles, lake water, soil, soilwater and groundwater.
Results and conclusions concerning the trends through time are:
ü For birds, 8 species showed a downward trend against 5 species an upward trend of the total of 69 observed species. The number of species, the total number of organisms and the Shannon Wiener Diversity Index did not change through time.
ü From the total of 24 observed species of butterflies, 4 species showed a downward trend in time and none showed an upward trend. The number of species did not change but the total number of organisms showed a decreasing trend. The Shannon Wiener Diversity Index showed an increasing trend through time.
ü For leafminers one of the 18 species showed a downward trend; the Shannon Wiener Diversity Index and the number of species were decreasing through time but the total number of organisms did not change.
ü The number of species of epiphytes is increasing through time.
5 species an upward trend. The number of species, the total number of organisms and the Shannon Wiener Diversity Index did not change.
ü For the monitoring programme Forest Damage the only variable with a downward trend was defoliation.
ü There is no indication for degradation in the presence of birds, leafminers, epiphytes and macrofauna in the Lheebroekerzand.
ü The decrease in the total number of organisms of butterflies can be marked as an alarming situation.
ü The condition of the foliage is improving in time.
ü A substantial part of the chemical pollutants indicate a downward trend in the different compartments of the ecosystem. However concentrations of ammonium, nitrate and sulphate in lakewater are still showing an upward trend. Also the acidity of the lakewater is not diminished during the monitored period.
ü The observed downward trends in chemical variables are not detected for lead in leaves and needles.
ü If the reduction in emissions in Europe will be continued in future years, it is to be expected that the amount of most chemical compounds in the compartments lakewater, leaves and needles will diminish in future as well.
Results and conclusions concerning the correlations between biological and chemical monitoring variables are:
ü Substances responsible for acidification, eutrophication, desiccation and the presence of heavy metals in the ecosystem do not have a marked influence on the presence of birds, leafminers, epiphytes and macrofauna in the Lheebroekerzand.
ü For the presence of butterflies it seems that there is a correlation with the cadmium, lead and sulphur content in air and deposition.
ü The defoliation measured in the monitoring programme Forest Damage demonstrates a correlation with the sulphur, nitrogen and acidity in air and deposition. This could mean that acidification and eutrophication have influence on the foliage of the trees in the Lheebroekerzand.
Recommendations:
ü More data of previous years has to be collected to obtain more overlapping data of biological and chemical variables and to ensure longer time-periods.
ü Indirect correlations between variables should be studied.
ü Trend and correlation analysis should be verified with the data of the international database of ICP-IM.
ü With more data involved, it is possible to carry out multivariate analysis.
ü The decrease of the presence of butterflies in the Lheebroekerzand needs to be studied. ü For tracing the recovery of the ecosystem, more years of monitoring is necessary.
The results of this study confirm that the emission reduction policy in the Netherlands has been effective. However, reduced exposure to pollutants is not yet fully reflected in ecosystem recovery.
1.
I
NTRODUCTION
1.1. Background and framework
In 1979 several monitoring programmes started within the UN-ECE Convention on Long-range Transboundary Air Pollution (CLRTAP) with the purpose of monitoring and assessing effects of air pollutants on the environment. The International Co-operative Programme on Integrated Monitoring on Air Pollution Effects (ICP-IM) started in 1989 with a three year Pilot Programme with 36 monitoring sites participated grossly distributed over Europe and Canada. In 1992 ICP-IM has been established. From 1993 to 1999 the Netherlands’ site the Lheebroekerzand was part of the network of ICP-IM. The most important objective of this integrated effect-directed programme is to determine and predict the state and change of terrestrial and freshwater ecosystems in a long-term perspective with respect to the impact of air pollutants.
In 1999 22 countries carried out the integrated monitoring programme with 70 sites in Europe and Canada.
Studies about the effects of exposure to air pollutants acting on particular receptors indicate the need of an integrated approach in order to understand the underlying mechanisms for the observed ecological effects. Special attention is needed to investigate the ecological impact of critical exposure. This can be accomplished by putting more emphasis on studies concerning the biological effects and the relationship with local chemical exposure levels.
The availability of chemical, physical and biological data gathered at the Lheebroekerzand from 1993 to 1999, supplemented with data from studies from previous years, gives an opportunity to detect and characterise possible causal relationships by means of trend- and correlation analysis.
1.2. The RIVM project: Integrated Monitoring Area Lheebroekerzand
Since 1989 the site at Lheebroekerzand, in the province of Drenthe, was gradually developed. Lheebroekerzand was chosen as a monitoring site because it most presumably represents the background concentration levels of many pollutants in the Netherlands. The relative “clean” ecological situation of the Lheebroekerzand and its biological function is expected to be quite vulnerable to the impact of significant changes in chemical compositions in different environmental compartments. Monitoring these changes is from a scientific view therefore very interesting and important. The area is located in a forest and nature reserve. Many studies have already been carried out in this area and many are still going on.
The co-ordination of the monitoring activities and the collection of data were carried out by the Laboratory for Ecotoxicology from the National Institute for Public Health and the Environment (RIVM-ECO). RIVM-ECO is the National Focal Point of the Netherlands for ICP-IM. In 1993, fieldwork started according to the Manual for Integrated Monitoring Programme Phase 1993-1996 (UN-ECE, 1993). Data of previous studies carried out in the Lheebroekerzand were collected and made available. For the subprogramme on Lakewater chemistry, the available data dated back to as early as
1924. In addition to the parameters in the subprogrammes in the Manual, additional biological parameters were added to the national programme. The biological monitoring activities consisted of regular inventories of breeding birds, epiphytes, butterflies, leafminers and vegetation in the monitoring area, as well as inventories of aquatic macrofauna in the moorland pool Kliplo and observations on the health and performance status of pine trees. The chemical-physical part included meteorological parameters such as temperature, humidity, the amount of precipitation and irradiation, with chemical analysis of organic and inorganic compounds in air, wet and dry deposition, mosses, leaves and needles, lakewater, soil, soilwater and groundwater.
Many national institutes, organisations and volunteers made it possible to carry out this ambitious monitoring programme.
Since the start of the monitoring programme in 1993 there has been pressure on continuity. Every year, the importance of integrated monitoring in the Netherlands had to be proven. Many internal RIVM-discussions and presentations were passed. In 1997 the Director Environmental Research of RIVM concluded that the project did not provide the information that was required for the national tasks of RIVM. Still the decision to stop the monitoring task was postponed to enable the identification of topics that may be of national interest. In June 1999 this was successful. Co-operation was found with several projects within RIVM and requests for data for the validation of modelling results were regularly posed.
Unfortunately, in July 1999, the Dutch Minister of the Environment decided to put an end to the Dutch contribution to the ICP on Integrated Monitoring. This decision was taken in view of budget restrictions for national environmental research. In January 2000 the research equipment was removed from the site at Lheebroekerzand.
The history, the objectives of the programme, the surveys of the monitoring data, as well as the organisational aspects of the monitoring site the Lheebroekerzand are described in several RIVM reports published by Mathijssen-Spiekman et al. (1994, 1995a, 1995b, 1996, 1998 and 2001).
1.3. Objectives of the present report
The dataset of the Lheebroekerzand, including chemical, physical and biological variables, is used to study and characterise the underlying correlations by means of trend– and correlation analysis. The objectives of this report are:
a) to detect and estimate trends through time in the monitoring data of the chemical, physical and biological variables;
b) to determine whether direct effects of the chemical monitored parameters on the biology could be assessed by correlation analyses.
2.
I
NTEGRATED
M
ONITORING
A
REA
L
HEEBROEKERZAND
2.1. The site
2.1.1. General description
The Dutch monitoring station Lheebroekerzand is situated in the north-eastern part of the Netherlands, approximately 4 km from the village Dwingeloo in the province of Drenthe (Figure 1). This 95-hectare nature reserve is owned by the State Forestry Service (SBB) and is located within the national park "Dwingelderveld".
BELGIUM NETHERLANDS GERMANY NORTH SEA Latitude: 52°49'51" Longitude: 6°25'58"
Figure 1: Location of the Lheebroekerzand in the Netherlands.
The national park, consisting of areas of forest, heath and drift sands, covers roughly 3500 hectares. The topography of the area is nearly flat and 12 m above the sea level. It has a locally temperate sea climate with a yearly average temperature of 8.6°C. The soil consists mainly of poor sands, part is humic sand or peat-moor. Table 1 presents basic information of the site.
The forest was established in 1918-1930 in a region that was originally a drift sand area. Today diverse vegetation exists in the area including trees, shrubs, heath and mosses. The site also provides suitable habitats for birds, foxes, squirrels, deer, reptiles and amphibians. Within the area a small oligotrophic lake, Kliplo, is located. This rainwater-fed lake has a surface of 0.6 hectares, aquatic biota as well as chemical features are monitored. Kliplo is selected because of its diversity of aquatic species and its well-preserved character.
Table 1: Basic information of the Lheebroekerzand.
Geographical co-ordinates 52º49'51" N 6º25'58" E
Size 95 ha (surroundings 3500 ha)
Owner State Forestry Service
Protection status Nature reserve
Maximum / minimum elevation 13.5 / 12.0 metres
Vegetation zone Nemoral deciduous forest region Long-term average precipitation 780 mm/year
(30-year period 1961-1990)
Long-term average temperature 8.6° C (30-year period 1961-1990)
Climate Temperate sea climate
Length of vegetation period 200 days/year (mean temperature > 5 ° C
for 5 consecutive days)
Dominant vegetation Pinus sylvestris
Dominant soil type Sand
Anthropogenic stress Highway, small villages, farmers
2.1.2. Geomorphology
The Lheebroekerzand area is part of a larger drift sand area, arisen in the Holocene "Formation of Kootwijk". The drift sands in the area are mainly covering eolic sediments "Formation of Eindhoven" or loamy ground moraine "Formation of Drenthe", with partially a thin layer of sand deposit "Formation of Twente" in between. A small part is oligotrophic peat-moor "Formation of Griendsveen" (Castel, 1984).
2.1.3. Hydrology
A thorough hydrological survey of the Dwingelderveld was made by T. Bakker, 1984. The hydrology of the monitoring area can be extracted from this survey. The Lheebroekerzand monitoring area contains the following pools: "Reigersplas", "Droseraveen" and "Kliplo". Only Kliplo is included in the ICP-IM-programme for water chemistry and hydrobiology. The pool probably originated as a result of compression of certain layers in the soil, thus becoming impermeable for water. About one metre under the pool a layer consisting of boulder clay is found. Due to the relative height of the impermeable layer, Kliplo appears to have a higher water table than the subsoil water table in the surrounding area. All the pools in Lheebroekerzand are hardly influenced by drainage and independent of the surrounding area. They are only fed by rainwater. Because of the glacial layer of boulder clay beneath the pools the exchange with groundwater is impossible. The sand deposit above the clay contains only water in winter when it is almost completely saturated with water. In the summer the sand deposit dries up. Only above impermeable layers the water remains. The Lheebroekerzand, as a part of the Dwingelderveld can be described as an infiltration area. The deep groundwater flux is from east to west with a maximum speed of 10 cm per year (Bakker 1984,
Hoentjen 1993).
2.1.4. Vegetation
From 1908 onwards a nature reserve was established. Within this forest this specific area was developed between 1918 and 1930. Especially within the reserve area a wide variety of vegetation exists including Pinus sylvestris (Scots pine), Quercus robur (Oak), Betula pendula (Birch), Juniperus
communis (Junipertree) as well as many species of heath, mosses and other plants.
2.2. The monitoring programme
From 1993 to 1999 the monitoring programme existed of the subprogrammes described in the Manual for Integrated Monitoring (UN-ECE, 1993) with additional biological monitoring programmes. The monitoring programmes executed in the Lheebroekerzand are:
Biological programmes ✓ Inventory of Birds (BB);
ü Inventory of Butterflies (BF); ü Inventory of Leafminers (LM); ü Inventory of Plants (BV); ü Trunk Epiphytes (EP); ü Hydrobiology of Lakes (LB); ü Vegetation (VG);
ü Forest Damage (FD);
Physical programme ✓ Climate (AM);
Chemical programme ✓ Air Chemistry (AC);
ü Precipitation Chemistry (DC);
ü Throughfall and Stemflow Chemistry (TF, SF); ü Metal Chemistry in Mosses (MC);
ü Soil Chemistry (SC); ü Soil Water Chemistry (SW) ü Groundwater Chemistry (GW); ü Lake Water Chemistry (LC);
ü Foliage and Litterfall Chemistry (FC, LF).
Figure 2 gives an overview of the specific locations where these subprogrammes were executed from 1993 to 1999.
5x50 mtr zero coordinate
bird census area vegetation inventory area
1 2
3
4
5
6
7
1
2
3
4
5
6
7
Climate Lake Chemistry Lake BiologyMetal Chemistry Mosses Precipitation Chemistry Foliage Chemistry Litterfall Chemistry Throughfall Stem Flow
Soil & Groundwater Chemistry Foliage Chemistry
Throughfall Stem Flow
Soil & Groundwater Chemistry Foliage Chemistry
Litterfall Chemistry Forest Damage water
Station Sub-programme
Soil & Groundwater Chemistry route butterfly inventory
Figure 2: Basemap Lheebroekerzand with station and activity indication.
The programmes were carried out according the methods described in the Manual for Integrated Monitoring. Detailed descriptions are published by Mathijssen-Spiekman et al. in the annual national reports (1994, 1995a, 1995b, 1996, 1998, 2001)
2.3. The monitoring data
From 1993 to 1999 data are collected in the Lheebroekerzand for the above mentioned monitoring programmes. Data from studies carried out in the Lheebroekerzand before 1993 were obtained from co-operating organisations and institutes or found in literature. A thorough literature research was not performed. Only data that were already collected during the years of monitoring are incorporated in this study. In Appendix I an overview is given of the complete dataset used for this study with the various sources of supply. Additionally, in Appendix II an overview is given of the available measured variables with their specific monitoring period.
In Figure 3 the availability of data of the different monitoring subprogrammes is shown. For trend analysis it is important to have long timeseries; for correlation analysis overlapping data are needed. Long timeseries are available for the monitoring programmes Lakewater chemistry, Deposition chemistry, Trunk epiphytes and Inventory of birds. Overlapping data are available; only between 1980 and 1999. Unfortunately not all data are appropriate to use for the analyses. Particularly data of the longer time series can’t be used because data are not consistent over the years, mostly because of changing procedures (indicated in Figure 3).
1920 1930 1940 1950 1960 1970 1980 1990 2000 BB BF LM EP LB FD AC DC TF SF MC GW LC FC LF su b p ro gra mme year Not used Used
Figure 3: Data held in the Lheebroekerzand database.
All the results of field measurements and observations in the Lheebroekerzand were collected, checked and stored in the RIVM-ECO database that is constructed in DataPerfect software. The database includes relevant information for every measured value such as sampling conditions, method of analysing and value below detection limit. In Appendix III the additional information is explained.
3.
T
REND ANALYSIS
The first objective of this study is to detect and estimate trends in the monitoring data of the chemical-, physical- and biological variables over time. Statistical methods and graphical presentations for trend analysis give the opportunity to identify at a glance the observed variation over a relevant period of time. The detection and estimation of trends is complicated by characteristics of the monitoring data. For long-term studies, variations in the measurements can be caused by actual trends but also by changes in sampling- and analytical procedures and by seasonal or other cyclic fluctuations. Anticipating on variations possibly caused by changing sampling and analytical procedure data were checked. No attention is paid to variations caused by seasonality, because the time-series cover enough years of monitoring to make it possible to detect trends over the years.
An important requirement in trend analysis is the availability of complete datasets without missing values. The analysis is getting more complicated in situations that the period of missing values is becoming substantial. There is no uniform strategy how to handle such datasets. Helsel and Hirsch (1995) recommend using all data values when the period of missing values does not exceed a third of the total time domain.
3.1. Material and Method
3.1.1. Data preparationThe basis for the trend analysis is the database of the Netherlands of ICP-IM as described in paragraph 2.3. The physical variables are left aside because KNMI and RIVM-LLO did carry out many studies on this subject with a much more extensive dataset.
First, all datasets were checked for observations below detection limits. For these data, the values of the detection limits were divided by a factor of 2. Secondly, the units of similar variables used in the different monitoring programmes were unified.
Furthermore, the datasets were evaluated on the presence of missing values. For biological variables it was assumed that a missing value means that a species is not present. Subsequently, a zero was entered into the list of observations. For chemical variables the missing values were not filled in because the period of missing values did never exceed a third of the total time domain. All data values were used as recommend by Helsel and Hirsch (1995).
Finally, per variable and per monitoring programme the time period on which a trend analysis could be performed was evaluated. If this period was less than 4 years the data were not further used for the analysis. In the event of the programmes Inventory of Plants, Vegetation, Soil chemistry and Soilwater chemistry only data from one or two years of monitoring were available. Therefore, these data were not used for the detection of trends. Subsequently, redundant information was removed from the data. The remaining data were coded using the subprogramme code, the variable code, the date and the value according to
the next example:
BB = Subprogramme code
DRYO MAR = Variable code (species code)
8906 = Date (YYMM)
3.5 = Value
These procedures lead to a dataset that is suitable for the trend analysis.
3.1.2. Statistical method
For the trend analysis the linear regression (model I) has been used (Sokal and Rohlf, 1997). The date is chosen as the independant variable (X), the observed values are assigned the role of the dependant variables (Y). For each variable within each monitoring programme a linear regression has been calculated. If the slope of the regression line differs significantly from zero it means that a trend is determined. Table 2 shows the possible outcomes per variable.
Table 2: Possible trends in the data.
Trend Confidence interval Code significant upward 99.9 99 +++ ++ 95 + no significant trend < 95 o significant downward 95 -99 --99.9
---3.2. Results and Discussion
All statistically significant trends are graphically presented in Appendix IV.
The available data made it possible to carry out 865-trend analyses; 168 significant trends were detected.
3.2.1. Biological variables
Statistically significant trends observed in the biological variables are presented in Tables 3 (downward in time) and 4 (upward in time).
Table 3: Biological variables showing a significant downward trend. (-: p<0.05; --: p<0.01; ---: p<0.001)
Subprogramme Code
variable Variable Period Trend
Inventory of Birds DRYOMAR Dryocopus martius 8798
-(BB), species PARUCRI Parus cristatus 8798
-PHOEPHO Phoenicurus phoenicurus 8798
-STURVUL Sturnus vulgaris 8798
-AEGICAU Aegithalos caudatus 87-98
--CARDCAN Carduelis cannabina 87-98
--CUCUCAN Cuculus canorus 87-98
--SYLVBOR Sylvia borin 87-98
--Family STURNIDX Sturnidae (1 species) 8798
-AEGITHAX Aegithaidae (1species) 87-98
--CUCULIDX Cuculidae (1 species) 87-98
--Order CUCULIFS Cuculiformes (1 species) 87-98
--Inventory of PIERNAP Pieris napi 9499
-Butterflies (BF), BOLOAQU Boloria aquilonaris 94-99
--Species OCHLVEN Ochlodes venata 94-99
--NRORG Total number of organisms 94-99
--VACCOPT Vacciniina optilete 94-99
--Family LYCAENIX Lycaenidae (7 species) 9499
-NYMPHALX Nymphalidae (5 species) 9499
-HESPERIX Hesperiidae (4 species) 94-99
--Biological Group
BF7 Species that hibernate as a small caterpillar (section group 4, 2 species)
94-99 --BF9 Species that hibernate as a juvenile
caterpillar and have a short maturation (section group 4, 1 species)
94-99
--BF12 Species that hibernate as a juvenile caterpillar and have a long maturation (section group 4, 5 species)
94-99
--Lnventory of SPP.Bp Number of species on Betula pendula 9397 -Leafminers (LM) ST LUTEE.Bp Stigmella luteella on Betula pendula 9397
-DIX_SW.Bp Shannon-Wiener diversity index of Betula
pendula
93-97
--Hydrobiology of FORELIL Forelia liliacea 9299
-Lakes (LB), species LIMSUBC Limnephilus subcentralis 9299
-Family CORIXIDX Corixidae (21 species) 9299
-Forest Damage (FD)
---Table 4: Biological variables showing a significant upward trend. (+: p<0.05; ++: p<0.01; +++: p<0.001)
Subprogramme Code
variable Variable Period Trend
Inventory of Birds COLUOEA Columba oenas 87-98 +
(BB), species CORVCRO Corvus corone 87-98 +
MOTAALB Motacilla alba 87-98 +
SAXITOR Saxicola torquata 87-98 ++
LULLARB Lullula arborea 87-98 +++
Family COLUMBIX Columbidae (3 species) 87-98 ++
ALAUDIDX Alaudidae (1 species) 87-98 +++
Order COLUMBIS Columbiformes (3 species) 87-98 ++
Inventory of Butterflies (BF)
DIX_SW Shannon-Wiener diversity index 94-99 + Trunk Epiphytes
(EP)
SPPV Number of species 51-99 +++
Hydrobiology of ARREAFF Arrenurus affinis 92-99 +
Lakes (LB), species ARREGLO Arrenurus globator 92-99 +
PELCAES Peltodytes caesus 92-99 +
PLEAMIN Plea minutissima 92-99 +
ARRENEU Arrenurus neumani 92-99 ++
Family AESHNIDX Aeshnidae (6 species) 92-99 +
PLEIDAEX Pleidae (1 species) 92-99 +
ARRENURX Arrenuridae (11 species) 92-99 ++
3.2.1.1 Inventory of birds (BB)
From 1928 to 1998 131 species are observed in the Lheebroekerzand. For all these species a trend analysis is carried out. Trend analysis is also carried out on the Shannon-Wiener index, on the total number of verified species, on the total number of birds and on the family and order level of the organisms. It became obvious that trend analysis on the data of the inventories carried out before 1987 were not reliable, because the inventories were not carried out at regular time-intervals and often only the presence of the species was recorded and not the number of organisms. The presented trend analyses are the results for the period from 1987 to 1998. During this period 69 species are observed.
In Table 3 a downward trend in time is identified for 8 species (Aegithalos caudatus, Carduelis
cannabina, Cuculus canorus, Dryocopus martius, Parus cristatus, Phoenicurus phoenicuris, Sturnus vulgaris and Sylvia borin), 3 families (Aegithaidae, Cuculidae and Sturnidae,) and 1 order
(Cuculiformes). An upward trend in time is identified for 5 species (Columba oenas, Corvus
corone, Lullula arborea, Motacilla alba and Saxicola torquata), 2 families (Alaudidae and Columbidae) and 1 order (Columbiformes) (Table 4). Trends in the Shannon-Wiener index, in
the total number of verified species and in the total number of birds were not found.
Van Dijk et al. (1999) determined indexes for birds for natural habitat plots monitored in the Netherlands. Four of the five species with an upward trend (Corvus corone, Columba oenas,
species (Motacilla alba) is fluctuating during the years 1984-1997 and does not show a clear upward trend. For only two, within a total of 8 species, the downward trend is confirmed by the indexes of Van Dijk (Carduelis cannabina and Sturnus vulgaris). The other downward trends in the Lheebroekerzand could be caused by local conditions (such as tree felling) and are not generally observed in the Netherlands. Influences responsible for changes in the bird population are severe winters, drought, the number of mice and the availability of beechnuts (Van Dijk et al., 1999).
3.2.1.2 Inventory of butterflies (BF)
In the period 1981 to 1990 the inventories only consisted of observations on the number of species . The number of organisms was not counted. A trend in the number of observed species could not be identified for this period. From 1994 to 1999, next to the number of species, the number of organisms was counted. For this period trend analysis is carried out on the species, the families and the orders. Trend analysis is also performed on the total number of species, on the total number of organisms, on the Shannon-Wiener index and on different biological groups. The division in biological groups is done according to F.A. Bink as described in Wijnhoff et al., 1992. On the basis of the way of hibernation of the butterflies the six groups were distinguished as: 1) species that hibernate as grown-up butterflies; 2) Species that hibernate as pupae; 3) species that hibernate in the egg-stage; 4) species that hibernate as a caterpillar (this group is parted in 8 sections, each section corresponds with a way of hibernation of the caterpillar, see Table 3); 5) species that hibernate twice within one generation and 6) species that hibernate the first year as pupae and the second year as caterpillar.
A total of 24 species were recognised from 1994 to 1999.
Table 3 shows a downward trend for 4 species (Boloria aquilonaris, Ochlodes venata, Pieris napi and Vacciniina optilete), 3 families (Lycaenidae, Hesperiidae and Nymphalidae), the total number of organisms and three sections of the fourth biological group. Only the butterflies that hibernate as a caterpillar show a downward trend. On the other hand, the only variable that show an upward trend is the Shannon-Wiener diversity index (Table 4). Trends in the number of individual species are not seen.
Indexes given by Van Swaay and Ketelaar, (2000) for Ochlodes venata and Pieris napi for monitored plots in the Netherlands show the same downward trend. The other two species,
Boloria aquilonaris and Vacciniina optilete are common in the Lheebroekerzand, but became
scarce in other parts of the Netherlands (Veling, 1995). The downward trends for Boloria
aquilonaris and Vacciniina optilete can not be confirmed by indexes of Van Swaay and
Ketelaar.
3.2.1.3 Inventory of leafminers (LM)
Monitoring is carried out from 1993 to 1997. For this whole period trend analysis is possible for the species, the families and the orders. Besides, the available data of the total number of species, the total number of organisms and the Shannon-Wiener diversity index is analysed. A distinction is made for leafminers on different trees.
From the total of 18 observed leafminers species, only one species (Stigmella luteella) showed a downward trend in time on Betula pendula but not on Quercus robur. The number of species and the Shannon-Wiener index (only on Betula pendula) also had a significantly downward trend. The total number of organisms did not change significantly during the period of monitoring.
3.2.1.4 Trunk epiphytes (EP)
Since 1951, inventories on epiphytes were carried out in the Lheebroekerzand. The available data could not be made quantitative. Therefore, only a trend analysis could be carried out on the total number of observed species. This turned out to have a significant upward trend. During the period 1951 to 1999 75 species are determined in the Lheebroekerzand. Per year the number of verified species is varying from 1 to about 40 species.
Van Herk (1998) also mentions the upward trend: the variety of species has changed; acidophytic species disappeared and other species, particularly nitrophytic species appeared.
3.2.1.5 Lakewater biology (LB)
Trend analyses are done for the period 1992 to 1999 for the species, family, order, Shannon-Wiener diversity index, the number of species, total number of organisms and the amount of chlorophyll. From the 256 species only two species showed a downward trend (Forelia liliacea and Limnephilus subcentralis) against five with an upward trend (Arrenurus affinis, Arrenurus
globator, Arrenurus neumani, Peltodytes caesus and Plea minutissima). Just one family
(Corixidae) showed a downward trend and three families (Aeshnidae, Arrenuridae and Pleidae) an upward trend. Trends on the number of species, the total number of organisms, the Shannon-Wiener diversity index and the amount of chlorophyll were not statistically significant.
3.2.1.6 Forest damage (FD)
The data of the whole monitored period (1984-1999) was appropriate to carry out trend analysis on all variables with the exception of the crown height and the crown width, which were only observed in 1998. Only for defoliation a downward trend is detected (Table 3), but this means that the percentage of defoliation is decreasing, thus the condition of the crown of the tree is improving. The upward trends found for the height and the diameter of the trees only mean that the trees are growing as expected. These trends are not shown in Table 4.
3.2.2. Chemical variables
Statistically significant trends observed in the chemical variables are presented in Tables 5 (downward in time) and 6 (upward in time).
Table 5: Chemical variables showing a significant downward trend. (-: p<0.05; --: p<0.01; ---: p<0.001)
Subprogramme Code
variable Variable Period Trend
Air Chemistry (AC) O3 Ozone 8499
-NH4 Nitrogen ammonium 90-99
---NO2 Nitrogen nitrogen dioxide in gas phase 84-99
---NO3 Nitrogen nitrate in gas phase 90-99
---SO2 Sulphur sulphur dioxide 84-99
---SO4 Sulphur sulphate 84-99
---Precipitation Cu Copper filtered 9399
-Chemistry (DC) Al Aluminium filtered 96-99
---Ca Calcium filtered 82-99 ---Cd Cadmium filtered 93-99 ---Cr Chromium filtered 93-99 ---Mg Magnesium filtered 82-99 ---Ni Nickel filtered 93-99 ---Pb Lead filtered 93-99 ---SO4 Sulphate filtered 82-99
---Throughfall PO4 Phosphorous phosphate filtered 8299
-Chemistry (TF) Zn Zinc filtered 9399
-Pinus sylvestris (PS) Cr Chromium filtered 93-99
--Na Sodium filtered 82-99 --Ni Nickel filtered 93-99 --Pb Lead filtered 93-99 --Al Aluminium filtered 96-99 ---Ca Calcium filtered 82-99 ---Cd Cadmium filtered 93-99
---CTY.25 Specific conductivity at 25 °C 82-99
---Mg Magnesium filtered 82-99
---NH4N Nitrogen ammonium filtered 82-99
---NO3 Nitrogen nitrate filtered 82-99
---SO4 Sulphur sulphate filtered 82-99
---TF, Ca Calcium filtered 9399
-Quercus robur (QR) Mg Magnesium filtered 9399
-Na Sodium filtered 93-99 --Pb Lead filtered 93-99 --Al Aluminium filtered 96-99 ---Cd Cadmium filtered 93-99 ---Cr Chromium filtered 93-99 ---Ni Nickel filtered 93-99
---Stemflow Chemistry F Fluoride filtered 8285
-(SF) Pb Lead filtered 9399
-Pinus sylvestris (PS) Al Aluminium filtered 96-99
---As Arsenic filtered 93-99
---Ca Calcium filtered 82-99
---Cd Cadmium filtered 93-99
---Cl Chloride filtered 82-99
---Cr Chromium filtered 93-99
---CTY.25 Specific conductivity at 25 °C 82-99
---Mg Magnesium filtered 82-99
---Na Sodium filtered 82-99
---NH4N Nitrogen ammonium filtered 82-99
---NO3 Nitrogen nitrate filtered 82-99
---Table 5: Chemical variables showing a significant downward trend (continued). (-: p<0.05; --: p<0.01; ---: p<0.001)
Subprogramme Code
variable Variable Period Trend
Stemflow Chemistry Mg Magnesium filtered 9399
-(SF) SO4 Sulphur sulphate filtered 9399
-Quercus robur (QR) Al Aluminium filtered 96-99
--Na Sodium filtered 93-99
--As Arsenic filtered 93-99
---Cd Cadmium filtered 93-99
---Cr Chromium filtered 93-99
---Metal Chemistry of Cu Copper 9399
-Mosses (MC) Ni Nickel 9399
-Pb Lead 9399
-Groundwater Ca Calcium dissolved/filtered 8099
-Chemistry (GW) Fe Iron dissolved/filtered 8999
-Level 1200 cm Mg Magnesium dissolved/filtered 8099
-NO3N Nitrogen nitrate dissolved/filtered 8099
-As Arsenic dissolved/filtered 80-99
--Ni Nickel dissolved/filtered 80-99
--Zn Zinc dissolved/filtered 80-99
---GW, Zn Zinc dissolved/filtered 80-98
--level 3000cm
Lake Water Fe Iron filtered 7696
-Chemistry (LC) Ca Calcium filtered 68-99
--CNR.N320 Colour number nonfiltered 320 nm 81-91 --pH pH of liquids measured in field 24-99
--Ptot Phosphorous total filtered 72-96
--Cl Chloride filtered 58-99
---Wlevel Watermark 82-98
---Foliage Chemistry Fe Iron 9699
-(FC) DW Oven-dry sample weight of 100 9399
-Pinus sylvestris (PS) needles/leaves
FC, Ptot Phosphorous total 94-99
--Quercus robur (QR)
Litterfall Chemistry Cu Copper 9399
-(LF) Ldep Litterfall amount 9399
-Pinus sylvestris (PS) Ptot Phosphorous total 9499
-LF, K Potassium 9399
-Quercus robur (QR) Ldep Litterfall amount 9399
--Table 6: Chemical variables showing a significant upward trend. (+: p<0.05;++: p<0.01;+++-: p<0.001)
Subprogramme Code
Variable Variable Period Trend
Precipitation pH pH of liquids 82-99 ++
Chemistry (DC)
Throughfall PO4 Phosphorous phosphate filtered 93-99 +
Chemistry (TF) pH pH of liquids 93-99 +++
Quercus robur (QR)
Stemflow Chemistry pH pH of liquids 82-99 +++
(SF) RR Precipitation partial 82-99 +++
Pinus sylvestris (PS)
SF K Potassium filtered 93-99 +
Quercus robur (QR) RR Precipitation partial 93-99 +++
Metal Chemistry of As Arsenic 94-99 +
Mosses (MC)
Groundwater COR Organic carbon dissolved/filtered 80-94 ++
Chemistry (GW) Na Sodium dissolved/filtered 80-99 ++
level 1200 cm
GW, Ca Calcium dissolved/filtered 80-98 +
level 3000 cm Mn Manganese dissolved/filtered 90-98 +
SO4S Sulphur sulphate dissolved/filtered 80-98 +
Sr Strontium dissolved filtered 90-98 +
Fe Iron dissolved/filtered 89-98 ++
K Potassium dissolved/filtered 80-98 ++
Cl Chloride dissolved/filtered 80-98 +++
Mg Magnesium dissolved/filtered 80-98 +++
Lake Water Al Aluminium filtered 78-99 +
Chemistry (LC) K Potassium filtered 68-99 +
SO4S Sulphur sulphate filtered 72-99 +
NO3N Nitrogen nitrate filtered 68-99 ++
CNR.N455 Colour number nonfiltered 455nm 90-99 +++
NH4N Nitrogen ammonium filtered 68-99 +++
Foliage Chemistry Stot Sulphur total 94-99 +
(FC) Pb Lead 93-99 +
Pinus sylvestris (PS)
FC, CORT Total organic carbon 93-99 +
Quercus robur (QR) Pb Lead 93-99 +
Litterfall Chemistry Pb Lead 93-99 +
(LF) Sr Strontium 96-99 +
Pinus sylvestris (PS) Stot Sulphur total 94-99 +
Mg Magnesium 93-99 ++
LF, Ca Calcium 93-99 +
Quercus robur (QR) COR Total organic carbon 93-99 +
Pb Lead 93-99 +
3.2.2.1 Air chemistry (AC)
The complete dataset held in the database was appropriate to carry out the trend analysis. All chemical substances in the air compartment, with the exception of ammonia, demonstrate a significant downward trend in concentration (Table 5). For the concentration of ammonia in air no trend is seen.
The decrease of most of the monitored chemical substances in the air compartment at Lheebroekerzand during the last fifteen years indicates that the policy aimed to diminish the emission of air pollutants in the Netherlands seems to be successful.
3.2.2.2 Precipitation chemistry (DC)
Analyses are carried out in rainwater collected in open collectors and with wet-only collectors. The choice is made to use the data on bulk precipitation because these are collected locally and the period of monitoring for the open collectors matches with available data of other monitoring programmes. A number of chemical substances is monitored since 1982. All available data of the bulk monitoring is used for the trend analysis.
Table 5 shows a downward trend for many organic and inorganic chemical compounds. The pH is the only variable with an upward trend. The downward trend for SO4 is also observed in
the air chemistry-monitoring programme.
Statistically significant downward trends of NH4, NO3 and SO4 in bulk deposition are observed
in 50% of the ICP-IM sites for the period 1988-1998 (Forsius et al., 2001). In the Netherlands monitoring area, Forsius only demonstrated a downward trend for NO3. He didn’t detect
trends for SO4 and NH4. The longer time series used in this study (1982-1999) actually does
show a significant downward trend for SO4.
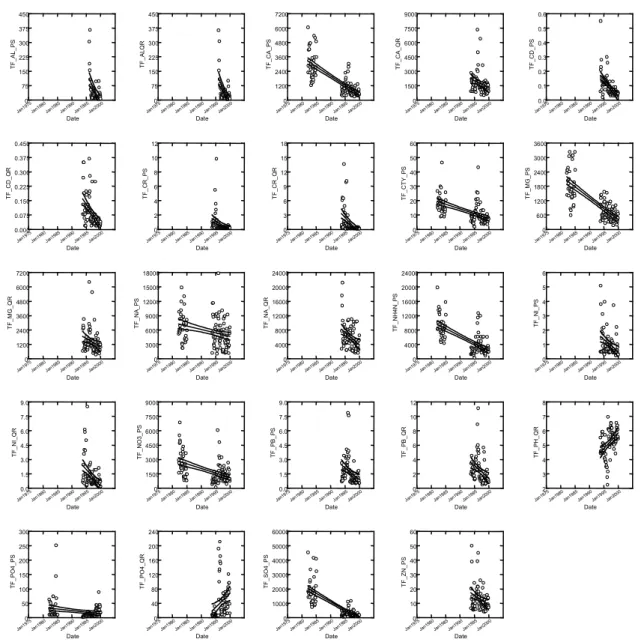
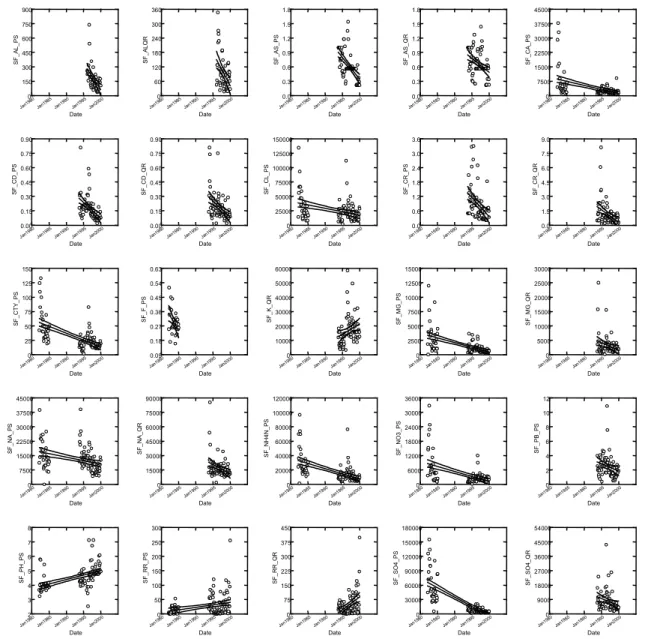
3.2.2.3 Stemflow chemistry (SF) and Throughfall chemistry (TF)
The chemical substances in the stemflow and throughfall compartment are monitored for two different tree species, Pinus sylvestris and Quercus robur. A view of the trends is given per tree species in Table 5 and 6. The start of the period of monitoring varies from 1982 to 1996 per variable. From 1993 to 1999 data from all variables is available with exception of aluminium, which is measured from 1996 to 1999. Most of the chemical concentrations show a downward trend both for P. sylvestris and Q. robur. Only PO4 shows an exception with an upward trend in
throughfall rainwater of Q. robur. The amount of precipitation for stemflow for both tree species shows a clear upward trend, as does pH in stemflow of P. sylvestris, pH in throughfall of Q. robur and potassium in stemflow of Q. robur.
3.2.2.4 Metal chemistry of mosses (MC)
The monitoring period for mosses was relatively short (1993-1999). Nevertheless, 3 downward trends are detected (Cu, Ni and Pb) and 1 upward trend (As) in the total of 23 measured variables (Table 5 and 6).
3.2.2.5 Groundwater chemistry (GW)
Analyses in groundwater are carried out since 1980 in samples taken at two levels below ground level, namely at 1200 and 3000 cm. The number of variables analysed is enlarged in 1990. The period per variable that is used for the trend analysis is given in Table 5 and 6. In total 24 variables are monitored per level. On the level of 1200 cm, 7 downward (As, Ca, Fe, Mg, Ni, NO3, Zn) and 2 upward (COR, Na) trends were detected. At 3000 cm just 1 downward
(Zn) and 8 upward trends (Ca, Cl, Fe, K, Mg, Mn, SO4 and Sr) were seen. It is possible that the
downward trends in concentrations of the chemicals did not yet reach the depth of 3000 cm.
3.2.2.6 Lakewater chemistry (LC)
Since 1924, samples are taken from lake Kliplo. This does not mean that all variables that are part of the current subprogramme LC are monitored since then. Nevertheless a number of data are available for a very long period. Per variable the longest possible time-period is chosen to be subject to trend analysis. From the total of 29 variables, 7 (Ca, Cl, CNR.N320, Fe, Ptot, WM, pH) showed a downward trend and 6 (Al, CNR.N455, K, NH4, NO3, SO4) an upward
trend (Table 5 and 6). Van Dam (1996) also identified a significant increase of SO4, NH4 and K
in lake Kliplo from 1981 to 1994.
An increase of SO4 and a decrease of Ca concentration levels in the lake indicate acidification
processes in this compartment, which is confirmed by the decrease of the pH. Furthermore an eutrophication of the lake is likely, since ammonium and nitrate show increasing concentrations.
3.2.2.7 Foliage chemistry (FC) and Litterfall chemistry (LF)
The chemical substances of the monitored variables are analysed in leaves of the oak Q. robur and in needles of the pine tree P. sylvestris. For foliage and litterfall chemistry similar upward trends are seen for concentrations of Pb, Stot and COR (Table 5 and 6). Downward trends are
less equal. For Foliage chemistry only 3 out of 52 variables show a downward trend against 4 demonstrating an upward trend. For Litterfall chemistry 6 variables show a downward trend and 7 an upward trend.
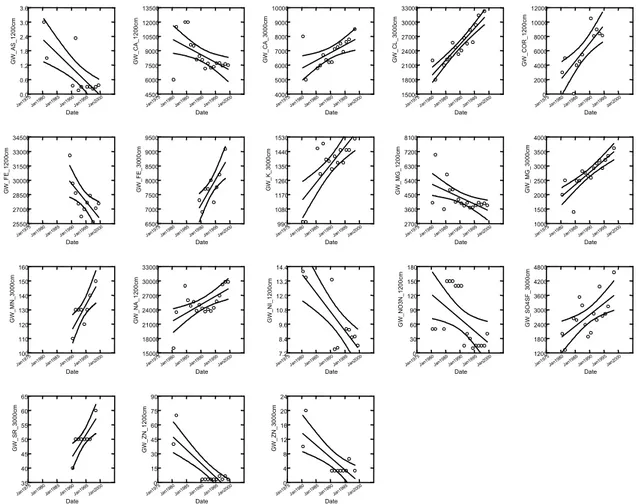
3.3. Discussion on trends in different compartments
To compare the trends in the different compartments a graphical summary is given in figures 4, 5, 6, 7, 8 and 9. The monitoring programmes are put on the x-axis (for abbreviations see Appendix VI) and the significance of the trends on the y-axis (see Table 2). No indicator in the figures means that these variable is not included in this specific programme.
BB BF LM LB EP number of species +++ ++ + - -- ---o BB BF LM LB EP number of organisms +++ ++ + - -- ---o
Figure 4: Trends in biological inventories
The number of species in the different biological groups show no clear similarities. The number of species of birds, butterflies and waterorganisms are not changing significantly in time. More epiphyte species are observed, but less leafminers.
For the number of organisms only the decrease of butterflies is significant.
In order to gain a better view of the effects of these changes more data of monitoring in the future is necessary.
For the chemical variables the sequence of the compartments on the x-axis corresponds to the exposure route for the chemical substances in the area. This route can be roughly divided in the input- (AC, DC), catchment- (TF, SF, MC, FC, LF, LC) and output route (GW). For the comparison only compounds are chosen that are of importance for the environmental problems acidification, eutrophication and presence of heavy metals.
AC DC TF Ps TFQr SF Ps SF Qr FC Ps FC Qr LF Ps LFQ r MC LC G W 1200 G W 3000 pH +++ ++ + - -- ---o
Figure 5: Trend of pH in the different compartments
For pH an upward trend is observed in rainwater (Figure 5). However the trend in pH in lakewater of the lake Kliplo is significantly downward.
AC DC TF Ps TFQ r SF Ps SF Qr FC Ps FC Q r LF Ps LFQ r MC LC G W 1200 G W 3000 ammonia +++ ++ + - -- ---o AC DC TF Ps TFQ r SF Ps SF Qr FC Ps FC Q r LF Ps LFQ r MC LC G W 1200 G W 3000 nitrogen ammonium +++ ++ + - -- ---o AC DC TF Ps TFQ r SF Ps SF Qr FC Ps FC Q r LF Ps LFQ r MC LC G W 1200 G W 3000
nitrogen nitrogen dioxide
+++ ++ + - -- ---o AC DC TF Ps TFQ r SF Ps SF Qr FC Ps FC Q r LF Ps LFQ r MC LC G W 1200 G W 3000 nitrogen nitrate +++ ++ + - -- ---o AC DC TF Ps TFQ r SF Ps SF Qr FC Ps FC Q r LF Ps LFQ r MC LC G W 1200 G W 3000 nitrogen total +++ ++ + - -- ---o
Figure 6: Trends of nitrogen in the different compartments.
Compounds with nitrogen are compared in Figure 6. For the analysed amount of ammonium the trends for most compartments vary between strongly negative and zero. In contrast to the decreasing trend in the input of NO3 and NH4 in air (AC) a statistically significantly increasing
trend of these substances are observed in lakewater.
For phosphorous compounds only a weak upward trend is observed in throughfall rainwater of the oak, whereas an equally weak downward trend is observed in throughfall in pine stands (Figure 7). In the other compartments no trends are detected.
AC DC TF Ps TFQ r SF Ps SF Qr FC Ps FC Q r LF Ps LFQ r MC LC G W 1200 G W 3000 phosphorous phosphate +++ ++ + - -- ---o AC DC TF Ps TFQ r SF Ps SF Qr FC Ps FC Q r LF Ps LFQ r MC LC G W 1200 G W 3000 phosphorous total +++ ++ + - -- ---o
Figure 7: Trends of phosphorous in the different compartments.
in lakewater and groundwater. For the total sulphur concentration in needles an increase is observed (Figure 8), but not for the amount of sulphur in leaves and mosses. The decreases in European emissions of sulphur can be clearly deducted from the results obtained from the Lheebroekerzand ecosystem. AC DC TF Ps TFQ r SF Ps SF Q r FC Ps FC Q r LF P s LF Q r MC LC G W 1200 G W 3000
sulphur sulphur dioxide
+++ ++ + - -- ---o AC DC TF Ps TFQ r SF Ps SF Q r FC Ps FC Q r LF P s LF Q r MC LC G W 1200 G W 3000 sulphur sulphate +++ ++ + - -- ---o AC DC TF Ps TFQ r SF Ps SF Q r FC Ps FC Q r LF P s LF Q r MC LC G W 1200 G W 3000 sulphur total +++ ++ + - -- ---o
Figure 8: Trends of sulphur in the different compartments.
AC DC TF Ps TFQr SF Ps SF Qr FC Ps FC Qr LF P s LF Q r MC LC G W 1200 G W 3000 cadmium +++ ++ + - -- ---o AC DC TF Ps TFQr SF Ps SF Qr FC Ps FC Qr LF P s LF Q r MC LC G W 1200 G W 3000 chromium +++ ++ + - -- ---o AC DC TF Ps TFQr SF Ps SF Qr FC Ps FC Qr LF P s LF Q r MC LC G W 1200 G W 3000 copper +++ ++ + - -- ---o AC DC TF Ps TFQr SF Ps SF Qr FC Ps FC Qr LF P s LF Q r MC LC G W 1200 G W 3000 nickel +++ ++ + - -- ---o AC DC TF Ps TFQr SF Ps SF Qr FC Ps FC Qr LF P s LF Q r MC LC G W 1200 G W 3000 lead +++ ++ + - -- ---o AC DC TF Ps TFQr SF Ps SF Qr FC Ps FC Qr LF P s LF Q r MC LC G W 1200 G W 3000 zinc +++ ++ + - -- ---o
Figure 9: Trends of heavy metals in different compartments .
Heavy metals show a significant decrease in a number of compartments (Figure 9). Only for lead upward trends are observed, i.e. in the leaves and needles of both Quercus robur and
Pinus sylvestris.
In a relative clean area as the Lheebroekerzand a tentative conclusion on the basis of the available data can be that the concentrations in the different compartments of the ecosystem are decreasing. Changes in lakewater and groundwater appear to be less closely related to changes in deposition.
4.
C
ORRELATION ANALYSIS
The second objective of this study is to relate possible causes and effects by determination of correlations between biological and chemical monitoring variables. Only biological variables with significant trends in time were used for this correlation study.
4.1. Material and Method
4.1.1. Data preparationThe dataset as prepared for the trend analysis, consisting of the subprogramme code, the variable code, the date and the value, is used for the correlation analysis.
Correlation analysis is applied to those variables that are important for the objectives of the integrated monitoring programme of ICP-IM causative themes.
The following data are used for the analysis:
1. biological variables with a significant trend in time.
2. yearly averages of the chemical variables with the restriction that for monthly monitored variables a minimum of 9 values is needed and for quarterly measurements 3.
3. data with a minimum of 5 years of overlapping values for the biological and chemical variables.
4. chemical variables related to environmental problems as acidification, eutrophication, desiccation and the presence of heavy metals (Table 7).
5. chemical subprogrammes that are supposed to have a direct influence on the biological subprogramme (Table 8).
Table 7 Chemical substances related to the environmental problems.
Environmental problem Chemical
Acidification SO2, SO4, NH3, NH4, NO2, pH, Stot, Ntot
Eutrophication NO2, NO3, NH3, NH4, PO4, Ntot, Ptot
Desiccation RR, WM, WL
Table 8: Combination of subprogrammes chosen for the correlation analysis.
Subprogramme Air Precipitation Throughfall/ Lake Foliage/ Ground
Chemistry Chemistry Stemflow Water Litterfall Water
Chemistry Chemistry Chemistry Chemistry
(AC) (DC) (TF/SF) (LC) (FC/LF) (GW) Inventory of birds (BB) X X X X Inventory of butterflies (BF) X X X X Trunk Epiphytes (EP) X X X X Inventory of leafminers (LM) X X X X Lakewater Biology (LB) X Forest Damage (FD) X X X X X 4.1.2. Statistical method
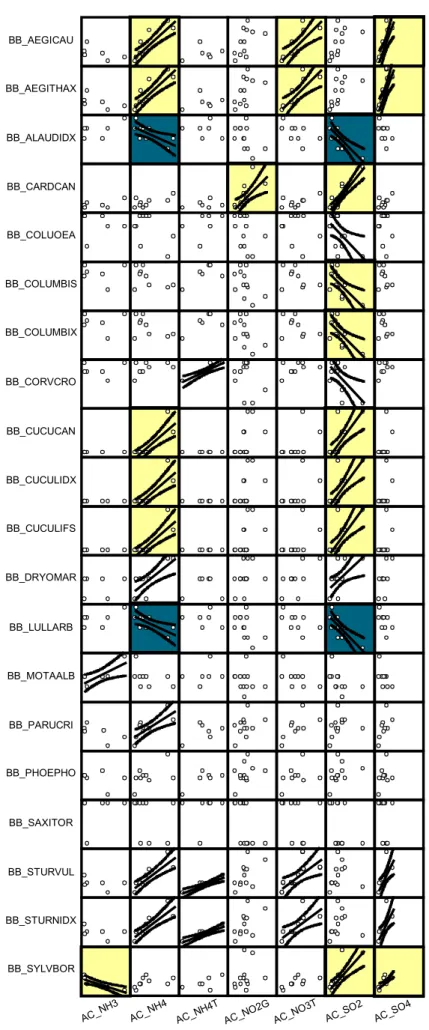
A linear correlation between variables was calculated using the product-moment correlation coefficient (Sokal and Rohlf, 1997). In case of significant correlations (p ≤ 0.05), linear regression lines with 95% confidence intervals were plotted in the scatterplots. Three uncertainty levels were taken into account i.e. 5 %, 1% and 0.1%.
If there was not any significant correlation between a biological and a chemical variable the lines were left out in the scatterplots. The plots with significant correlations are marked as follows: white p<0.05; yellow p<0.01; green p<0.001.
4.2. Results and Discussion
In Appendix V, scatterplots with regression lines are presented of the selected variables.
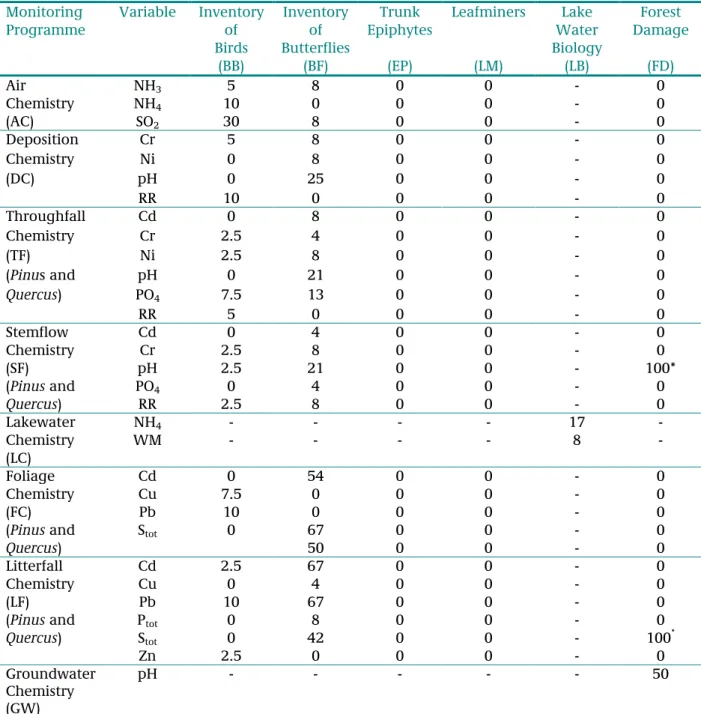
The results of the scatterplots in Appendix V are not univocal. Positive and negative correlations are found for the same chemical variables. To get an overview of the results, the number of significant correlations is expressed as a percentage of the biological variables entered in the analysis. In Table 9, an overview is presented of the negative correlations and in Table 10 of the positive correlations.
Table 9: Percentage of variables in each biological programme having a significant negative correlation with a chemical variable.
(Combinations with only one variable are indicated with an asterisk; - : not calculated)
Monitoring Variable Inventory Inventory Trunk Leafminers Lake Forest
Programme of of Epiphytes Water Damage
Birds Butterflies Biology
(BB) (BF) (EP) (LM) (LB) (FD) Air NH3 5 8 0 0 - 0 Chemistry NH4 10 0 0 0 - 0 (AC) SO2 30 8 0 0 - 0 Deposition Cr 5 8 0 0 - 0 Chemistry Ni 0 8 0 0 - 0 (DC) pH 0 25 0 0 - 0 RR 10 0 0 0 - 0 Throughfall Cd 0 8 0 0 - 0 Chemistry Cr 2.5 4 0 0 - 0 (TF) Ni 2.5 8 0 0 - 0 (Pinus and pH 0 21 0 0 - 0 Quercus) PO4 7.5 13 0 0 - 0 RR 5 0 0 0 - 0 Stemflow Cd 0 4 0 0 - 0 Chemistry Cr 2.5 8 0 0 - 0 (SF) pH 2.5 21 0 0 - 100* (Pinus and PO4 0 4 0 0 - 0 Quercus) RR 2.5 8 0 0 - 0 Lakewater NH4 - - - - 17 -Chemistry WM - - - - 8 -(LC) Foliage Cd 0 54 0 0 - 0 Chemistry Cu 7.5 0 0 0 - 0 (FC) Pb 10 0 0 0 - 0
(Pinus and Stot 0 67 0 0 - 0
Quercus) 50 0 0 - 0
Litterfall Cd 2.5 67 0 0 - 0
Chemistry Cu 0 4 0 0 - 0
(LF) Pb 10 67 0 0 - 0
(Pinus and Ptot 0 8 0 0 - 0
Quercus) Stot 0 42 0 0 - 100*
Zn 2.5 0 0 0 - 0
Groundwater pH - - - 50
Chemistry (GW)
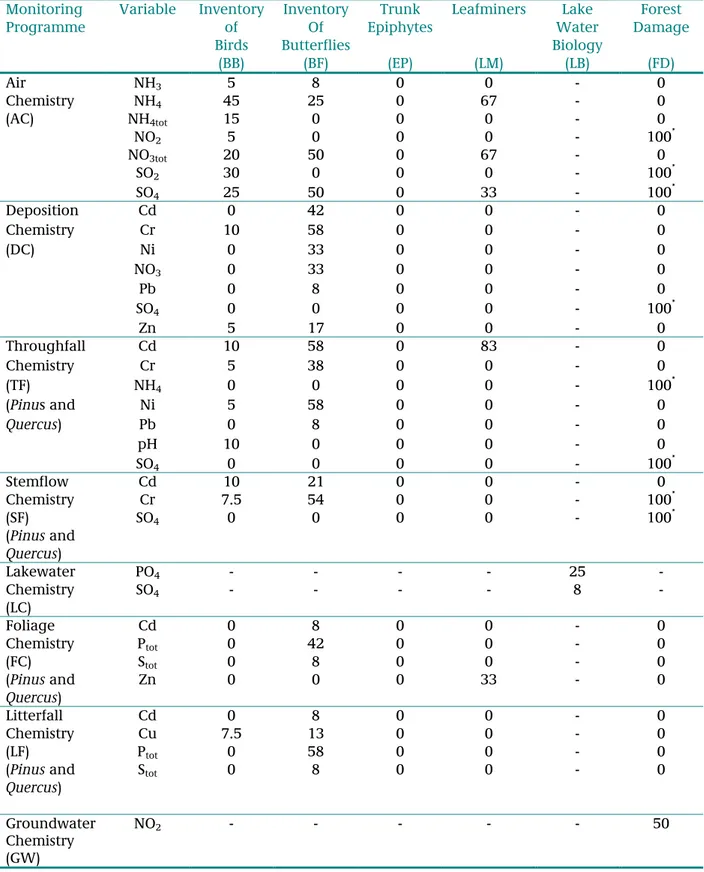
Table 10: Percentage of variables in each biological programme having a significant positive correlation with a chemical variable.
(Combinations with only one variable are indicated with an asterisk; - : not calculated)
Monitoring Variable Inventory Inventory Trunk Leafminers Lake Forest
Programme of Of Epiphytes Water Damage
Birds Butterflies Biology
(BB) (BF) (EP) (LM) (LB) (FD) Air NH3 5 8 0 0 - 0 Chemistry NH4 45 25 0 67 - 0 (AC) NH4tot 15 0 0 0 - 0 NO2 5 0 0 0 - 100* NO3tot 20 50 0 67 - 0 SO2 30 0 0 0 - 100* SO4 25 50 0 33 - 100* Deposition Cd 0 42 0 0 - 0 Chemistry Cr 10 58 0 0 - 0 (DC) Ni 0 33 0 0 - 0 NO3 0 33 0 0 - 0 Pb 0 8 0 0 - 0 SO4 0 0 0 0 - 100* Zn 5 17 0 0 - 0 Throughfall Cd 10 58 0 83 - 0 Chemistry Cr 5 38 0 0 - 0 (TF) NH4 0 0 0 0 - 100* (Pinus and Ni 5 58 0 0 - 0 Quercus) Pb 0 8 0 0 - 0 pH 10 0 0 0 - 0 SO4 0 0 0 0 - 100* Stemflow Cd 10 21 0 0 - 0 Chemistry Cr 7.5 54 0 0 - 100* (SF) SO4 0 0 0 0 - 100* (Pinus and Quercus) Lakewater PO4 - - - - 25 -Chemistry SO4 - - - - 8 -(LC) Foliage Cd 0 8 0 0 - 0 Chemistry Ptot 0 42 0 0 - 0 (FC) Stot 0 8 0 0 - 0 (Pinus and Zn 0 0 0 33 - 0 Quercus) Litterfall Cd 0 8 0 0 - 0 Chemistry Cu 7.5 13 0 0 - 0 (LF) Ptot 0 58 0 0 - 0
(Pinus and Stot 0 8 0 0 - 0
Quercus)
Groundwater NO2 - - - 50
Chemistry (GW)
The results in Tables 9 and 10 are discussed in the paragraphs below for each biological monitoring programme.