THE ROBUSTNESS OF THE COKES
WASTEWATER TREATMENT PLANT AT
ARCELORMITTAL AGAINST TOXIC
PRODUCTS
CREATING A NEW IN-HOUSE METHOD TO MEASURE CYANIDES,
AND OPTIMISATION OF THE ARSENIC REMOVAL
Helena Verloo
Student number: 01504157Promotor: Prof. Dr. Ir. Korneel Rabaey
Tutors: Ir. Frederik De Maré (ArcelorMittal Ghent), Ir. Pieter Ostermeyer, Eng. Lotte Van
Peteghem
Master’s Dissertation submitted to Ghent University in partial fulfilment of the requirements for the degree of Master of Science in Biochemical Engineering Technology
THE ROBUSTNESS OF THE COKES
WASTEWATER TREATMENT PLANT
AT ARCELORMITTAL AGAINST
TOXIC PRODUCTS
CREATING A NEW IN-HOUSE METHOD TO MEASURE
CYANIDES, AND OPTIMISATION OF THE ARSENIC REMOVAL
Helena Verloo
Student number: 01504157Promotor: Prof. Dr. Ir. Korneel Rabaey
Tutors: Ir. Frederik De Maré (ArcelorMittal Ghent), Ir. Pieter Ostermeyer, Eng. Lotte
Van Peteghem
Master’s Dissertation submitted to Ghent University in partial fulfilment of the requirements for the degree of Master of Science in Biochemical Engineering Technology
Deze pagina is niet beschikbaar omdat ze persoonsgegevens bevat.
Universiteitsbibliotheek Gent, 2021.
This page is not available because it contains personal information.
Ghent University, Library, 2021.
I
ACKNOWLEDGMENTS
Iron rusts from disuse; water loses its purity from stagnation... even so does inaction sap the vigor of the mind.
~
Leonardo Da VinciIt wasn't long before I knew which thesis subject I wanted to do. Already during my bachelor years I developed a keen interest in environmental technology and water sanitation. The fact that this thesis involves collaboration with ArcelorMittal Ghent, a big multinational situated in the port of Ghent is only an even bigger plus.
The subject of this thesis was very interesting but also challenging. Originally my task was to remove cyanides, but then I stumbled upon the problem that there is no safe method of analysis for this. That is why I first had to look for a new analytical method before I could start the real work. When after a few months of work the results were not yet favorable, it was decided to switch to arsenic removal in the same wastewater. For this purpose there already existed a safe analytical method. I was disappointed, but also happy that I could start the ‘real’ work, namely water purification, from February on. The happiness was short-lived because a few months later the coronavirus emerged. It was a year that people will remember for a long time, and so will I, not only because of this virus but also because of my thesis. Anyway, I learned a lot from this year, on a scientific and human basis.
Firstly, I would like to thank Lotte and Pieter, my two tutors in CMET for making this thesis possible. Thank you for guiding me so well this year, and always being there for an intellectual conversation. I am also eternally grateful to you for the endless feedback, I learned more from you than anyone else this year. Secondly I would like to thank my promotor, professor Rabaey, for giving me the opportunity to write about such an interesting subject, and for giving advice when things didn’t go as planned. Thank you Antonin, Eleftheria, Xiaofei and Barbara for guiding me with my practical work and thanks to Karel for helping me out with the analysis of my samples and with my discussion. Thanks to Frederik for the feedback, the excursion to the wastewater treatment plant of ArcelorMittal Ghent and providing me regularly with fresh smelly wastewater. I want to mention my family, roommates and boyfriend as well, for advising and supporting me during this remarkable year.
Lastly, I would like to thank CMET and all its researchers for giving me an unforgettable and most instructive year. The many seminars and lectures gave me new insights and enriched my knowledge beyond what I hoped for in my master year. In November, David Sedlak, professor environmental engineering at the university of Berkeley gave a series of lectures on his book Water 4.0 at CMET. Partly because of these lectures and mostly because of my thesis subject in general and the interesting conversations in the lab, I decided to do broaden my knowledge in the subject even more, and do an extra master's degree in the subject of environmental engineering at TU Delft in the Netherlands. By doing so, the vigor of my mind won’t be sapped for sure.
III
ABSTRACT
Stricter discharge standards are forcing companies, such as ArcelorMittal, to develop better disposal techniques for pollutants. The current water treatment from the coking plant exceeds the limits for cyanide, arsenic, and detergents. Therefore, an excess of harmful components are discharged in the environment. In this thesis a specific solution to the problem concerning cyanide and arsenic will be examined.
At first, a new in-house analytical method is developed for cyanide. The current method requires distillation and releases toxic cyanide gas, consequently this technique cannot be used in a non-specialized analytical lab. A more accessible technique ensures that more tests can be carried out, thereby promoting safety and monitoring. For free and weakly bound cyanides a method of analysis already exists. For the analysis of the strongly bound cyanides, physical and chemical oxidation methods were combined, in order to achieve a total quantification of the present cyanides in the wastewater. Results showed that the wastewater matrix of ArcelorMittal Ghent was too complicated, and the cyanides were not all oxidized. Unfortunately, it was also not possible to validate this new in-house method by an external company.
Arsenic removal is optimized by evaluating different coagulants, namely FeCl3, FeSO4 and the
currently used Al2(SO4)3 In ArcelorMittal. Electrocoagulation is also presented as an alternative
removal technique with minimal input of chemicals. Electrocoagulation and coagulation may also help the removal of other components such as phenols and cyanides, but this requires additional research and further examination. An economic analysis was conducted of the considered treatments. The suggestion to ArcelorMittal is to switch to Fe for arsenic removal. Further research has yet to show whether electrocoagulation with iron electrodes is a better removal method than coagulation with Fe for arsenic and cyanide, in combination.
V
NEDERLANDSE SAMENVATTING
Striktere lozingsnormen zorgen ervoor dat bedrijven, zoals ArcelorMittal Ghent, geforceerd worden betere verwijderingstechnieken te ontwikkelen voor polluenten. De huidige waterzuivering van de cokesfabriek op ArcelorMittal overschrijdt de limieten voor cyanide, arseen en detergenten. Hierdoor komt een te hoge concentratie aan toxische stoffen in het mileu terecht. In deze thesis wordt gezocht naar een concrete oplossing voor het probleem omtrent cyanide en arseen.
Voor cyanide werd getracht een nieuwe in-house analysemethode te ontwikkelen. De huidige methode vereist destillatie waarbij toxisch cyanidegas vrijkomt, waardoor deze niet kan ingezet worden in een niet-gespecialiseerd analyselabo. Een meer toegankelijke techniek kan er ook voor zorgen dat er meer getest wordt en hierdoor ook de veiligheid en monitoring bevorderd wordt. Voor vrije en zwak gebonden cyanides bestaat al een analysemethode. Voor analyse van de sterk gebonden cyanides werden fysische en chemische oxidatiemethoden gecombineerd, om zo tot een totale kwantficatie van de aanwezige cyanides in het afvalwater te komen. De resultaten toonden aan dat de afvalwatermatrix van ArcelorMittal Gent te ingewikkeld was en dat de cyanides niet allemaal geoxideerd waren. Helaas was het ook niet mogelijk om deze nieuwe interne methode door een extern bedrijf te laten valideren.
Arseenverwijdering wordt geoptimaliseerd door verschillende coagulanten te evalueren. Ook electrocoagulatie wordt aangewend als alternatieve verwijderingstechniek met minimale input van chemicaliën. Elektrocoagulatie en coagulatie kunnen ook helpen bij het verwijderen van andere componenten zoals fenolen en cyaniden, maar dit vereist verder onderzoek. Van de beschouwde verwijderingsmethoden werd ook een economische analyse gemaakt. De suggestie aan ArcelorMittal is om over te schakelen op Fe voor de verwijdering van arseen. Verder onderzoek moet nog uitwijzen of elektrocoagulatie een betere verwijderingsmethode is dan coagulatie met ijzer voor arseen en cyanide, in combinatie.
VII
TABLE OF CONTENTS
Acknowledgments ... I Abstract ... III Nederlandse samenvatting ... V List of abbreviations ... XI List of figures ... XIIIIntroduction ... 1
Preamble ... 4
Literature ... 5
1. ArcelorMittal ... 5
1.1 The coking plant ... 5
1.2 Composition of the cokes wastewater ... 5
1.3 Description of the wastewater treatment plant of ArcelorMittal ... 6
2. Cyanide ... 7
2.1 Introduction ... 7
2.2 Treatment methods ... 8
2.2.1 An overview of cyanide treatment methods ... 8
2.2.2 Cyanide removal pathway used in the cokes WWTP of ArcelorMittal Ghent ... 10
2.2.3 Non-biological treatment methods ... 11
2.3 Safety ... 13
2.4 Analysis ... 14
2.4.1 Distillation technique to quantify total cyanide ... 14
2.4.2 Analytical techniques ... 14
2.4.3 Analysis by photochemical degradation ... 15
3. Arsenic ... 16
3.1 Introduction ... 16
3.2 Removal techniques ... 17
3.2.1 Overview of the removal techniques ... 17
3.2.2 Oxidation/precipitation of arsenic ... 18
3.2.3 Coagulation/flocculation ... 18
3.2.4 Electrochemical methods for arsenic removal ... 19
3.3 Analysis ... 21
Materials and methods ... 23
1. Cyanide ... 23
VIII
1.1.1 EDTA stock solution ... 23
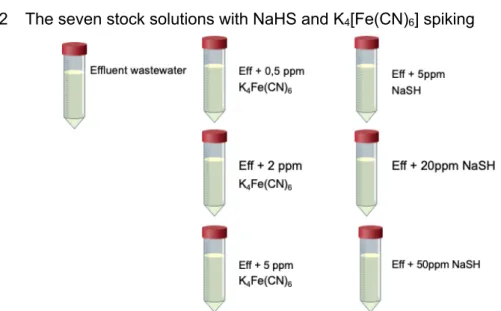
1.1.2 The seven stock solutions with NaHS and K4[Fe(CN)6] spiking ... 23
1.1.3 The bleach (NaOCl) stock solution ... 24
1.1.4 NaOH stock solution ... 24
1.1.5 Stock solutions for the SCN- validation test ... 24
1.1.6 Stock solution for sulphide determination ... 24
1.2 Set-up ... 25
1.3 Experimental procedure ... 25
1.3.1 SCN- validation test ... 25
1.3.2 Determination of the reaction time ... 25
1.3.3 Determination of influence of the chemical oxidant NaOCl ... 25
1.4 Analysis ... 26
1.4.1 Ion chromatography ... 26
1.4.2 Cyanide and thiocyanate determination by colorimetry ... 26
1.4.3 Sulphide determination ... 26 2. Arsenic ... 27 2.1 Coagulation experiments ... 27 2.1.1 Stock solutions ... 27 2.1.2 Set-up ... 28 2.1.3 Experimental procedure ... 28 2.1.4 Analysis ... 28 2.2 Electrocoagulation experiments ... 29 2.2.1 Set-up ... 29 2.2.2 Experimental procedure ... 29 2.2.3 Analysis ... 31 Results ... 32 1. Cyanide ... 32 1.1 SCN- validation test ... 32
1.2 Tests to determine the reaction time ... 32
1.3 Tests to determine the influence of a chemical oxidant (NaOCl) ... 36
2. Arsenic ... 38
2.1 Coagulation experiments ... 38
2.2 Electrocoagulation experiments ... 40
2.2.1 Cyclic voltammetry tests ... 40
2.2.2 Passivation tests ... 41
2.2.3 Tests on arsenic removal ... 42
Discussion ... 43
1. Cyanide ... 43
1.1 Starting concentrations ... 43
1.2 The oxidation of SCN- ... 44
IX
1.4 Formation of the intermediates of cyanide and thiocyanate oxidation ... 45
1.5 Formation of N2 ... 46
1.6 Test validation ... 46
2. Arsenic ... 46
2.1 Coagulation ... 46
2.1.1 Sludge properties ... 47
2.1.2 Comparison iron and aluminum coagulation ... 48
2.2 Electrocoagulation ... 49
2.2.1 Influence of pH and the solubility of iron and aluminum ... 49
2.2.2 Oxidation behavior of iron and arsenic ... 50
2.2.3 Improvement of arsenic removal by electrocoagulation ... 52
2.2.4 The effect of the presence of cyanide ... 53
2.2.5 Effects of electrocoagulation on cyanide removal ... 53
2.3 Comparison between coagulation and electrocoagulation ... 54
2.4 Economic analysis of the considered new treatments for arsenic removal and practical approach 55 2.4.1 Capital costs for both the scenarios ... 56
2.4.2 Operational costs for the current and proposed coagulation system ... 56
2.4.3 Operational costs for the proposed EC-systems with iron and aluminum electrodes ... 57
2.4.4 Comparison between the operational costs ... 59
Conclusion ... 62
Future perspectives ... 64
Reference list ... 65
XI
LIST OF ABBREVIATIONS
Al C Aluminum coagulation
Al EC Aluminum electrocoagulation
AM ArcelorMittal Ghent
CAPEX Capital costs
CE Counter electrode
E0 Standard reduction potential
Eh Reduction potential
EC Electrocoagulation
Ece Potential of the counterelectrode
Ewe Potential of the working electrode
Fe C Iron coagulation
Fe EC Iron electrocoagulation
OPEX Operational costs
ORP Oxidation reduction potential
PAC Poly-aluminumchloride
SAD Strong Acid Dissociable
Sign. Significance
WAD Weak Acid Dissociable
WE Working electrode
WW Wastewater
XIII
LIST OF FIGURES
Figure 1:Diagram of the wastewater treatment process of ArcelorMittal Ghent ... 6
Figure 2: An overview of the groups of cyanides ... 7
Figure 3: An overview of the biological microbial degradation of cyanides ... 10
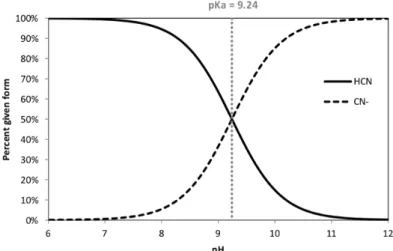
Figure 4: Relationship of HCN/CN- at different pH ... 13
Figure 5: Design of the most common cyanide quantification technique: distillation (Source: Macherey-Nagel GmbH & Co.) ... 14
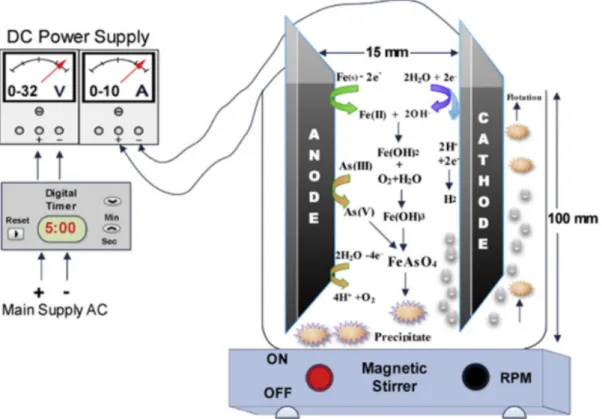
Figure 6: Schematic representation of electrocoagulation mechanism for arsenic removal (Gilhotra et al., 2018) ... 20
Figure 7: Schematic overview of the different samples used in the tests. This was performed in duplicate with EDTA in the second series. ... 23
Figure 8: Compact UV lamp (302nm) used during the experiments (Source: Fisher Scientific) ... 25
Figure 9: Set-up of the coagulation experiment on arsenic removal. ... 28
Figure 10: The Imhoff conical settler used to determine the settleability and quantity of the formed sludge. ... 28
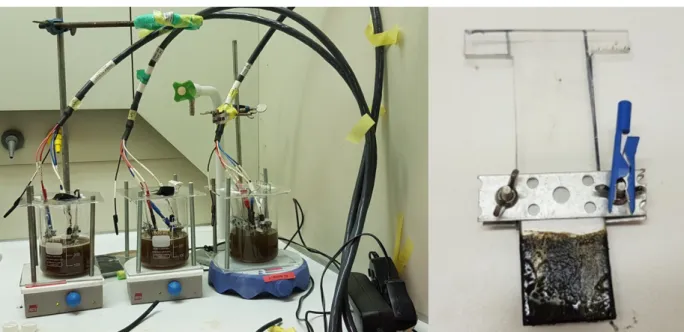
Figure 11: The set-up for the electrocoagulation experiments. ... 29
Figure 12: Set-up of the electrodes during the EC tests ... 29
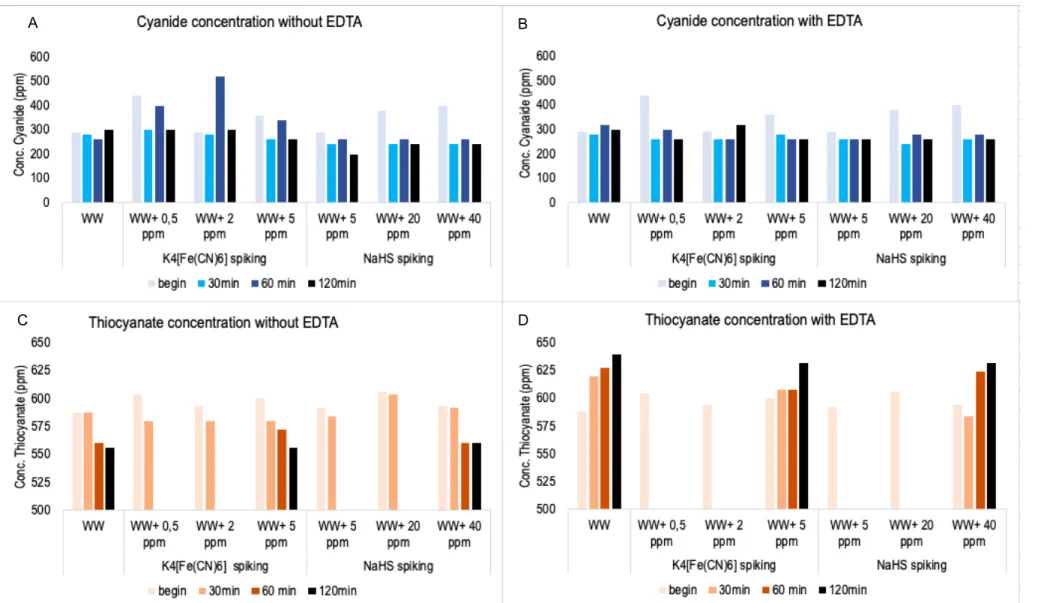
Figure 13: Results of the cyanide and thiocyanate concentrations in the experiments to determine the reaction time. A: The cyanide concentrations without adding EDTA to the falcons. B: cyanide concentrations with adding EDTA to the falcons. C: thiocyanate concentrations without adding EDTA to the falcons. D: with adding EDTA to the falcons. There are values missing in the thiocyanate graphs, this is because not enough Nanocolorâ kits were available. Conc. = Concentration. WW = wastewater ... 34
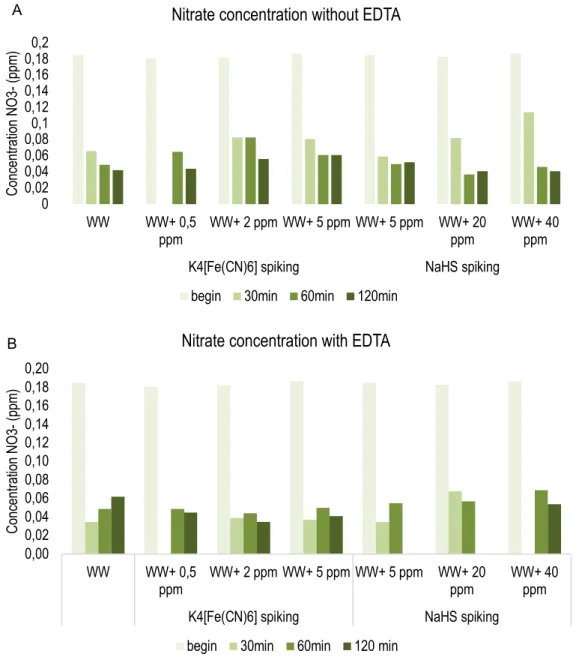
Figure 14: Nitrate concentrations of each falcon during the reaction time experiments. In graph A EDTA is not added to the falcons and graph B shows the results with addition of EDTA. Some values are missing due to a lack of Nanocolorâ kits. WW = wastewater ... 35
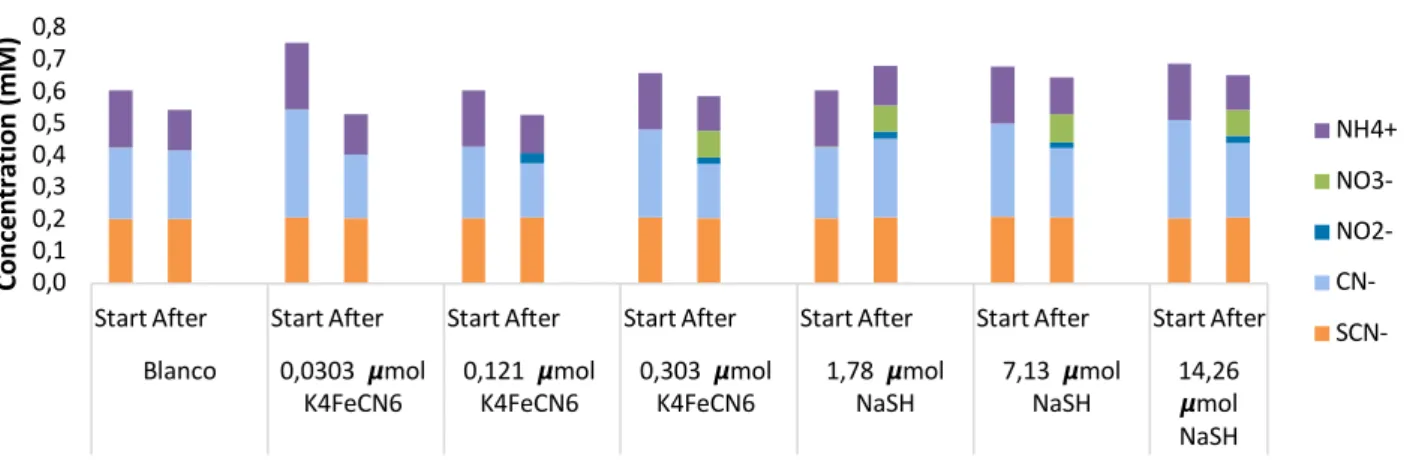
Figure 15: Mass balances of N-properties in the wastewater (settling tank influent) after treatment with UV (302 nm) for 60 minutes. ... 36
Figure 16: Mass balances of N-properties of the wastewater (settling tank influent) after treatment with UV (302 nm) and EDTA for 60 minutes ... 37
Figure 17: Mass balances of N-properties of the wastewater (settling tank influent) after treatment with UV (302 nm) and bleach for 60 minutes. ... 37
Figure 18: Mass balances of N-properties of the wastewater (settling tank influent) after treatment with UV (302 nm), EDTA and bleach for 60 minutes ... 38
Figure 19: Results of the coagulation experiment on arsenic removal. The concentration of arsenic in function of the type of coagulant with different concentrations. ... 39
Figure 20: (left) Sludge volume resulting from the 3 different coagulant tests, on the right the settleability of the 3 different sludge formations. ... 40
Figure 21: Result of the cyclic voltammetry test to determine the oxidation behaviour of iron in the wastewater matrix. ... 41
Figure 22: Results of the passivation test to determine the potential increase due to passivation layers. A) passivation test for iron electrodes, b)t: passivation test for aluminum electrodes. Ewe = potential of the working electrodes ... 41
Figure 23: Results of the electrocoagulation tests with iron and aluminum electrodes: The concentration of total arsenic in function of time. Only the measurement of the start concentration wasn’t performed in triplicate. ... 42
XIV
Figure 24: Typical cyclic voltammogram for solid iron electrodes in 5,35 M KOH + 0,65 M LiOH solution. Sweep rate= 20 mV/sec. (Periasamy, Ramesh Babu and Venkatakrishna Iyer, 1996) ... 50 Figure 25: Pourbaix diagrams (created with Hydra/Medusa): presence of forms of arsenic (left) and iron (right) ... 51 Figure 26: Representations of the set-ups for which the economic analysis is made. a) the current system, with coagulation as arsenic removal technology. b) The newly implemented system with electrocoagulation as removal ... 56 Figure 27: Comparison of the cost divisions for each considered treatment. A) For aluminum coagulation B) for iron coagulation C) for Aluminum electrocoagulation D) for iron electrocoagulation. ... 60 Figure 28: Overview of the total treatment costs of the four compared treatments. EC: electrocoagulation. C= coagulation ... 61 Figure 29: Ammonium start concentration for the cyanide analytical tests of the seven samples ... 71 Figure 30: Sulphate concentrations during the different cyanide oxidation tests. WW= wastewater .... 72 Figure 31: Coagulation tests with FeSO4 as coagulant. On the left three beakers with 88,8 ppm
coagulant added, on the right 3 beakers with 177,6 ppm added. ... 72 Figure 32: Coagulation tests with 50 ppm Al2(SO4)3 (triplicate on the left) and 474 ppm FeCl3 added in
triplicate on the right. ... 72 Figure 33: Coagulation test with 474 ppm FeCl3 added (like figure 32 on the right), but after 10 minutes
of settling. ... 73 Figure 34: Potential course of the WE and CE during the first electrocoagulation test with iron electrodes, at 84 mA (replicate 1). Ewe = potential of the working electrode, and Ece = potential of counterelectrode. The ‘< >’ indicates that the mean value was taken of a certain time period (1 second). This gives a more steady graph. ... 73 Figure 35: Power during electrocoagulation test with iron electrodes (replicate 1). ... 73 Figure 36: Potential course of the WE and CE during the first electrocoagulation test with iron electrodes, at 84 mA (replicate 2). Ewe = potential of the working electrode, and Ece = potential of counterelectrode. The ‘< >’ indicates that the mean value was taken of a certain time period (1 second). This gives a more steady graph. ... 74 Figure 37: Power during electrocoagulation test with iron electrodes (replicate 2). ... 74 Figure 38: Potential course of the WE and CE during the first electrocoagulation test with iron electrodes, at 84 mA (replicate 3). Ewe = potential of the working electrode, and Ece = potential of counterelectrode. The ‘< >’ indicates that the mean value was taken of a certain time period (1 second). This gives a more steady graph. ... 74 Figure 39: Power during electrocoagulation test with iron electrodes (replicate 3) ... 75 Figure 40: Potential course of the WE and CE during the first electrocoagulation test with aluminum electrodes, at 84 mA (replicate 1). Ewe = potential of the working electrode, and Ece = potential of counterelectrode. The ‘< >’ indicates that the mean value was taken of a certain time period (1 second). This gives a more steady graph. ... 75 Figure 41: Power during electrocoagulation test with aluminum electrodes (replicate 1.) ... 75 Figure 42: Potential course of the WE and CE during the first electrocoagulation test with aluminum electrodes, at 84 mA (replicate 2). Ewe = potential of the working electrode, and Ece = potential of counterelectrode. The ‘< >’ indicates that the mean value was taken of a certain time period (1 second). This gives a more steady graph. ... 76 Figure 43: Power during electrocoagulation test with aluminum electrodes (replicate 2) ... 76 Figure 44: Potential course of the WE and CE during the first electrocoagulation test with aluminum electrodes, at 84 mA (replicate 3). Ewe = potential of the working electrode, and Ece = potential of
XV counterelectrode. The ‘< >’ indicates that the mean value was taken of a certain time period (1 second). This gives a more steady graph. ... 76 Figure 45: Power during electrocoagulation test with aluminum electrodes (replicate 3) ... 77 Figure 46: Ewe and Ece during an iron electrocoagulation test at 84 mA, without taking samples during the test, only afterwards. ... 77 Figure 47: Power during iron electrocoagulation test, without sampling. ... 77
XVII
LIST OF TABLES
Table 1: The Belgian legal discharge standards for cokes plants according to VLAREM II ... 1 Table 2: The measured concentrations of the most important components of the influent wastewater of the cokes plant of ArcelorMittal Ghent ... 6 Table 3: The concentrations of the different cyanide groups in the treatment steps of the wastewater treatment plant of ArcelorMittal. After biological treatment free cyanide is totally removed. ... 8 Table 4: Overview of the different existing cyanide removal techniques ... 8 Table 5: Concentration arsenic in the different steps of the wastewater treatment plant of ArcelorMittal ... 17 Table 6: Overview of the most commonly used arsenic removal techniques. No removal efficiency was found of phytoremediation and membrane filtration. ... 17 Table 7: The concentration of the arsenic speciations in different stages of the wastewater treatment process of the cokes plant of ArcelorMittal ... 21 Table 8: Schematic overview of the tests performed to determine the reaction time of the UV exposure ... 25 Table 9: Schematic overview of the tests performed to test the influence of chemical oxidant ... 26 Table 10: Concentrations of coagulant added in the different coagulation experiments on arsenic removal with the currently used dosage indicated in blue. ... 27 Table 11: Results of the SCN- validation test. ... 32 Table 12: Conversion of thiocyanate concentration into interference during cyanide tests ... 44 Table 13: The concentration of the cokes washing water. ... 70
1
INTRODUCTION
This thesis is in collaboration with ArcelorMittal Ghent and aims to examine the robustness of the water treatment in the coking plant against the waste pollutants cyanide and arsenic. Thermal processing of carbonaceous materials, such as coking of coal, produces significant quantities of waste pollutants. The coking operation involves dry distillation of coal by indirectly heating the coal in the absence of oxygen to temperatures of 900-1100°C to vaporize all volatile constituents in the coal. The cokes oven gas includes hydrogen, hydrocarbons (e.g.
CH4), hydrogen cyanide (HCN), nitrogenous compounds (e.g. ammonia), and sulphurous
compounds such as H2S. Corrosive components such as NH3 and H2S together with HCN are
removed from the gas by gas scrubbing, using washing water. In a second step NH3 and H2S
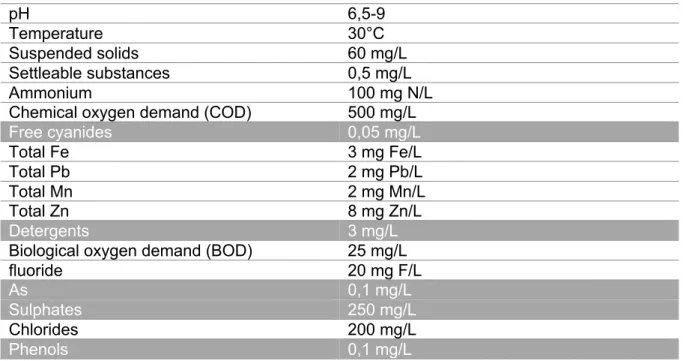
are again stripped from the washing water. A fraction of this washing water ends up in the wastewater of the cokes plant (Corporate Responsibility Report Arcelor Mittal Ghent, 2017). The Belgian legal discharge standards in surface water (for ArcelorMittal the Schelde river) for cokes plants are as follows according to VLAREM II:
Table 1: The Belgian legal discharge standards for cokes plants according to VLAREM II
pH 6,5-9
Temperature 30°C
Suspended solids 60 mg/L
Settleable substances 0,5 mg/L
Ammonium 100 mg N/L
Chemical oxygen demand (COD) 500 mg/L
Free cyanides 0,05 mg/L Total Fe 3 mg Fe/L Total Pb 2 mg Pb/L Total Mn 2 mg Mn/L Total Zn 8 mg Zn/L Detergents 3 mg/L
Biological oxygen demand (BOD) 25 mg/L
fluoride 20 mg F/L
As 0,1 mg/L
Sulphates 250 mg/L
Chlorides 200 mg/L
Phenols 0,1 mg/L
Discharge limits for byproducts indicated in grey are on occasion exceeded at the cokes plant of ArcelorMittal Ghent. Therefore, excess harmful components end up in the environment. HCN is formed due to the high temperature reducing atmosphere and the presence of nitrogen and carbon in coal. The quantity of cyanide produced in the coking of coal has been reported to be about 1,5-2 % of the nitrogen content of coal (Sharma, Akhter and Chatterjee, 2019). After gas washing, not all the cyanide in the washing water is stripped. The remaining of the cyanide in the solution leaves the coking system via the wastewater treatment system of the coking plant (Dzombak, Ghosh and Wong-Chong, 2006; Corporate Responsibility Report Arcelor Mittal Ghent, 2017). The toxicity of cyanides presents serious environmental problems
2
(Sarla et al., 2004). These compounds are not only highly toxic to living beings but also recalcitrant to biodegradation (Sharma, Akhter and Chatterjee, 2019).
Besides cyanides, also arsenic, present in the coal, is volatilized and ends up in the gas washing water. The EPA (Environmental protection agency) has classified arsenic as a class A human carcinogen (NRC, 1999). The problem of arsenic contamination in water sources is a serious concern in many places around the world, often in relation to natural resources (Kobya et al., 2011). Once arsenic enters the human body, it can cause extreme damages to normal body functions and impacts on nearly all organ systems.
It is therefore important to remove these 2 pollutants as much as possible from Arcelor's wastewater, in order to avoid contamination of the water channels with these toxic substances. To be able to evaluate cyanide removal, a safe analytical method has to be developed. Current techniques require distillation, with the associated risk of HCN release in the atmosphere. The current distillation method for analysis is also expensive, so it would be advantageous to find a cheaper analysis method, in that way it can be carried out more often. An attempt has been made to create a new in-house method to measure cyanides in solution. For arsenic, already a safe analytical method exists. The objective of this thesis is therefore two-fold:
1. To create a new in-house analysis method for cyanides in solution.
2. To improve arsenic removal by comparing other coagulants, namely FeCl3 and FeSO4,
with the currently used Al2(SO4)3. In addition, experiments will be carried out to test the
efficiency of arsenic removal by electrocoagulation with aluminum and iron electrodes, and thus by creating the coagulants in-situ.
The challenge of finding a new analysis method for cyanides is essentially that cyanides in strong complexes cannot be measured, e.g. the cyanides complexed with iron. For weakly complexed cyanides and free cyanides an analysis method can be carried out by measuring via colorimetry with Nanocolorâ kits. Photochemical oxidation (with UV-light) and chemical oxidation techniques (with NaOCl) will be combined to oxidize the different forms of cyanide and then the formed ions will be measured. In this way cyanides can be quantified while staying
in solution. For this the start concentrations of cyanide, thiocyanate, ammonium (NH4+) and
nitrate (NO3-) need to be known. The ions will be measured by ion chromatography and the
cyanide and thiocyanate concentrations by Nanocolorâ kits.
The increase in concentration of the waste products of cyanide and thiocyanate: ammonium, nitrite, sulphate and nitrate, should be equal to the concentration of cyanide and thiocyanate oxidized. The UV-treatment tests will be performed with a 302 nm UV lamp. The hypothesis is that cyanides will be oxidized, but the thiocyanates will not. This should not impose a problem because there already exists an analysis method for thiocyanates by colorimetry with Nanocolorâ kits. In a first set of tests the reaction time (time of exposure of the samples to the UV-light) will be determined. In a second set of tests, the influence of adding an extra chemical oxidant, namely bleach (NaOCl) will be determined. When adding NaOCl more cyanides
3 should be removed from their complexes, and more cyanide oxidation products should be produced. Both sets of tests are performed twice: once without ethylenediaminetetraacetic acid (EDTA), and once with EDTA. EDTA has the ability to form strong complexes with iron, and would therefore release cyanide out of the strong iron cyanide complexes, resulting in an increase in cyanides.
The goal of the coagulation tests for arsenic removal is to see if FeCl3 or FeSO4 is a better
coagulant then the already used Al2(SO4)3. The difference in removal between FeCl3 and
FeSO4 will show if Fe3+ works better than Fe2+. At this moment 100 mg/L Al2(SO4)3 is dosed
for arsenic removal. The molar equivalents of FeCl3 and FeSO4 were calculated and tested.
Furthermore, 0,5 times, 2 times and 5 times this concentration was tested for the three considered coagulants. The hypothesis is that iron gives rise to a more stable complex that settles better than aluminum, but with a larger amount of sludge formed. Furthermore, the results of this test will determine which concentration of which coagulant is most efficient, and should be used as a reference for the electrocoagulation tests.
The goal of the electrocoagulation tests is to examine if generating metal precipitates such as hydroxides, polyhydroxides and/or oxyhydroxides in situ, due to iron or aluminum release at the anode in an electrochemical system, is more beneficial than the requirement of external coagulants. The hypothesis is that electrocoagulation works better than normal coagulation for arsenic removal, and that the removal efficiency can go up to 99,99% The operation of iron electrodes will be compared to aluminum electrodes. Moreover, the hypothesis is that electrocoagulation supposedly has the benefit of oxidizing As(III) to As(V) at the anode, which would result in a better removal efficiency. Additionally a cyclic voltammetry test is conducted to determine the oxidation behavior of iron in the particular wastewater matrix of ArcelorMittal. Finally, passivation tests for iron and aluminum electrodes were performed to check whether an oxidation layer is formed during the duration of the test, and therefore measures need to be taken to avoid this.
Finally, an economic analysis was made of the 4 proposed treatments for arsenic removal (aluminum and iron coagulation and aluminum and iron electrocoagulation). On the basis of these data, it could be decided which set-up is best to be applied in practice.
4
PREAMBLE
On 16 March 2020, new measures concerning the corona-epidemic in Belgium began. At the moment of the announcement of the lockdown, I was standing in the lab and was asked to go home. The tests for the new in-house analytical method for cyanide were already stopped in December and the experiments for the removal of arsenic by coagulation had already been completed. However, I had only completed some initial tests on arsenic removal by electrocoagulation. As a result, this removal technique was certainly not yet ready and I would have liked to continue working on this. I also planned tests with the addition of flocculant, tests with an extra chemical oxidant, and I wanted to analyze my existing samples for the different speciations of arsenic and iron. To switch from batch testing to continuous testing would have been interesting as well. Last, the influence of these arsenic removal techniques would have been examined on cyanide and phenol removal.
Instead, the results already obtained were processed and I looked in the literature for solutions to improve them. A theoretical replacement assignment was also included. An economic analysis was made of the considered set-ups for arsenic removal in this thesis and in this way it was examined which solution could be feasible and economically viable if it were to be implemented in practice at ArcelorMittal Ghent.
5
LITERATURE
1. ArcelorMittal
ArcelorMittal Ghent, located in the port of Ghent, is a steel producing company, founded in 1962 under the name Sidmar NV/SA. The company produces only flat steel products as thin hot or cold rolled coils and sheets, medium and heavy steel coils and sheets. The plant consists of a coking plant, sinter plants, blast furnaces, steel shop, hot strip mill and cold rolling mill. The main processes relevant for this thesis are the production of coke in the coking plant and the wastewater treatment plant (WWTP) associated with the treatment of off-gasses (Corporate Responsibility Report Arcelor Mittal Ghent, 2017; Rabaey et al., 2017).
1.1 The coking plant
ArcelorMittal Ghent produces annually 1,25 million tons of coke. Coke is used instead of coal because of its higher caloric value, meaning it can produce more heat on equal mass basis. It contains less impurities, which could end up in the steel. Furthermore, there is less air pollution compared to coal (Huo et al., 2014). ArcelorMittal Ghent makes use of 8 types of coal. Coke is generated by heating coal at 1250°C in coke ovens in the absence of oxygen. After 18 hours the produced coke is cooled with water in the quenching tower. The gas of the coal ovens is then cooled and byproducts are recovered. Flushing liquor from the coal gas cooling and liquor from primary coolers that contain tar are sent to a tar decanter and afterwards to the cokes wastewater treatment plant. Here the washing water of the gas washing and the cokes cooling water are treated. Coke oven gas is further cooled in a final cooler and used in the steel plant as fuel for the hot rolling mill. Naphthalene is removed in the separator on the final cooler. Light oil is removed from the coke oven gas and is fractionated to recover benzene, toluene, and xylene. In addition, sulphur from the coke off-gas is recovered via the Claus process as elemental sulphur (Rabaey et al., 2017).
1.2 Composition of the cokes wastewater
Wastewater that enters the treatment plant, consists of two streams: the cooling water of the
cokes and the washing water after stripping the H2S and NH3. The washing water is
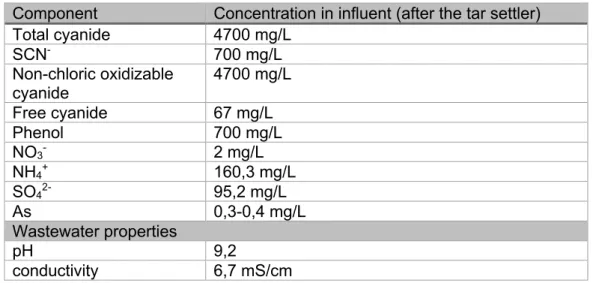
recirculated continuously and the cooling water of the cokes cooling is added too at this stage. The complete composition of the wastewater is unknown. However, the main components of the wastewater were analyzed in the lab (see Table 2). An extensive analysis on the cokes cooling water can be found in the appendix. The extensive analysis gives an indication on components that can be expected in the wastewater. The final concentrations are expected to vary. The cyanide measurements were performed in an external company (SGS).
6
Table 2: The measured concentrations of the most important components of the influent wastewater of the cokes plant of ArcelorMittal Ghent
Component Concentration in influent (after the tar settler)
Total cyanide 4700 mg/L SCN- 700 mg/L Non-chloric oxidizable cyanide 4700 mg/L Free cyanide 67 mg/L Phenol 700 mg/L NO3- 2 mg/L NH4+ 160,3 mg/L SO42- 95,2 mg/L As 0,3-0,4 mg/L Wastewater properties pH 9,2 conductivity 6,7 mS/cm
1.3 Description of the wastewater treatment plant of ArcelorMittal
The wastewater treatment plant consists of five parts: The settling tank, the primary settler (colloquially known as the tar settler), the aeration basins, the end-settlers and the sludge thickener (Corporate Responsibility Report Arcelor Mittal Ghent, 2017; Rabaey et al., 2017).
Figure 1:Diagram of the wastewater treatment process of ArcelorMittal Ghent
Settling tank
The coagulant Al2(SO4)3 and polymere are added to the wastewater in the settling tank (see
Figure 1). The Al2(SO4)3 and the flocculant (polymere) promote the settling of suspended
compounds such as cyanides and arsenic. The tank also acts as a buffer for pH. The settled solids are then transferred to the sludge thickener. The wastewater is pumped over heat exchangers to cool the influent from a temperature of 40°C to 35°C. The outflow is directed to the tar settler (Rabaey et al., 2017).
Tar settler
In the tar settler the removal of coarse solid particles takes place and an anti-foaming agent is added. Settled sludge is removed mechanically with scrapers and transported to the sludge
Al2(SO4)3
End-Settlers
Settling tank
dilutionwater ,NaOH,H3PO4 en antifoam
To Coals Slduge overflow polymeer sludge Tar-settler Pumps + Oxygen 4 Actiefslibbekkens slib koelwater Sludge-thickener polymeer O2 EFFLUENT (75 m3/h) C.O.D. = 3200 mg./l. CNS = 450 mg./l. Fen. = 550 mg./l. C.O.D. = 180 mg./l. CNS = 0,1 mg./l. Fen. = 0,02 mg./l. NH4 = < 5 mg./l.
40 m³/u Aeration tanks
polymere
Cooling water
7 collector. From the collector it is pumped into the sludge thickener. After thickening, the influent is pumped to the aeration basins (Rabaey et al., 2017).
Aeration basins
This section consists of 4 basins with an overflow. Here nitrification, denitrification, and COD removal (phenols and thiocyanides) occurs. The aeration of the wastewater is essential for the microbial metabolism during nitrification. The content of each of the 4 basins is separately pumped over an oxygenator and recycled, in this way the oxygen concentration can be regulated for each vessel. The influent is rich in ammonium which is biologically oxidized to nitrate while denitrification takes place in the first basin. The oxygen supply in the fourth basin will be set to nitrify and in the first basin to which a partial flow from the fourth basin returns, to denitrify. Phosphoric acid is added to aid microbial growth. NaOH is added to maintain the pH at 6,68. Finally, flocculant is added to increase the sludge settling efficiency. The treated wastewater is pumped to two parallel secondary end-settlers (Rabaey et al., 2017).
Secondary end-settlers
Settled sludge is scraped from the basin floors using scraper chains and deposited into cones. The sludge is recirculated to the primary settlers and to the sludge thickener. Based on the measured level, sludge is discharged to the sludge thickener. The effluent passes through the measurement channel. Here the temperature, pH, turbidity and flow rate are measured and monitored. Afterwards, the effluent is brought to the hot-rolling mill to be used as cooling water and then discharged to the Ghent-Terneuzen Canal (Rabaey et al., 2017).
Sludge thickener
The discharge flow rate of the sludge is approximately 3 m3/day. The formed sludge is
transported on a conveyor belt to the cokes ovens and is incinerated together with the coal.
2. Cyanide
2.1 Introduction
Cyanide is commonly found as a contaminant in wastewaters from various industries including plating, electroplating, metal processing, car manufacturing, steel tempering, mining, photography, pharmaceuticals, coal coking, ore leaching, and plastics (Dash, Gaur and Balomajumder, 2009). Cyanide toxicity presents a direct human hazard if cyanide containing wastes enter agricultural or municipal water supplies. A lethal dose of cyanide in human beings is approximately 1,5 mg/kg of body weight (Botz, 2001).
Cyanide compounds are classified into three categories: free cyanides, weakly bonded (WAD) cyanides and strongly bonded (SAD) cyanides. Cyanides often form complexes with other, metallic contaminants of industrial effluents, such as Fe, Cu, Ni and Zn. Although KCN and
NaCN dissociate to form CN- and HCN at
neutral pH, the metallocyanide complexes Figure 2: An overview of the groups of cyanides
8
have a wide range of chemical and biological stabilities. Metal complexed cyanides are classified according to the strength of the metal cyanide bond. Free cyanide refers to the most toxic forms of cyanide: the cyanide anion and hydrogen cyanide. Weak acid dissociable cyanides (WAD) refer to cyanide complexes with metals such as cadmium, copper, nickel and
zinc. Although thiocyanate (SCN-) is a WAD, it is often considered in its own category. Strong
acid dissociable (SAD) refers to cyanide complexes with metals such as cobalt, gold, iron and silver. Cyanides also exist as nitrile-group in organic compounds like acrylonitrile and propionitrile (Dash, Gaur and Balomajumder, 2009). The most toxicologically important forms
of cyanide are the WAD cyanides, with CN- and SCN- the most lethal, therefore this group’s
quantification is the most useful. Cyanide treatment processes are classified as either a destruction-based process or a recovery-based process (Botz, 2001). The cyanide removal techniques can be divided in two groups: firstly chemical and physical removal methods, and secondly biological treatments with specific cyanide degrading microorganisms. The concentrations of the different types of cyanide found in the different treatment steps of ArcelorMittal are presented in Table 3. This table shows that the total amount of cyanide after complete treatment is above the discharge standard (0,05 mg/L).
Table 3: The concentrations of the different cyanide groups in the treatment steps of the wastewater treatment plant of ArcelorMittal. After biological treatment free cyanide is totally removed.
Before settling tank After settling tank After biological removal Total cyanide (mg/L) 4,7 3,2 0,7-1,1 SCN- 700 640 < 0,03-0,3 Non-chlorine oxidizable cyanide (SAD) (mg/L) 4,7 3,1 0,7-1,1 Free cyanide (mg/L) 0,087 0,07 - 2.2 Treatment methods
2.2.1 An overview of cyanide treatment methods
The following table gives an overview of the different cyanide removal techniques and the advantages and disadvantages. (Raybuck, 1992; Botz, 2001; Akcil, 2003; Akcil and Mudder, 2003; Yngard, 2008; Kepa, Stanczyk-Mazanek and Stepniak, 2008; Reed, Islam and Bendick, 2013; Teixeira et al., 2013; Yates, Zboril and Sharma, 2014; Qi et al., 2017; Sharma, Akhter and Chatterjee, 2019).
Table 4: Overview of the different existing cyanide removal techniques
Method Explanation Disadvantages Advantages
CYANIDE DESTRUCTION
Chemical oxidation methods
INCO sulphur dioxide/air SO2 or a derivative and
air in the presence of a soluble copper catalyst to oxidize cyanide to the less toxic cyanate (OCN).
9
H2O2 oxidation H2O2 in the presence of a
soluble copper catalyst to oxidize cyanide to the less toxic cyanate (OCN).
• OCN- is still toxic
• only for solutions and not slurries
• easy and cheap • frequently used • operated over
wide pH ranges • no increase of
dissolved solids Caro’s acid H2SO5 is a powerful liquid
oxidant made from hydrogen peroxide
• highly exothermic reaction
- Alkaline chlorination First, cyanide is oxidized
to cyanate by NaOCl. Then, cyanate is oxidized to CO2 and nitrogen by
further adding NaOCl.
• not effective in the case of cyanide species complexed with metals such as nickel, silver, and other metals due to slow reaction rates • produces sludge • expensive
• chlorinated water toxic to aquatic life
• very efficient in detoxifying free cyanide bearing wastes
Ferrate (VI) oxidation oxidation by the strong
oxidans Fe(VI) • only effective in acidic environment •
multipurpose treatment: also efficient disinfection and coagulation properties • less toxic byproducts then with chlorination • green technology Ozonation O3 is used as oxidant - • high oxidation
efficiency Photocatalytic oxidation oxidation by UV radiation
which creates hydroxyl radicals - • clean technology, no toxic byproducts • efficient Activated carbon polishing polishing treatment by adsorbing metallocyanides on activated carbon - • removal to low levels • simple and effective • high affinity for
metal cyanide compounds Iron-cyanide
precipitation
reaction with ferrous iron to yield a variety of soluble and insoluble compounds such as hexacyanoferrate • only optimal at pH 5-6 • limited in suitability • removal up to 1 mg/L
Biological treatment by cyanide degrading,
nitrifying and denitrifying bacteria. This is used to remove cyanide, thiocyanate, cyanate ammonia and metals.
• presence of copper can cause difficulties • pre-treatment may be required • production of high quality effluent • can be used on slurries and solutions
Enzymatic degradation four different pathways
for removal: substitution, hydrolysis, oxidation, reduction
10
2.2.2 Cyanide removal pathway used in the cokes WWTP of ArcelorMittal Ghent
ArcelorMittal Ghent uses a biological treatment process with cyanide degrading microorganisms. The relative concentration of cyanide and its degradation products experiences seasonal fluctuations resulting from a complex interaction of physical, chemical, and biological reactions, including hydrolysis, precipitation, photolysis, volatilization, dilution and microbial degradations. The existence of cyanide degrading pathways in nature has allowed the development of a biological technology to degrade cyanide compounds in industrial wastewater (Ebbs, 2004). Coke wastewaters are typically treated through an activated sludge process. In microbial remediation processes fungi, bacteria, algae and yeast have proven to be effective in cyanide remediation processes (Akcil and Mudder, 2003). Temperature and pH are the most important factors to determine the biodegradation rate. It was found that 20-40°C and pH 6-9 are optimal for microbial remediation processes. Many fungal species such as Fusarium solani, Fusarium oxysporum, Penicillin miczynski, Scytalidium thermophilum, Trichoderma polysporum , as well as bacterial species belonging to the genera Pseudomonas, Bacillus, Rhodococcus and Serretia have been reported to degrade cyanides (Sharma, Akhter and Chatterjee, 2019).
Due to environmental toxicity, different microbial cyanide detoxification strategies were adopted and modified during the last few decades (Sharma, Akhter and Chatterjee, 2019). Biological treatments have a higher capital cost, but a significantly lower operating cost. As a result the cost of the process is lower than for the chemical processes. The microorganisms involved in the biological treatment of cyanide and thiocyanate usually include a heterogenous mixture of commonly found indigenous soil bacteria which have adapted to the treatment of these compounds. The bacteria convert free and weak acid dissociable metal complexed cyanides to bicarbonate and ammonia, while the freed metals are either absorbed on the biofilm or precipitated from solution. The difficulty with which the metal cyanide complexes are degraded generally follows the order of chemical stability (as seen in Figure 2) with free cyanide being the most easily degradable and accessible, while iron cyanide complexes are the hardest to degrade (Akcil, 2003).
The various microbial populations involved in the cyanide degradation and ammonia
nitrification are normally noncompetitive (Akcil, 2003). CN- and SCN- serve as a nitrogen and
carbon source for the cyanide degrading microorganisms. Nitrifying bacteria are much slower than cyanide degrading bacteria (Sharma, Akhter and Chatterjee, 2019). A schematic overview
of the biological treatment process is given in Figure 3.
Figure 3: An overview of the biological microbial degradation of cyanides
The first step is the oxidation of CN- and SCN- to SO
42-, NH4+ and CO32-, and the subsequent
sorption and precipitation of the free metals in the biofilm. The ammonium is nitrified to NO2
-Cyanide degrading bacteria CN- HCO3- Nitrification + NH3
NO
2 Nitrification - Denitrificat ionNO
3- Volatilization in the airN
211
and NO3-. This is mostly done by the Pseudomonas bacteria. In the third and last step
denitrification occurs. Nitrate is converted to N2 gas and hereby the removal of nitrogen from
the solution being treated is completed (Akcil, 2003).
The biodegradation of cyanide under anaerobic conditions has been demonstrated recently. Concomitant biogas generation is a possible economic benefit of the process. Studies in bioreactors have renewed the focus on reductive processes during anaerobic cyanide biodegradation (Annachhatre and Amornkaew, 2000; Cu et al., 2015).
2.2.3 Non-biological treatment methods Alkaline chlorination-NaOCl
The dominant method to remove cyanide from wastewater was the alkaline chlorination method. This method was the most widely applied of the cyanide treatment processes, but it has gradually been replaced by other chemical processes and is now used only occasionally (Teixeira et al., 2013). The treatment proceeds in two steps. First, cyanide is oxidized to cyanate by NaOCl. This because cyanate is 1000x less toxic then cyanide (Tiwari et al., 2007).
!"#! + 2!"&' + #(! ↔ !"#!& + 2!"#( + '!& (1)
This step can also be performed by directly adding NaOCl , instead of adding NaOH and Cl2.
In the second step cyanate is oxidized to carbon dioxide and nitrogen by further adding NaOCl,
or NaOH and Cl2.
2!"#!& + 4!"&' + 3#(! ↔ 6!"#( + 2#&!+ !!+ 2'!& (2)
The pH for the first step is ideally monitored between 10 and 11,5 and for the second step around 9. In order to ensure that the alkalination proceeds safely and efficiently, it is important to monitor the pH and the oxidation-reduction-potential (ORP) (Reed, Islam and Bendick, 2013). Furthermore, there can also be opted to use electro-generated NaOCl and this method
can also be followed by magnetite adsorption (Fe3O4) (Mooki et al., 2019). This process can
also oxidize thiocyanate and ammonia to nitrogen gas. This is very beneficial for the WWTP of ArcelorMittal, as all 3 compounds should be removed.
This method can be ideal for oxidizing free cyanide, but it also has several disadvantages. Chlorination is not effective in the case of cyanide species complexed with metals such as nickel, silver, and other metals due to slow reaction rates. The process also produces sludge, which requires licensed disposal. Another disadvantage is that it is relatively expensive due to the quantity of chlorine required. Further, the addition of excess chlorine increases the total amount of solids dissolved in the water, making it unsuitable for recycling and reuse purposes. Water that is too chlorinated is toxic to aquatic life (Reed, Islam and Bendick, 2013).
Other treatment processes involve e.g. ferrate(VI), Caro’s acid, sulphur dioxide, air. They are
all also used as oxidants. Also, ozonation and H2O2 were studied as a removal method together
12
Photocatalytic oxidation of cyanide
The cyanide concentration can be decreased by exposing the wastewater to sunlight, a process known as natural degradation. This is only possible for free and WAD cyanides. The oxidation product is cyanate. Cyanides and thiocyanates present in wastewaters from a cokes plant can be degraded simultaneously using UV-light. Overall, the photocatalytic degradation of cyanides is more efficient than that of thiocyanates . The reactions occurring with cyanide ions are the following (Mediavilla et al. 2019):
#!"+ ℎ2 → #! ∗ → (#!) !(3)
(#!)!+ '&" → &#!"+ #!"+ '!& (4)
'!& + ℎ2 → '& ∗ (5) &!+ ℎ2 → &!∗ (6) '& ∗ → '!&! (7) #!"+ & !∗ → &#!" (8) #!"+ 2&'"∗ → &#!" (9) &#!"+ '
!& → #&#!"+ !'# → !'$%+ &'" (10)
The reactions occurring with thiocyanate are the following (Mediavilla et al. 2019): 5#!"+ ℎ2 → 5#! ∗ (11) 5#!"+ 5#! ∗ → (5#!) !∗" (12) (5#!)!∗" → (5#!) !+ 5#!" (13) (5#!)!+ '!& → #!" + 5#!"+ 5& $!"+ &'" (14) 5#!"+ ℎ2 → #!"+ 5 (15) 5 + 5#!"→ #!"+ 5 !!" (16)
25 + 3&!+ 2'!& → 25&$!"+ &'" (17)
Cyanide oxidation would be initiated by the light excitation and reaction with the photogenerated species such as pair electron/holes, hydroxyl and superoxide radicals (reaction 3 –reaction10), leading to the formation of cyanate. This compound would be subsequently hydrolyzed or further oxidized into different final products such as ammonia, nitrates, nitrogen gas, or nitrites. Further photooxidation of ammonia to nitrates can proceed in
alkaline medium, both in the absence and presence of a catalyst like TiO2 (Mediavilla et al.
2019).
However, photooxidation does not destroy the pollutants completely. Often free cyanide is converted to cyanate but this is still toxic, and complete destruction of cyanate is difficult. Advanced photo-oxidation processes use UV radiation, often supplemented with chemical
oxidants such as H2O2. In this technology, hydroxyl radicals are formed. They are the second
most powerful oxidants after fluorine. The E0 (standard reduction potential)of the hydroxyl
radical is 2,8 V and the E0 of fluorine is 3,06 V. This technique does not produce any secondary
pollutants (Sarla et al., 2004). Experiments were also performed in presence of activated alumina. The presence of activated alumina has increased the reaction rate showing thus, a catalytic activity. The rate of removal of cyanides increases with rising initial molar ratio with
H2O2 and decreases at pH 10 to 12 (Chergui et al., 2015). Other tests were performed with a
13
catalysts are Cu2+ and TiO
2 (Chiang, Amal and Tran, 2003; Sarla et al., 2004). It was observed
that in absence of UV source, the degradation of cyanide by H2O2 alone was very slow,
whereas copper ions accelerated the reaction rate. Copper formed a complex with cyanide
ion, i.e. tetracyanocuprate which had greater affinity for H2O2 (Chiang, Amal and Tran, 2003).
Mediavilla et al. showed that is best to expose samples to UV light with a wavelength of 254nm. However, the only lamp available had a fixed wavelength 302nm. This higher wavelength means less energy and will result in less degradation of cyanides. Moreover, it is advantageous that it is a monochromatic lamp.
2.3 Safety
When working with cyanides, the researcher must take the right measures. HCN is a colorless gas, highly toxic to humans and aquatic organisms. It is a potent inhibitor of respiration due to its extreme toxicity towards cytochrome oxidase and by binding to terminal oxidase. The odor threshold for hydrogen cyanide is 0,58 mg/L. In high concentrations, cyanide smells like almonds (Hydrogen Cyanide: Acute Exposure Guideline Levels - Acute Exposure Guideline Levels for Selected Airborne Chemicals - NCBI Bookshelf, 2002). Given a pKA of 9,24, maintaining a pH above 9,24 is key to avoid formation of HCN gas. All experiments conducted in this thesis were performed under the fume hood. Acute (short-term) inhalation exposure to 100 ppb or more of hydrogen cyanide will cause death for humans. Acute exposure to lower concentrations (6-49 ppb) will cause a variety of effects, such as weakness, headache, nausea, eye and skin irritation. Chronic exposure results in headaches, dizziness, numbness, tremor, and loss of sight with reference concentration 0,003 ppb (Cyanide compounds: hazard summary, 1992).
14
2.4 Analysis
2.4.1 Distillation technique to quantify total cyanide
There are different ways to measure the amount of cyanide in the waste water. The conventional total cyanide measurement (Figure 5) involves prolonged distillation of the sample at 125°C under strongly acidic conditions, which breaks most strong and weak
metal-cyanide complexes and liberates free HCN. Most organocyanides and some extremely strong metal-cyanides such as cobalt-cyanide do not fully decompose under the total cyanide distillation
conditions. This manual
distillation is followed by
colorimetric, titrimetric or
electrochemical techniques to
measure cyanide ion
concentrations. Total cyanide measurement can either be performed manually or by using
automated techniques
(Dzombak, Ghosh and Wong-Chong, 2006). However, this method involves a lot of risks, with the wastewater being treated in an acidic environment. HCN is
formed, and it is not
recommended to perform this
test in a non-specialized
laboratory, as leaks are always a risk. The USEPA (United States Environmental protection agency) has acknowledged that cyanide is a method-defined analyte, which means that the cyanide concentrentration can alter according to which analytical method is used (Zheng et al., 2003).
2.4.2 Analytical techniques
The three common analytical techniques used for final quantitation of cyanide ions liberated from the samples via the distillation technique are titrimetric, colorimetric, cyanide ion-selective electrode and amperometry methods (Dzombak, Ghosh and Wong-Chong, 2006).
Titrimetric procedure
In this procedure, cyanide ions from the alkaline solution following distillation is titrated with
silver nitrate standard solution to form a soluble cyanide complex, namely Ag(CN)2. Any
presence of excess Ag+ in the solution is detected by a rhodanine indicator, which turns from
yellow to a salmon-like pink color indicating the end-point. The concentration of cyanide is Figure 5: Design of the most common cyanide quantification technique:
15 calculated from the titrant normality and the volume of titrant used to reach the color endpoint (Zheng et al., 2003). This method is only available for samples with >50 mg/L.
Colorimetric procedure
In this commonly applied procedure, cyanide ions from the alkaline solution following distillation are converted to CNCl by reaction with chloramine-T at pH < 8. Following the formation of CNCl, pyridine-barbituric acid is added to the solution, which converts CNCl to a blue-red complex. The colored complex exhibits a stable absorption maximum at 578nm. The concentration of cyanide is determined spectrophotometrically by comparison against a standard calibration curve of absorbance vs. concentration. Typical calibration range is between 0,02 and 0,2 mg/L. Because of its detection sensitivity and broad calibration range, the colorimetric method is the analytical technique of choice for most cyanide analysis methods and will also be used in this thesis (Dzombak, Ghosh and Wong-Chong, 2006).
Cyanide Ion-selective electrode
This ion-selective electrode is one of the only methods that measures individual cyanide
species, in this case CN- at high pH. In this procedure, cyanide ions from the alkaline absorber
solution following distillation is determined potentiometrically using a CN- ion-selective
electrode and associated meter. The concentration of cyanides in the absorber solution is determined by comparison against a standard calibration plot of log concentration of cyanide versus potential (mV). The cyanide electrode method is less sensitive in terms of detection than the colorimetric method and subject to numerous interferences . For these reasons, it is the least used of all the analytical techniques (Dzombak, Ghosh and Wong-Chong, 2006).
Amperometry
This technique is based on measured current between silver and platinum electrodes during spontaneous oxidation of the silver anode in contact with an alkaline cyanide solution. However this method is not really reliable and cannot easily be controlled (Pihlar, Kosta and Hristovski, 1979). Liberated cyanide is isolated by use of a membrane, and the amount of cyanide ions collected is measured by amperometry. The cyanide isolation is achieved by acidifying the sample and allowing HCN to pass through a gas diffusion membrane and is therefore
dangerous due to HCN formation. HCN is captured in a NaOH solution and converted to CN-.
The use of a membrane selective for HCN makes it possible to employ a nonselective electrical conductivity measurement for quantitation of the amount of cyanide ion in the NaOH solution (Dzombak, Ghosh and Wong-Chong, 2006).
2.4.3 Analysis by photochemical degradation
With this conventional method of distillation being one of the only techniques to liberate all the cyanides from their complexes and thus analyze the total cyanide concentration, it is necessary to find a new analytical technique that does not imply liberation of HCN as an intermediate step. In essence, the cyanides need to stay in solution the whole time. This would also make the analytical method cheaper and performed more, which would also improve safety. To solve
16
this problem, two before-mentioned techniques will be used and combined: photochemical oxidation and chemical oxidation by NaOCl. The degradation products will then be quantified. When the photochemical methods with UV-light are used, the produced ammonium, nitrate and nitrite could be measured. This enables the quantification of the amount of cyanides present before treatment. The concentrations of thiocyanate, as well as intermediate degradation ions such as sulphate, cyanate, nitrite, nitrate and ammonium could then be monitored in an ion exchange chromatography (Mediavilla et al., 2019). Extra oxidants, such as bleach and hydrogen peroxide can be added to the wastewater samples to ameliorate the byproduct formation. The resulting oxidation-reduction-reactions when bleach is added are presented in reaction (18) and (19).
!"&#( ↔ !"%+ '
!& + #("+ 26" (18)
#!"+ 5'
!& ↔ !&#"+ #&!+ 10'%+ 106" (19)
There are two electrons exchanged in the first reaction and ten in the second. This gives a
ratio from 1/5. Since we want every kind of cyanide to be converted to free CN-, it is better to
work with a 1/1 ratio.
Other less frequently used techniques are: microdiffusion, automated weak acid dissociable cyanide by thin film distillation, metal cyanides by ion chromatography, low-power UV digestion and Raman (Zheng et al., 2003).
3. Arsenic
3.1 Introduction
Arsenic is a metalloid. It is the 20th most abundant element on earth. Arsenic is a carcinogen
and its ingestion may adversely affect the gastrointestinal, cardiac and vascular system and the central nervous system (Kumar et al., 2004). This led the World Health Organisation (WHO) to change the acceptable level of arsenic in drinking water to 10 µg/L (Mohammed et al., 2019). During coal combustion at power plants, most of the initial As in coal volatilizes into the
gaseous phase
,
which means that the arsenic ends up in the wash water. Both organic andinorganic arsenic can be present in coal. It can exist as a chemically bound form, but also in a sorbed (acid leachable) arsenate form. In coking coals there is a minimum of arsenate (Yudovich and Ketris, 2005). Table 5 shows the concentrations of arsenic in the different treatment steps of the WWTP of ArcelorMittal Ghent. The concentration of arsenic present in the wastewater also depends a lot on the used coal blend (Yudovich and Ketris, 2005). The arsenic concentration in the aeration basins is significantly lower than the starting
concentrations, because it was treated in the settling tank with the present coagulant Al2(SO4)3.
During the biological removal, the arsenic concentration doesn’t alter. This concentration lies above the legal discharge standards.
17
Table 5: Concentration arsenic in the different steps of the wastewater treatment plant of ArcelorMittal
Source- water As (;g/L)
Cokes washing water 470
Wastewater to the wastewater treatment plant
420
Groundwater aeration basins 7,5
Source- cokes As (mg/kg)
Cokes ‘Shoal Creek’ (USA) 11,9
PLV (Australia) <1
3.2 Removal techniques
3.2.1 Overview of the removal techniques
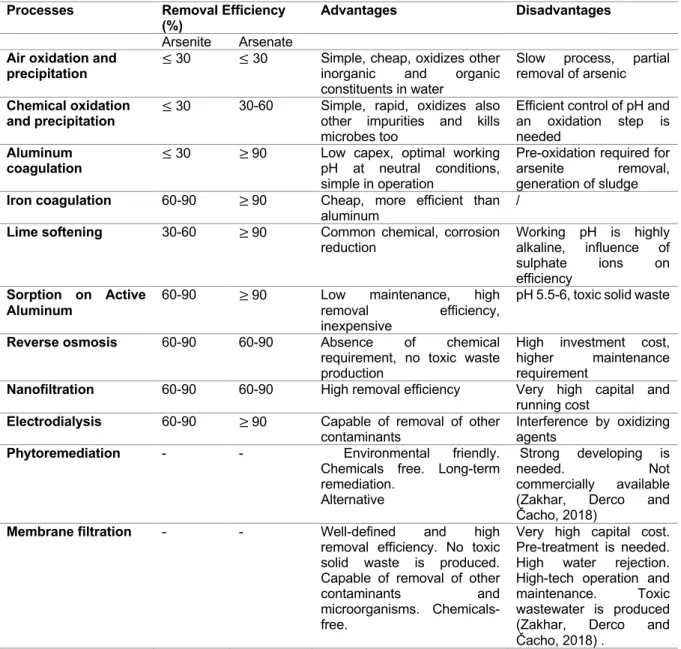
Table 6 lists the different arsenic removal techniques (Zakhar, Derco and Čacho, 2018). Table 6: Overview of the most commonly used arsenic removal techniques. No removal efficiency was found of phytoremediation and membrane filtration.
Processes Removal Efficiency
(%) Advantages Disadvantages
Arsenite Arsenate Air oxidation and
precipitation ≤ 30 ≤ 30
Simple, cheap, oxidizes other inorganic and organic constituents in water
Slow process, partial removal of arsenic Chemical oxidation
and precipitation ≤ 30 30-60 Simple, rapid, oxidizes also other impurities and kills microbes too
Efficient control of pH and an oxidation step is needed
Aluminum
coagulation ≤ 30 ≥ 90
Low capex, optimal working pH at neutral conditions, simple in operation
Pre-oxidation required for arsenite removal, generation of sludge
Iron coagulation 60-90 ≥ 90 Cheap, more efficient than
aluminum /
Lime softening 30-60 ≥ 90 Common chemical, corrosion
reduction Working pH is highly alkaline, influence of sulphate ions on efficiency Sorption on Active Aluminum
60-90 ≥ 90 Low maintenance, high removal efficiency, inexpensive
pH 5.5-6, toxic solid waste
Reverse osmosis 60-90 60-90 Absence of chemical
requirement, no toxic waste production
High investment cost, higher maintenance requirement
Nanofiltration 60-90 60-90 High removal efficiency Very high capital and
running cost
Electrodialysis 60-90 ≥ 90 Capable of removal of other
contaminants Interference by oxidizing agents
Phytoremediation - - Environmental friendly.
Chemicals free. Long-term remediation.
Alternative
Strong developing is needed. Not commercially available (Zakhar, Derco and Čacho, 2018)
Membrane filtration - - Well-defined and high
removal efficiency. No toxic solid waste is produced. Capable of removal of other contaminants and microorganisms. Chemicals-free.
Very high capital cost. Pre-treatment is needed. High water rejection. High-tech operation and maintenance. Toxic wastewater is produced (Zakhar, Derco and Čacho, 2018) .