Contact: E.A. van Lier
RIVM, Centre for Infectious Disease Control Netherlands alies.van.lier@rivm.nl
RIVM report 215011001/2007
Disease burden of infectious diseases in Europe: a pilot study
E.A. van Lier, A.H. Havelaar
This investigation has been performed for the European Centre for Disease Prevention and Control (ECDC) and on account of the Netherlands’ Ministry of Health, Welfare and Sport, within the framework of project V/215011, International Coördination.
Acknowledgements
We would like to thank the European Centre for Disease Prevention and Control for the opportunity to conduct this interesting and challenging pilot. Also, we would like to
acknowledge the valuable ideas and suggestions for improvement and/or data contributed by the following individuals:
ECDC Zsuzsanna Jakab
Arun Nanda
Andrea Ammon
Andrew Amato
Edward van Straten
Angus Nicoll Bruno Ciancio Bernadette Gergonne Pierluigi Lopalco Francoise Hamers Magid Herida Johanna Takkinen
Karoline Fernandez de la Hoz
Davide Manissero
HPA John Edmunds
WHO Colin Mathers
Claudia Stein
Doris Ma Fat
Eurostat Elodie Niederlaender
EISS John Paget
EuroHIV Anthony Nardone
EuroTB Dennis Falzon
DG SANCO John Ryan
EUR Gouke Bonsel
RIVM Marja Esveld
Hans van Vliet
Nancy Hoeymans
Martin Gommer
Marianne van der Sande
Susan Hahné
Eline Op de Coul
Abstract
Disease burden of infectious diseases in Europe: a pilot study
Consequences of different infectious diseases cannot be adequately compared with each other on the basis of the number of patients or mortality data only. It is better to combine all health effects and express the total impact as disease burden, which also takes duration and severity of diseases into account. Information on disease burden also helps to set priorities in
European policy for infectious disease control.
In a pilot study, the disease burden of seven infectious diseases in Europe has been estimated. In spite of various limitations with regard to availability and quality of data, it was found that HIV infection, tuberculosis and influenza cause, among the selected infectious diseases, the highest disease burden in Europe. Foodborne diseases caused by the bacteria Campylobacter spp., enterohaemorrhagic Escherichia coli and Salmonella spp. and, in particular, measles, are associated with a lower burden.
The current disease burden of infectious diseases reflects the balance between the disease threats and the effectiveness of preventive strategies. A low burden stresses the need for the continued support of these strategies, while a high burden indicates the need for additional interventions. Based on this pilot, the RIVM recommends that a full burden of disease study - combining several methods of investigation - be conducted in cooperation with different European institutes.
Key words: disease burden; priority setting; infectious diseases; Disability Adjusted Life Year; DALY; Europe
Rapport in het kort
Ziektelast van infectieziekten in Europa: een pilot studie
De gevolgen van verschillende infectieziekten zijn onderling niet goed te vergelijken op basis van het aantal patiënten of sterftecijfers alleen. Het is beter om alle gezondheidseffecten te combineren en de totale impact uit te drukken in ziektelast, dat ook rekening houdt met duur en ernst van ziekten. Informatie over ziektelast helpt prioriteiten te stellen in het Europese beleid op het gebied van infectieziektebestrijding.
In een pilotstudie is de ziektelast geschat van zeven infectieziekten in Europa. Ondanks verschillende beperkingen in beschikbaarheid en kwaliteit van gegevens wordt geschat dat HIV-infectie, tuberculose en influenza van de geselecteerde infectieziekten de grootste
ziektelast in Europa veroorzaken. Voedseloverdraagbare ziekten die worden veroorzaakt door de bacteriën Campylobacter spp., enterohemorragische Escherichia coli en Salmonella spp., en mazelen in het bijzonder, zijn geassocieerd met een lagere ziektelast.
De huidige ziektelast van de infectieziekten weerspiegelt de balans tussen bedreigingen van de ziekten en effectiviteit van preventiemaatregelen. Een lage ziektelast benadrukt de noodzaak van voortdurende ondersteuning van deze maatregelen, een hoge ziektelast duidt erop dat aanvullende acties nodig zijn. Op basis van deze pilotstudie adviseert het RIVM om samen met verschillende Europese instituten een uitgebreidere studie uit te voeren, die verschillende onderzoeksmethoden combineert.
Trefwoorden: ziektelast; prioritering; infectieziekten; Disability Adjusted Life Year; DALY; Europa
Contents
Summary 9
1. Introduction 17
2. Methods 21
2.1 Disability Adjusted Life Years (DALYs) 21
2.2 Incidence approach 22
2.3 Agent-based approach 22
2.4 Outcome trees 22
2.5 Other choices 23
2.6 Data and data analysis 25
3. Limitations 29
3.1 Data availability 29
3.2 Data quality 30
4. Influenza 31
4.1 Outcome tree 31
4.2 Baseline estimate of disease burden 32
4.3 Scenario analysis 33
4.4 Discussion and recommendations 35
5. Measles 37
5.1 Outcome tree 37
5.2 Baseline estimate of disease burden 38
5.3 Scenario analysis 39
5.4 Discussion and recommendations 40
6. HIV-infection 41
6.1 Outcome tree 41
6.2 Baseline estimate of disease burden 42
6.3 Scenario analysis 43
6.4 Discussion and recommendations 46
7. Campylobacteriosis 47
7.1 Outcome tree 47
7.2 Baseline estimate of disease burden 47
7.3 Scenario analysis 49
8. EHEC-infection 51
8.1 Outcome tree 51
8.2 Baseline estimate of disease burden 51
8.3 Scenario analysis 52
8.4 Discussion and recommendations 53
9. Salmonellosis 55
9.1 Outcome tree 55
9.2 Baseline estimate of disease burden 55
9.3 Scenario analysis 56
9.4 Discussion and recommendations 58
10. Tuberculosis 59
10.1 Outcome tree 59
10.2 Baseline estimate of disease burden 60
10.3 Scenario analysis 61
10.4 Discussion and recommendations 62
11. Comparison between diseases 65
12. General conclusions and recommendations 67
12.1 Conclusions 67
12.2 Recommendations 69
References 71
Appendix I List of communicable diseases for EU surveillance 75
Appendix II List of countries 77
Appendix III Life expectancy 78
Appendix IV Data and assumptions baseline estimates of disease burden 79
Summary
Background
The European Centre for Disease Prevention and Control (ECDC) has a responsibility to identify, assess and communicate current and emerging threats to human health from infectious diseases. As one of the elements to fulfil the above responsibility, the ECDC is producing the Annual Epidemiological Report on Communicable Diseases for 2005. The aim of this report is to give a comprehensive overview of the threat of infectious diseases in the European Union in 2005. The report analyses incidence trends and patterns of the 46 diseases under mandatory surveillance, together with SARS, avian influenza and West Nile virus. The trends identified give one indication of which diseases require priority action, and including mortality, prevalence (very little data) and sequelae would give additional indications. However, such assessments, if used individually, make it difficult to get an overall
assessment of disease burden, as the diseases and their consequences are heterogeneous in terms of mortality and morbidity.
Composite health measures attempt to overcome those issues by combining mortality, incidence (and/or prevalence) and the sequelae due to an infectious agent. ECDC wishes to evaluate whether a composite measure could be useful to inform its decision making process. If successful, then the composite measure could be used as one element to gain insight in (expected) trends to guide public health policy and actions within the group of 49 infectious diseases. Several composite measures of disease burden have been developed and are increasingly used, including Disability Adjusted Life Years (DALYs). It is important to remember that absolute values of such measures (be they DALYs or any other) are of little significance. It is only their relative values that are important in indicating and guiding public health policy and action. Furthermore, disease burden is only one of the criteria that can be used for priority setting. Other priority setting criteria are incidence, severity, potential to spread among the general population, socioeconomic burden, preventability, potential to drive public health policy, risk perception, changing patterns in time1 and outbreak potential. As a first step, a pilot study was carried out to illustrate the potential of the disease burden concept, to explore data availability and quality, to recommend future studies and to stimulate debate. This study was conducted in a short period of time to fit into the time schedule of the production of ECDC’s Annual Epidemiological Report on Communicable Diseases for 2005. Due to time and resource limitations, it was decided to only include generally available data such as those of Eurostat, WHO and dedicated surveillance networks. Seven diseases were included in this pilot: influenza, measles, infection with Human Immunodeficiency Virus (HIV-infection), campylobacteriosis, infection with enterohaemorrhagic Escherichia coli (EHEC-infection), salmonellosis and tuberculosis. These diseases were mainly selected based on the availability of incidence and mortality data and previous experience at RIVM so that comparisons could be made.
It is recognised that the results of this initial study, based on generally available information, do not reflect the full disease burden of the selected infectious diseases in Europe, due to potential underreporting in the available data on morbidity and mortality. Also, as the extent of the potential underreporting varies between different diseases (and countries), even the current relative comparisons of disease burden could be biased. Furthermore, not all relevant outcomes could be included in this preliminary assessment. To explore the uncertainty resulting from those limitations, scenario analyses were carried out and the disease burden estimates were compared with those of previously published more detailed studies. Methods
The DALY methodology has been described by Murray and co-workers in the Global Burden of Disease (GBD) project,2,3 using the following equation:
DALY = YLL + YLD.
YLL is the number of years of life lost due to mortality and YLD is the number of years lived
with a disability, weighted with a factor between 0 and 1 for the severity of the disability. The
YLL due to a specific disease in a specified population is calculated by summation of all fatal
cases (d) due to the health outcomes (l) of a specific disease, each case multiplied by the expected individual life span (e) at the age of death:
∑
× = l l l e d YLLYLD is calculated by the product of the duration of the illness (t) and the severity weight (w)
of a specific disease, accumulated over all cases (n) and all health outcomes (l):
∑
× × = l l l l t w n YLDApplying the DALY methodology involves making several choices on details of the analysis which should reflect value choices that are relevant to the decision maker. For this pilot project, the choices were made (in many cases due to pragmatic reasons coming from the three months duration of this pilot) in consultation with staff members of ECDC:
- incidence approach (in contrast to prevalence approach) - agent-based approach (in contrast to outcome-based approach)
- selection of outcomes to be included in the outcome tree for each of the diseases - European life expectancy (in contrast to life expectancy from a standard life table) - no application of discounting and age-weighting
Data sources and limitations
Depending on data availability, as many as possible member states of the European Union and EEA/EFTA* countries were included. Generally available data have been derived from: YLL d = Number of fatal cases : Mean number of deaths 2003-2004 reported to Eurostat/WHO e = Life expectancy at age of death : European life expectancy 2004
YLD n = Number of cases of illness : Mean incidence 2003-2005 reported to - EuroHIV (HIV-infection) - EuroTB (tuberculosis)
- EISS (influenza, mean 2002/2003-2004/2005) - Eurostat (other diseases)
t = Duration of illness : Literature (mainly Global Burden of Disease study) w = Severity weights : Literature (mainly Global Burden of Disease study)
Major limitations in data availability were:
• inconsistent morbidity and/or mortality by some countries and/or for some years; • very limited information on the age-distribution of morbidity for most diseases; • no reporting of the incidence of complications and chronic sequelae;
• no consistent set of severity weights available. Major limitations with regard to data quality were:
• no information on underreporting of morbidity and mortality;
• no information on possible variation between countries of the duration, severity and rate of complications and chronic sequelae;
• differences between reports from different sources (national, Eurostat and WHO).
*
Results
This study makes clear that the relative burden of diseases as measured by disease burden is quite different compared to the relative burden as measured by just incidence or mortality data (Figure 1). Based on incidence data individually, the foodborne diseases cause relatively the greatest burden, while mortality data indicate the relatively high burden of tuberculosis. Disease burden (DALYs) shows a quite different picture with a relative high burden for HIV-infection and tuberculosis.
Figure 1 Relative burden of the seven selected diseases based on different indicators: - incidence (mean number of reported new cases per year in the period 2003-2005) - mortality (mean number of reported deaths per year in the period 2003-2004) - disease burden (DALYs per year based on above mentioned incidence and mortality)
influenza measles HIV-infection campylobacteriosis EHEC-infection salmonellosis tuberculosis disease burden 4.7% 0.5% 38.3% 10.7% 3.5% 6.3% 35.9% incidence 2.2% 0.3% 3.9% 42.5% 3.0% 38.8% 9.3% mortality 14.9% 0.3% 23.4% 0.1% 0.0% 2.0% 59.3%
Based on data for twelve countries (data available for all seven diseases):
Austria Ireland the Netherlands Sweden
Czech Republic Latvia Poland United Kingdom Germany Lithuania Slovenia Norway
3.7 0.4 44.1 5.3 2.0 3.2 24.0 0 10 20 30 40 50
influenza (sum 16 countries)
measles (sum 23 countries)
HIV-infection (sum 21 countries)
campylobacteriosis (sum 20 countries)
infection with enterohaemorrhagic E. coli (sum 20 countries)
salmonellosis (sum 23 countries)
tuberculosis (sum 23 countries)
Disease burden (DALYs per year per 100,000 population)
YLD acute YLD complications YLL
-> ranges from 0.8 in Portugal to 11.4 in Luxembourg
-> ranges from 0 in a number of countries to 6.5 in Malta
-> ranges from 0.8 in Czech Republic to 387.6 in Portugal -> ranges from 0 in Cyprus to 27.6 in Czech Republic
-> ranges from 0 in Cyprus to 8.7 in Czech Republic
-> ranges from 0.4 in Portugal to 19.1 in Czech Republic
-> ranges from 3.4 in Malta to 263.2 in Lithuania
In Figure 2 an estimate of the total disease burden per 100,000 population for the seven selected diseases is shown, for those countries for which YLD and YLL and DALY could be calculated. An analysis based on twelve countries for which the disease burden could be calculated for all diseases, shows a quite similar picture (see Appendix V). HIV-infection and tuberculosis have the highest disease burden in Europe, measles the lowest.
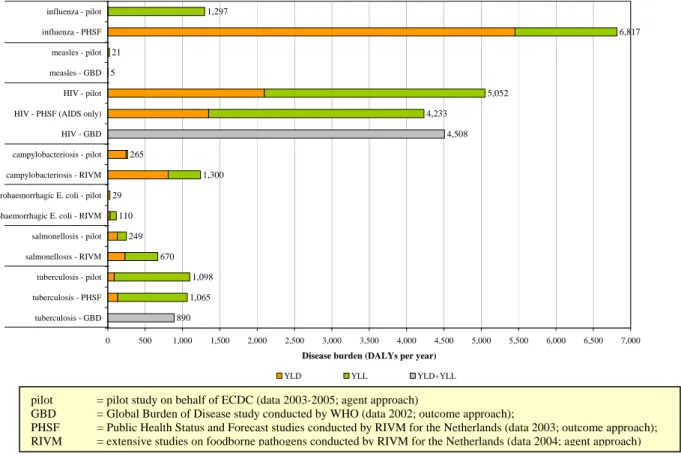
Figure 2 Sum of disease burden per 100,000 population of all countries for which data are available for at least one disease (for each disease number of countries is different) (Table 3.1 shows per disease which countries could not be included)
For the Netherlands comparisons with more extensive studies (Figure 3) and results from scenario analysis have suggested that the disease burden of influenza is seriously
underestimated (especially morbidity). Especially for HIV-infection the information on long-term outcomes of current infections and the effect of Highly Active Anti-Retroviral Therapy (HAART) is incomplete. Furthermore, morbidity and in particular mortality of foodborne diseases (campylobacteriosis, EHEC-infection and salmonellosis) were likely to be
underestimated due to underreporting. Estimates of the burden of measles and tuberculosis appear to be less uncertain.
1,297 6,817 21 5 5,052 4,233 4,508 265 1,300 29 110 249 670 1,098 1,065 890 0 500 1,000 1,500 2,000 2,500 3,000 3,500 4,000 4,500 5,000 5,500 6,000 6,500 7,000 influenza - pilot influenza - PHSF measles - pilot measles - GBD HIV - pilot HIV - PHSF (AIDS only) HIV - GBD campylobacteriosis - pilot campylobacteriosis - RIVM enterohaemorrhagic E. coli - pilot enterohaemorrhagic E. coli - RIVM salmonellosis - pilot salmonellosis - RIVM tuberculosis - pilot tuberculosis - PHSF tuberculosis - GBD
Disease burden (DALYs per year)
YLD YLL YLD+YLL
Figure 3 Comparison of results from the pilot study for the Netherlands with previously published more extensive (Dutch) studies
Conclusions
The relative burden of diseases as measured by disease burden is quite different compared to the relative burden as measured by just incidence or mortality data. Taking into account the limitations in data availability and quality, it was found that (based on data for 2003-2005 when available) the disease burden in Europe is estimated to be highest for HIV-infection and tuberculosis, followed by campylobacteriosis, influenza and salmonellosis, and was lowest for measles and EHEC-infection. Scenario analysis limited to the Netherlands suggested that this ranking is not likely to be affected by better data. However, the relative burden of influenza is likely to increase. It must be noted that differences between countries sometimes are considerable and may be due to differences in reporting.
The current disease burden reflects the balance between threats and the effectiveness of preventive strategies. A low burden stresses the need for the continued support of these strategies. A high burden indicates the need for additional interventions. Disease burden estimates provide an integrated representation of the burden of infectious diseases. However, for priority setting other factors, such as threats and trends, costs and perception should be taken into account as well.
pilot = pilot study on behalf of ECDC (data 2003-2005; agent approach)
GBD = Global Burden of Disease study conducted by WHO (data 2002; outcome approach);
PHSF = Public Health Status and Forecast studies conducted by RIVM for the Netherlands (data 2003; outcome approach); RIVM = extensive studies on foodborne pathogens conducted by RIVM for the Netherlands (data 2004; agent approach)
Recommendations
Disease burden (DALYs) calculations should be extended to other infectious diseases as well, because this composite measure gives more insight in burden than incidence or mortality data on its own. A full burden of disease study is recommended and would benefit from an
approach that combines and triangulates several methods of investigation, including
epidemiological modelling. In this short term pilot pragmatic choices had to be made, a full study should include a systematic and critical review on other disease burden estimates and on aspects like most suitable data sources, extent of underreporting, severity weights, outcome trees etcetera for each of the diseases under study. Furthermore there needs to be general agreement on methodological issues discussed in Chapter 2 like using a standard life table instead of the European life expectancy (that changes over time) or showing both discounted and undiscounted results in the future. Where possible a full burden of disease study should join other international efforts in this field (i.e. the WHO update of the Global Burden of Disease for the year 2004). With regard to priority setting, besides disease burden other aspects such as economical costs or outbreak potential should also be taken into account.
In order to obtain better insight in the epidemiology of infectious diseases in general and in the disease burden in particular, the following recommendations are made:
• improve the completeness and consistency of reporting of the incidence of morbidity and mortality in Europe, including information on the age-distribution;
• conduct cohort studies on the incidence of complications and chronic sequelae, including possible variability between countries and factors associated with that variability;
• conduct studies addressing sources of underreporting of morbidity and mortality in order to calibrate the data and to decrease inconsistencies in reporting between countries; • improve quantification of the mortality risks due to infectious diseases by cohort-studies; • integrate mathematical modelling to better understand the current and future burden, in
particular for the HIV/AIDS epidemic including the impact of HAART;
• promote standardized data collection on disease severity and duration across Europe; • conduct studies on severity weights and obtain consensus on the protocols for such
studies, including national differences;
1.
Introduction
The European Centre for Disease Prevention and Control (ECDC) has a responsibility to identify, assess and communicate current and emerging threats to human health from infectious diseases. As one of the elements to fulfil the above responsibility, the ECDC is producing the Annual Epidemiological Report on Communicable Diseases for 2005. The aim of this report is to give a comprehensive overview of the threat of infectious diseases in the European Union in 2005. The report analyses incidence trends and patterns of the 46 diseases under mandatory surveillance, together with SARS, avian influenza and West Nile virus for the different countries (Appendix I and II). The trends identified give one indication of which diseases require priority action, and including mortality, prevalence (very little data) and sequelae would give additional indications. However, such assessments if used individually make it difficult to get an overall assessment of disease burden, as the diseases and their consequences are heterogeneous in terms of mortality and morbidity. For example, diseases that do not (or seldom) result in death would not figure as high priority using mortality, whereas just incidence (or prevalence if such data were universally available) would underplay the effect of diseases with high case fatality ratios.
Composite health measures (such as Disability Adjusted Life Years) attempt to overcome those issues by combining mortality, incidence (and/or prevalence) and the sequelae due to an infectious agent. ECDC wishes to evaluate whether a composite measure could be useful to inform its decision making process. If successful, then the composite measure could be used as one element to gain insight in (expected) trends to guide public health policy and actions within the group of 49 infectious diseases. Several composite measures of disease burden have been developed and are increasingly used, including Disability Adjusted Life Years (DALYs). It is important to remember that absolute values of composite measures (be they DALYs or any other) are of little significance. It is only their relative values that are important in indicating and guiding public health policy and action. Furthermore, disease burden is only one of the criteria that can be used for priority setting. Other priority setting criteria are incidence, severity, potential to spread among the general population,
socioeconomic burden, preventability, potential to drive public health policy, risk perception, changing patterns in time1 and outbreak potential.
The Dutch National Institute for Public Health and the Environment (RIVM) has
considerable experience in applying the DALY concept at the level of the Dutch population, dating back to the Public Health Status and Forecast study document published in 1997.4 The emphasis in this document was on the impact of major diseases such as cardiovascular disease and cancer. However, the disease burden of a number of infectious diseases has also been assessed.5 Further work at RIVM on infectious diseases has focussed on foodborne pathogens including thermophilic Campylobacter spp.6 and Shiga-toxin producing
Disease burden estimates have been used for estimating the cost-effectiveness of
interventions to reduce the contamination of broiler meat with thermophilic Campylobacter spp.8 and as an aspect of priority setting of foodborne pathogens.9 This latter study also included disease burden estimates of non-typhoidal Salmonella spp., noroviruses, rotaviruses, listeriosis and toxoplasmosis. Therefore, the RIVM has been invited by ECDC to perform a pilot study on disease burden of infectious diseases at European level.
The ultimate goal is to produce an estimate of disease burden of infectious diseases at
European level and gain insight in (expected) trends to guide public health policy and actions. This pilot study was carried out to illustrate the potential of the disease burden concept, to explore data availability and quality, to recommend future studies and to stimulate debate. This study was conducted in a short period of time to fit into the time schedule of the
production of ECDC’s Annual Epidemiological Report on Communicable Diseases for 2005. Due to time and resource limitations, it was decided to only include generally available data such as those of Eurostat, WHO and dedicated surveillance networks. Given time and data limits, as a first step only a limited number of diseases have been assessed in a pilot, based on generally available information and using methodology appropriate to give results from existing data and within time limits of the initial stages of this work. The diseases which met one or more of the selection criteria (Table 1.1) were included in a pilot study. The most important criteria were the availability of incidence and mortality data and previous experience at RIVM so that comparisons could be made.
Table 1.1 Selection criteria for inclusion of infectious diseases in the pilot study
Selected infectious diseases Criteria Influenza Measles
HIV-infection Campylo-bacteriosis EHEC-infection Salmo-nellosis Tuber-culosis
a) European data on incidence and mortality available
(X) X X X X X X b) Expected high burden of
disease
X X X
c) Priority for additional control (prevention possibilities)
X X X
d) Former disease burden experience at RIVM
X X X X X X
e) Upward trend X X
HIV: Human Immunodeficiency Virus; EHEC: enterohaemorrhagic Escherichia coli
It is recognised that the results of this initial study do not reflect the full disease burden of the selected infectious diseases in Europe, due to potential underreporting in the available data on morbidity and mortality. Also, as the extent of the potential underreporting varies between different diseases (and countries), even the current relative comparisons of disease burden could be biased. Furthermore, not all relevant outcomes could be included in this preliminary assessment. To explore the uncertainty resulting from those limitations, scenario analyses were carried out and the results were compared with those of previously published more detailed studies.
This report presents the results of the pilot project. Chapter 2 describes the methods used. In Chapter 3 limitations in both data availability and data quality are discussed. Chapters 4-10 provide information on a first estimate of the burden of disease for each of the seven selected infectious diseases: influenza, measles, HIV-infection, campylobacteriosis, EHEC-infection, salmonellosis and tuberculosis. In Chapter 11 a comparison between diseases is shown. Finally, Chapter 12 gives a general conclusion on the results obtained so far and
2.
Methods
A general trend in public health research is the use of disease burden, or the amount of health loss caused by diseases, as one aspect for indicating areas of priorities for actions. Infectious diseases typically have several possible health outcomes, ranging from acute self-limiting diseases to chronic disabilities or even death. These different outcomes can be combined in one single composite measure; the Disability Adjusted Life Years (DALYs) is one such measure.
2.1
Disability Adjusted Life Years (DALYs)
The DALY is a health gap measure that extends the concept of potential years of life lost due to premature death to include equivalent years of “healthy” life lost in states of less than full health, broadly termed disability. One DALY is thus one lost year of healthy life (WHO definition). The DALY methodology has been described by Murray and co-workers in the Global Burden of Disease (GBD) project,2,3 using the following equation:
DALY = YLL + YLD.
YLL is the number of years of life lost due to mortality and YLD is the number of years lived
with a disability, weighted with a factor between 0 and 1 for the severity of the disability. The
YLL due to a specific disease in a specified population is calculated by summation of all fatal
cases (d) due to the health outcomes (l) of a specific disease, each case multiplied by the expected individual life span (e) at the age of death. Thus:
∑
× = l l l e d YLLYLD is calculated by the product of the duration of the illness (t) and the severity weight (w)
of a specific disease, accumulated over all cases (n) and all health outcomes (l):
∑
× × = l l l l t w n YLDApplying the DALY methodology involves making several choices on details of the analysis which should reflect value choices that are relevant to the decision maker. For this pilot project, the choices were made (in many cases due to pragmatic reasons coming from the three months duration of this pilot) in consultation with staff members of ECDC and are described below.
2.2
Incidence approach
In the incidence-based approach to disease burden calculations, all new cases are counted and all health outcomes (including those in future years) are assigned to the initial event, i.e. the acute (symptomatic) infection. This approach contrasts with the prevalence approach, in which the health status of a population at a specific point of time is assessed, possibly
followed by attribution of the prevalent diseases to etiological agents or conditions. However, assuming a steady state situation there should be no difference between both approaches. In the field of infectious diseases prevalence data are rare, so following earlier work on
foodborne pathogens in the Netherlands the incidence approach was used in this pilot project as far as possible.
2.3
Agent-based approach
The outcome-based approach assigns the disease burden to clinically defined categories of diseases (ICD-codes), irrespective of their cause. This approach is mainly used to assess the overall public health situation in a country or region. In contrast, the agent-based approach focuses on all relevant health outcomes that can be attributed to one particular agent. These outcomes can cover different disease categories (ICD-codes). Following earlier work on foodborne pathogens in the Netherlands, the agent-based approach was chosen. There is a risk of overestimation because co-morbidity could not be taken into account.
2.4
Outcome trees
Infectious diseases typically have several possible health outcomes, ranging from acute self-limiting diseases to chronic disabilities or even death. In order to assess the burden of disease for the different selected infectious diseases, the disease outcomes following each specific infectious agent had to be defined. For each infection an outcome tree has been designed in consultation with experts from both ECDC and RIVM; because of the short duration of the pilot pragmatic choices had to be made. An outcome tree represents a qualitative
representation of the progression of disease in time by ordering relevant health states
following infection and illustrating their conditional dependency. For infectious diseases, the first blocks in the tree typically represent the incidence of infection and acute illness in a particular period. Subsequent blocks represent the incidence of possible outcomes, including recovery. For late outcomes, this incidence is accumulated over the lifetime of affected individuals so that the link between the blocks reflects the lifetime probability of developing an outcome, given the previous outcome.
Constructing outcome trees implied making choices on which outcomes to include and which to exclude from the analysis. This was based on preliminary estimations of the relative impact of all possible outcomes on the total disease burden. Outcomes that contribute little to the final result (because they are extremely rare and/or because their severity is low) have not been included. Construction of outcome trees is usually also guided in part by data
availability. It is an iterative process that involves reviewing the tree while the study progresses. For some outcomes, the causal link with the agent of concern may not be fully established. For example, a statistical association has been reported but this has not (yet) been repeated in other independent studies and/or the causal mechanism has not (yet) been
elucidated. In that case, a professional but subjective choice was made whether or not to include this outcome in the baseline model.
2.5
Other choices
When working with the DALY concept, it is important to make clear what value choices and assumptions are made, especially with regard to the choice of:
• life expectancy • discounting • age-weighting and • disability weighting10
Former research pointed out for example that the combined effect of age-weighting and discounting is that the burden attributed to younger age groups is considerably less than it would have been without these value choices.10
Life expectancy
In the absence of co-morbidity, the life expectancy of fatal cases can be derived from life tables if the age distribution of fatalities is known. By choosing the national life expectancy for each country, it would mean that the death of a 40-year old person in a country with a low life expectancy contributes less to the European burden of disease than the death of a 40-year old person in a country with a high life expectancy, which is not preferable. In the Global Burden of Disease study, the years of life lost due to a death at a given age has been calculated using the life expectancy at that age in standard life tables (West Level 26) with life expectancy at birth fixed at 82.5 years for females and 80.0 years for males. This standard has been chosen to match the highest national life expectancy observed (Japanese females).11 In Europe however the difference in life expectancy between men and women is greater and therefore the mean life expectancy of the 25 EU-countries in 2004 has been used (calculation based on total mortality and average population 2004, data Eurostat; see Appendix III).
Discounting
When the principle of discounting is applied, it means that future life years are assigned less value than those lived today. This is based on the economic concept that one prefers benefits now rather than in the future.11 Discounting is disputed because its application results in a lower efficiency of prevention programmes.12 Therefore, some studies show both discounted and undiscounted results. In this pilot project discounting has not been applied.
Age-weighting
Age-weighting is applied to reflect that individuals have different roles and changing levels of dependency and productivity with age. Therefore it may be appropriate to consider valuing the time lived at a particular age unequally.11 Age-weighting is highly debated and the exact quantitative implementation is controversial.13,14 In this pilot project, age-weighting has not been applied.
Disability weighting
Disability weighting means that each outcome of a disease is assigned a different value on a scale from 0 (perfect health) to 1 (death). Although it seems controversial to weigh health outcomes, a Dutch study on toxoplasmosis indicates that disease burden results are more affected by using different data sources than different severity weights.15 This is also true for heart failure and rheumatoid arthritis but depends on the disease under study.16
Ideally, the severity weights used in the calculations reflect the values in the societies under study. The Global Burden of Disease study divides the spectrum from health to death into seven disability classes17 (Table 2.1).
Table 2.1 Disability classes and severity weights according to the Global Burden of Disease study17 Disability class Severity weights Examples
1 0.00-0.02 Vitiligo on face, low weight
2 0.02-0.12 Watery diarrhoea, severe sore throat, severe anaemia 3 0.12-0.24 Infertility, rheumatoid arthritis, angina
4 0.24-0.36 Amputation, deafness 5 0.36-0.50 Down syndrome 6 0.50-0.70 Depression, blindness 7 0.70-1.00 Psychosis, dementia, quadriplegia
Severity weights can be derived through different methods. Ideally, values of the general public are reflected in severity weights that are used to inform policy making at the national or international level. Weights based on elicitation panels consisting of lay persons are
increasingly becoming available. Previous work has depended on other panels e.g. of medical professionals. Values from patients who actually suffer from a disease are not considered informative because of coping behaviour.
Different protocols are available for panel elicitation, including the standard gamble (SG), time trade-off (TTO), person trade-off (PTO) and visual analogue scale (VAS). All methods give different results (VAS > TTO > PTO > SG), but they are correlated. The SG and VAS are not considered informative because they are only sensitive to severe disease (SG) or very sensitive to mild diseases (VAS). This leads to compression at either end of the scale. The TTO and PTO methods are generally used.
For chronic diseases, most descriptions are based on the impact of a disease in the course of a year. Many infectious diseases have a rapid course, and the disease burden can be assessed by focusing on the phase of acute disease only (period profile) or by focusing on a year in which an episode of acute illness is experienced (annual profile). Both methods have been used and using the annual profile may overvalue disability weights.18 Hence for self-limiting diseases of short duration, large differences may be found between these two methods (e.g. norovirus-associated gastro-enteritis). For such diseases, using annual profiles may lead to very high estimates of disease burden. In this pilot study period profiles were used except for influenza (acute illness) for which only an annual profile was available.
The international transferability of severity weights is also a matter of concern. A study in Western Europe concluded that there was “a reasonably high level of agreement on disability weights in Western European countries with the VAS and TTO methods, but a lower level of agreement with the PTO method”.19 However, a recent study20 concluded that “Meaningful differences exist in directly elicited TTO valuations of EQ-5D health states between the United States and United Kingdom general populations”. Hence, severity weights are ideally based on specific elicitations for the population under study, but this may be very difficult to realise for the EU or even a specific country. In this study, internationally available severity weights were used (mainly from the Global Burden of Disease study, see Appendix IV).
2.6
Data and data analysis
The impact of infectious diseases on a society can be measured at different levels, often represented by the “iceberg” metaphor (see Figure 2.1). The impact of illness at different levels of the iceberg may differ greatly, as well as the availability of data. Therefore it is useful to separate these different levels in burden of disease studies. The degree of
underreporting varies greatly between diseases as well as between countries or even within one country in different periods. In this pilot only generally available data could be used and the study did not attempt to adjust for under-reporting.
Morbidity in the Community Mortality Hospital treatment (GPs) Morbidity in the community Morbidity (GPs) Sea level !! Hidden/Unreported burden
Figure 2.1 The “iceberg” of the burden of infectious diseases in society21
Depending on data availability, as many as possible member states of the European Union and EEA/EFTA countries (Appendix II) have been included as they are the focus of the activities of ECDC. To reduce the impact of short-term fluctuations, preferably a three-year period (2003-2005) was considered, depending on data availability. A period of three years instead of a period of five years has been chosen because HIV surveillance is recently implemented or modified in a considerable number of countries. Reported HIV-infections before 2003 may therefore include a considerable number of prevalent infections diagnosed in the past.22 Because of comparability for all diseases the period of 2003-2005 was used. To be able to calculate DALYs, data on mortality, incidence, duration and severity were broken down into different age and sex categories where possible.
Number of fatal cases
In this pilot reported mortality data of Eurostat/WHO over the period 2003-2004 have been used; 2005 was not yet available for many countries (mortality data were last updated in the first week of January 2007). The ICD-codes used for each of the diseases are described in Appendix IV. Mortality from infectious diseases is typically underreported in most routine surveillance systems. As YLL usually are an important component of the total disease burden, for some diseases the impact of underreporting was explored by scenario analysis. There was no information available about underlying causes of death.
Incidence of non-fatal health outcomes
Depending on the complexity of the outcome tree, the incidence had to be assessed for a varying number of non-fatal outcomes. Ideally, this task would involve the establishment of the incidence of one outcome at the root of the tree (e.g. acute gastro-enteritis) and the (conditional) probability of progressing to the next stage or to recovery. However, such data were not available for the complete trees and supplementary data were necessary. These included the direct use of surveillance data or special studies for the incidence of the specific outcomes. The incidence data should ideally also be differentiated according to different
levels of the iceberg: non-consulting cases, cases who consult a general practitioner and hospitalised cases. In this order, data availability may be expected to increase, but will
seldom be complete. An estimate of the degree of underreporting and of possible biases (from special studies) in the data is necessary. Such probabilities may be available from cohort or outbreak studies. Alternatively, the incidence may be calculated from independent
surveillance data or special projects in the incidence of the (late) outcome of concern, and the attributable fraction for the agent of concern. Note that these two approaches are only
equivalent in a stable situation, if this cannot be assumed, some kind of back-calculation should be applied.
Ideally, data are available for all relevant levels of the iceberg. In this pilot project, only surveillance data generally available from Eurostat (last update from the website in the first week of January 2007), EuroHIV (provided in October 2006), EuroTB (provided in March 2007) and EISS (based on annual reports) have been used. No information was available on the sensitivity of these surveillance systems for different levels of the iceberg, nor on the differences between countries. Data included all incident cases in a country in the chosen time period 2003-2005, including travel-related cases.
Duration and severity of non-fatal health outcomes
Duration of non-fatal health outcomes and severity weights have been derived from different publications, such as the Global Burden of Disease study,17,23 the Public Health Status and Forecast studies for the Netherlands,24 former experience at RIVM9 and review articles (see Appendix IV).
Data analysis
For each country and each disease the disease burden or Disability Adjusted Life Years (DALYs per year) have been calculated using spreadsheets. Data are presented from a societal perspective (DALYs per year per country and per 100,000 population per country) and from an individual perspective (DALYs per year per individual case).
If possible, the disease burden estimates in this pilot have been compared with estimates derived from more extensive studies:
• The Global Burden of Disease study conducted by WHO (data 2002; outcome approach): extensive study on disease burden in general (both non-infectious and infectious diseases) that includes estimates of duration and severity of different outcomes.25
• The Public Health Status and Forecast studies conducted by the RIVM for the Netherlands (data 2003; outcome approach): in this study the emphasis is on the impact of major diseases such as cardiovascular disease and cancer, however the disease burden of a number of infectious diseases has also been assessed.26
• More extensive studies on disease burden of foodborne pathogens conducted by the RIVM for the Netherlands (data 2004; agent approach): in this study campylobacteriosis, EHEC-infection, salmonellosis, noroviruses, rotaviruses, listeriosis and toxoplasmosis were included.9
Different types of uncertainty existed in the available data. These consisted of: • statistical uncertainty (small sample size)
• systematic uncertainty (representativeness) • lack of data
No formal uncertainty analysis was performed in this pilot project. Scenario analysis was employed to explore the impact of uncertain factors or assumptions in the calculations. Within the scope of this pilot, it was only possible to conduct a scenario analysis for the Netherlands. In addition, there is typically a large degree of variability in the model
parameters. Variability may reflect different courses of the disease in different individuals, seasonal or multi-annual differences in incidence, differences in the values attached by individuals to disease outcomes etcetera. This variability was not formally included in the project, and arithmetic mean values were used as point estimates.
3.
Limitations
For the baseline disease burden estimates a number of limitations regarding data availability and data quality were identified which should be kept in mind when interpreting the results of this pilot study. Some limitations were addressed by scenario analysis.
3.1
Data availability
Incidence
- Data on incidence of the acute illness were not available for all countries for all years -> YLD (and DALY) have not been calculated for those countries with no information at all
(see Table 3.1)
-> YLD was based on the mean incidence for countries with data available for 1, 2 or 3 years - Data on incidence of most of the complications were not available
(except for AIDS and multidrug-resistant tuberculosis)
-> The probability of most complications has been based on (Dutch) literature and previous experience at RIVM
Duration and severity weights
- For most diseases the incidence data were not age-specific (except for HIV-infection and tuberculosis)
-> For duration of chronic conditions (= remaining life expectancy) a proxy has been taken (e.g. for the measles outcome “deafness due to otitis media” full life expectancy was taken as a proxy because in general incidence of measles is highest in the youngest age groups) -> In case of age-specific severity weights a proxy has been taken
(e.g. for the measles outcome “deafness due to otitis media” the mean severity weight for the youngest age groups 00-04 year and 05-14 year has been taken)
- Not for all different outcomes of all diseases information on duration and severity weights was available
-> In case of lack of information a similar outcome has been chosen as a proxy
Mortality
- Data on mortality were not available for all countries
-> YLL (and DALY) have not been calculated for those countries (see Table 3.1)
Life expectancy
- There was no recent European life expectancy generally available -> A calculation based on Eurostat data for 2004 has been used (total mortality + average population 2004 of the EU-25 countries)
Table 3.1 Countries for which the disease burden could not be calculated
DATA influenza measles HIV-infection campylo-bacteriosis EHEC-infection salmonellosis tuberculosis NO YLD Cyprus Estonia Finland Greece Hungary Iceland Liechtenstein Malta Liechtenstein Cyprus Liechtenstein Spain Greece Liechtenstein Luxembourg Portugal Belgium France Italy Liechtenstein Luxembourg Portugal Liechtenstein Liechtenstein NO YLL Belgium Denmark Italy Liechtenstein Slovakia
HIV: Human Immunodeficiency Virus; EHEC: enterohaemorrhagic Escherichia coli
3.2
Data quality
Incidence
- There was no information on the sensitivity of the different surveillance systems (tip of the iceberg)
- There was no information on the case definition of incidence data from Eurostat
- Incidence data were not always available for whole countries (only for some regions within a country) and extrapolation was not possible
- There was no information on variation in complication rates between countries, a constant complication rate was assumed
- Incidence provided by Eurostat is not always identical to national incidence
Duration and severity weights
- The duration and severity weights have been derived from different literature sources, so there is no consistency in the used methodology
- There was no differentiation in duration and severity possibly related to need of medical care - There was no information on variation between countries
(for some outcomes GBD duration data differ between Established Market Economies, Formerly Socialist Economies and Middle Eastern Crescent)
- Duration and severity could not be based on recent literature which means that for example for HIV-infection HAART could not be taken into account
Mortality
- There was no specific information on the degree of underreporting for each of the diseases - Some countries report mortality in general but specific causes are missing
-> assumption of 0 deaths has been used
- For some countries there are differences in the number of reported deaths between Eurostat and WHO
4.
Influenza
Influenza is defined as an acute respiratory disease caused by influenza viruses (type A, B or C are recognized) which spreads via the respiratory route. Influenza is not only associated with increased general practice consultation rates, hospital admissions and excess deaths but also with increased days lost to absence (work or school).27
4.1
Outcome tree
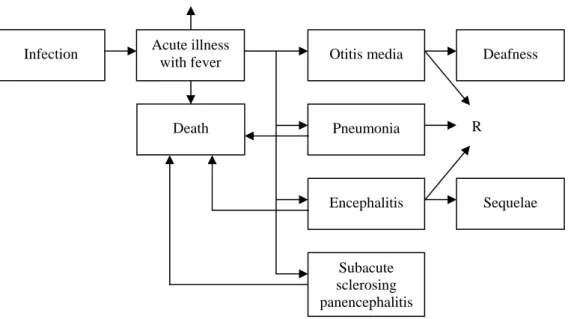
The outcome tree for influenza is presented in Figure 4.1. In approximately 50% of the cases the infection is subclinical.28 Influenza symptoms are abrupt onset of fever and chills,
accompanied by headache and sore throat, myalgia, malaise, anorexia and a dry cough.29 In uncomplicated influenza the fever usually lasts 2-5 days and healthy people recover within 1-2 weeks without sequelae.30 According to Meier et al. 9.5% of the influenza cases in the United Kingdom between 1991-1996 had clinical complications (respiratory tract, heart, central nervous system, kidneys or other) within 30 days after diagnosis and 0.2% of the cases died within 30 days after diagnosis.31 Most common complications of influenza are secondary bacterial infections, especially otitis media and pneumonia.28 These complications were therefore included in the outcome tree.
Figure 4.1 Outcome tree influenza (R=recovery)
The influenza vaccine is effective in reducing illness, hospitalization and mortality, albeit effectiveness varies by target group and season.32,33,34 Annual vaccination of groups with high risk is the major strategy for controlling influenza infections.35,36 The vaccination coverage among elderly in the European Union is known from only a limited number of countries and varies between 25% in Finland to 81% in the Netherlands, for other risk groups few data were available.37 Based on the number of doses of vaccine distributed in a country per 1,000 population, in 2000 vaccine use was lowest in Eastern Europe followed by the Scandinavian countries.38
R R
Acute illness
with fever Otitis media Deafness
Pneumonia Death
4.2
Baseline estimate of disease burden
Specific data sources and assumptions regarding mortality, incidence, duration and severity of the different outcomes in the outcome tree of influenza are described in Appendix IV (Table IV.1 and IV.8). Based on this information the YLD, YLL and DALY for influenza have been calculated (Table 4.1). The disease burden for influenza is mainly dominated by mortality, and the burden due to complications (otitis media including deafness and
pneumonia were taken into account) is considerably smaller than the burden due to the acute illness.
Table 4.1 Morbidity, mortality and disease burden (DALYs per year) for influenza
countries incidence YLD acute YLD compl. YLD total
deaths YLL DALY total DALY per case DALY per 100.000 Austria1 566 5.7 0.0 5.7 12 170.8 176.5 0.3 2.2 Belgium 874 8.7 0.0 8.8 - - - - -Cyprus4 - - - - 0 0.0 - - -Czech Republic 236 2.4 0.0 2.4 35 317.5 319.9 1.4 3.1 Denmark 117 1.2 0.0 1.2 - - - - -Estonia - - - - 1 2.0 - - -Finland - - - - 55 600.9 - - -France3 2,650 26.5 0.1 26.6 475 4,631.7 4,658.3 1.8 7.5 Germany 1,372 13.7 0.1 13.8 212 2,147.7 2,161.5 1.6 2.6 Greece - - - - 0 0.0 - - -Hungary - - - - 23 418.1 - - -Ireland 179 1.8 0.0 1.8 7 114.8 116.6 0.7 2.9 Italy 621 6.2 0.0 6.2 - - - - -Latvia 525 5.2 0.0 5.3 3 52.3 57.5 0.1 2.5 Lithuania 5 0.1 0.0 0.1 6 156.5 156.6 29.4 4.6 Luxembourg2 54 0.5 0.0 0.5 3 51.2 51.7 1.0 11.4 Malta - - - - 1 8.5 - - -Netherlands 400 4.0 0.0 4.0 150 1,292.8 1,296.8 3.2 8.0 Poland 39 0.4 0.0 0.4 84 922.8 923.2 23.5 2.4 Portugal 400 4.0 0.0 4.0 11 80.0 84.0 0.2 0.8 Slovakia 200 2.0 0.0 2.0 - - - - -Slovenia 146 1.5 0.0 1.5 3 16.5 18.0 0.1 0.9 Spain 570 5.7 0.0 5.7 135 925.7 931.4 1.6 2.2 Sweden1,3 1,667 16.7 0.1 16.7 79 630.9 647.7 0.4 7.2 United Kingdom 1,956 19.6 0.1 19.6 61 1,180.2 1,199.9 0.6 2.0 Iceland - - - - 2 10.5 - - -Liechtenstein - - - -Norway 566 5.7 0.0 5.7 36 290.8 296.4 0.5 6.5
Note incidence = mean # of respiratory specimens tested positive for influenza 2002/2003-2004/2005 (data EISS) mortality = mean # of deaths 2003-2004 (data Eurostat/WHO)
- = no data available
1
= incidence data 2004/2005 only
2
= incidence data 2003/2004 - 2004/2005 only
3
= mortality data 2003 only
4
= mortality data 2004 only
The disease burden is relatively high in the Scandinavian countries, the Netherlands, France and Luxembourg. In these countries the number of reported deaths due to influenza is relatively high. In the baseline estimate for disease burden the number of respiratory specimens tested positive for influenza reported to the European Influenza Surveillance Scheme (EISS) has been used as an estimate of the influenza incidence. However, usually the disease is self-limiting and diagnoses are generally not laboratory-confirmed. Therefore the true incidence of influenza is considerably higher than the reported incidence based on respiratory specimens tested positive for influenza. Table 4.1 also makes clear that based on laboratory data the incidence of influenza is substantially underestimated: in some countries (like for example Poland) the number of registered deaths due to influenza even exceeds the number of positive respiratory specimens.
In the baseline scenario reported influenza mortality has been used to estimate YLL.
However, research has shown that clinicians often attribute influenza-related deaths to a pre-existing underlying condition (for example pneumonia) rather than to influenza.39 Therefore, it is difficult to identify true mortality due to influenza. Some other estimates for both
incidence and mortality have been addressed in scenario analysis (section 4.3).
4.3
Scenario analysis
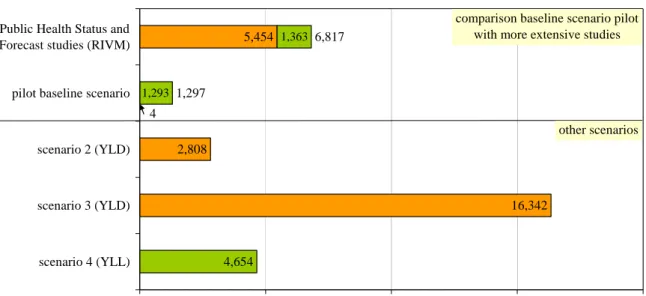
The incidence of influenza based on laboratory-confirmed data only (baseline scenario) is underestimated. Another indication that influenza morbidity was underestimated, is that the Public Health Status and Forecast studies estimated the Dutch morbidity for influenza in 2003 on 5,454 YLD26 compared to 4 YLD in this pilot (Figure 4.2). In the Dutch study, the incidence of non-fatal cases was estimated from the number of general practitioner visits because of influenza-like-illness (corrected for the part of patients that will not seek medical attention but not corrected for the fact that not all influenza-like-illness can be ascribed to influenza). Figure 4.2 also shows the results of a scenario analysis for the Netherlands. Scenario 2 and 3 provide other morbidity estimates while scenario 4 provides another mortality estimate.
In scenario 2 the mean number of general practitioner visits because of influenza-like-illness in the seasons 2003/2004 to 2005/200640 has been used as incidence estimate (n=260,655). This incidence has been corrected for the assumption that only 30% of the influenza patients in the Netherlands will visit their general practitioner24 and only 32,2% of the influenza-like-illnesses in the Netherlands can be ascribed to influenza41 (based on laboratory confirmation for the influenza season 2005/2006). For the Netherlands the influenza incidence in this scenario was 279,770 cases per year (compared to 400 in the baseline scenario). This has a considerable impact on the morbidity estimate that changes from 4 YLD in the baseline scenario to 2,808 YLD in scenario 2.
In England and Wales approximately 800,000 GP consultations for respiratory illnesses each year are attributed to influenza,42 this incidence would result in 8,030 YLD compared to 20 YLD for the United Kingdom in the baseline scenario.
5,454 2,808 16,342 4,654 6,817 1,297 4 1,293 1,363 0 5,000 10,000 15,000 20,000
Public Health Status and Forecast studies (RIVM)
pilot baseline scenario
scenario 2 (YLD)
scenario 3 (YLD)
scenario 4 (YLL)
Disease burden (DALYs per year)
YLD YLL
comparison baseline scenario pilot with more extensive studies
other scenarios
Figure 4.2 Scenario analysis influenza for the Netherlands
In scenario 3 the incidence was based on the assumption that the clinical attack rate of influenza during epidemics ranges from 10-20% in the general community.43 In this scenario the lowest estimate of 10% has been used because in half of the cases the infection is
subclinical. For the Netherlands the influenza incidence in scenario 3 was 1,628,178 cases per year (compared to 279,770 in scenario 2), the YLD estimate changes to 16,342. For the Netherlands the incidence in scenario 3 seems to be too high because it is considerably higher when comparing to scenario 2 which is probably closest to reality (based on sentinel data). For the Netherlands Sprenger et al. estimated that in the period 1967-1989 the overall impact of influenza on mortality was greater than registered mortality by a factor of 3.6.44 In
scenario 4 the registered mortality in all age classes was therefore multiplied by 3.6, which resulted in a mortality estimate of 4,654 (compared to 1,293 in the baseline scenario). The number of deaths could have been overestimated this way because the influenza virus seems to be less virulent in the last years41 and today vaccination coverage is considerably higher than in the period 1967-1989. Furthermore, YLL was probably overestimated because it is likely that people dying from influenza have un underlying disease and therefore a lower life expectancy. In the study of Sprenger et al. almost half of the non-registered influenza deaths were registered as deaths from heart disease, approximately 25% from lung disease and approximately 30% from other diseases.44
4.4
Discussion and recommendations
Based on scenarios 2 (YLD) and 4 (YLL) combined, the Dutch disease burden of influenza may have been underestimated in the baseline scenario by a factor of at least five. It is likely that the burden was also underestimated for other countries. The number of respiratory specimens tested positive for influenza is not suitable as incidence indicator for disease burden calculations, because testing is not general practice (this applies for all the selected diseases but for influenza in particular). Future morbidity estimates need to concentrate on scenario 2. EISS collects data on general practitioner visits because of influenza-like-illness in different countries. Besides the wide range of national case definitions, estimated
consultation rates may differ between countries due to differences in consultation behaviour, estimation procedure, vaccination coverage and obligatory doctor visits for absence from work or school.45,46 The fraction of patients that visits their general practitioner and the proportion of influenza-like-illness that can be ascribed to influenza need to be determined for each of the countries.
An alternative mortality estimate could be the excess all-cause mortality during periods of high circulation of influenza,39,47 like the Dutch example in scenario 4. According to Armstrong et al. in people aged over 75 years the proportion of deaths attributable to influenza during periods of influenza for all cause mortality was 13,4% in unvaccinated people and 2.2% in vaccinated people.48
5.
Measles
Worldwide measles is still an important cause of death among children below five years old and measles is the leading cause of vaccine preventable deaths in children.28,49 In many industrialized countries measles is now a rare disease but outbreaks still occur. Measles is one of the most contagious infectious diseases. The immunity degree of the population needed to prevent epidemic spread is very high, probably over 95%, which has not yet been achieved in all European countries. WHO aims to eliminate measles in the European region by 2010.50,51 According to the surveillance Community Network for Vaccine Preventable Infectious Diseases 82% of the reported measles cases with a known vaccination status occurred in unvaccinated children.52 Measles is caused by a respiratory virus (a morbillivirus) and spreads through direct contact.28
5.1
Outcome tree
The outcome tree for measles is shown in Figure 5.1. Measles starts with high fever,
coughing, runny nose, red eyes and small white spots inside the cheeks (Koplik spots). After several days a red rash develops (usually on the face and upper neck).53,50 Most important complications of measles are otitis media (5-10% of the cases), pneumonia (1-5% of the cases) and encephalitis (0.1% of the cases). A very rare complication is subacute sclerosing panencephalitis (SSPE), caused by persistent infection with measles virus, with nerves and brain tissue degeneration.28 In children who previously had natural measles the risk of developing SSPE is between 0.6 and 2.2 per 100,000 measles infections.54
Figure 5.1 Outcome tree measles (R=recovery)
R R
Acute illness
with fever Otitis media Deafness
Pneumonia Death Encephalitis Infection Subacute sclerosing panencephalitis Sequelae
countries incidence YLD acute YLD compl. YLD total
deaths YLL DALY total DALY per case DALY per 100.000 Austria 41 0.2 0.3 0.5 4 187.3 187.9 4.6 2.3 Belgium 44 0.3 0.3 0.6 - - - - -Cyprus3 0 0.0 0.0 0.0 0 0.0 0.0 0.0 0.0 Czech Republic 16 0.1 0.1 0.2 0 0.0 0.2 0.0 0.0 Denmark 1 0.0 0.0 0.0 - - - - -Estonia 1 0.0 0.0 0.0 0 0.0 0.0 0.0 0.0 Finland 0 0.0 0.0 0.0 0 0.0 0.0 0.0 0.0 France1,2 7,454 45.4 53.0 98.4 4 247.1 345.5 0.0 0.6 Germany 560 3.4 4.0 7.4 5 227.0 234.4 0.4 0.3 Greece 43 0.3 0.3 0.6 0 0.0 0.6 0.0 0.0 Hungary 1 0.0 0.0 0.0 0 0.0 0.0 0.0 0.0 Ireland 333 2.0 2.4 4.4 1 30.9 35.3 0.1 0.9 Italy 4,293 26.2 30.5 56.7 - - - - -Latvia 0 0.0 0.0 0.0 0 0.0 0.0 - 0.0 Lithuania 1 0.0 0.0 0.0 0 0.0 0.0 0.0 0.0 Luxembourg 0 0.0 0.0 0.0 0 0.0 0.0 0.0 0.0 Malta 1 0.0 0.0 0.0 1 26.0 26.0 19.5 6.5 Netherlands 6 0.0 0.0 0.1 1 21.2 21.3 3.5 0.1 Poland 24 0.1 0.2 0.3 1 38.2 38.5 1.6 0.1 Portugal 5 0.0 0.0 0.1 4 227.5 227.6 42.7 2.2 Slovakia 1 0.0 0.0 0.0 - - - - -Slovenia 0 0.0 0.0 0.0 0 0.0 0.0 - 0.0 Spain 98 0.6 0.7 1.3 3 115.8 117.1 1.2 0.3 Sweden2 7 0.0 0.0 0.1 0 0.0 0.1 0.0 0.0 United Kingdom 245 1.5 1.7 3.2 5 237.5 240.7 1.0 0.4 Iceland 0 0.0 0.0 0.0 0 0.0 0.0 - 0.0 Liechtenstein - - - -Norway 5 0.0 0.0 0.1 1 35.8 35.9 7.2 0.8
Note incidence = mean # of cases 2003-2005 (data Eurostat) mortality = mean # of deaths 2003-2004 (data Eurostat/WHO)
- = no data available
1
= incidence data 2003-2004 only
2
= mortality data 2003 only
3
= mortality data 2004 only
Morbidity Mortality DALY per year
5.2
Baseline estimate of disease burden
Specific data sources and assumptions regarding mortality, incidence, duration and severity of the different outcomes in the outcome tree of measles are described in Appendix IV
(Table IV.2 and IV.8). Based on this information the YLD, YLL and DALY for measles have been calculated (Table 5.1). Except for countries with a relatively high number of measles cases and therefore morbidity (especially France and Italy), the disease burden for measles is mainly dominated by mortality. Unfortunately, Italy is one of the countries where mortality data were not generally available. In the countries Portugal, Malta, Norway, Austria and the Netherlands the number of reported deaths is relatively high compared to the number of reported measles cases, while the number of deaths in France seems to be relatively low. Table 5.1 Morbidity, mortality and disease burden (DALYs per year) for measles
The incidence of measles based on reported cases may be underestimated because many persons do not seek medical attention,55 however no alternative estimates were available. In scenario analysis the effect of an outbreak on the disease burden estimate have been studied (section 5.3).
5.3
Scenario analysis
There are considerable differences between disease burden estimates of the pilot baseline scenario and the Global Burden of Disease study (2002) (Figure 5.2). The differences between both estimates are mainly caused by differences in mortality and may be a random effect. Since measles mortality is rare, only one death more or less will have a considerable impact on disease burden (for example in the GBD estimate for the Netherlands the number of deaths in 2002 was 0, in the pilot there was 1 reported death in the period 2003-2004).
15 9 0 7 0 106 107 3 33 116 12 20 0 0 5 284 236 0 29 17 53 0 1 188 0 0 0 0 345 234 1 0 35 0 0 0 26 21 39 228 0 117 0 241 0 36 0 50 100 150 200 250 300 350 Austria Cyprus Czech Republic Estonia Finland France Germany Greece Hungary Ireland Latvia Lithuania Luxembourg Malta Netherlands Poland Portugal Slovenia Spain Sweden United Kingdom Iceland Norway
Disease burden (DALYs per year) Global Burden of Disease study pilot baseline scenario