Natural air supply systems for achieving good air quality
Kennisbank Bouwfysica
Auteur: dr. ir. Peter van den Engel
1 Introduction
In order to supply fresh air in a room there are basically two options: Natural or mechanical air supply. Natural air supply is only possible, if the outdoor conditions are favourable enough. If the outdoor temperature is lower than ca 0 to -10oC air has to be preheated, depending on the type of air supply. Thesystems of natural air supply are generally different for the heating and cooling season, but can be integrated in a façade. Natural ventilation is most effective with windows that can be opened, but windows cannot always be used in the heating period. Venti-lation with windows will be discussed in another module. The period during whichthose win-dows can be opened depends on the type and position of the window and the local climatic conditions (>15oC, moderate windvelocity or lower). Integrated in a second skin façade it is possible to use these windows during more than half of the year.
The focus of this module is on that flow of natural air supply which is necessary to maintain the required minimal level of air quality during the whole year, usually between 10 – 30 l/s (36 – 108 m3/h) per meter façade.
Especially in the heating season draught prevention needs much attention. This attention is already needed in the early stage of the design process. Natural air supply can be combined with either natural or mechanical exhaust. In order to reduce fan energy, mechanical systems are ideally only in operation when natural forces are insufficient to maintain air quality.
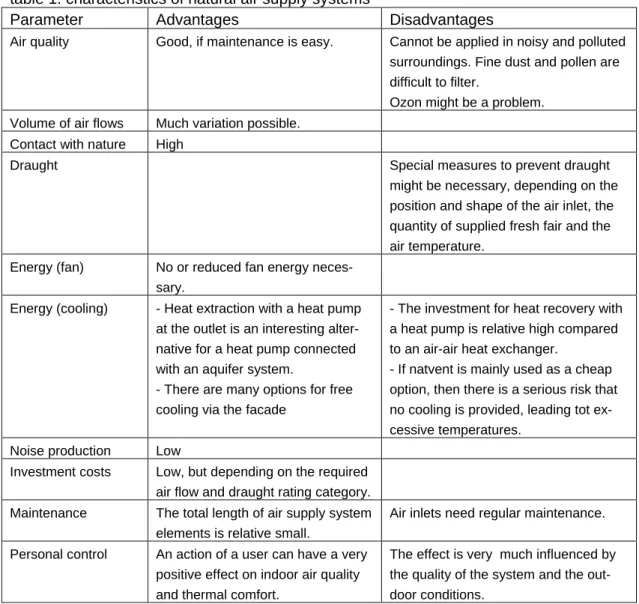
Some advantages and disadvantages of natural air supply systems compared to mechanical air supply are:
table 1. characteristics of natural air supply systems
Parameter Advantages Disadvantages
Air quality Good, if maintenance is easy. Cannot be applied in noisy and polluted surroundings. Fine dust and pollen are difficult to filter.
Ozon might be a problem. Volume of air flows Much variation possible.
Contact with nature High
Draught Special measures to prevent draught
might be necessary, depending on the position and shape of the air inlet, the quantity of supplied fresh fair and the air temperature.
Energy (fan) No or reduced fan energy neces-sary.
Energy (cooling) - Heat extraction with a heat pump at the outlet is an interesting alter-native for a heat pump connected with an aquifer system.
- There are many options for free cooling via the facade
- The investment for heat recovery with a heat pump is relative high compared to an air-air heat exchanger.
- If natvent is mainly used as a cheap option, then there is a serious risk that no cooling is provided, leading tot ex-cessive temperatures.
Noise production Low
Investment costs Low, but depending on the required air flow and draught rating category. Maintenance The total length of air supply system
elements is relative small.
Air inlets need regular maintenance.
Personal control An action of a user can have a very positive effect on indoor air quality and thermal comfort.
The effect is very much influenced by the quality of the system and the out-door conditions.
2 System requirements Air quality
In order to ensure good air quality, a separate air inlet and outlet are necessary. This requires a negative pressure at the outlet. Short-circuiting between inlet and outlet should be prevented at the outside orat the inside of a room.
inlet outlet
negative pressure
Figure 1: Diagram of an air inlet and outlet system in a room
The amount of fresh air that should be supplied depends on the occupancy of a room and the required air quality standard:
The CO2-level is a good general indicator of air quality and should be kept under 1200 ppm,
where levels under 600 – 1000 ppm are recommended. With windows that can be opened, CO2-levels under 600 ppm are possible, at an typical outdoor concentration of 350 ppm. With
displacement ventilation (1) it is possible to realize lower CO2-levels with less fresh air supply
per person than with mixing ventilation. Fresh air supply via the façade can in most cases be considered as a mixing type of ventilation.
The CO2-levels can be calculated with the following equation (2):
)
1
(
)
(
)
0
(
)
(
sup V t q v m V t q IDA IDA v ve
q
q
C
e
C
t
C
=
⋅
−+
+
⋅
−
− (1) where:cIDA(t) = concentration in the room at time t [ppm]
cIDA(0) = concentration in the room in the beginning (t=0) [ppm]
csup = concentration in the supplied air [ppm]
qv = mass flow of the supplied air [m3s-1]
qm = mass flow of the emission (CO2) in the room [m3 s-1 *1000000]
V = volume of the air in the room [m3]
t = time [s]
)
1
(
)
(
)
(
sup V t q v m IDA ve
q
q
C
t
C
=
+
⋅
−
− (2)With this equation the following CO2-concentrations (CIDA = 0) have been calculated (table 2):
- Csup = outdoor CO2-concentration = 350 ppm
- qm = 0.020 m3/h CO2 per student
- qv = 0.0064 – 0.0222 m3/s per student
- t = 3600 s
- volume classroom V = 150 m3 with 25 students = 6 m3 per student - mixing type of ventilation
table 2. CO2-levels and fresh air supply per student
CO2-level 1201 ppm 991 ppm 804 ppm 600 ppm
Fresh air supply per person 6.4 l/s 8.6 l/s 12.2 l/s 22.2 l/s
Draught
What is draught?
The feeling of draught can be influenced by many parameters. Usually draught is produced by high air velocity combined with high air turbulence and a moderate or low operative tempera-ture. The lower the temperature, the easier draught will occur. In order to be able to evaluate this it is possible give a prediction of local thermal discomfort with the Draught Rating ap-proach.
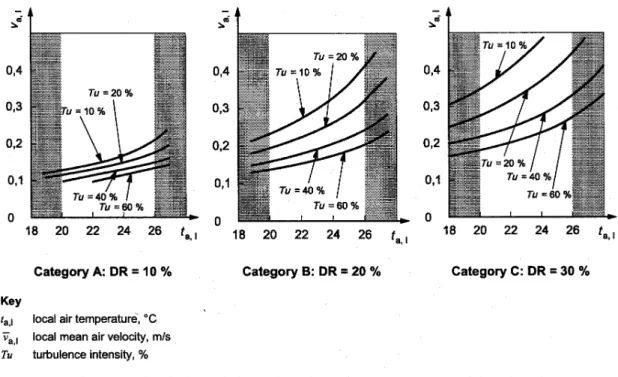
With measurements and simulations the amount of people that will be dissatisfied with thermal comfort can be predicted. In the NEN-EN-ISO 7730 (3) there are three categories:
A. maximal 10 % dissatisfied users B. maximal 20% dissatisfied users C. maximal 30% dissatisfied users The following equation can be used:
(
34
)(
0
.
05
) (
0
.
37
,3
.
14
)
62 . 0 , ,−
⋅
⋅
+
−
=
t
v
v
Tu
DR
al al al (3)- ta,l is the local air temperature in degrees Celsius, between 20 and 26oC
- va,l is the local mean air velocity in metres per second, < 0,5 m/s
- Tu is the local turbulence intensity, in percent, between 10 and 60%, if unknown 40% may be used
- For va,l < 0.05 m/s, use 0.05 m/s
Figure 2: Relation between air velocity, turbulence intensity and air temperature and draught rating category Draught ratings are usually measured at 0.1 m (near the feet) and 1.1 m (neck height of a sit-ting person) above the floor.
The risk of draught depends on the amount of fresh air that has to be supplied per m2. In houses, the occupancy is usually low, for instance 1 person per 20 m2. In schools, the occupancy is high, for instance 1 person per 2 m2.
table 3. Some typical occupancy levels related to different functions.
Function House Office School Theatre, cafe m2 per
person
15 – 35 6.5 – 20 1.3 – 4 0.5 – 3
Draught prevention
In order to prevent draught there are several rules of thumb:
- limit the amount of fresh supplied air to 10 l/s per m air inlet
- choose the position of the air inlet as high as possible, at least at 1.80 m above the floor
- when a radiator or convector is applied under a window, it is easier to compensate downdraught due to fresh and cold air supply
- when more than 10 – 15 l/s m has to be supplied, special measures are necessary
best position exhaust: promote circulation prevent short-circuiting prevent draught
Figure 3: Air supply above a false ceiling in order to prevent draught. The position of the outlet needs attention as well in order to prevent short-circuiting of air flows.
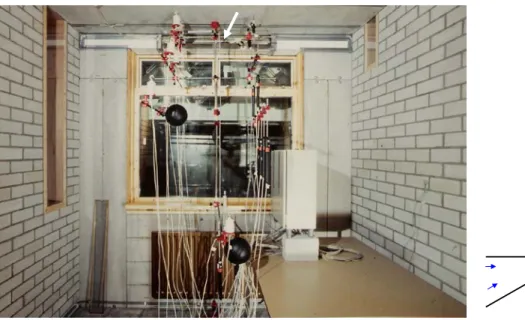
Figure 4: Option of air supply without draught (DR < 20%) with an air inlet just beneath the ceiling (in the pic-ture the white arrow in the back of the room) . With an air inlet element length = 1 m, height = 20 mm > 45 l/s, 0oC per m can be supplied. In order to have a low air resistance it is recommended to make use of a venturi shape of the air inlet. The picture is from a test chamber at the Delft University of Technology (4), with meas-urement equipment for velocity and turbulence, temperature, etc. The air supply makes use of the venturi principle (shown at the right of the picture, not shown in the picture itself).
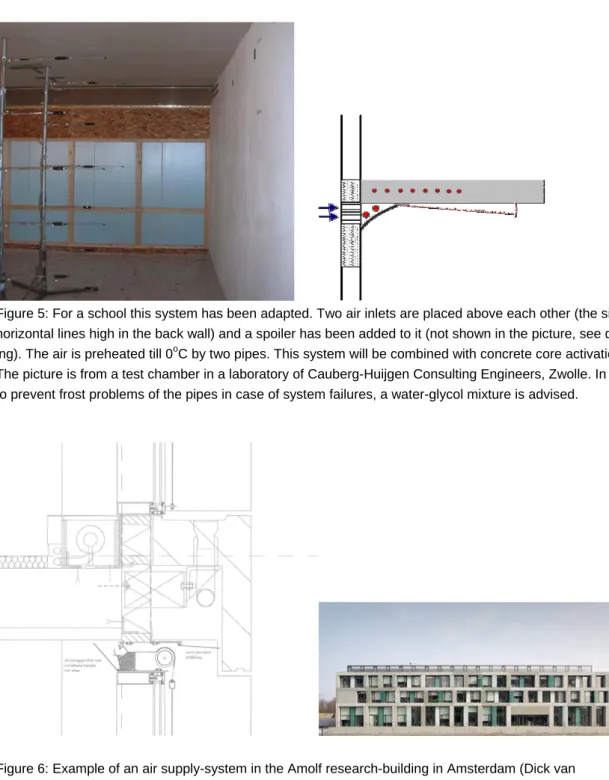
Figure 5: For a school this system has been adapted. Two air inlets are placed above each other (the silverish horizontal lines high in the back wall) and a spoiler has been added to it (not shown in the picture, see draw-ing). The air is preheated till 0oC by two pipes. This system will be combined with concrete core activation. The picture is from a test chamber in a laboratory of Cauberg-Huijgen Consulting Engineers, Zwolle. In order to prevent frost problems of the pipes in case of system failures, a water-glycol mixture is advised.
Figure 6: Example of an air supply-system in the Amolf research-building in Amsterdam (Dick van
Gameren/De Architectengroep) with little draught risk. The air supply is protected and hidden by a concrete façade-element and is equipped with a self regulating valve as well. A convector provides better local comfort and will prevent downdraught as well. The system can be combined with concrete core activation.
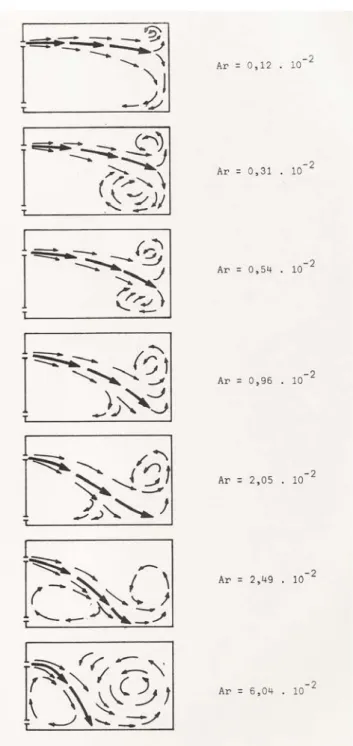
The draught-preventing qualities of the air inlet can be checked by calculating the Archimedes number of the air inlet , with the following equation the deflection of the jet can be character-ized. Ideally the value of this number should be below 0.001.
2
.
.
.
v
h
g
Ar
=
β ∆
θ
(4) g = acceleration of gravity m/s2h = height or diameter of the inlet m
B = cubic expansion = 1/273.15 1/K
∆θ = temperature difference between jet and room air K
v = velocity of supply air m/s
The higher the Archimedes number is, the higher the deflection of the jet will be.
Coanda-effect
It is very difficult to predict the length of the air jet along the ceiling in case of natural air sup-ply. “Classical” jet equations (5) cannot be used. The airflow volume of the jet is relative small compared to the effect of resistance of the surrounding air. With air flow (CFD) simulations a prediction of thermal comfort is possible, but measurements are still necessary to check and develop these simulations and to evaluate thermal comfort. Usually, the length of the throw (jet) will become √2 larger due to the coanda-effect. When the position of the air inlet is just near the ceiling and the air volume (>20 dm3/sm) and air velocity is high enough (> ca 1,5 m/s) the air flow will “cling” to the ceiling. This is called the coanda-effect.
In order to understand the fact that the coanda-effect is a consequence of an air flow near a surface it is important to know the mechanical energy balance and the Bernouilli equation (6).
const
p
h
g
v
p
h
g
v
+
+
=
+
+
=
ρ
ρ
2 2 2 2 1 1 2 1.
1
/
2
.
.
.
2
/
1
(4) where v = air velocity m/sp = static absolute pressure Pa
g = gravitational acceleration m/s2
h = height of the airflow above reference level (usually ground level) m
ρ = volumetric mass of air kg/m3
The term g.h is only important when there are temperature differences in then air (chimney-effect). When there are little or no temperature differences and little or no difference in refenence height this term can be neglected for gas flows like air flows. This is due to the fact that the density of the air in the atmosphere decreases when the air flows from a low to a high point and increases in the opposite direction. However, for liquids like water, it is a very im-portant parameter (waterfall-effect). Neglecting this term for ir the Bernouilli equation for air is:
2 2 2 1 2 1
1
/
2
.
.
.
.
2
/
1
ρ
v
+
p
=
ρ
v
+
p
(5)When the velocity decreases, the pressure will increase. Air jets will induce surrounding air and this will reduce the velocity (more resistance) and the static surrounding pressure will be-come higher. When there is little air to induce, near a surface, the air velocity will remain high-er than at a side whhigh-ere thhigh-ere is much air to induce, so the pressure at the upphigh-er side will be-come lower, this is called the coanda-effect.
However, the closer the air inlet is near the ceiling, the longer the flow will “cling” to the ceiling (fewer eddies, less turbulence).
P = low
P = high P = high
Figure 8: Illustration of the coanda-effect
Pressure difference and air flow
In order to make it possible to make use of natural pressure differences and to reduce fan energy a low resistance of the air inlet is recommended.
The maximum air velocity related to minimum height of the air inlet can be evaluated with the following equation, which can be derived from Bernouilli's equation:
ρ
P
v
=
2
∆
(6)v = velocity of supply air m/s
∆P = pressure difference over the inlet Pa
ρ = volume mass of air kg/m3
When the air velocity of the inlet is lower than 50% of the maximum value the aerodynamic properties of the inlet should be improved.
Maintenance
One of the advantages of natural air supply is that the supply system has a small surface compared to an air supply system with ducts, however there are generally no filters integrated. For all the elements cleaning should be easy to do in order to keep the hygienic standard as high as possible.
3. Literature
1. REHVA. Displacement ventilation in non industrial premises. 2002.
2. NEN-EN 13779. Ventilation for non-residential buildings - Performance requirements for ventilation and room-conditioning systems. September 2004.
3. NEN-EN-ISO 7730. Ergonomics of the thermal environment. Analytical determination and interpretation of thermal comfort using calculation of the PMV and PPD indices and local comfort criteria. 15-11-2005.
4. Engel PJW van den. Inducing vents and their influence on thermal comfort and air quality. TU-Delft, 1995.
5. Müllejans H. Uber die Ahnlichkeit der nicht-isothermen Strömung und den Wärmeubergängen in Raumen mit Strahllüftung. 1966.
6. Van den Akker H.E.A. van den. Mudde R.F. Fysische transportverschijnselen I. Delftse Universitaire Pers/VSSD. 1996.