CONCENTRIC ISOKINETIC QUADRICEPS AND HAMSTRING
PROFILE IN ELITE U21 HOCKEY PLAYERS
A prospective study related to lower limb injuries
Arno Meiresonne
(01503384)
Hannes Meirezonne
(01502781)
Jarno Moens
(01501993)
Supervisor: Prof. dr. Damien Van Tiggelen
A dissertation submitted to Ghent University in partial fulfilment of the requirements for the degree of Master of science in Rehabilitation Sciences and Physiotherapy.
ACKNOWLEDGEMENT
We would like to take this opportunity to express our gratitude to some important people without whom this study would not be possible. First of all we would like to thank Prof. dr. Damien Van Tiggelen for guiding and supporting us through this process. Also much gratitude goes out to dr. Joke Schuermans, who made the SPM graphs and analysis used in this study. And of course an appreciation is certainly in order for Ghent University for letting us use their facilities and equipment during the testing phase of this study.
A special thanks goes out to the female and male hockey players of the U21 national teams who participated in this study. Thank you for making time, coming to Ghent and giving it all during the test protocol.
Last but not least, we would like to thank our family, friends and partners for your continuing support and motivation. Some of them reviewed our thesis and gave feedback where necessary, helping us to strive for the best possible.
INDEX
List of tables, figures and pictures: ... 6
List of abbreviations: ... 7
The study: ... 8
Abstract and key words: ... 8
English ... 8 Nederlands ... 10 Introduction: ... 12 Methodology: ... 15 Participants ... 15 Testing procedure ... 15 Injuries ... 17 Statistical analysis ... 17 Results: ... 18
Part one: left and right legs ... 18
Part two: angular velocities ... 22
Part three: sexes ... 28
Part four: injuries ... 31
Part five: SPM ... 33
Discussion: ... 34
SPM ... 34
Injuries ... 34
Sport-specificity and differences in both sides ... 35
Different angular velocities ... 37
Differences between sexes ... 38
Strengths and limitations ... 39
Conclusion: ... 41
References: ... 43
Abstract in lekentaal: ... 47
Ethical approval: ... 48
List of tables, figures and pictures:
Table 1: Overview of the testing procedure
Table 2: Comparison between the left and right legs in the female population Table 3: Comparison between the left and right legs in the male population
Table 4: Comparison between the different angular velocities in the female population (APT Q and APT H)
Table 5: Comparison between the different angular velocities in the male population (APT Q and APT H)
Table 6: Comparison between the different angular velocities in the female population (HQRc, H/PTQ and PTH/Q)
Table 7: Comparison between the different angular velocities in the male population (HQRc, H/PTQ and PTH/Q)
Table 8: Comparison between the male and female population (APT Q and APT H)
Table 9: Comparison between the male and female population (HQRc, H/PTQ and PTH/Q) Table 10: Descriptive statistics of the only significant difference between non-injured and injured legs in women.
Table 11: Binary logistic regression
Figure 1: Chart to clarify the parameters Figure 2: The angle-specific HQR at 60°/s Figure 3: The angle-specific HQR at 240°/s
Picture 1: Test set-up
List of abbreviations:
These abbreviations were used in the study: APT = angle of peak torque
APT Q = angle of peak torque quadriceps (angle where peak torque quadriceps is reached) APT H = angle of peak torque hamstrings (angle where peak torque hamstrings is reached) AST = angle-specific torque
AV = angular velocity cm = centimeter
COD = change of direction
HQRc = conventional hamstrings/quadriceps ratio Hecc/Qconc = the eccentric HQR
H/PTQ = hamstring torque at APT Q / PTQ ratio kg = kilogram
PT = peak torque
PTQ = peak torque quadriceps PTH = peak torque hamstrings
PTH/Q = PTH / quadriceps torque at APT H ratio ROM = range of motion
s = seconds
SD = standard deviation U21 = under-21 years W = watt
8
The study:
Abstract and key words:
English
Background and objectives: Despite numerous studies, validity and interpretation of
isokinetic parameters on prevention and performance is still questioned. The present study investigated the isokinetic profile of hockey players: possible differences between both legs (is this due to sport-specific biomechanical characteristics?), different angular velocities (AV) and sexes. The possible predictive value of isokinetic parameters in relation to future injuries was also investigated.
Investigated parameters included were: peak torque quadriceps (PTQ), peak torque hamstrings (PTH), angle of peak torque quadriceps (APT Q), angle of peak torque hamstrings (APT H), conventional hamstrings/quadriceps ratio (HQRc), hamstring torque at APT Q / PTQ ratio (H/PTQ), PTH / quadriceps torque at APT H ratio (PTH/Q).
Study design: A prospective cohort study.
Methods: Forty-eight hockey players of the U21 national teams were evaluated using an
isokinetic dynamometer (Biodex 4). Twenty-seven of them were males with mean age 18.6 years (±0.62), and twenty-one participants were females, mean age 19.0 years (±0.94). Testing included concentric contractions of the knee extensor and flexor muscles at respectively 180°/s (5 repetitions), 60°/s (3 repetitions) and 240°/s (5 repetitions). Range of motion (ROM) was set at 0°- 90° of flexion. SPSS Statistics 25 was used to analyse of the testing data and Statistical Parametric Mapping (SPM) was used to investigate the angle-specific HQR during the entire ROM.
All subjects were asked to report their injuries until 15 weeks after testing.
Results: Between both legs, only the APT Q in men at 60°/s and 240°/s was significant
different. The APT was reached in greater flexion angles for APT Q and in greater extension angles for APT H at 60°/s than at 240°/s and 180°/s. HQRc increased at higher AV, similar results are found for H/PTQ. While the PTH/Q had almost never significant differences between 60°/s and 240°/s. The HQRc and H/PTQ are higher in the male population compared to the female population, although these results were not significant. In the male population, both APT (Q and H) are reached in greater knee flexion. When analysing the angle-specific HQR, there is a significant difference between males and females in the mid-ROM at 60°/s. It’s important to note that this significant difference could not be seen at 240°/s. Hamstring injuries were overall the most common. Only among women, a significant difference was found between future injured and non-injured legs. The APT H is reached in significantly greater knee flexion angles in injured legs than in non-injured legs at 60°/s.
9
Conclusion:
All sports have their own biomechanical profile, which influences the parameters. So authors should be careful when generalizing the parameters to other sports. Training the hamstring in the more distal part of the movement to shift the APT H more towards full extension could be proposed to protect against hamstring injuries. Further investigation should be conducted to decide whether these findings can be generalized in hockey players or in other sports (with similar biomechanics).
10
Nederlands
Achtergrond en doelstellingen: Ondanks vele studies is er nog steeds geen volledige
consensus over de validiteit en de interpretatie van isokinetische parameters m.b.t. preventie en prestatievermogen. Deze studie onderzoekt volgende zaken in het isokinetisch profiel van hockey spelers: mogelijke links-rechts verschillen (als gevolg van het sportspecifieke, biomechanische karakter van de sport?), evolutie van parameters op verschillende hoeksnelheden en verschillen tussen de geslachten. Ook het voorspellend karakter van de parameters in functie van toekomstige blessures werd onderzocht. Volgende parameters werden opgenomen in deze studie: peak torque quadriceps (PTQ), peak torque hamstrings (PTH), angle of peak torque quadriceps (APT Q), angle of peak torque hamstrings (APT H), conventional hamstrings/quadriceps ratio (HQRc), hamstring torque at APT Q / PTQ ratio (H/PTQ), PTH / quadriceps torque at APT H ratio (PTH/Q).
Onderzoeksdesign: Een prospectieve cohortstudie.
Methode: 48 spe(e)l(st)ers van het Belgische nationale U21 hockeyteam werden getest
a.d.h.v. een isokinetische dynamometer (Biodex 4), waaronder 27 mannen met een gemiddelde leeftijd van 18.6 jaar (±0.62), en 21 vrouwen, gemiddelde leeftijd 19.0 jaar (±0.94). Knieflexoren en -extensoren werden concentrisch getest op respectievelijk 180°/s (5 herhalingen), 60°/s (3 herhalingen) and 240°/s (5 herhalingen). Range of motion (ROM) werd ingesteld op 0°- 90° flexie. Voor analyse van de test data werd gebruik gemaakt van SPSS Statistics 25 en Statistical Parametric Mapping (SPM) werd gebruikt om de hoek-specifieke HQR tijdens de volledige ROM te bekijken.
Resultaten: Enkel de APT Q bij de mannen op 60°/s en 240°/s waren significant verschillend
tussen links en rechts. De APT Q werd meer naar flexie bereikt en de APT H meer naar extensie op 60°/s in vergelijking met 240°/s en 180°/s. Waardes van de HQRc stegen bij hogere AV, gelijkaardige resultaten werden gezien voor de H/PTQ. In tegenstelling tot de PTH/Q welke bijna nooit significante verschillen vertoonde tussen 60°/s en 240°/s. De HQRc en H/PTQ waren hoger bij mannen dan bij vrouwen, desalniettemin waren deze resultaten niet significant. Zowel de APT (Q en H) werden meer naar flexie bereikt in de mannelijke populatie. Wanneer de hoek specifieke HQR geanalyseerd werd, kon mid-range een significant verschil gezien worden tussen mannen en vrouwen op 60°/s, maar niet op 240°/s. Hamstringblessures waren de meest voorkomende in deze studie. Enkel bij vrouwen werd een significant verschil vastgesteld tussen toekomstig geblesseerde en niet-geblesseerde spelers, de APT H werd namelijk bereikt in significant grotere knieflexie hoeken bij toekomstig geblesseerde spelers op 60°/s.
11
Conclusie: Alle sporten hebben hun eigen biomechanisch profiel, wat de parameters
beïnvloedt. Auteurs moeten dus voorzichtig zijn met het veralgemenen van de parameters naar andere sporten. Het trainen van de hamstring in de meer distale baan van de beweging om de APT H meer in de richting van volledige extensie te verschuiven zou kunnen worden voorgesteld om de hamstring te beschermen tegen blessures. Verder onderzoek moet worden gedaan om te kunnen besluiten of deze bevindingen kunnen worden veralgemeend in hockeyspelers of in andere sporten (met gelijkaardige biomechanica).
Kernwoorden: Isokinetisch onderzoek, onderste lidmaat, veldhockey, blessures,
12
Introduction:
Over the last decades, a growing interest for performance-orientated research is seen within the community of professional field hockey. Agility, speed and acceleration are the most important physical elements of the sport (Bartolomei et al., 2019 and Polglaze et al., 2015). Since the popularity and numbers of participants has increased, the level of performance in Belgian hockey evolved throughout the years. Because of this evolution, coaches and staff are seeking for marginal gains that they hope to find in new parameters that could influence performance. Isokinetic testing provides the opportunity to explore different parameters that may have an influence on performance and injury prevention (Kim D et al., 2011). HQRc (conventional hamstrings/quadriceps ratio), which is the concentric peak torque hamstrings / concentric peak torque quadriceps ratio, is supposed to be a relevant parameter and is been analysed in different studies (Impellizzeri et al., 2008 and Sole et al., 2007). These studies mostly used different populations and protocols (angular velocity (AV), range of motion (ROM), etc). Therefore it is hard to draw a general conclusion about the reliability of HQRc, the involvement of HQRc in performance and in injury prevention. Theoharopoulus et al. (2000) and Chena et al. (1991) suggest that HQRc increase with higher AV’s due to higher hamstring activation in comparison with quadriceps activation. These studies investigated a population of respectively basketball players and NCAA division II athletes.
Other authors suggest that it could be clinically more relevant to look at the antagonist-agonist strength relationship at the specific angle (Duarte et al., 2018). According to Duarte et al. (2018) the antagonist-agonist strength relationship was particularly useful at the angle of the agonist (quadriceps) peak torque (PT). Because of the novelty of these parameter in relation with injury prevention, the authors of the present study decided to investigate both the antagonist-agonist strength relationship at the angle of the agonist (quadriceps) PT and at the angle of the antagonist (hamstrings) PT, respectively the H/PTQ and the PTH/Q (figure 1). It seems that this method could be an excellent alternative to conventional assessments associated with PT and deserves to be further investigated (Cozette et al., 2019).
APT (angle of peak torque) is also pretending to be a useful parameter for athletes, coaches and medical staff, although some studies question the reproducibility. Therefore it is recommended to be aware with the interpretation of these measures (Bernard et al., 2012 and Maffiuletti et al., 2007). The APT is the joint angle that corresponds with the position in which PT is reached (figure 1) (Amaral et al., 2014). According to Bernard et al. (2012) the APT is determined by several factors such as: the anatomical variation, the muscular group tested, the type of practice and the level of practice. For example, the APT of the knee flexors of football players will be lower than the APT of a cyclist of the same age and
13
similar level. This means that a football player will reach PT of the knee flexors in less great knee flexion angles, as the specific biomechanical factors of this sport demands (Amaral et al., 2014). APT is an indicator for length-tension relationship of the muscle and a predictor for muscle injuries. As previously discussed, the ideal APT is sport-specific. Obviously an accurate knowledge of the biomechanical demands of the specific sport is paramount in order to interpret the outcome measures (APT in this case) of an isokinetic test protocol and to decide whether the player is at risk for lower limb muscle injuries (Ayala et al., 2012 and Van Dijk et al.,2018). In this study, both the PT of the hamstrings (PTH) and the PT of the quadriceps (PTQ) were investigated.
The aim of this study is to investigate whether the findings mentioned above are applicable to a population of National Under-21 (U21) Belgian hockey players. More specific, this study will compare the test values of the investigated parameters (PTQ, PTH, HQRc, H/PTQ ratio, PTH/Q ratio, APT Q and APT H) between three isokinetic test protocols. In all protocols the subjects performed a concentric program, the first one was executed with an AV of 180°/s in contradistinction with the second one which measures parameters at 60°/s and the third protocol which measures them at an even higher velocity, 240°/s. Eventually the authors were in the possession of a list with injuries, of which the subjects had been suffering in the period after testing.
This leads to the research questions in this study:
Are the investigated parameters sport-specific in hockey or can isokinetic parameters of other sports be used and are there significant differences between both legs? What is the difference between the values of the investigated parameters (PTQ, PTH,
HQRc, H/PTQ ratio, PTH/Q ratio, APTQ and APTH) of U21 hockey players at 60°/s, 180°/sec and 240°/s and what is the possible cause?
Additionally the study will compare all parameters between two subgroups, men and women. Is there a significant difference between them and if so, what can explain these findings in terms of differences in body composition, etc?
14
15
Methodology:
Participants
Forty-eight hockey players of the U21 national teams participated in this study. Twenty-seven of them were males with mean age 18.6 years (±0.62), and twenty-one participants were females, mean age 19.0 years (±0.94). There was no significant difference in age between the male and the female population. The age in the population varied between 17.5 years and 20.5 years, both the youngest and the oldest participant in this study were females.
Testing procedure
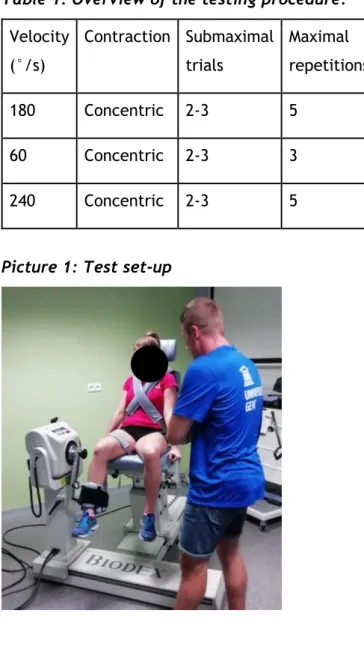
Maximal torque of the knee extensor (quadriceps) and flexor muscles (hamstrings) was measured using an isokinetic dynamometer (Biodex 4, Medical Systems, NY, USA). All subjects warmed-up by cycling 10 minutes at 1W/kg on a home trainer. After this warming-up, subjects were comfortably seated on the dynamometer chair and secured with two straps across the trunk and one strap across the thigh (leg to be tested) to minimize extraneous body movements (avoiding compensations). The alignment between the dynamometer rotational axis and the knee joint rotation axis (lateral femoral epicondyle) was checked at the beginning of each trial. ROM was set at 0°- 90° of flexion (0° corresponding to knee fully extended). The gravitational factor of the dynamometer’s lever arm and lower segment was calculated by the dynamometer and was automatically adjusted during measurements. The distal shin pad of the dynamometer was attached two fingers (approximately 4 cm) proximal to the lateral malleolus by using a strap. The space between the dorsal aspect of the knee and the chair was a small fist (approximately 7 cm, depending on the length of the lower limb). During the test protocol, players were instructed to hold on to the handles on both sides of the chair with their hands. The test set-up can be seen in picture 1. Subjects did not receive visual feedback during the test; however, verbal encouragement was given. Testing included concentric contractions of the knee extensor and flexor muscles at respectively 180°/s (5 repetitions), 60°/s (3 repetitions) and 240°/s (5 repetitions). After a set, subjects recovered passively for 60s between series of measurements. Only the concentric contractions of the knee extensor and flexor muscles were tested. Because the players were in-season the day they were tested, eccentric contractions were not performed to limit the risk of muscle soreness. Most of the players had a match the day after testing was done.
16
Subjects were asked to complete two to three submaximal practice repetitions before the real test was performed. An overview of the experimental protocol is shown in Table 1. During the testing protocol the players were instructed to straighten and bend the knee as fast as possible over the full ROM by each concentric repetition. Participants were given verbal encouragement to make an even bigger effort. This way the highest possible measurements could be made.
Table 1: Overview of the testing procedure.
Velocity (°/s) Contraction Submaximal trials Maximal repetitions 180 Concentric 2-3 5 60 Concentric 2-3 3 240 Concentric 2-3 5
17
Injuries
All forty-eight subjects were asked to report their injuries in an online document. This document included date of injury, localisation, limitation in participation at training and effect on performance. Only injuries from the test day (Men: September 14th 2019; Women: September 21st 2019) until 31st December 2019 were included in this study and additionally only the relevant injuries for this study were taken into account, i.e. those located in the knee, posterior leg, frontal leg, calf and muscle injuries around the ankle.
Statistical analysis
SPSS Statistics 25 was used to practice the analysis of the testing data. Descriptive statistics (mean, standard deviation (SD), …) of all parameters (PTQ, PTH, HQRc, H/PTQ, PTH/Q, APTQ and APTH) were calculated separately for every single AV (60°/s, 180°/s and 240°/s) and for both sexes (male and female). The unpaired t-test was performed to analyse means and SD and to search for significant outcomes between those AV’s and between the sexes. The same unpaired t-test was performed to investigate possible significant differences in parameters between future injured and uninjured hockey players. Subsequent the authors performed the Binary logistic regression analysis to create a logistic or predictive model on injury due to divergent isokinetic parameters. This last-mentioned analysis was only executed with parameters that had a significant difference between the future injured and non-injured group.
Significant differences between right and left legs were investigated, performing the paired t-test. PTQ, PTH, APTQ and APTH were checked on significant differences between both sides and this at 60°/s, 180 °/s and 240°/s and in both the male and female population. Furthermore, the Chi-square test was performed to overview the distribution of future injured and uninjured players in both the male and the female population, and to search for possible significant differences.
Statistical Parametric Mapping (SPM), in which the isokinetic data was interpolated at 101 data points, was used to investigate the angle-specific HQR during the entire ROM. This was done because by using the conventional isokinetic analysis, there is a reduction of the continuous torque-time data to single values (Baumgart et al., 2018). This can potentially lead to a loss of information. For example, maximum torque values provide only limited information about the muscle performance throughout the entire ROM (Baumgart et al., 2018).
Statistical significance was set at p < 0.05 for all different tests which were performed in this study.
18
Results:
Part one: left and right legs
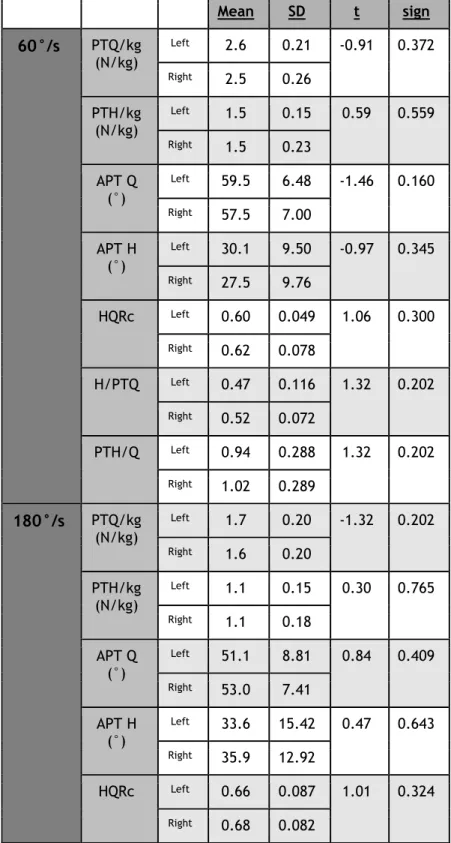
Parameters were compared between the left and right leg. Table 2 shows the results of the isokinetic tests for the female athletes and table 3 for the male athletes.
Table 2: Comparison between the left and right legs in the female population.
Mean SD t sign 60°/s PTQ/kg (N/kg) Left 2.6 0.21 -0.91 0.372 Right 2.5 0.26 PTH/kg (N/kg) Left 1.5 0.15 0.59 0.559 Right 1.5 0.23 APT Q (°) Left 59.5 6.48 -1.46 0.160 Right 57.5 7.00 APT H (°) Left 30.1 9.50 -0.97 0.345 Right 27.5 9.76 HQRc Left 0.60 0.049 1.06 0.300 Right 0.62 0.078 H/PTQ Left 0.47 0.116 1.32 0.202 Right 0.52 0.072 PTH/Q Left 0.94 0.288 1.32 0.202 Right 1.02 0.289 180°/s PTQ/kg (N/kg) Left 1.7 0.20 -1.32 0.202 Right 1.6 0.20 PTH/kg (N/kg) Left 1.1 0.15 0.30 0.765 Right 1.1 0.18 APT Q (°) Left 51.1 8.81 0.84 0.409 Right 53.0 7.41 APT H (°) Left 33.6 15.42 0.47 0.643 Right 35.9 12.92 HQRc Left 0.66 0.087 1.01 0.324 Right 0.68 0.082
19 H/PTQ Left 0.60 0.085 0.92 0.370 Right 0.61 0.060 PTH/Q Left 0.90 0.352 -0.88 0.391 Right 0.82 0.207 240°/s PTQ/kg (N/kg) Left 1.5 0.18 -1.72 0.101 Right 1.5 0.19 PTH/kg (N/kg) Left 1.1 0.17 -1.55 0.136 Right 1.0 0.16 APT Q (°) Left 54.9 6.51 0.33 0.748 Right 55.5 6.28 APT H (°) Left 35.0 20.19 -1.28 0.214 Right 28.4 9.12 HQRc Left 0.69 0.082 0.33 0.742 Right 0.69 0.068 H/PTQ Left 0.58 0.098 0.54 0.593 Right 0.59 0.105 PTH/Q Left 1.12 0.784 -1.40 0.177 Right 0.90 0.149 *significant differences at p < 0.05
PTQ/kg, peak torque quadriceps/kg ratio; PTH/kg, peak torque hamstring/kg ratio; APT Q, angle of peak torque quadriceps; APT H, angle of peak torque hamstring; HQRc, conventional hamstring/quadriceps ratio; H/PTQ, hamstring torque at moment of peak torque quadriceps/peak torque quadriceps ratio; PTH/Q, peak torque hamstring/quadriceps torque at the moment of peak torque hamstring ratio; SD, standard deviation.
20
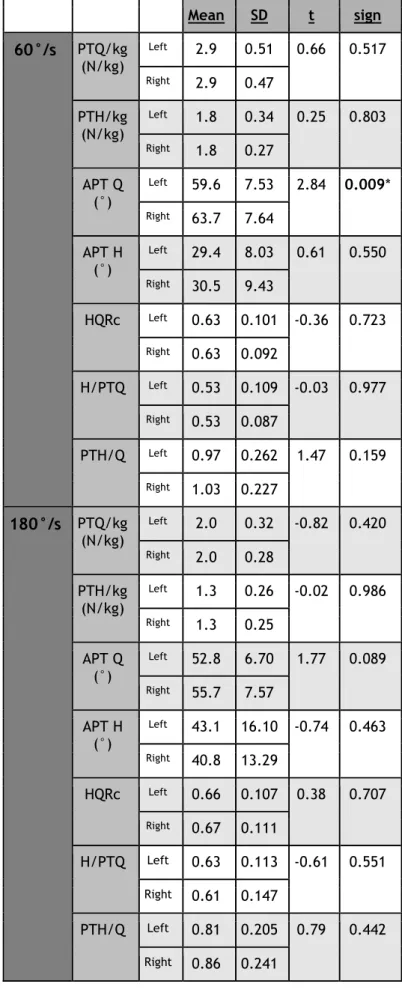
Table 3: Comparison between the left and right legs in the male population.
Mean SD t sign 60°/s PTQ/kg (N/kg) Left 2.9 0.51 0.66 0.517 Right 2.9 0.47 PTH/kg (N/kg) Left 1.8 0.34 0.25 0.803 Right 1.8 0.27 APT Q (°) Left 59.6 7.53 2.84 0.009* Right 63.7 7.64 APT H (°) Left 29.4 8.03 0.61 0.550 Right 30.5 9.43 HQRc Left 0.63 0.101 -0.36 0.723 Right 0.63 0.092 H/PTQ Left 0.53 0.109 -0.03 0.977 Right 0.53 0.087 PTH/Q Left 0.97 0.262 1.47 0.159 Right 1.03 0.227 180°/s PTQ/kg (N/kg) Left 2.0 0.32 -0.82 0.420 Right 2.0 0.28 PTH/kg (N/kg) Left 1.3 0.26 -0.02 0.986 Right 1.3 0.25 APT Q (°) Left 52.8 6.70 1.77 0.089 Right 55.7 7.57 APT H (°) Left 43.1 16.10 -0.74 0.463 Right 40.8 13.29 HQRc Left 0.66 0.107 0.38 0.707 Right 0.67 0.111 H/PTQ Left 0.63 0.113 -0.61 0.551 Right 0.61 0.147 PTH/Q Left 0.81 0.205 0.79 0.442 Right 0.86 0.241
21 240°/s PTQ/kg (N/kg) Left 1.8 0.30 0.40 0.694 Right 1.8 0.27 PTH/kg (N/kg) Left 1.3 0.23 0.34 0.734 Right 1.3 0.23 APT Q (°) Left 54.6 6.86 2.91 0.007* Right 58.7 7.15 APT H (°) Left 42.7 22.83 -2.02 0.054 Right 33.6 17.23 HQRc Left 0.74 0.120 -0.50 0.622 Right 0.73 0.107 H/PTQ Left 0.61 0.182 -1.40 0.178 Right 0.56 0.140 PTH/Q Left 0.93 0.223 1.38 0.186 Right 1.05 0.359 *significant differences at p < 0.05
PTQ/kg, peak torque quadriceps/kg ratio; PTH/kg, peak torque hamstring/kg ratio; APT Q, angle of peak torque quadriceps; APT H, angle of peak torque hamstring; HQRc, conventional hamstring/quadriceps ratio; H/PTQ, hamstring torque at moment of peak torque quadriceps/peak torque quadriceps ratio; PTH/Q, peak torque hamstring/quadriceps torque at the moment of peak torque hamstring ratio; SD, standard deviation.
The APT Q is reached in significantly greater knee extension angels in the left leg than in the right in the male population, this could only be observed at 60°/s and 240°/s (table 3). No significant differences were found between left and right legs in the female population (table 2).
22
Part two: angular velocities
Parameters were compared between the three angular velocities. Both legs were split up.
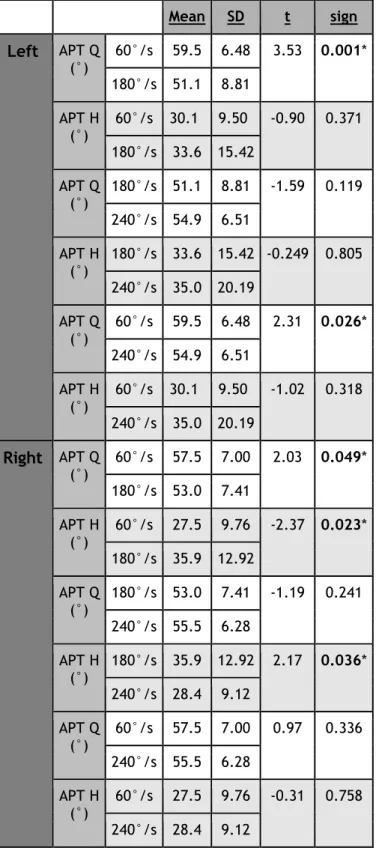
Table 4: Comparison between the different angular velocities in the female population (APT Q and APT H).
Mean SD t sign Left APT Q (°) 60°/s 59.5 6.48 3.53 0.001* 180°/s 51.1 8.81 APT H (°) 60°/s 30.1 9.50 -0.90 0.371 180°/s 33.6 15.42 APT Q (°) 180°/s 51.1 8.81 -1.59 0.119 240°/s 54.9 6.51 APT H (°) 180°/s 33.6 15.42 -0.249 0.805 240°/s 35.0 20.19 APT Q (°) 60°/s 59.5 6.48 2.31 0.026* 240°/s 54.9 6.51 APT H (°) 60°/s 30.1 9.50 -1.02 0.318 240°/s 35.0 20.19 Right APT Q (°) 60°/s 57.5 7.00 2.03 0.049* 180°/s 53.0 7.41 APT H (°) 60°/s 27.5 9.76 -2.37 0.023* 180°/s 35.9 12.92 APT Q (°) 180°/s 53.0 7.41 -1.19 0.241 240°/s 55.5 6.28 APT H (°) 180°/s 35.9 12.92 2.17 0.036* 240°/s 28.4 9.12 APT Q (°) 60°/s 57.5 7.00 0.97 0.336 240°/s 55.5 6.28 APT H (°) 60°/s 27.5 9.76 -0.31 0.758 240°/s 28.4 9.12 *significant differences at p < 0.05
APT Q, angle of peak torque quadriceps; APT H, angle of peak torque hamstring; SD, standard deviation.
23
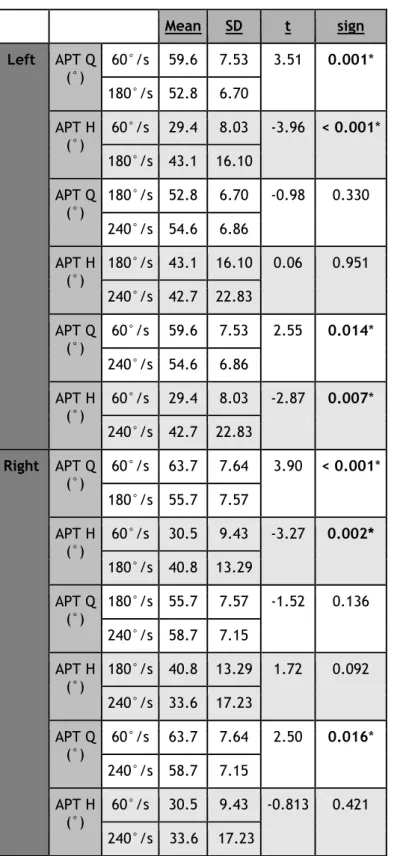
Table 5: Comparison between the different angular velocities in the male population (APT Q and APT H).
Mean SD t sign Left APT Q (°) 60°/s 59.6 7.53 3.51 0.001* 180°/s 52.8 6.70 APT H (°) 60°/s 29.4 8.03 -3.96 < 0.001* 180°/s 43.1 16.10 APT Q (°) 180°/s 52.8 6.70 -0.98 0.330 240°/s 54.6 6.86 APT H (°) 180°/s 43.1 16.10 0.06 0.951 240°/s 42.7 22.83 APT Q (°) 60°/s 59.6 7.53 2.55 0.014* 240°/s 54.6 6.86 APT H (°) 60°/s 29.4 8.03 -2.87 0.007* 240°/s 42.7 22.83 Right APT Q (°) 60°/s 63.7 7.64 3.90 < 0.001* 180°/s 55.7 7.57 APT H (°) 60°/s 30.5 9.43 -3.27 0.002* 180°/s 40.8 13.29 APT Q (°) 180°/s 55.7 7.57 -1.52 0.136 240°/s 58.7 7.15 APT H (°) 180°/s 40.8 13.29 1.72 0.092 240°/s 33.6 17.23 APT Q (°) 60°/s 63.7 7.64 2.50 0.016* 240°/s 58.7 7.15 APT H (°) 60°/s 30.5 9.43 -0.813 0.421 240°/s 33.6 17.23 *significant differences at p < 0.05
APT Q, angle of peak torque quadriceps; APT H, angle of peak torque hamstring; SD, standard deviation.
24
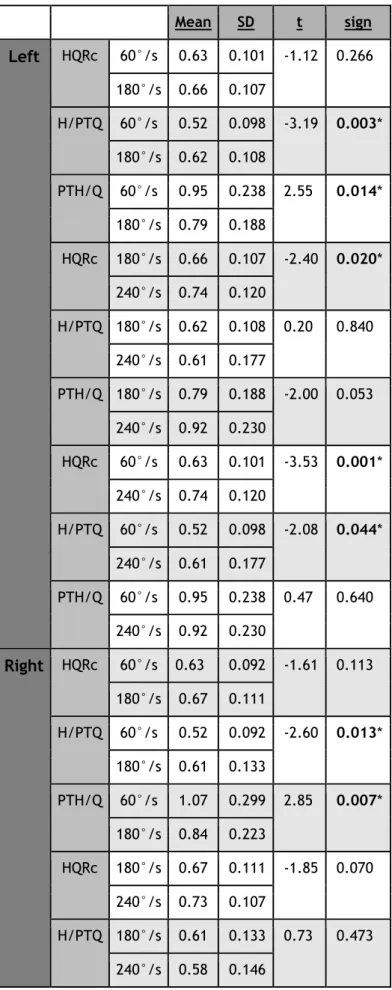
Table 6: Comparison between the different angular velocities in the female population (HQRc, H/PTQ and PTH/Q). Mean SD t sign Left HQRc 60°/s 0.60 0.049 -2.92 0.006* 180°/s 0.66 0.087 H/PTQ 60°/s 0.47 0.116 -3.98 < 0.001* 180°/s 0.60 0.085 PTH/Q 60°/s 0.94 0.288 0.41 0.685 180°/s 0.90 0.352 HQRc 180°/s 0.66 0.087 -0.93 0.356 240°/s 0.69 0.082 H/PTQ 180°/s 0.60 0.085 0.79 0.432 240°/s 0.57 0.098 PTH/Q 180°/s 0.90 0.352 -1.20 0.239 240°/s 1.12 0.784 HQRc 60°/s 0.60 0.049 -4.21 < 0.001* 240°/s 0.69 0.082 H/PTQ 60°/s 0.47 0.116 -3.09 0.004* 240°/s 0.57 0.098 PTH/Q 60°/s 0.94 0.288 -1.01 0.319 240°/s 1.12 0.784 Right HQRc 60°/s 0.62 0.078 -2.78 0.008* 180°/s 0.68 0.082 H/PTQ 60°/s 0.51 0.072 -4.81 < 0.001* 180°/s 0.61 0.060 PTH/Q 60°/s 1.02 0.289 2.54 0.015* 180°/s 0.82 0.207 HQRc 180°/s 0.68 0.082 -0.37 0.717 240°/s 0.69 0.068
25 H/PTQ 180°/s 0.61 0.060 0.95 0.348 240°/s 0.59 0.105 PTH/Q 180°/s 0.82 0.207 -1.37 0.179 240°/s 0.90 0.149 HQRc 60°/s 0.62 0.078 -3.41 0.002* 240°/s 0.69 0.068 H/PTQ 60°/s 0.51 0.072 -2.64 0.012* 240°/s 0.59 0.105 PTH/Q 60°/s 1.02 0.289 1.70 0.099 240°/s 0.90 0.149 *significant differences at p < 0.05
HQRc, conventional hamstring/quadriceps ratio; H/PTQ, hamstring torque at moment of peak torque quadriceps/peak torque quadriceps ratio; PTH/Q, peak torque hamstring/quadriceps torque at the moment of peak torque hamstring ratio; SD, standard deviation.
26
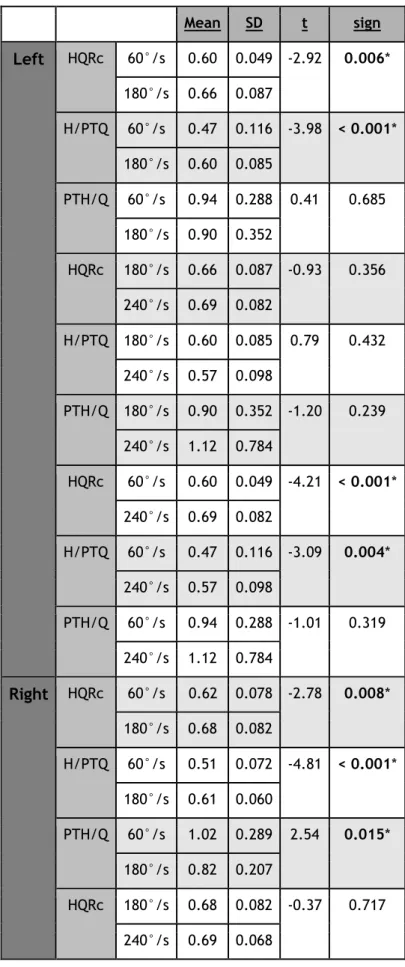
Table 7: Comparison between the different angular velocities in the male population (HQRc, H/PTQ and PTH/Q). Mean SD t sign Left HQRc 60°/s 0.63 0.101 -1.12 0.266 180°/s 0.66 0.107 H/PTQ 60°/s 0.52 0.098 -3.19 0.003* 180°/s 0.62 0.108 PTH/Q 60°/s 0.95 0.238 2.55 0.014* 180°/s 0.79 0.188 HQRc 180°/s 0.66 0.107 -2.40 0.020* 240°/s 0.74 0.120 H/PTQ 180°/s 0.62 0.108 0.20 0.840 240°/s 0.61 0.177 PTH/Q 180°/s 0.79 0.188 -2.00 0.053 240°/s 0.92 0.230 HQRc 60°/s 0.63 0.101 -3.53 0.001* 240°/s 0.74 0.120 H/PTQ 60°/s 0.52 0.098 -2.08 0.044* 240°/s 0.61 0.177 PTH/Q 60°/s 0.95 0.238 0.47 0.640 240°/s 0.92 0.230 Right HQRc 60°/s 0.63 0.092 -1.61 0.113 180°/s 0.67 0.111 H/PTQ 60°/s 0.52 0.092 -2.60 0.013* 180°/s 0.61 0.133 PTH/Q 60°/s 1.07 0.299 2.85 0.007* 180°/s 0.84 0.223 HQRc 180°/s 0.67 0.111 -1.85 0.070 240°/s 0.73 0.107 H/PTQ 180°/s 0.61 0.133 0.73 0.473 240°/s 0.58 0.146
27 PTH/Q 180°/s 0.84 0.223 -2.37 0.023* 240°/s 1.05 0.347 HQRc 60°/s 0.63 0.092 -3.67 0.001* 240°/s 0.73 0.107 H/PTQ 60°/s 0.52 0.092 -1.66 0.104 240°/s 0.58 0.146 PTH/Q 60°/s 1.07 0.299 0.23 0.817 240°/s 1.05 0.347 *significant differences at p < 0.05
HQRc, conventional hamstring/quadriceps ratio; H/PTQ, hamstring torque at moment of peak torque quadriceps/peak torque quadriceps ratio; PTH/Q, peak torque hamstring/quadriceps torque at the moment of peak torque hamstring ratio; SD, standard deviation.
The APT Q was reached earlier in the movement (in greater flexion angles) at 60°/s in comparison with 180°/s and 240°/s in both populations. These findings were significant, except the difference in the right legs of the female population at 60°/s and 240°/s (tables 4 + 5).
In female athletes, the APT H was reached in significantly greater knee flexion angles at 180°/s in comparison with 60°/s and 240°/s on the right side (table 4). In the male population APT H was reached in significantly greater knee flexion angles at 180°/s and 240°/s in comparison with 60°/s on both the left and right side, some differences are significant (table 5).
The HQRc increased with increasing AV in the male and female population, but not all differences were significant (tables 6 + 7).
The H/PTQ was overall the highest at 180°/s. This ratio was in all cases, except for one in the male population, significantly lower at 60°/s in comparison with 180°/s and 240°/s (tables 6 + 7).
In the female population the PTH/Q was significantly higher at 60°/s in comparison with 180°/s on the right side (table 6). The same could be found in the male population, but this time for both the left and the right side. Among men the PTH/Q was also significantly higher at 240°/s than at 180°/s on the right side (table 7). Overall, the PTH/Q was the lowest at 180°/s.
28
Part three: sexes
Parameters were compared between males and females. The PT/kg was not mentioned because it is commonly known that males reach higher PT’s than females.
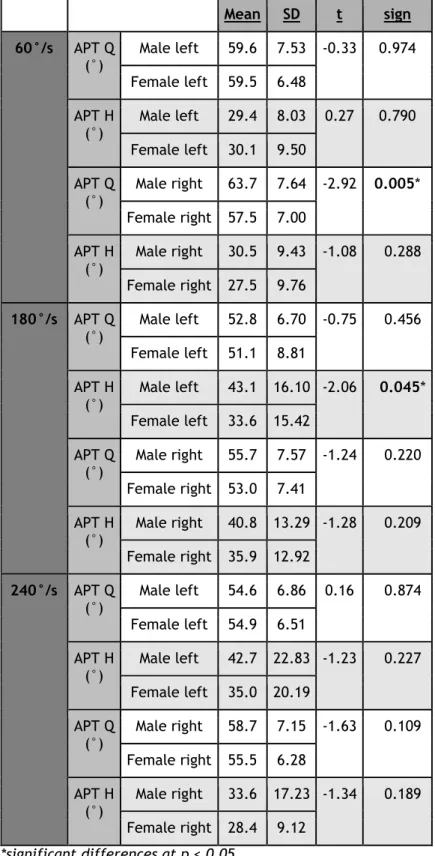
Table 8: Comparison between the male and female population (APT Q and APT H).
Mean SD t sign 60°/s APT Q (°) Male left 59.6 7.53 -0.33 0.974 Female left 59.5 6.48 APT H (°) Male left 29.4 8.03 0.27 0.790 Female left 30.1 9.50 APT Q (°) Male right 63.7 7.64 -2.92 0.005* Female right 57.5 7.00 APT H (°) Male right 30.5 9.43 -1.08 0.288 Female right 27.5 9.76 180°/s APT Q (°) Male left 52.8 6.70 -0.75 0.456 Female left 51.1 8.81 APT H (°) Male left 43.1 16.10 -2.06 0.045* Female left 33.6 15.42 APT Q (°) Male right 55.7 7.57 -1.24 0.220 Female right 53.0 7.41 APT H (°) Male right 40.8 13.29 -1.28 0.209 Female right 35.9 12.92 240°/s APT Q (°) Male left 54.6 6.86 0.16 0.874 Female left 54.9 6.51 APT H (°) Male left 42.7 22.83 -1.23 0.227 Female left 35.0 20.19 APT Q (°) Male right 58.7 7.15 -1.63 0.109 Female right 55.5 6.28 APT H (°) Male right 33.6 17.23 -1.34 0.189 Female right 28.4 9.12 *significant differences at p < 0.05
APT Q, angle of peak torque quadriceps; APT H, angle of peak torque hamstring; SD, standard deviation.
29
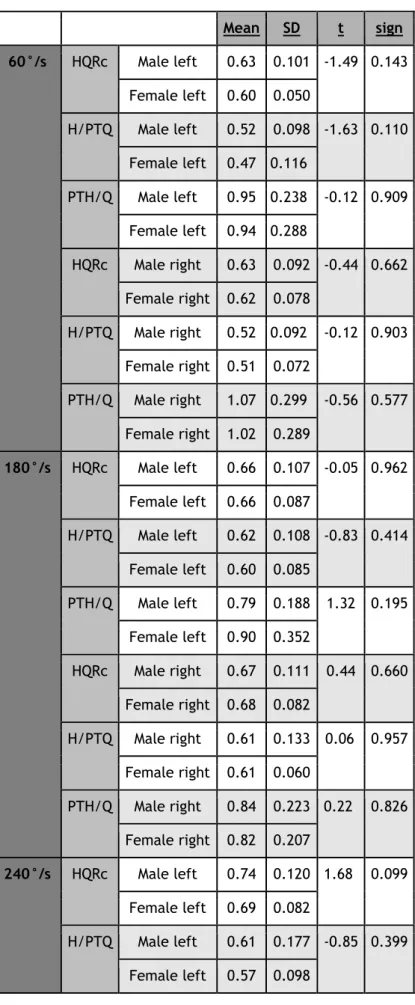
Table 9: Comparison between the male and female population (HQRc, H/PTQ and PTH/Q). Mean SD t sign 60°/s HQRc Male left 0.63 0.101 -1.49 0.143 Female left 0.60 0.050 H/PTQ Male left 0.52 0.098 -1.63 0.110 Female left 0.47 0.116 PTH/Q Male left 0.95 0.238 -0.12 0.909 Female left 0.94 0.288 HQRc Male right 0.63 0.092 -0.44 0.662 Female right 0.62 0.078 H/PTQ Male right 0.52 0.092 -0.12 0.903 Female right 0.51 0.072 PTH/Q Male right 1.07 0.299 -0.56 0.577 Female right 1.02 0.289 180°/s HQRc Male left 0.66 0.107 -0.05 0.962 Female left 0.66 0.087 H/PTQ Male left 0.62 0.108 -0.83 0.414 Female left 0.60 0.085 PTH/Q Male left 0.79 0.188 1.32 0.195 Female left 0.90 0.352 HQRc Male right 0.67 0.111 0.44 0.660 Female right 0.68 0.082 H/PTQ Male right 0.61 0.133 0 0.06 0.957 Female right 0.61 0.060 PTH/Q Male right 0.84 0.223 - 0.22 0.826 Female right 0.82 0.207 240°/s HQRc Male left 0.74 0.120 - 1.68 0.099 Female left 0.69 0.082 H/PTQ Male left 0.61 0.177 -0.85 0.399 Female left 0.57 0.098
30 PTH/Q Male left 0.92 0.230 1.14 0.261 Female left 1.12 0.784 HQRc Male right 0.73 0.107 - 1.33 0.191 Female right 0.69 0.068 H/PTQ Male right 0.58 0.146 0.19 0.851 Female right 0.59 0.105 PTH/Q Male right 1.05 0.347 - 1.88 0.070 Female right 0.90 0.149 *significant differences at p < 0.05
HQRc, conventional hamstring/quadriceps ratio; H/PTQ, hamstring torque at moment of peak torque quadriceps/peak torque quadriceps ratio; PTH/Q, peak torque hamstring/quadriceps torque at the moment of peak torque hamstring ratio; SD, standard deviation.
The APT Q is reached in greater knee extension angles in the female population at 60°/s, this difference is only significant in the right leg comparison. On the other hand is the APT H reached in significantly greater knee flexion angles in the male population at 180°/s, this applies only to the left legs (table 8). There’s no significant difference found in any ratio between the female and the male population (table 9).
31
Part four: injuries
Only the relevant injuries for this study were taken into account, i.e. those located in the knee, posterior leg, frontal leg, calf and muscle injuries around the ankle. No significant differences were found in the number of players who got injured between men and women. Male population:
17 injuries were registered, 7 in the left leg and 10 in the right leg. One player got injured twice in the left and twice in the right leg, so 15 different legs got injured. These turned out to be divided over 11 of the 27 participants. The most common injury was located in the posterior leg, followed by the knee, frontal leg and calf.
Female population:
16 injuries were recorded, 9 on the left leg and 7 on the right leg. One participant got injured twice in the same leg, so 15 different legs got injured. These were also spread across 11 players but this time out of only 21 participants. Here the most common injury was located in the calf, followed by the posterior leg, ankle, knee and frontal leg.
Only among women, a significant difference was found between injured and non-injured legs. The APT H is reached in significantly (t(40) = -2.34; p = 0.024) greater knee flexion angles in future injured legs than in non-injured legs at 60°/s (Table 10).
Table 10: Descriptive statistics of the only significant difference between non-injured and injured legs in women.
APT H NON-INJURED INJURED 60°/s N 27 15 Mean (SD) 26.3 (8.73) 33.2 (9.78)
APT H, angle of peak torque hamstring; SD, standard deviation.
For this significant parameter, a binary logistic regression (enter) was performed (table 11). This regression showed that 85.2% of the observed not-injured legs and 33.3% of the observed injured legs could be correctly predicted by means of the APTH. In total, in 66.7% of the cases it was correctly predicted whether or not the leg would be injured by using the APT H on 60°/s as a predictor in the female population.
32
Table 11: Binary logistic regression
B p Exp(B)
95% C.I. for EXP(B)
Lower Upper
APT H
0.083 0.034* 1.086 1.006 1.173
Constant - 10,495 0.026* 0.000
*significant differences at p < 0.05 APT H, angle of peak torque hamstring.
33
Part five: SPM
When analysing the angle-specific HQR, there is a significant difference between males and females in the mid-range of the total ROM at 60°/s (figure 2). This significant difference can only be seen at 60°/s and not at 240°/s (figure 3).
Figure 2: The angle-specific HQR at 60°/s.
34
Discussion:
SPM
This is one of the first studies using SPM to investigate the angle-specific HQR during the entire ROM in healthy athletes. SPM allows the identification of significant different regions of the curves rather than only focusing on snapshots of the torque production. So it’s possible that this approach can reveal clinically meaningful information that cannot be captured with conventional calculated parameters (Baumgart et al., 2018).
In this study, when analysing the angle-specific HQR, there is a significant difference between males and females in the mid-ROM at 60°/s. It’s important to note that this significant difference could not be seen at 240°/s. A possible explanation of these results is that the quadriceps torque of the females decrease faster by an increased AV. This suggest that the quadriceps of the females is less suitable for explosive tasks. According to the authors of this study, a possible explanation could be the fact that women have a different type of muscle fibers (less fast twitch fibers for example) or the recruitment of these muscle fibers could be different compared with the males. Renstrom et al. (2008) wrote that hamstring recruitment is significantly higher in men than in women. For this reason, the angle-specific HQR of the males could be higher. This was also found in the present study. Further research is necessary, but it’s clear that HQRc, which were calculated using the maximum torque values, cannot represent the shape of the angle-specific HQR.
Injuries
It has been proposed that 30 to 40 injury cases are needed to detect strong to moderate associations between risk factors and injury in prospective cohort studies (van Dyk et al., 2018). In this study 30 injured legs were reported, 15 for both the male and female population. When looking at other studies, it is clear that hamstring injuries are most associated with potential suboptimal isokinetic screening parameters. In this study this is not different, hamstring injuries were the most common in the male population and the second most common in the females.
Previous studies have suggested that a strength imbalance between quadriceps and hamstrings, specifically with a HQRc less than 0.60, is predictive of risk for hamstring strain (Zvijac et al., 2013). This can’t be confirmed by this study. No mean HQRc values below 0.60 were observed, neither on the injured legs nor on the non-injured legs. What could be seen is that at 60°/s the mean HQRc was lower in the future injured legs than in the non-injured legs, but never below 0.60. This difference was never significant. What the authors of this study did found is that the APT H, and not the HQRc as mentioned, had a predictive value for future injuries. Though, this could only be observed in the female
35
population in which the most common injury was located in the calf, followed by the hamstrings, ankle, knee and frontal leg. The fact that the APT H can be used to make a prediction about future injuries has already been described in other studies. For example Opar et al. (2012) suggested that athletes with a greater knee flexion angle at peak concentric knee flexion torque (those who produce peak knee flexor torque at shorter muscle lengths) are proposed to be at greater risk of hamstring strain injuries. The hamstrings in these individuals would be expected to work on the descending limb of the length-tension relationship across a greater ROM, leaving them more prone to damage. Furthermore Amaral et al. (2014) suggests that an APT that does not meet the specific demands of various sports may be associated with a higher incidence of injuries. This can more or less be confirmed by this study.
Sport-specificity and differences in both sides
Lower limb muscle strength demands are sport-specific so the value of the different parameters in the screening are linked to some sport and position (on the pitch) specific variables. For example: quadriceps concentric PT values were significantly higher in volleyball players than in football players and volleyball players presented lower HQRc in comparison with football players (Magalhaes et al., 2004). Another study shows the same results, and generalized these findings to a jumping group (volleyball, basketball,...) and a cutting group (football, rugby,…) who executed more rotations and pivot movements in the lower limb. The jumping group had a higher quadriceps concentric PT and a lower HQRc than the cutting group (Kim JH et al., 2013). It is obvious that hockey and football are both belonging to the cutting group. Lehance et al. (2009) performed a similar study in elite U21 male football players and reported a HQRc of 0.60 ± 0.07 in the dominant legs and 0.61 ± 0.08 in the non-dominant legs at 60°/s and a HQRc of 0.73 ± 0.12 in the dominant legs and 0.75 ± 0.17 at 240°/s, which are similar values as found in the present study (table 3). Zakas et al. (2006) concluded that the HQRc present symmetry between both limbs of professional football players who have dominance on either one (left or right) or both lower limbs. Despite the differences in biomechanics of the sport, these results are very similar to HQRc values of an elite U21 male hockey population. So it can be proposed that the HQRc can be determined by sport-specific demands related to movement patterns during running or jumping (Kabacinski et al., 2018). Moreover, HQRc may be not only sport-specific, but also specific to each competitive level within sports (de Lira et al., 2017). When looking at field hockey, the ball is handled and passed on the ground, which requires players to assume a crouched position with high degrees of both trunk and knee flexion (Braun et al., 2015). Furthermore, it’s important to note that hockey demands a very specific movement pattern
36
while hitting the ball. The left leg always is the front leg when shooting and passing the ball. So all hockey players make ‘a lunge’ with the left leg before hitting the ball (picture 2). This is for example not the same in soccer where players can choose if they shoot the ball with the left or right leg. In field hockey, all sticks are right-handed, so it is to a player's advantage to cut towards the right and this motion is considerably more common (Braun et al., 2014). During a hockey match, there are hundreds change of directions (COD). Each COD requires a breaking force followed by an acceleration, so the eccentric-concentric force capability is paramount.
When comparing the parameters between both legs, there are a few significantly different parameters in this study. At 60°/s and 240°/s, the APT Q is reached in significantly greater knee extension angles in the left leg in the male population. According to Amaral et al. (2014), it’s important to note that the interpretation of the APT must take into account not only the absolute values of angulation but also the representation of such angulation relative to the activity of interest. The findings of this study can’t be compared with other sports because no studies were found which investigated the APT with both legs separated in a similar population in other sports. Further investigation should be conducted to decide whether these findings can be generalized in hockey players or in other sports (with similar biomechanics). According to the authors of this study, a lack of difference between right and left leg is to be expected. When running and dribbling, it’s important that both legs have similar characteristics because muscle imbalance between both legs can potentially lead to an injury. Professional hockey players also follow a prevention program where both legs are trained the same way. For this reason, almost no significant differences can be expected in a hockey population when comparing both legs.
37
Different angular velocities
It is commonly known that the increase of AV leads to a reduced level of absolute strength (Theoharopoulos et al., 2000). This finding is well supported in the literature and is believed to be affected by muscle composition, time for motor fiber activation, activity level, and gender (Chena et al., 1991).
When analysing the HQRc, the opposite thing is seen: the HQRc increased with increasing AV in both subpopulations (tables 6 + 7). This was also found in the existing literature. For example, the HQRc is significantly higher at 360°/s in comparison with 90°/s in a population of soccer and volleyball players (Magalhaes et al., 2004). It can be assumed that with the increase of velocity greater activation of the hamstrings appeared in comparison with the quadriceps as action of antagonist muscle, leading to a greater increase of the ratio. As a result of this theory, the hamstring muscles are seen as the most important stabilizer of the knee joint at higher AV (Theoharopoulos et al., 2000). This study focuses on the effect of different AV’s on less explored isokinetic parameters, with APT being one of them. Maffiuletti et al. (2001) investigated the test-retest reliability of the APT. The concentric APT H was described as an unreliable parameter, therefore it is recommended that this parameter should be interpreted with caution. In contradiction with the APT H, the APT Q complied in the criteria of a reliable parameter.
When reviewing the chapter of results (tables 4 + 5), two remarkable findings can be made on APT Q and APT H. The APT in right and left legs of both sexes was reached earlier in the movement of testing (in greater flexion angles for APT Q and in greater extension angles for APT H) at 60°/s than at 240°/s and 180°/s, except for the left side in the female population where the APT H at 180°/s was measured earlier in the movement than at 240°/s. These findings accord to the study of Yoon et al. (1991): in a population of healthy subjects, he described a significant later occurrence of the APT in the ROM for quadriceps and hamstrings as the AV increased.
The hypothesis of the authors suggests that a ‘learning effect’ can explain the paradoxical fact that APT Q is reached earlier (in greater flexion angles) at 240°/s than at 180°/s (although this was never significant). As described above in ‘Methods’, the protocol at 180°/s was performed first. Followed by the 60°/s and 240°/s protocol. Before testing, subjects performed three practice repetitions, but these were only submaximal. The learning effect in isokinetic parameters was described by Duarte et al. (2018) and Timmins et al. (2016). This last author stated that reproducibility and reliability of isokinetic measures is decreased when only assessed on a single visit, without a separate familiarisation session employed (Timmins et al., 2016). Hereby they confirmed the existence of a learning effect, and the hypothesis as a possible explanation. The same hypothesis can explain the similar conclusions
38
on APT H, the left side legs of the women excluded where APT H at 180°/s was reached earlier in the knee flexion movement (in greater extension angles) than at 240°/s.
As mentioned above, this study focuses on parameters on which the effect of different AV is less explored in the past. This is very much the case for the HQR at APT Q (H/PTQ) and the HQR at APT H (PTH/Q).
These two ratios are an application of a sectorial method to analyze the isokinetic torque production. This method is called angle-specific torque (AST). The AST method has been developed to better reflect the antagonistic function as part of the exploration of the flexor and extensor muscles of the knee (Cozette et al., 2019).
The most remarkable results of these two relatively new parameters are the values at higher AV’s (180°/s and 240°/s). The H/PTQ was overall higher at 180°/s and 240°/s than at 60°/s (differences between 180°/s and 240°/s were never significant, but 60°/s vs 180°/s and 60°/s vs 240°/s were), while the PTH/Q had almost no significant differences between 60°/s and 240°/s (tables 6 + 7). This is just one of multiple reasons why the authors of this study suggest that the H/PTQ is more related with de HQRc in comparison with the PTH/Q. To explain the findings above, two possible hypotheses can be made. The first theory suggests that PTQ is decreasing faster than torque of quadriceps at APT H when AV is increased. The second suggests the same observation is seen in the hamstrings (PTH is decreasing faster than torque of hamstrings at APT Q when AV is increased). A flattening of at least one of both PT curves at increasing AV is likely to explain the observed results on H/PTQ and PTH/Q in this study.
There have only been a few more investigations on H/PTQ and PTH/Q, and according to the authors of this study, none of them investigated and discussed the differences when comparing values at low AV (60°/s) with values at higher AV’s (180°/s and 240°/s). More research is needed to confirm the trends and hypothesis in this study.
Differences between sexes
It is commonly known that the male population reaches a higher PT/kg in comparison with the female population, this is confirmed by several other studies, for example by Pincivero et al. (2003). Therefore it was not discussed in this study.
The APT Q was reached in greater extension angles in the female population with one minor exception. The opposite could be observed in the APT H, which was reached in greater flexion angles in the male population, also with one minor exception. So in the male population, both APT are reached in greater knee flexion. A possible explanation for this phenomenon could be that men are on average taller than women and therefore have to bend their legs deeper in order to hit the ball.
39
If the ratios are looked at more closely, some kind of trend could be observed. Apart from a few exceptions, the HQRc and H/PTQ are higher in the male population compared to the female population. And if only the left leg is looked at, which is always the supporting leg when passing or shooting in hockey, those exceptions disappear. These observations about the HQRc can be confirmed by Renstrom et al. (2008) who wrote that hamstring recruitment has been shown to be significantly higher in men than in women. When comparing the PTH/Q between the sexes, no overall trend could be observed. But when looking at the left and right leg separately, the PTH/Q is higher in the male population at all AV’s on the right side. On the left side, at 60°/s the PTH/Q is more or less the same between the two subpopulations, but at higher AV the PTH/Q is higher in the female population. This difference increases with increasing AV. The results in the left side can be explained by the biomechanical character of hockey, in which the player is performing a lunge with the left side leg while passing or shooting. The higher PTH/Q in female athletes is probably a result of a decrease in the quadriceps torque at the APT H, which is greater in the female population than in the male population, at higher AV.
Strengths and limitations
The present study has several limitations that should be mentioned. First of all, it’s important to note that seated isokinetic dynamometry strength testing does not reflect the functional demands placed on the hamstrings during sport-specific activity such as high-speed running or changing direction (van Dyk et al., 2018). Furthermore, no eccentric movements were performed to limit the risk of muscle soreness in the participants who were in-season during testing. For this reason, the eccentric HQR (Hecc/Qconc) could not be calculated. The eccentric HQR is also named as the ‘dynamic control ratio’ or ‘functional HQR’ because during knee extension, it is the antagonist eccentric hamstring coactivation that serves to decrease the anterior shear forces of the concentric quadriceps muscle (Lee et al., 2009 and Zvijac et al., 2013). This functional HQR has a higher reliability than the HQRc (De Carvalho et al., 2013).
The strengths of this study are the homogenous population. All participants play in the U21 national team of Belgium, and the age varied between 17.5 years and 20.5 years. Furthermore, none of the subjects were injured at the moment of testing.
This study also implements SPM (which makes it possible to view the HQR over the entire ROM) and alternative HQR’s, such as the H/PTQ and PTH/Q. These parameters have not been discussed often by other studies.
It’s also a strength that the players were followed-up during the first months after testing if they received an injury. Van Dyk et al. (2018) proposed that 30 to 40 injury cases are needed
40
to detect strong to moderate associations between risk factors and injury in prospective cohort studies, while 200 cases are needed to detect small to moderate associations. So the population in this prospective cohort study is big enough to identify strong/moderate associations, but too narrow to detect small associations.
41
Conclusion:
To answer the research questions it can be concluded that all sports have their own biomechanical profile, which influences the parameters. So authors should be careful when generalizing the parameters to other sports. When looking at differences between both legs, the only significant different parameter was the APT Q, which was reached in greater extension angles in the left leg. Further investigation should be conducted to decide whether these findings can be generalized in hockey players or in other sports (with similar biomechanics).
The existing literature about the evolution of PTQ, PTH and HQRc at different AV’s is confirmed. Values of PTQ and PTH decreased at higher AV, while HQRc increased due to a more important contribution of the hamstrings to knee stability. The APT Q and APT H were reached earlier in the movement of testing (respectively extension and flexion) at a lower AV than at higher AV’s. In literature, similar results were reported in healthy, untrained subjects. Now there is evidence to generalize these findings to a population of elite hockey players. Like the HQRc, the H/PTQ increased at higher velocities, while PTH/Q showed equal values or decreased. A clear link is proved multiple times between HQRc and H/PTQ in this study. A flattening of at least one of both PT curves at increasing AV is likely to explain the observed results on H/PTQ and PTH/Q in this study, but more research is needed to empower this hypothesis. Obviously, the PT/kg generated by men is significantly higher than by women. The APT Q and APT H are reached in greater knee flexion in the male population compared with the female population, this could be explained by difference in length between the sexes. HQRc and H/PTQ are higher in the male population, a higher hamstring recruitment in men than in women could explain this. When comparing the PTH/Q between the sexes, no overall trend could be observed. It can be assumed that H/PTQ has a stronger link with HQRc than PTH/Q, as also seen in the left-right comparison within the two subpopulations.
During the follow-up period, hamstring injuries were most commonly reported. Most studies define a cut-off value for the HQRc of 0.60, values lower than 0.60 are more predictive for injuries. In this study, no significant differences were found in HQRc between future injured legs and non-injured legs, therefore no cut-off value could be defined to predict injuries. What the authors of this study did find is that the APT H had a predictive value for future injuries. Only in the female population, future injured hockey players reached their APT H in significantly greater knee flexion angles than players who didn’t get injured. A few studies already linked a later occurrence of APT H angles to injury, however most of them blame the injury to be the cause. Since this prospective study has similar results, injury could also be the result of divergent APT H values. Maybe future studies will clarify this dilemma.
42
Training the hamstrings in the more distal part of the movement to shift the APT H more towards full extension could be proposed to protect the hamstrings against injuries.
43
References:
Amaral, G. M., Marinho, H. V., Ocarino, J. M., Silva, P. L., Souza, T. R. D., & Fonseca, S. T. (2014). Muscular performance characterization in athletes: a new perspective on isokinetic variables. Brazilian journal of physical therapy, 18(6), 521-529.
Ayala, F., Croix, M. D. S., de Baranda, P. S., & Santonja, F. (2012). Absolute reliability of hamstring to quadriceps strength imbalance ratios calculated using peak torque, joint angle-specific torque and joint ROM-specific torque values. International journal of sports medicine, 33(11), 909-916.
Bartolomei, S., Nigro, F., Gubellini, L., Ciacci, S., Merni, F., Treno, F., Cortesi, M., & Semprini, G. (2019). PHYSIOLOGICAL AND SPORT-SPECIFIC COMPARISON BETWEEN DIVISION I AND DIVISION II ITALIAN MALE FIELD HOCKEY PLAYERS. Journal of Strength and Conditioning Research, 33(11), 3123-3128.
Baumgart, C., Welling, W., Hoppe, M. W., Freiwald, W., & Gokeler, A. (2018). Angle-specific analysis of isokinetic quadriceps and hamstring torques and ratios in patients after ACL-reconstruction. BMC Sports Science, Medicine and Rehabilitation, https://bmcsportsscimedrehabil.biomedcentral.com/articles/10.1186/s13102-018-0112-6. Bernard, P. L., Amato, M., Degache, F., Edouard, P., Ramdani, S., Blain, H., & Codine, P. (2012). Reproducibility of the time to peak torque and the joint angle at peak torque on knee of young sportsmen on the isokinetic dynamometer. Annals of physical and rehabilitation medicine, 55(4), 241-251.
Braun, H. J., Shultz, R., Malone, M., Leatherwood, W. E., Silder, A., & Dragoo, J. A. (2015). Differences in ACL biomechanical risk factors between field hockey and lacrosse female athletes. Knee Surg Sports Traumatol Arthrosc, 23, 1065–1070.
Brughelli, M., Cronin, J., & Nosaka, K. (2010). Muscle architecture and optimum angle of the knee flexors and extensors: A comparison between cyclists and Australian Rules Football players. DOI: https://doi.org/10.1519/JSC.0b013e318197009a
Chena, D. R., Kurth, A. L., Thomas, M., & Mayhew, J. (1991). Torque characteristics of the quadriceps and hamstring muscles during concentric and eccentric loading. Journal of Orthopaedic & Sports Physical Therapy, 14(4), 149-154.
44
Cozette, M., Leprêtre, P.M., Doyle, C., ,Weissland, T. (2019). Isokinetic Strength Ratios:
Conventional Methods, Current Limits and Perspectives. Frontiers in physiology, 10, 567. de Carvalho Froufe, A. C. P., Caserotti, P., de Carvalho, C. M. P., de Azevedo Abade, E. A., & da Eira Sampaio, A. J. (2013). Reliability of concentric, eccentric and isometric knee extension and flexion when using the REV9000 isokinetic dynamometer. Journal of human kinetics, 37(1), 47-53.
de Lira, C. A., Mascarin, N. C., Vargas, V. Z., Vancini, R. L., & Andrade, M. S. (2017). Isokinetic knee muscle strength profile in Brazilian male soccer, futsal, and beach soccer players: a cross-sectional study. International journal of sports physical therapy, 12(7), 1103.
Duarte, J. P., Valente-dos-Santos, J., Coelho-e-Silva, M. J., Couto, P., Costa, D., Martinho, D., & Gonçalves, R. S. (2018). Reproducibility of isokinetic strength assessment of knee muscle actions in adult athletes: Torques and antagonist-agonist ratios derived at the same angle position. PloS one, 13(8), e0202261.
Impellizzeri, F. M., Bizzini, M., Rampinini, E., Cereda, F., & Maffiuletti, N. A. (2008). Reliability of isokinetic strength imbalance ratios measured using the Cybex NORM dynamometer. Clinical physiology and functional imaging, 28(2), 113-119.
Kabacinski, J., Murawa, M., Mackala, K., & Dworak, L.B. (2018). Knee strength ratios in competitive female athletes. PLoS ONE 13(1): e0191077. https://doi.org/10.1371/journal. pone.0191077.
Kim, D., & Hong, J. G. (2011) Hamstring to quadriceps strength ratio and noncontact leg injuries: A prospective study during one season. Isokinetics and Exercise Science, 19(1), 1-6.
Kim, J. H., Kim, I. H., Lee, J. U., Kim, M. Y., Lee, T. H., & Kim, B. (2013). Change of Muscular Activity and Dynamic Stability of the Knee Joint Due to Excessive and Repetitive Jumping or Cutting by Female Athletes. Journal of Physical Therapy Science, 24(8), 715-719.
45
Lee, M. J. C., Reid, S. L., Elliott, B. C., & Lloyd, D. G. (2009). Running Biomechanics and Lower Limb Strength Associated with Prior Hamstring Injury. Medicine and Science in Sports and Exercise, 41(10), 1942-1951.
Lehance, C., Binet, J., Bury, T., & Croisier, J. L. (2008). Muscular strength, functional performances and injury risk in professional and junior elite soccer players. Scand J Med Sci Sports, 19, 243–251.
Maffiuletti, N. A., Bizzini, M., Desbrosses, K., Babault, N., & Munzinger, U. (2007). Reliability of knee extension and flexion measurements using the Con‐Trex isokinetic dynamometer. Clinical physiology and functional imaging, 27(6), 346-353.
Magalhaes, J., Oliveira, J., Ascensao, A., & Soares, J. (2004). Concentric quadriceps and hamstrings isokinetic strength in volleyball and soccer players. J Sports Med Phys Fitness, 44(2), 119-125.
Opar, D. A., Williams, M. D., & Shield, A.J. (2012). Hamstring Strain Injuries Factors that Lead to Injury and Re-Injury. Sports Med, 42(3), 209-226.
Pincivero, D. M., Gandaio, C. B., & Ito, Y. (2003). Gender-specific knee extensor torque, flexor torque, and muscle fatigue responses during maximal effort contractions. European journal of applied physiology, 89, 134–141.
Polglaze, T., Dawson, B., Hiscock, D.J., & Peeling, P.(2015). A Comparative Analysis of Accelerometer and Time–Motion Data in Elite Men’s Hockey Training and Competition. International Journal of Sports Physiology and Performance, 10, 446 -451.
Renstrom, P., Ljungqvist, A., Arendt, E., Beynnon, B., Fukubayashi, T., Garrett, W., Georgoulis, T., Hewett, T. E., Johnson, R., Krosshaug, T., Mandelbaum, B., Micheli, L., Myklebust, G., Roos, E., Roos, H., Schamasch, P., Shultz, S., Werner, S., Wojtys, E., & Engebretsen, L. (2008). Non-contact ACL injuries in female athletes: an International Olympic Committee current concepts statement. Br J Sports Med, 42(6), 394–412.
Sole, G., Hamrén, J., Milosavljevic, S., Nicholson, H., & Sullivan, S. J. (2007). Test-retest reliability of isokinetic knee extension and flexion. Archives of physical medicine and rehabilitation, 88(5), 626-631.