INVESTIGATING THE
CHALLENGES AND
OPPORTUNITIES FOR SCALING UP
ECOSYSTEM RESTORATION
Background Report
Annelies Sewell, Jetske Bouma and Stefan van der Esch
Investigating the challenges and opportunities for scaling up Ecosystem Restoration
PBL Netherlands Environmental Assessment Agency The Hague, 2016
PBL publication number: 2356
Corresponding author
Annelies Sewell, annelies.sewell@pbl.nl
Authors
Annelies Sewell, Jetske Bouma, Stefan van der Esch
Acknowledgements
Special thanks to our reviewers: Ben ten Brink (PBL), Marcel Kok (PBL), Machteld Schoolenberg (PBL), Johan Meijer (PBL), Keimpe Wieringa (PBL), Olav-Jan van Gerwen (PBL), Hans Schut (Commonland), Kathleen Buckingham (WRI), Karin van Boxtel (Both Ends), Simone Quatrini (UNCCD)
Graphics
Beeldredactie PBL
Editing and production
PBL Publishers & Michael van Laake
Parts of this publication may be reproduced, providing the source is stated, in the form: Sewell, A., Bouma, J., and van der Esch, S (2016) Investigating the challenges and opportunities for scaling up Ecosystem Restoration, The Hague: PBL Netherlands Environmental Assessment Agency.
This publication can be downloaded from: www.pbl.nl/en.
PBL Netherlands Environmental Assessment Agency is the national institute for strategic policy analysis in the field of environment, nature and spatial planning. We contribute to improving the quality of political and administrative decision-making by conducting outlook studies, analyses and evaluations in which an integrated approach is considered paramount. Policy relevance is the prime concern in all our studies. We conduct solicited and unsolicited research that is both independent and scientifically sound.
Contents
TABLE OF BOXES
4
TABLE OF FIGURES
5
EXECUTIVE SUMMARY
6
1 INTRODUCTION
9
2 KEY ISSUES AND MECHANISMS
14
2.1 Financing issues 15
2.1.1. Start-up and maintenance costs 16
2.1.2. Investment returns and cost recovery 18
2.1.3. Risks and uncertainty 22
2.2. Financing mechanisms to address issues 25
2.3. Coordination issues 30
2.3.1. Search and information costs 31
2.3.2. Organisation and representation 33
2.3.3. Monitoring and enforcement 34
2.4. Coordination mechanisms to address issues 37
3. ILLUSTRATIONS
40
3.1. China: Loess Plateau 41
3.2. Colombia 44
3.3. Ethiopia: Tigray Region 46
3.4. Brazil: Atlantic Forest Restoration (PACT) 48
3.5. Kenya: Lake Naivasha 51
3.6. Overview of strengths and weaknesses 53
4 WAYS FORWARD
56
4.1. Key lessons 56 4.2. Recommendations 59REFERENCES
62
GLOSSARY
70
ACRONYMS
71
SOURCES
71
APPENDIX
72
TABLE OF BOXES
Box 1 International policy ambitions & pledges ... 9
Box 2 Definitions... 10
Box 3 Recent initiatives ... 11
Box 4 Cost estimates for global restoration ambitions ... 16
Box 5 Comparability of restoration costs ... 16
Box 6 Cost effectiveness of ESR ... 18
Box 7 Involvement of institutional investors ... 20
Box 8 Investment funds, institutional investors and the infrastructure sector in Less Developed Countries ... 24
Box 9 PES, REDD+ and Costa Rica ... 29
Box 10 Knowledge brokers ... 32
Box 11 CBM to reduce organisation & representation costs ... 34
Box 12 Public-private Partnerships (PPPs) ... 36
TABLE OF FIGURES
Figure 1: Scales of influence in financing and coordination issues ... 12
Figure 2: Cost of action against land degradation ... 17
Figure 3: (a) per annum costs and revenues for one rotation cycle of forest plantation restoration and (b) cumulative cost and returns for Forest Plantation reforestation projects in tropical moist broadleaf forest biomes. ... 19
Figure 4: Public goods. ... 21
Figure 5: Ecosystem service flows. ... 22
Figure 6: Investors, finance mechanisms, risk and instruments ... 26
Figure 7: Risk levels of structured capital ... 28
Figure 8: Interaction between levels is necessary ... 37
Figure 9: Coordinating finance across ESR timescales ... 38
Figure 10: Ecosystem restoration cases ... 40
Figure 11: Example of ESR in practice: restoration of the Loess Plateau in China. ... 40
Figure 12: Variations in coordination mechanisms ... 54
EXECUTIVE SUMMARY
This background report investigates two key challenges in scaling up investments in
ecosystem restoration (ESR) — financing and coordination — and provides recommendations on how they might be addressed. Scaling up ESR investments features a significant increase in inputs, labour and the capacity for restoration and rehabilitation of ecosystems and their services, meaning ESR projects become larger and more numerous.
ESR can reduce both ecosystem degradation and smallholder1 vulnerability, providing local
benefits in terms of food security and enhanced smallholder resilience. At the same time, ESR generates regional benefits, such as improved water management, and global benefits, including biodiversity conservation and climate change mitigation — altogether making ESR a promising approach for reaching the Sustainable Development Goals. While the number of restoration projects is on the rise, significant scaling up of restoration activities does not seem to be taking place. We argue that this is partly due to financing issues, but that lack of coordination also plays a role, in terms of the absence of mechanisms to aid coordination between actors and levels. Whereas the financing issues are being widely debated and innovative approaches are being explored, attention for the difficulties associated with coordination is missing. As ecosystem restoration requires creating affinity between the local and global levels and aligning public and private interests, it is crucial that financing and coordination are jointly addressed. This is particularly important with regard to building trust and ensuring long-term commitment between stakeholders.
Based on our analysis of the literature and interviews with key stakeholders, we conclude that there is a lack of coordination between financing and supply and demand in the field of ESR projects. Also, start-up and maintenance costs are perceived as high with few tangible benefits, yet for the majority of ecosystems, ESR provides net economic benefits. Context specificity and lack of standardised costs add to huge cost variations among projects, which heightens the risk of investment. This means there is a need to share best practices, build knowledge sharing networks, allocate funds for incubation phase projects with uncertain costs, and maybe even develop restoration insurance schemes. Returns for ESR projects vary in form (public - private, monetary - non-monetary), location of delivery (local - global) and time frame (short - long term), which adds to the risk of investment, uncertainty about collateral for larger investors and concerns with regard to non-monetary returns. This highlights the need for public co-funding of ESR, to cover the social returns of restoration projects, ensure long-term commitment and thereby leverage private funds. The high risk and uncertainty of ESR investments is also partly caused by the lack of an investment track record, long project timescales, project size, uncertainty in costs and presence of public non-monetary returns. Risks can be grouped into various categories including novelty,
externality, longevity, capacity and technical and regulatory risk. They may be tackled by learning from experiences in other sectors such as infrastructure, agriculture, water and renewable energy, and by creating Public Private Partnerships (PPPs) and introducing risk
reducing guarantees. To reduce the search and information costs of effective prioritisation and targeting of ESR projects, it is important to broker existing knowledge through regional and local networks and involve regional actors in investment targeting and decision making. Overall, costs do not necessarily have to be high, but organisation and representation expenses related to coordination of stakeholder interests and financing can be substantial given the lack of institutional frameworks, particularly when linking global goals to local implementation and decision making. Investment funds, PPPs and community-based approaches can help to reduce costs. Finally, monitoring and enforcement of restoration projects is crucial for building investor confidence and reducing risk and uncertainty, particularly regarding agreement on the way responsibilities are allocated and costs are shared. This requires standardisation of evaluation methods and indicators, and adequate implementation and enforcement of methods at the local level across short to long-term project timescales.
Overall, scaling up investments in ESR requires attention for coordination at the local and regional levels. We have observed a trend towards investments by the private sector through gateway sectors such as agriculture and forestry. Private sector investments can deliver the additional and much-needed financing for ESR, though further scaling up requires a strong enabling environment to reduce investment risks and ensure social returns on investment, particularly those which are not profitable for private investors. This includes political support to address perverse incentives that drive land degradation and increase the opportunity costs of restoration, policies for mechanisms that capture the monetary value of restoration (PES, REDD+) or help to reduce risk (guarantees), and the availability of public financing to leverage private financing and support incubation stage projects where the costs and risks are high.
Reducing the investment risk for private stakeholders requires institutions and organisations that can show experience and consistent performance in developing a strong investment track record in ESR. Knowledge brokering and technical capacity remain of primary importance, particularly at the regional level, in order to share best practices and bring stakeholders to agreement. This can be achieved by policy support to strengthen existing global networks such as the Global Partnership on Forest and Landscape Restoration and the development of regional and local PPP platforms and coordination organisations, which can help improve access to appropriate and sustainable financing. In addition, there is no need to re-invent the wheel, as lessons learned from other sectors such as agriculture and
infrastructure can serve as blueprints for ESR, regarding novelty, longevity and regulatory finance risks (see section 2.1.3).
Finally, cost recovery is crucial for sustainable ESR projects. Innovative mechanisms, prioritisation and effective use of financing through mapping, monitoring and enforcement must ensure that long-term investments lead to the delivery of private and public services. This requires standardisation of assessments of ESR potential and improved, consistent and enforced monitoring and mapping.
1 Introduction
An estimated 12 million hectares of land are being degraded globally each year at a rate of 23 hectares a minute (UNCCD, 2015). Currently, 1.9 billion of the Earth’s total 13 billion hectares are considered degraded, primarily in central Asia, South America and Sub-Saharan Africa, in humid and dryland areas, in cropland, grassland, pasture and forested ecosystems (Gibbs & Salmon, 2015) (Nkonya, Mirzabaev, & von Braun, 2016). At the same time, both the Millennium Ecosystem Assessment (MA, 2005) and The Economics of Ecosystems and Biodiversity (TEEB, 2010) demonstrate that ecosystems provide a multitude of benefits to human society and wellbeing. Once ecosystems are degraded, the provisioning of ecosystem services is affected, constituting a welfare loss. Land degradation, in combination with population growth, competing demands for land, poverty and lack of good governance are likely to increase the risk of conflict and migration, such as can be seen currently in Africa and the Levant (van Schaick & Dinnissen, 2014). The international community and national governments have been attempting to halt ecosystem degradation by launching international programmes and stimulating sustainable land management practices through recent efforts such as Sustainable Development Goal 15 (Box 1).
Box 1 International policy ambitions and pledges
Aichi Target 5 (2010)
The Aichi Targets were agreed on by the parties of the Convention of Biological Diversity. Target 5 states that by 2020, the rate of loss of all natural habitats, including forest, should be at least halved and where feasible brought close to zero, while degradation and fragmentation should be significantly reduced. Under this convention, 15 percent of all degraded ecosystems are due to be restored by 2020.
Bonn Challenge (2011)
This initiative aims to restore 150 million hectares of degraded land and forests by 2020, with current
commitments standing at 86 million hectares by various countries including the USA, Brazil, Rwanda, Pakistan, Colombia, Ethiopia, El Salvador, Guatemala, Democratic Republic of Congo, Burundi, Honduras, India, Mexico and Costa Rica. Other organisations such as Initiative 20x20 and AFR 100 operate at the regional level and since COP21, private companies such as Asia Pulp & Paper have joined the effort.
New York Declaration on Forests (2014)
More than 130 governments, companies, civil society organisations and indigenous peoples endorsed the New York Declaration on Forests, which pledges to cut the loss of forests in half by 2020 and to end forest loss by 2030. It also calls for the restoration of more than 350 million hectares of forests and croplands, an area larger than India, which would bring significant climate benefits and take pressure off primary forests.
Sustainable Development Goals (2015)
Sustainable Development Goal 15, Life on land, aims to sustainably manage forests, combat desertification, halt and reverse land degradation, and stem biodiversity loss (UN, 2015). The Land Degradation Neutrality (LDN) target is an associated initiative which aims to restore 2 billion hectares of degraded land by 2030. LDN is also a specific goal of the United Nations Convention to Combat Desertification (FAO & Global Mechanism of the UNCCD, 2015).
UNFCCC, REDD+
The Reducing Emissions from Deforestation and forest Degradation (REDD+) framework was initiated by the United Nations Framework Convention on Climate Change and updated to its current form in 2010. REDD+ goals include reducing emissions from deforestation and forest degradation, sustainable management of forests and conservation and enhancement of carbon stocks. REDD+ is a framework through which developing countries are rewarded financially for emissions reductions resulting from a decrease in forest conversion to alternate land uses (The REDD Desk, 2016).
Next to interventions that focus on reducing or avoiding degradation, recent initiatives such as the Economics of Land Degradation (ELD Initiative, 2015) suggest that opportunities also exist in rehabilitation, i.e. bringing degraded lands back into production, and restoration, returning them to a more natural state (Box 2). Though prevention is generally cheaper than the cure2, restoration and rehabilitation of land can, under the right circumstances, promote
economic growth and social cohesion (Caspari, Alexander, ten Brink, & Laestedius, 2014), and aid in addressing the challenges of biodiversity loss, reduced ecosystem resilience and degraded production systems. Restoration therefore has the potential to combine the global policy agendas of biodiversity protection, climate change, food and water security.
Box 2 Definitions
Land degradation
Land degradation is defined by the United Nations Convention to Combat Desertification as:
“Reduction or loss of the biological or economic productivity and complexity of rain fed cropland, range, pasture, forest and woodlands resulting from land uses or from a process or combination of processes, including processes arising from human activities and habitation patterns”.
Restoration
Where land degradation results from the loss of or trade-offs between functions, restoration aims to restore the balance. There are various definitions for restoration, which include:
- (Ecological) restoration - “re-establishing the presumed structure, productivity and species
diversity at a site or ecosystem that has been degraded, damaged or destroyed” (Society for Ecological Restoration (SER), 2004) (FAO, 2005).
- Rehabilitation – re-establishing and improving the productivity of degraded land, primarily for
activities such as agriculture (FAO, 2015).
- Reclamation - recovering the productivity of degraded land, often with exotic species, to create a
new ecosystem with little of the original biodiversity (WWF/IUCN, 2000)
- Mosaic restoration – a fragmented landscape of differing land uses and restoration types, which
come together to form a multifunctional landscape patchwork, including agroforestry and silvopasture (McCracken, Maginnis, & Sarre, 2008).
- Wide-scale restoration – the mass restoration of one ecosystem or biome. A good example is
the restoration of areas with a low population density and which were formerly dominated by forests (WRI, 2014)
- Landscape restoration – this involves a combination of the above approaches across an
interconnected landscape, defined by geophysical boundaries (WWF International, 2007). - Integrated Landscape Management (ILM) - a new concept which is becoming well-known is
Integrated Landscape Management (ILM), a response to growing competition for natural resources and demands from various sectors, that provides an opportunity to address trade-offs and develop synergies. It is important to highlight that the ILM approach covers a range of sustainable land management techniques including restoration, rehabilitation and reclamation, which are the focus of this study. But ILM goes beyond landscape restoration, and can help to pool interests and funds across landscapes.
Ecosystem restoration (ESR) is a combination of the above approaches applied to a specific ecosystem. In areas where degradation still occurs, it can also include prevention to some degree. We ESR as
active restoration, in contrast to more passive conservation, though of course they can be used in
combination. Restoration can complement conservation, given that only 13% of the world’s land is protected and often not under effective management (CBD & UNEP, 2011).
2 The cost of conservation is variable but is typically 0.01-1,000 USD/ha/year, whereas restoration
varies from a few hundred dollars in general to 554,000 USD/ha specifically for coral reefs (Nelleman & Corcoran, 2010) (TEEB, 2010). However, restoration estimates can rival those of conservation (see section 2.1.1.).
However, restoring degraded ecosystems is not cheap, and although studies by TEEB (2010) and the ELD Initiative (2015) indicate that societal benefits greatly outweigh the costs, the required investments are often large with returns spread over long time periods. Hence, although investments in ESR are desirable from a socio-economic perspective, the financial returns are often limited, making for a weak business case for the private sector. This explains the large number of efforts initiated by public and non-state actors to stimulate ESR (Wentink, 2015) (Box 3).
Box 3 Recent initiatives
Name Initiative for Sustainable Landscapes (ISLA) Restoration type Landscape restoration and rehabilitation Financed by (Public/Private)
Public and Private
Initiated by
PPP
Active Project Sites
Kenya, Ethiopia, Brazil, Cote d’Ivoire, Vietnam, Indonesia, Liberia
Althelia Ecosphere Mosaic
restoration Private and Public International non-profit Kenya, Peru, Guatemala, Brazil
Moringa Fund Mosaic,
Landscape restoration
Private and Public Private investment bank and public sector forestry commission
Colombia, Peru, Chile, Brazil, Cameroon, Gabon, Dem. Congo Livelihoods Fund For
Family Farming Mosaic, Landscape restoration
Private Private sector food
companies (Danone and Mars, Inc.)
Côte d’Ivoire, Kenya, Madagascar, India, Indonesia, Brazil (in development)
Commonland Mosaic,
Landscape restoration and rehabilitation
Public and Private International non-profit, university and private foundation
Spain, South Africa, Western Australia, The Netherlands (in development)
Living Lands Landscape
restoration Public and Private Regional non-profit South Africa
Initiative 20x20 Restoration,
rehabilitation, landscape restoration
Public and Private International research organisation, international non-profit and national governments
Mexico, Guatemala, Matto Grosso (Brazil), Nicaragua, Honduras, Argentina, São Paulo (Brazil), Espírito Santo (Brazil): El Salvador, Costa Rica, Colombia, Ecuador, Peru and Chile, Bosques Modelo, American Bird Conservancy, Conservación Patagónica (in development) African Forest Landscape Restoration Initiative AFR 100 Restoration, rehabilitation, landscape restoration
Public and Private International research organisation, international non-profit and national governments Central African Republic, Democratic Republic of Congo, Ethiopia, Ghana, Kenya, Liberia, Madagascar, Malawi, Mozambique, Niger, Rwanda, Togo, Uganda (in development)
This paper reviews the emerging evidence that shows how these initiatives can be made more effective, focussing on financing and coordination issues as the two main constraints for progress. Addressing them is difficult because it requires both establishing affinity between local and global levels, and aligning public and private interests (Figure 1).
In the first place, the importance of ESR is discussed at the global level revealing a clear need for national governments to participate through initiatives such as the Bonn Challenge (Box 1). However, initiatives coordinating national action according to global goals are few and far between, and where they do exist, the translation to implementation at the local level is often insufficient. In addition, financing is generally made available at the national and international levels, but there are difficulties in determining the best locations for investment and effectively coordinating activities on the ground. While large-scale forest restoration projects, such as those in China and South Korea, show that this is possible, the complexity of ecosystem and landscape-based approaches requires effective coordination at the local and regional levels. On the whole, things are made difficult by a lack of project information and evaluations, and failure to share best practices.
Secondly, while public financing is made available, it is insufficient relative to the
international targets (Box 1), especially considering the scale of restoration and rehabilitation potential – which requires investments in the order of billions of dollars3. However,
restoration and rehabilitation tend to generate both public and private benefits, suggesting that there is scope for private financing. Logical private players for such investments include impact and institutional investors (Wentink, 2015) (van der Horn & Meijer, 2015). Purely private financing of ESR would cause difficulties given the public-good nature of many ESR benefits, and the partly non-monetary, non-profitable and long-term returns on investment.
3 For example, all REDD+ activities could lead to halving deforestation rates by 2030, at a cost of USD
17.2 – 33 billion/year (Nelleman & Corcoran, 2010). The cost of the Bonn Challenge is estimated at 36 billion USD/year, and the LDN target (SDG 15.3) at 318 billion USD/year (FAO & Global Mechanism of the UNCCD, 2015).
Figure 1: Scaling up financing for ESR requires sufficient coordination between global and local levels, and public and private interests. The multiple stakeholder and multiple scale nature of ESR projects is a consequence of the multi-dimensional nature of ecosystems and ecosystem services
Hence, scaling up ESR requires public-private cooperation in financing and coordination across private, public, local and global level scales.
While there are many small-scale restoration efforts and initiatives (Bossio, et al., 2015) (see Appendix), generic lessons on the general challenges ESR is faced with, financing in
particular, are only beginning to be understood and shared (Hanson, Buckingham, Dewitt, & Laestadius, 2015) (Shames & Scherr, 2015).
Approach
This paper provides insights into the way actors and initiatives have been addressing the financing and coordination issues relating to ESR. The aim of this study is to gather information on the opportunities and constraints for scaling up ecosystem restoration. We have conducted interviews with key players to test and verify the importance of financing and coordination issues. In addition, we have collected peer-reviewed and grey literature and attended a number of workshops and conferences to ascertain the relevance of our focus and approach. The research includes a small number of case studies of initiatives in various countries (China, Kenya, Colombia, Ethiopia and Brazil) to illustrate the importance of financing and coordination issues. These have been specifically selected to fit the analytical framework we use. Based on the studied literature, this framework applies the specific notion that ecosystem restoration ultimately comes down to the restoration of ecosystem service provisioning, which implies attention for scales of delivery (local-global) and service types (private-public).
2 Key issues and
mechanisms
Estimates on potential restoration and rehabilitation areas are sparse and generally focus on global data without providing sufficient detail on regional levels. For example, Popatov et al., (2011) highlight that worldwide there are opportunities for restoring more than 2 billion hectares of deforested and degraded lands in both tropical and temperate regions — an area larger than South America. Though useful, Popatov’s study provides only a rough estimate of the restoration potential, generated with preliminary satellite data which lacks both an in-depth biophysical focus and attention for socio-economic factors. In addition, Popatov’s restoration estimates focus on forest landscape management, and do not take into account potential restoration sites in ecosystems such as grasslands, drylands, savannahs and wetlands. More detailed assessments are needed to show the potential for providing specific benefits beyond carbon sequestration. Hence there is a need for higher resolution mapping that considers biophysical and socio-economic indicators, for example through the
Restoration Opportunities Assessment Methodology (IUCN and WRI, 2014).
Opportunity does not always equal implementation: while national governments are
increasingly committed to global targets such as the Bonn Challenge (Box 1), efforts to turn these pledges into concrete restoration projects on the ground are constrained by the need to achieve affinity between public and private actors and bridge local and global levels. This discrepancy, combined with the lack of detail on possible restoration sites (and thus on the benefits they may produce), affects the coordination of supply and demand of projects4 and
an adequate assessment of their potential which eventually leads to the emergence of a limited number of ‘bankable projects’, those that are attractive for public and private investors5.
International and national sources of public financing are unlikely to be sufficient, given the long-term nature of restoration activities (5-20 years) compared to grant funding lifecycles (0-5 years), the high costs associated with restoration (see Box 4 and Section 2.1.1.) and competing interests from other sectors at the national and local levels6. Financing for
restoration at global and national levels is primarily available from public sources, such as the 500 million USD allocated by the Global Environment Facility land degradation funding
4 Sizeable, low- or medium-risk investment opportunities with reasonable rates of return.
5 By this we mean both the project demand for adequate and sustainable supply of financing, as well as
the demand from the financial world for bankable project supply.
6 For example, Sub-Saharan Africa’s (SSA) public spending on agriculture, forestry, wildlife and fisheries
is just 4% of total government budgets in the region, even though these are the sectors that contribute 25% of their GDP (FAOSTAT, 2012)
stream and the World Bank’s 300 million USD contribution to China’s Loess Plateau
Watershed Restoration Project. Despite conservation financing7 increasingly emerging as a
private sector investment opportunity, particularly for private actors with long-term
perspectives such as impact and institutional investors (Credit Suisse & McKinsey Center for Business and Environment, 2016), this potential is yet to become concrete in the form of large-scale investments (Wentink, 2015).
“When you look at the magnitude of the landscape degradation problematics across the globe, you don’t need 10-100 million, you need billions, and ultimately you need to attract institutional investors and really make clear to them and demonstrate to them that this is investment in the real economy and in real assets”
- Hans Schut, Commonland
From this vantage point, we highlight financing (including estimating and operationalising potential benefits) and coordination (including that between different geographic levels and between public and private actors) as highly significant fields where improvements can greatly assist the scaling up of ecosystem restoration.
2.1 Financing issues
ESR projects face three primary financing issues:
• Start-up and maintenance costs: ESR projects are perceived as high-cost compared to conservation initiatives and other investments. Context specificity, lack of
standardised costs and limited sharing of best practices all add to huge variability in costs, resulting in an increased risk of investment.
• Investment returns and cost recovery: Investment returns can be public, non-monetary and socio-economic, and therefore cost recovery may be an issue for the private sector restoration business case, limiting the availability of financing. Returns also vary in form (public - private, rival - excludable), location of delivery (local - global) and time frame (long - short term), creating difficulties for cost recovery.
• Risks and uncertainty: ESR projects are perceived as higher risk than other investment opportunities due to the lack of a strong investment track record8, long
project time scales, and uncertainty about start-up costs and returns. -
7 According to (WWF, Credit Suisse & McKinsey & Company, 2014), conservation finance is “understood
to be a mechanism through which a financial investment into an ecosystem is made – directly or indirectly through an intermediary – that aims to conserve the values of the ecosystem for the long term”
2.1.1.
Start-up and maintenance costs
ESR projects require initial investment (including start-up costs to purchase or lease an area, and acquire material, technology and expertise) and in many cases additional maintenance funding throughout the course of the project. Estimates for these costs vary greatly between ecosystems and locations, and the accuracy of and variation in calculations is influenced by the specific details of each context, including the level of ecosystem degradation, local infrastructure availability, type and scale of restoration, population pressure and density, the legal framework, existing land use and tenure arrangements, land value, labour costs and method of measurement9 (de Groot et al., 2013), (Form International, 2015), (Bullock et al.,
2011). In addition, the types of expenses included in restoration cost estimates often vary. Search and information costs and opportunity costs are often excluded or difficult to include in project budgets, despite opportunity costs accounting for the largest share of expenses for action against land degradation (Nkonya, et al., 2016). All the variables named here
represent difficulties in comparing and transferring cost estimates (Boxes 4 and 5).
Box 4 Cost estimates for global restoration ambitions
The cost of achieving various international policy ambitions and pledges can be estimated using average restoration costs (2,390 USD/ha).
Initiative
Bonn Challenge (150 million ha by 2020) New York Declaration of Forests (350
million ha by 2030)
Land Degradation Neutrality (2 billion ha
by 2030)
Source: (FAO & Global Mechanism of the UNCCD, 2015)
Estimated yearly budget (billion USD)
36 49 318
Estimated total budget (billion USD)
359 837 4780
Box 5 Comparability of restoration costs
Brazil
Restoration costs (including 2 years of monitoring) in the Atlantic forest in Brazil range from 5,000 USD/ha in the south to almost twice as much in the north (Reuben, 2015).
Thailand and Mexico
Mangrove restoration in Thailand was estimated at 8,240 USD/ha for initial costs followed by annual maintenance costs of 118 USD/ha (Sathirathai & Barbier, 2001), while restoration costs for mangroves in the Gulf of Mexico were almost twice as high (Agraz-Hernández & et al., 2007).
For example, TEEB (2010) has published estimates of restoration costs ranging from 260 USD/ha for grasslands to 542,500 USD/ha for coral reefs. De Groot et al. (2013) show that costs for tropical forest restoration can be lower than 10 USD/ha, and as high as 9,000 USD/ha. It also matters whether the majority of these costs are made upfront (at start-up) or are spread over time (maintenance). While actual costs may be much lower than
9 For example, some sources report estimated site costs for the total length of the project, and others
expected, considerable variations and uncertainty about costs in the short to long term contribute to risk and uncertainty in ESR projects (Section 2.1.3). Efforts to standardise restoration costs are in development10 or very recent. Nkonya et al., (2016) estimated
restoration costs geographically (Figure 2), highlighting that the cost of action against degradation can be high in developed countries — given the high value of land, labour costs, and the areal size of the country — and also in regions such as Sub-Saharan Africa, due to the extent and severity of ecosystem degradation (Nkonya, et al., 2016).
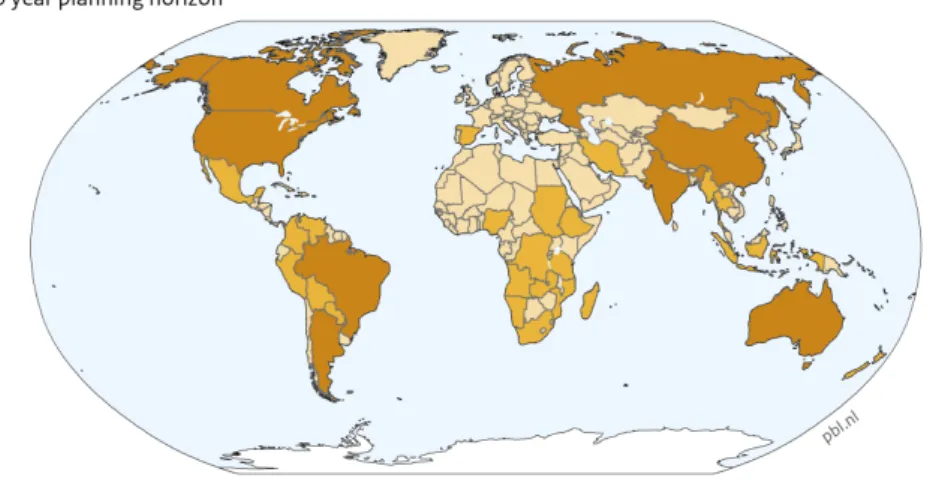
Figure 2: Cost of action against land degradation per country, given value of land and labour costs. Restoration, natural regeneration, sustainable land management and opportunity costs are included (Nkonya, et al., 2016).
It is more important to consider the total net costs of ESR, as they are not necessarily high. Holl & Howarth (2011) highlight that the majority of restoration projects provide net benefits and that it is often cheaper to invest in restoration than to build man-made replacements for ecosystem services (Box 6), while de Groot et al., (2013) have demonstrated that, even in worst case scenarios11, investing in restoration breaks even or provides financial profit in
relation to total economic value in six of the nine ecosystem types. At present, the best ecosystems for restoration investments appear to be grasslands and woodlands, in terms of their benefit-cost ratio and internal rate of return. However, in net present value terms12,
coastal and inland wetlands and tropical forest appear to be more interesting for restoration
10 For example, the JRC Technical Report by the EU – Costs of restoration measures in the EU based on
an assessment of LIFE Projects (2015).
11 The worst case scenario defined as a discount rate of 8%, 100% of the maximum cost, and a
restoration benefit of 30% of the Total Economic Value (de Groot, et al., 2013)
12 The internal rate of return (IRR) is the rate of return needed for a project to break even, taking the
cost of capital (interest, desired return) into account. The net present value (NPV) is the current value adjusted by taking into account future values and is thus an absolute figure. When comparing projects, one may have a higher IRR while the other has a higher NPV. Also, varying discount rates can determine which project is more attractive.
investments, given their higher total economic values (de Groot et al., 2013). Assumptions, including the discount rate, can influence these outcomes. The usefulness of these estimates is limited by the varied and inconsistent reporting methods of restoration projects, difficulties in valuing public and non-monetary ecosystem services, the potential for double-counting ecosystem services, and the complexity of including opportunity costs. Still, the estimates consider grasslands to be the ecosystems most affected by degradation (Bao, Nkonya, & Mirzabaev, 2016), while much of current investments is dedicated to reforestation. In general, the cost of taking action against land degradation is much lower than the cost of inaction and, on average, every US dollar invested in restoration of degraded lands has the potential to return five dollars (Nkonya, Mirzabaev, & von Braun, 2016).
As a result, conservation and restoration of natural capital may be economically beneficial, particularly in less developed countries (Balmford et al., 2003), (De Groot et al., 2013). However, while there is consensus that private sector involvement in ESR is desirable (Wentink, 2015), the economic value that is generated in restoration projects does not necessarily translate into sufficient financial return (Section 2.1.2 and 2.1.3) (Credit Suisse & McKinsey Center for Business and Environment, 2016).
Many restoration projects are privately run and carried out by consultants, or carried out on a small scale, resulting in a lack of understanding about the real costs and benefits. (Holl and Howarth, 2011). It also results in higher search and information costs (2.3.1), as well as contributing to risk and uncertainty of investments (2.1.3). Holl & Howarth (2000) and Credit Suisse & McKinsey (2016) highlight the need to develop mechanisms that deal with areas of uncertainty, for example a restoration insurance for unexpected conditions such as floods. There is also a need to standardise costs where possible, perhaps regionally, and build the sharing of best practices into project design, such as in WRI’s Scaling Up Regreening: Six
steps to success (Reij & Winterbottom, 2015).
2.1.2.
Investment returns and cost recovery
High returns do not guarantee substantial cost recovery, as returns may be public and/or non-monetary, and hence difficult to capture. Returns from ESR vary in time frame (short - long term), form (public - private), and location where they are generated (local - global). These variations can influence the recovery of investments in ESR initiatives, and therefore Box 6 Cost effectiveness of ESR
Vietnam
The Vietnam National Chapter of the Red Cross has worked in northern Vietnam with local communities since 1994, protecting and restoring over 12,000 hectares of mangroves at a cost of 1.1 million USD, while generating savings on annual dyke maintenance of 7.3 million USD. The benefits enjoyed by 7,750 families include income generation, reduced storm hazards, increased food security and improved nutrition from restored fish populations (Powell & Osbeck, 2010).
also the financing model required. For example, private investors may be put off by the lack of private, monetary returns on investment in the short term.
Figure 3: Return on investment of restoration in degraded ecosystems against time. Top figure is an illustrative example showing that costs and returns vary over the cropping cycle of forest plantation restoration. The bottom figure shows that there is a delay between cost and returns, but that returns are in general higher for forest plantation restoration.
The temporal delay in returns (Figure 3), which can last several years and goes hand-in-hand with investments in natural capital, increases the risk for investors used to or dependent on short-term cost recovery, and for whom land is a new asset — increasingly internationally observed and traded (SIANI, 2016). Even for institutional investors such as pension funds, for which long-term returns are more suited, the lack of an investment track record still makes restoration initiatives a high risk investment (see Section 2.1.3). Short and long-term returns can be generated through clever project design, such as that of the
plantation and native tree planting project in Brazil which is based on a 10-year cropping cycle (Brancalion, Viani, Strassburg, & Rodrigues, 2012), though this also increases
monitoring & enforcement costs (2.3.3) to ensure cost returns are achieved both in the short and long term.
Furthermore, institutional investors are required by law to have a certain percentage of their deal flow as liquefiable13 assets. In restoration initiatives, the limited returns of the first 5-10
years and the collateral14 are not easily liquefiable and therefore problematic for institutional
investors who perceive ESR investments as high risk15. Difficulties can occur where collateral
has not been properly established, such as formal and informal land user rights, or where collateral cannot be monetised. Liquidity is also a concern for smaller organisations that do not have the collateral to access finance for their larger restoration projects (Credit Suisse & McKinsey Center for Business and Environment, 2016), and see their opportunities for scaling up bottom-up approaches as severely limited.
Public support through regulation and funding to develop an investment track record could aim to attract impact investments and thereby leverage institutional investments. An example is wetland restoration in the USA, which has a high involvement of institutional investors, via the Wetland Mitigation Banking credit market (Box 7).
Box 7 Involvement of institutional investors
USA Wetland Mitigation Banking
Wetland Mitigation Banking in the USA works through federal, state and local government requirements to mitigate the disturbance or destruction of wetlands. An approved mitigation bank can sell credits to developers in order to compensate for this damage, be it on-site or in-kind (USACE, 2008).
The scheme stems from the 1972 Clean Water Act, which made efforts to combat the decline of wetland ecosystems and pushed for zero net loss of wetlands by enforcing the mitigation hierarchy: avoidance, minimisation, restoration and offsetting of detrimental impacts. Two factors have helped to build a resilient track record for restoration initiatives to the point where more than 1,900 commercial mitigation banks have been established since 1991: the consistent demand for mitigation credits by large energy and infrastructure projects, and the clear guidance and enforcement rules for mitigation banks formulated by the U.S. Department of Agriculture, U.S. Army Corps of Engineers (USACE), U.S. Fish & Wildlife Service (FWS), and the Environmental Protection Agency (EPA).
This strong track record of protection of over 90,000 ha of wetlands, in addition to stable returns through consistent demand for credits, political support and a market for mitigation credits, has reduced investment risks to such an extent that pension funds are now investing. In 2012, Ecosystem Investment Partners, a private equity firm, closed its second fund, raising 181 million USD from pension funds, endowments, and high-net-worth family offices, all of whom were attracted to the high and consistent demand for credits relating to offsetting the impacts of energy and infrastructure projects, with very few impact investors involved. In some areas, such as the Everglades, the restoration business has reached such maturity that green bonds are commonplace (Department of Environmental Protection, Florida, 2015). This shows how policy can create an enabling environment to catalyse private sector investment in wetlands, and that building a strong market demand can reduce the risks for institutional investors.
13 For collateral, or security, see below; for “liquidity”, see the Glossary.
14 Collateral is a borrower’s pledge or offer of specific property to a lender, made to secure a loan. It can
be seized by the lender to recoup a loss when the borrower fails to repay the loan.
15 This is not so much an issue in the short term, as it is better to have more risk-inclined investors such
as impact investors, to make the early investment. However in the long run, when risks are reduced and projects are more mature, institutional investors need to be able to invest in these kinds of projects.
Despite its many successes, wetland mitigation banking and other offsetting derivatives are criticised for inadequate monitoring and enforcement of safeguards, such as the quality and location of offset and banking sites (Lapeyre, Froger, & Hrabanski, 2015), which is particularly due to the transfer of
monitoring responsibilities from the government to individual commercial wetland banks (Quetier & Lavorel, 2011). In addition, the lack of decision making guidelines on whether an offset is appropriate in the mitigation hierarchy resulted in a rapid uptake of offsetting, as it was seen as an easy way to decrease project costs and efforts, rather than more difficult efforts to avoid the loss of primary ecosystems (Fitzsimons, Heiner, McKenney, Sochi, & Kiesecker, 2014).
The form of returns also makes financing projects more complex for private investors. Public returns can be difficult to monetise and capture in markets16, which means cost recovery is
limited. Private investors will often only invest if the private benefits captured are substantial and marketable (Loomis, Kent, Strange, Fausch, & Covich, 2000). This shows the need for public funds to cover public goods. This is primarily an issue for supporting, regulatory and cultural services where user rights are more difficult to define. Land and tenure rights also need to be clearly defined to have an impact on potential profits for local stakeholders. For a low-income stakeholder, reaping profit depends on access to the area, whether land or water, and project organisation. Increased complexity in monetising or marketing restoration benefits results in higher organisation and representation costs (2.3.2) and monitoring and enforcement costs (2.3.3).
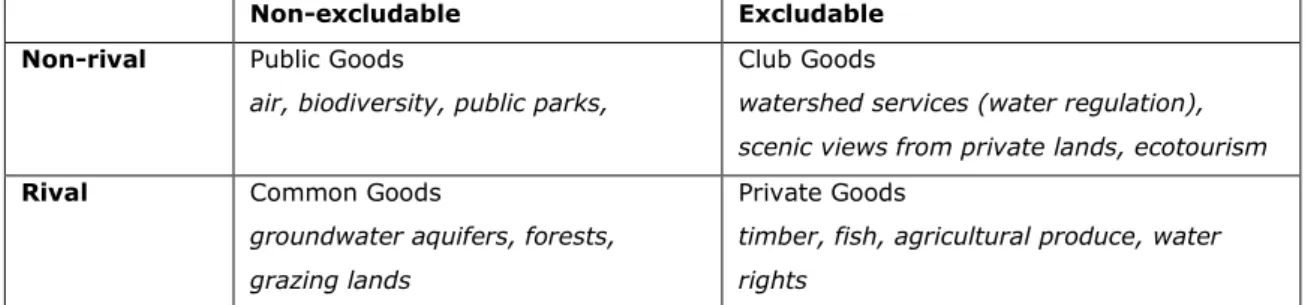
The extent to which a good is rival or excludable (Figure 4) plays an important role when considering cost recovery mechanisms. This is reflected in the design of governance and Payment for Ecosystem Services (PES) schemes. For example, user financed PES is easier for private goods and club goods, where there is an element of excludability, than for public or common goods, where there is a higher chance of free-riding and considerable transaction costs. Public goods and common goods are better suited to government financed PES schemes, which can help to reduce transaction costs due to the scale of action (Fisher, Turner, & Morling, 2009).
Non-excludable Excludable Non-rival Public Goods
air, biodiversity, public parks,
Club Goods
watershed services (water regulation), scenic views from private lands, ecotourism
Rival Common Goods
groundwater aquifers, forests, grazing lands
Private Goods
timber, fish, agricultural produce, water rights
Figure 4: Goods can be classified according to their degree of rivalry and excludability. Public goods are non-rival and non-excludable. Non-rivalry means that consumption of a good by an individual does not reduce the availability of the good for others to consume.
Non-excludability means that no one can be excluded from using a good (Kahn, 2005).
16 Benefits are difficult to measure as up to 80% of ecosystem service values are not captured by
markets, and are often transboundary public goods, which flow to beneficiaries whether or not they contribute to restoration (de Groot et al., 2013).
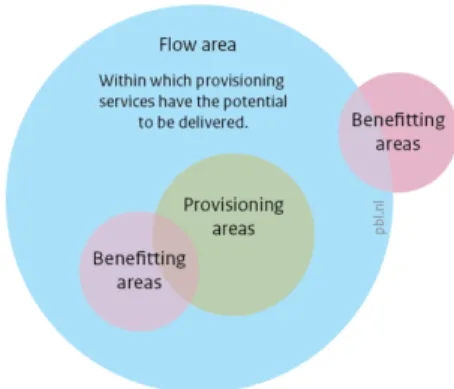
The geographical scale of returns also contributes to difficulties in cost recovery. Returns from ESR may occur downstream17 (Figure 5) from where investments are made, though
downstream users are difficult to exclude from receiving these returns, which can be public or non-monetary. This makes financing projects more complex for private investors. In addition, the transboundary nature of returns means that ecosystem boundaries often do not coincide with administrative boundaries, which leads to higher organisation costs (2.3.2) between buyers and sellers of ecosystem services to create the required institutions and coordination mechanisms, such as Payments for Ecosystem Services schemes (PES) (Section 2.2).
The complexity of the variation in returns can be illustrated with the example of a degraded area where reforestation takes place. First of all, the forest takes time to grow and deliver returns. At the local level, these may be private returns that are earned from the outset, such as employment in restoration and maintenance, and in timber production. The increased availability of fuelwood is an example of a resulting common good, whose value depends on the accessibility of the site. Pure public returns will be the effect on water regulation (watershed) at the local and regional levels and the potential for carbon
sequestration at the global level. The former will require designing and implementing a cost return mechanism, if the costs are to be borne by the beneficiaries, whereas for the latter, international markets already exist and can be tapped into (Elmqvist, et al., 2015).
2.1.3.
Risks and uncertainty
Risk and uncertainty both play a role in limiting the availability of finance for ESR.
Uncertainty exists in terms of the variations in start-up investment and maintenance costs (i.e. worst and best case BCRs) and risk in terms of the form, location and timing of investment returns. Risk and uncertainty of ESR projects can act as a barrier to long-term institutional investments, especially for large projects with many stakeholders and
17 Downstream: at a geographical distance away from the restoration site
Figure 5: Serna-Chavez et al., (2014) use a framework to analyse and quantify
ecosystem service flows. The green circle represents the provisioning area, i.e. a restored area providing ecosystem services. The pink circles represent benefitting areas, where pink overlapping green/blue provides and benefits, and pink overlapping blue benefits but doesn’t aid provisioning, i.e. downstream water users. The blue circle represents the flow area within which provisioning services have the potential to be delivered, i.e. watershed watershed area.
overlapping jurisdictions. Investment risks generally fall within the following six categories (Initiative 20x20, 2014).
• Novelty – This refers to the lack of a market track record and the presence of small and scattered known opportunities. At present, the average estimated returns on larger investments in ESR do not outweigh the associated novelty risk. This is an issue for SMEs18 which are too small to apply for institutional investments and too
big to receive microfinancing and therefore lack adequate and easy to access funding.
• Externality – The difficulty in monetising many of the social benefits, and
uncertainties of linkages and trade-offs between various ecosystem services, where a focus on one ecosystem service may undermine the resilience of another (Norgaard, 2010). This also includes the risk of natural hazards.
• Longevity – This is the risk posed by the long time scales required for projects to reach maturity and the associated long-term exit strategies, which are required for good project delivery and returns.
• Capacity – Particularly important in less developed countries, this concerns
adequate capacity for monitoring and enforcement (see 2.3.3), and the availability of infrastructure, management and knowledge.
• Technical – This refers to the level of difficulty of restoring land in heavily degraded or degrading areas, and of addressing the interests of the various stakeholders, providing technical assistance and dealing with the lack of simple measurable indicators of success.
• Regulatory - These are risks which stem from issues on the reliability of contracts, clarity of tenure rights, law enforcement, governance and the level of political
stability. Risks also arise for local land users in terms of changing land use, effects on tenure arrangements and impacts on livelihoods, which requires participatory
approaches and planning.
These risks also play a role in many other sectors, including agriculture, renewable energy and infrastructure, and often lead to the same financing issues, particularly in less developed countries due to governance failures (Ruete, 2015) (Box 8).
“ [For renewable energy] in the beginning that was really exotic and no one wanted to finance the risk…when you have a pioneering financier you are showing that it works and
18 Small and medium-sized enterprises. These are companies with 50 to 250 employees, said to be responsible
now its mainstream; you need to do it [ESR] and show the results and that it works, and get a clear picture for investors”
- Hans Schut, Commonland
In order to unlock private capital at scale, there is a need to deliver competitive, risk-adjusted returns19, provide access to finance and lay down strong enabling conditions
(Christophersen, 2015) (Credit Suisse & McKinsey Center for Business and Environment, 2016). This is especially important, as, since the 2008 banking crisis, the financial sector has increased regulation and become less willing to take risks on novel developments. This applies particularly to the large institutional investors ESR financing depends on. Building a track record is therefore the key to reducing risk for larger investments in ESR.
Box 8 Investment funds, institutional investors and the infrastructure sector in less
developed countries
The risks we see for ESR are also present in other sectors. In less developed countries, increasing competition for diminishing government budgets, known as the “global infrastructure gap”, has resulted in government support for the creation of Public-Private Partnerships (PPPs), investment funds and innovative project bonds and guarantee mechanisms (Deau & Touati, 2014). For example, the National Infrastructure Fund (FONADIN) in Mexico delivers grants, subsidies, subordinated debt and guarantees to a pipeline project worth 18 billion USD. Private sector guarantees cover public sector political and management risks of investments in PPP infrastructure projects.
Deau & Touati (2014) highlight that governments can facilitate scaling-up investments by (1) providing a clear pipeline of concrete opportunities including precise guidelines and timelines, (2) providing greater visibility and predictability of cash flows through PPP frameworks, (3) introducing financial regulation to ensure economic and financial stability, (4) addressing market failures directly or indirectly through development banks and (5) acting as facilitators and providing credibility to
investments, in addition to providing seed funding and guarantees. The main challenge ahead for these efforts is to ensure proper PPP regulations, stability and long-term political commitment, simplified procedures and appropriate allocation of risks (Benavente Donayre & de la Torre Lastarria, 2011). Moreover, PPP regulation must be coherent. In Indonesia, there are over 45 laws and regulations governing PPPs, but they have contradictions and there are overlaps between sectors and levels of government, resulting in widespread confusion and complex administrative procedures. Consequently, while there is support for PPPs, their projects are only carried out as a last resort (Lin, 2014). At present, Latin America and the Caribbean have the most welcoming investment environment for PPPs (IDB, 2015).
With regard to drawing in larger institutional investors such as pension funds, governments need to address liquidity issues. In Colombia this was done by changing public and private pension fund legislation so that a specific percentage of their portfolio consisted of infrastructure investments, and addressed limited capital markets through the Pacific Alliance which provides coordination with neighbouring countries (Escobar, 2015). For climate mitigation projects, green bonds issued by bodies such as the World Bank can help to alleviate the liquidity issue, though, as the market is still small, there is still some reluctance to invest.
In comparison to other sectors, infrastructure projects in less developed countries scale up by sharing expertise and technical assistance from existing networks in other countries. ESR projects could also catch onto this idea, through organisations such as the Global Environment Facility (GEF),the World Bank, various development banks moving into the area of restoration and smaller NGOs working on regional and local levels.
Investors in the infrastructure sector are also entering the restoration arena, particularly where
19 Risk adjusted return – a concept that measures how much risk is involved in producing a specific return,
infrastructure and restoration can be combined. For example in Bavaria, Germany, the regional government and major electricity suppliers agreed on investments in hydropower, combined with restoration of the region’s main water bodies (Haselbauer & Gohl, 2010). In Colombia, a leading company in the pork processing industry reforested the regional watershed to reduce water shortage risks, while conserving natural vegetation (Heuberger, 2016). Infrastructure investments are increasingly occurring through dedicated fund management companies such as DIF20, who broker for
investors with a pipeline of projects through various pooled finance funds. Public funding is used to guarantee payments. These are the types of institutions that need to start operating in the field of ESR.
ESR activities are similar to other infrastructure activities, facing many of the same risks, but with slow maturity rates and potentially high net returns. There are calls for ecological infrastructure to be quantified in the same way as man-made infrastructure (Watt, 2015). However, given the lack of an ESR investment track record, the risks are still high on issues for which other sectors can draw from their own field's track record. Knowledge sharing on successful projects and government support or participation is therefore the key to scaling up investments in ESR, for example through network building.
Summary
• There are several risks which provide obstacles to clear exit strategies and therefore limit investor interest.
• Other infrastructure sectors have moved towards integrating guarantees into deals, in order to reduce risk.
• Opportunities lie in coordination mechanisms to decrease costs, which, in turn, helps to decrease investment risk. Examples are the establishment of Public-Private Partnerships, knowledge brokers and investment funds developing investment pipelines. Policy makers can help to create an enabling environment for such mechanisms (this is discussed further in Section 2.3).
2.2. Financing mechanisms to address issues
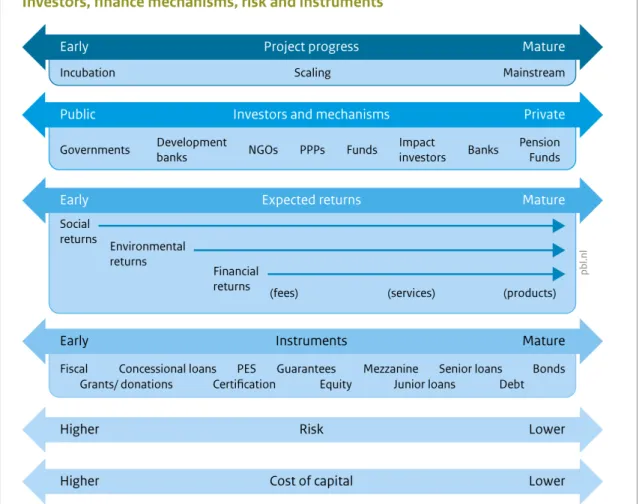
Various financing mechanisms exist, which use various instruments that can help to address finance issues. Different instruments are required for different risk profiles, timescales and expected returns (Figure 6), but they can be combined in a coordinated fashion to increase the availability of adequate and sustainable finance for ESR. They can be subdivided into
• enabling instruments, which help to reduce the cost and risk of investment in order to leverage long-term financing and guarantee social returns and
• asset instruments, which help to deliver return on investment, including more traditional instruments (equity, debt) and
• market-based instruments which help to align public and private interests (green bonds, PES, offsetting, insurance) (Elson, 2012) (Shames & Scherr, 2015).
Figure 6: Investors, investment mechanisms and expected returns
Enabling instruments are those that both aim to reduce the cost and risk of investment and enforce social returns, which is particularly important when private sector funding is used for the public restoration of ecosystems. Enabling instruments can help to improve readiness of projects for larger investments, strengthen governance and challenge damaging
development pathways, essential to the implementation of asset and market based mechanisms and therefore to the local implementation of financing for ESR. Enabling
instruments are generally managed by the public sector21 in terms of donors and guarantors,
and include:
• Grants and technical assistance - meant to reduce initial costs, these can be directed to local land users in order to support bottom-up initiatives and local knowledge and expertise;
• Fiscal incentives and law - this concerns taxes, permits and subsidies to reduce opportunity costs of restoration free-riding and leakage, and enforce public good delivery;
• Regulation - supporting the development of various instruments such as PES and PPPs, this also ensures land tenure security and law enforcement;
• Risk reduction and first loss guarantees - these are often applied by Development Finance Institutions (DFIs).
Guarantees are gaining popularity and are one of the most successful methods for development finance to mobilise private finance22 (OECD, 2015). For example, the
Development Bank of Latin America (CAF) is setting up a partial risk guarantee for private equity impact investors involved in Initiative 20x20, to reduce the risk for their investments (FAO & Global Mechanism of the UNCCD, 2015), and USAID has provided the Althelia Climate Fund with a 134 million USD risk sharing guarantee (USAID Press Office, 2014). Availability of low-cost public capital through government support can also help to leverage private capital in developing countries, by reducing upfront costs for investors, whilst also being profitable23.
Public finance plays a key role in supporting investments in ESR as public returns are often only realised in the long term24 (Bullock, Aronson, Newton, Pywell, & Rey-Benayas, 2011).
Enabling instruments allow public actors to define how private actors invest by implementing safeguards for investments. For example, publicly financed grants and partial risk guarantees can be combined to reduce the risk and cost for larger private investments such as equities and loans, though only on the condition of public good delivery. Safeguards are in place at the institutional investor level, such as the IFC’s environmental and social performance standards, the EIB Statement of Environmental and Social Principles and Standards, the Voluntary Guidelines for Responsible Governance of Tenure (VGGT) and the requirements of Free, Prior and Informed Consent (FPIC)– all of which are crucial to ensure respect for the environmental and local land tenure rights. However, lessons learned from Reducing Emissions from Deforestation and forest Degradation (REDD+) (Box 9) show that the identification and implementation of these standards and safeguards are still in development at the local level given contextual difficulties, particularly regarding the prevention of land grabbing and ensuring benefits for local stakeholders.
With asset investments being primarily the territory of private sector25 investors, asset
instruments cover:
• Traditional mechanisms such as equity and debt
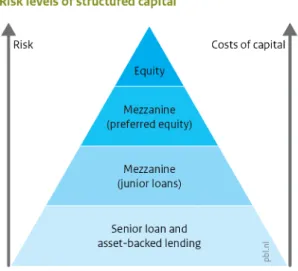
• Mezzanine and quasi-equity financing variations that lie in-between the previous two (Figure 7)
22 A DAC study showed that a total of 36.4 billion USD was mobilised from the private sector between
2012-2014 through official development finance interventions (guarantees, syndicated loans and shares in collective investment vehicles such as investment funds). Guarantees were able to mobilise the largest part (59%) followed by syndicated loans (23%) and shares (18%). Sectors targeted were energy, banking and industry, mostly in middle income countries. 19% was climate mitigation related.
23 For example, the UK Green Investment Bank expects to earn taxpayers a return of 10% in 2015.
(Koch-Weser, 2016)
24 Time lags can range from 1-2000 years, depending on the aim and scale of the particular restoration
activities (Gradinaru, 2014).
‘Innovative’ market based instruments can help to align public and private interests, including PES schemes, carbon offsetting schemes, Debt-for-Nature swaps26, Green Bonds,
and certification. These all help to increase the availability of financing through the monetisation of public goods such as water and carbon, and provide extra liquidity to investors. These mechanisms can be applied on a one-off basis or recurrently.
Market based incentives, such as Payment for Ecosystem Services (PES) schemes, can help to generate local financing while certification27 may help to integrate the cost of public good
provisioning into prices. Green bonds can help to provide immediate and long-term returns in efforts to attract larger institutional investors. However, while there is a move towards a greater use of market-based mechanisms, most of these instruments, except certification, are not fully developed yet or are only suitable for the later, lower risk stages of ESR projects. This is case of green bonds28, which borrow against future savings (Watt, 2015).
Nevertheless, with the observation that the green bond market for environmentally-friendly investments reached 50 billion USD in 2014 (The Economist, 2014), opportunities for the development of restoration bonds are favourable.
Often a combination of financing instruments is required as different ecosystem services are likely to require different mechanisms to deliver investment returns. For example, where physical products are obtained, such as timber, crops and non-timber forest products,
26 such as the one established between Brazil and the USA, which involved swapping 21 million USD of
debt in exchange for Atlantic Forest restoration
27 Such as the Forest Stewardship Council (FSC) where certified producers
“should complement the management of, reduce pressures on, and promote the restoration and conservation of natural forest” (FSC, 2010)
28 Green Bonds require larger deal sizes starting from 100 million USD upwards, and depend on strong
credit ratings. More accessible versions include TNC’s Nature Conservation Notes (Credit Suisse & McKinsey Center for Business and Environment, 2016)
Figure 7: Structured capital can be implemented at different risk and capital cost levels. For higher risk levels, senior loans and asset-backed lending are favoured, posing an issue for ESR projects with lack of collateral in the early stages of execution or where there is a lack of clear property rights and tenure. Source: (OECD, 2014)