A STUDY ON THE CONSTRUCTION OF
FAIR ORIENTEERING MAPS
Word count: 21,962
Jari De Pauw
Student number: 01408978Supervisor: Prof. Dr. Dries Goossens
Master’s Dissertation submitted to obtain the degree of:
Master in Business Engineering: Operations Management
Deze pagina is niet beschikbaar omdat ze persoonsgegevens bevat.
Universiteitsbibliotheek Gent, 2021.
This page is not available because it contains personal information.
Ghent University, Library, 2021.
I
Foreword
This dissertation has been the final challenge in order to obtain my Master’s Degree in Business Engineering at Ghent University. I would like to take this opportunity to thank everyone who has stood by my side in the past years and especially in the past months.
I would like to start by thanking Prof. Dr. Dries Goossens for giving me the opportunity to work on this interesting topic as well as for the profound feedback and insights he has provided me during the past months. Also, I would like to express my gratitude to David Van Bulck, who has been there to help me at any point in time over the past months. I could count on his assistance for feedback, guidance and support whenever I felt the need for it. Without the hours of work that he spent on helping me, I would not have been able to present my work as it is today.
Thirdly, I would like to thank Prof. Dr. Yasemin Arda from the HEC Management School in Liege. Not only for the interesting courses I have been able to follow during my academic year of studying in Liege, but in particular for taking the time and making the effort of reading my dissertation.
In between the endless hours of work over the past months, I have always been able to count on my amazing friends, encouraging family and fantastic girlfriend who have never stopped supporting me. They were there for me whenever I needed them and helped me through all the difficult periods.
Lastly, I would like to thank in particular the person who has, during my five years of studying, believed in me more than anyone else. My dad, who could not be more proud of what I had already achieved in my early life, can unfortunately no longer be here to see me graduate from my academic life and take my first steps in my professional career. Dad, this one is for you.
II
Table of Contents
Foreword... I Table of Contents ... II List of Used Abbreviations... IV List of Figures ... V List of Tables ... VI
1. Introduction ... 1
2. Background ... 3
2.1. Alternative ways to play orienteering ... 4
2.2. Orienteering in Belgium ... 5
2.3. What makes a good participant? ... 5
3. Problem Formulation ... 7
3.1. The sports orienteering problem ... 7
3.2. Fair orienteering map construction problem ... 8
4. Literature Review ... 9
4.1. (Team) Orienteering problem ... 9
4.1.1. Related problems ... 9
4.2. Deterministic vs. stochastic setting ...10
4.2.1. Deterministic setting ...10
4.2.2. Stochastic setting ...12
4.3. Fairness ...16
4.3.1. Solution approaches ...17
4.3.2. Equality measures and equality axioms ...18
Equality measures ...18
Equality axioms ...20
4.3.3. Fairness and equality in operations research ...22
Fairness in VRPs ...22
Fairness in sports orienteering problems ...25
Fairness in team orienteering problems ...26
5. Analysis of Orienteering Maps ...29
5.1. Organisational fairness in orienteering ...29
5.2. Real-life problem instances ...30
5.3. Fairness: influence of physical skills ...32
III
5.3.2. Exploratory analysis ...34
5.4. Fairness: influence of navigational skills ...36
5.4.1. Heuristics ...36
Knapsack-based heuristic ...37
Improvement steps ...38
5.4.2. Exploratory analysis ...39
6. Improvement of Orienteering Maps ...41
6.1. Bi-objective optimization ...41
6.2. Local search heuristic ...42
6.2.1. Neighbourhood definition ...43
6.2.2. Perturbations ...44
6.3. Results ...45
7. Limitations and Future Research ...50
7.1. Additional organisational preferences ...50
7.2. High computation times for the ILP...51
7.3. Stochasticity in travel times ...52
7.4. Discussion of the knapsack-based heuristic & improvement steps ...52
7.5. Disqualification vs. penalty for exceeding the time limit ...53
7.6. Analysis of local search heuristic results...53
8. Conclusion ...54 List of References ... IX Appendix A: Text File Structure ... XIV Appendix B: Discussion of the Heuristic ... XV Appendix C: Measures for Path Similarity ... XVIII
IV
List of Used Abbreviations
ABSO Association Belge des Sports d’Orientation BOF British Orienteering Federation
BTOP Bi-objective Team Orienteering Problem BVOS Belgische Vereniging voor OriëntatieSporten
CA Common Arcs
CN Common Nodes
FRSO Fédération Régionale des Sports d’Orientation ILP Integer Linear Program
IOF International Orienteering Federation
ISOM International Specification on Orienteering Maps LCS Longest Common Subsequence
LD Levenshtein Distance MAD Mean Absolute Deviation
OEM Original Equipment Manufacturer
OPSP Orienteering Problem with Stochastic Profits
OPSTS Orienteering Problem with Stochastic Travel and Service times
PD Pigou-Dalton
POI Point Of Interest
SSD Sum of Squared Deviations
SSTSP Stochastic Selective Travelling Salesman Problem STSP Selective Traveling Salesman Problem
TCTSP Time-Constrained Traveling Salesman Problem TD-OP Time-Dependent Orienteering Problem
TD-OPSWTW Time-Dependent Orienteering Problem with Stochastic Weights and Time Windows TD-OPTW Time-Dependent Orienteering Problem with Time Windows
TSP Travelling Salesman Problem
UK United Kingdom
VNS Variable Neighbourhood Search VRP Vehicle Routing Problem
V
List of Figures
Figure 1: Orienteering map with 20 control points ... 3
Figure 2: VRP solution with equal workload division ...23
Figure 3: VRP solution in accordance with the proportional fairness approach ...24
Figure 4: Orienteering map with 20 control points ...31
Figure 5: Influence of the speed factor (x-axis) on the highest attainable score (y-axis) ...34
Figure 6: Actual vs. desired impact of a participant’s speed on the highest attainable score (in absolute numbers) ...35
Figure 7: Actual vs. desired impact of a participant’s speed on the highest attainable score (in % of the gap) ...35
Figure 8: Pseudocode of the knapsack-based heuristic ...37
Figure 9: Impact of navigational skills on a participant’s expected (actual) result ...39
Figure 10: Impact of navigational skills on a participant’s expected (actual) and desired result ...40
Figure 11: Illustration of a local minimum in the local search heuristic ...42
Figure 12: Pseudocode of the local search heuristic ...43
Figure 13: Algorithm of the generation of a neighbour solution ...44
Figure 14: Illustration of a solution perturbation ...44
Figure 15: Algorithm of the perturbation of a solution ...45
Figure 16: Orienteering map with 15 control points ...46
Figure 17: Objective function values over the 600 iterations ...47
Figure 18: Influence of speed on the highest attainable score in an existing orienteering map ...48
Figure 19: Influence of speed on the highest attainable score in an improved orienteering map ...48
Figure 20: Influence of navigational skills on a participant’s actual and desired result in the existing orienteering map ...49
Figure 21: Influence of navigational skills on a participant’s actual and desired result in the improved orienteering map ...49
Figure 22: Histogram showing the number of occurrences of maps with a certain amount of control points ...51 Figure 23: Instance of a text file used in our program ... XIV Figure 24: Orienteering map with 22 control points ... XV Figure 25: Orienteering map with an initial solution generated by a knapsack-based algorithm ... XVI Figure 26: Orienteering map with an improved solution generated by the new knapsack-based algorithm
VI
List of Tables
Table 1: Illustrative result of an orienteering event ... 4 Table 2: Overview of stochastic variants of the orienteering problem ...14 Table 3: Workload levels per actor to illustrate min-max fairness ...17 Table 4: Workload levels per vehicle in two alternative scenarios to illustrate range as an equality
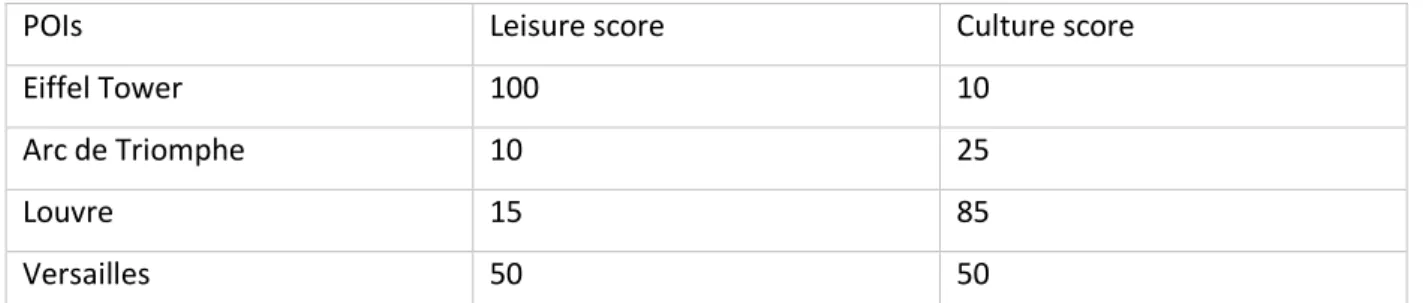
measure ...18 Table 5: Equality measures and their respective properties...21 Table 6: Bi-objective optimization example for a trip to Paris showing leisure and culture scores for four
POIs ...27 Table 7: An original solution with a subset of its neighbour solutions ...43 Table 8: Changes in control point scores for a particular instance ...47
1
1. Introduction
Orienteering is a sports activity with roots going back to the late 19th century1. While being very famous in Scandinavian & Western European countries such as Finland, Sweden and the United Kingdom, orienteering can be played anywhere as long as the outdoor conditions allow it. The standard version of orienteering has as a goal to run an outdoor route as quickly as possible. Compared to traditional running races where the course is clearly marked by signals and/or barriers, orienteering is characterised by the fact that participants have to navigate themselves with only a map and a compass and move from one control point to another. This leads to the fact that on top of physical skills (speed, stamina, etc.), participants should also be able to quickly navigate themselves in the most efficient way through sometimes rough and hilly terrains.
This dissertation will work with a specific variant of orienteering called score orienteering where the goal is no longer limited to completing a route in a minimum amount of time. The organiser will now set a time limit within which all participants have to be present at the finishing point. This time limit will be set in a way so that (usually) not all of the control points can be visited. Moreover, each control point will now be assigned a score that a participant receives when passing it. The navigational skills of participants are now not only limited to positioning themselves on a map and using a compass, but each runner is also required to determine his or her own route that will contain a subset of the control points in any order. The decision of which control points to visit in which order will thus have a big influence on a participant’s result. The word score is often omitted when talking about score orienteering in academic research, which has caused orienteering and score orienteering to become two interchangeable terms. For the remainder of this dissertation, we will follow this naming convention from the literature and refer to score orienteering by simply calling it orienteering. Each participant of an orienteering race will be confronted with the following puzzle at the start:
Which is the ideal route that I should attempt to run, given my physical abilities and the given time limit?
Although this question might not look very peculiar, it is a question that has inspired many researchers to turn it into a mathematical problem, labelled the orienteering problem. In this dissertation, we will use the term sports orienteering problem if we specifically aim to talk about the orienteering problem in a sports setting. When we simply want to refer to a problem with the same underlying characteristics, we will use the term orienteering problem.
2 This dissertation has as a main goal to pioneer in research on fairness in orienteering events seen from the point of view of the organisers. We will define a new problem labelled the fair orienteering map
construction problem where control points’ scores will be considered as variable. Whereas academic
research has already been done on finding optimal routes in orienteering (e.g. Vansteenwegen, Souffriau, & Van Oudheusden (2011)) and discussing fairness in related problems (e.g. Matl, Hartl, & Vidal (2017)), we believe that this is the first study that looks specifically at formulating and optimizing fairness measures for real-life orienteering events from an organiser’s standpoint. More specifically, we will construct a data-driven tool (programmed in Julia) that incorporates fairness into orienteering maps by setting the control points’ scores as variable. This tool can be used in a descriptive way to validate existing maps and compare them with benchmarks set by an organiser. Furthermore, the tool will also be able to improve current maps by using a local search heuristic and consequently improving two fairness measures. Due to the computational complexity of our problem, we will be limited to working with orienteering maps of 25 control points or less. In the chapter on Limitations and Future Research, we will discuss how our theory can be applied to maps with a higher number of nodes as well.
Since we have not been able to build our analysis on any previously done research on this particular topic, it was necessary to first define the new problem in detail. We further believe that the value of this dissertation can be found in more than just the analytic and improvement chapters. We will provide an extensive literature review that goes well beyond our specific problem where we will touch concepts that have the potential of being significant for future research. Concretely, we will address stochasticity in parameters of the orienteering problem and we will look deeper into the concept of fairness.
The remainder of this dissertation will be structured as follows. In the next chapter, additional background information will be given on orienteering, such as game rules and essentials of a good participant. Next, the problem formulation will shed more light on the actual problem that this dissertation tackles. An extensive literature review is then provided that should allow the reader to gain more information on the topics of fairness and stochasticity in general as well as applied to the orienteering problem. After that, a chapter on the analysis of orienteering maps will disclose algorithms (ILP & heuristics) and numeric measures to be used in the subsequent chapter on improving orienteering maps. Finally, a chapter on limitations and future research opportunities as well as a conclusion will be formulated. The bibliography and appendices will conclude this dissertation.
3
2. Background
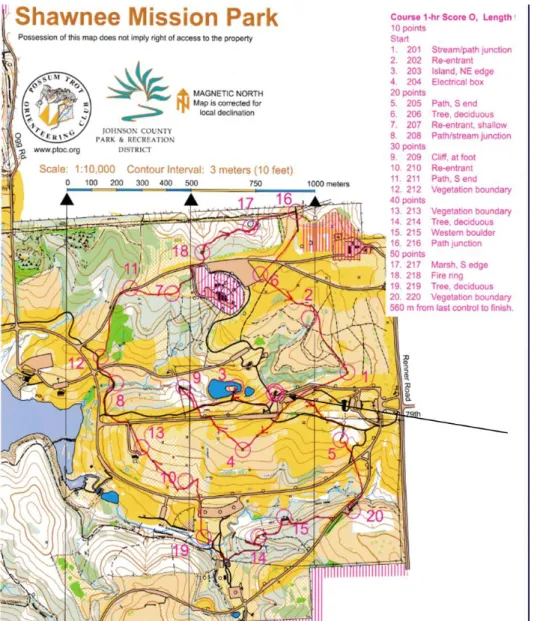
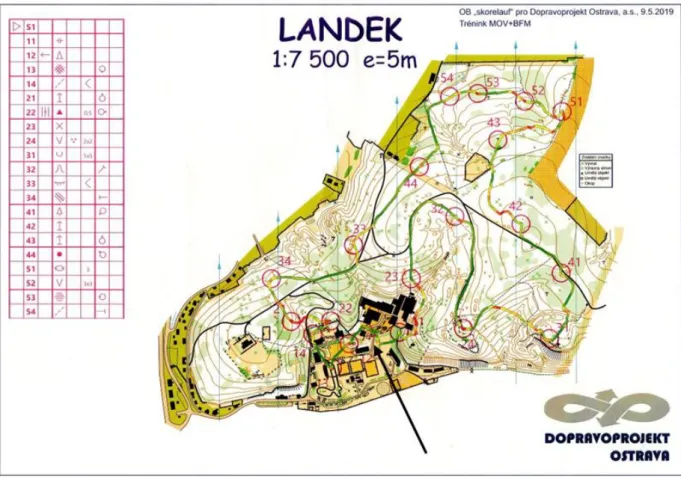
Over the years, organisations have taken the responsibility of standardizing many aspects of the sport over country boundaries. The way orienteering maps are portrayed, with a set of symbols and colours, is mainly standardized by the International Orienteering Federation (IOF). Consider Figure 1 below as an illustration of an orienteering map.
Figure 1: Orienteering map with 20 control points2
This map displays two main parts: the geographic visualisation of the running area on the left and a table with the scores attached to the control point numbers on the top right. The table with scores may be omitted on orienteering maps if the numbers next to control points on the map immediately indicate the attached scores. Because of the visual similarity between an orienteering map and graphs, we will also
4 use the terms nodes and arcs to describe control points and the routes between them. Control points are depicted on an orienteering map as circles with a single edge. Starting points are depicted as a triangles and finishing points as circles with a double edge. In many cases, however, the starting and finishing point of an orienteering event are at the same location (on Figure 1, the starting/finishing point is indicated with an arrow).
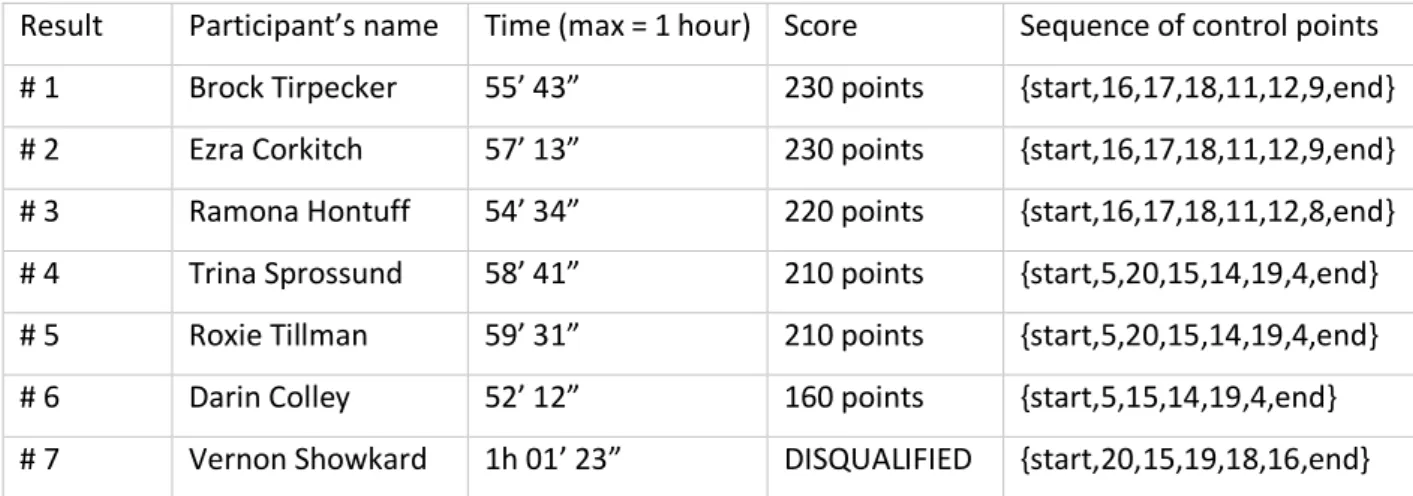
An orienteering map will be positioned with the magnetic north on the upside and with a scale given next to the map. Furthermore, each colour on the map represents a certain underground or the presence of water or roads. More rules and conventions of orienteering can be found on the website of the IOF3. The participant that finishes a race with the highest score and within the time limit will be declared as the winner. In the case of a tie in scores between participants, he or she with the lowest time will be selected. The organiser of a race decides in advance whether or not an exceedance of the time limit leads to a disqualification or a score penalty. We will assume throughout this dissertation that exceeding this limit is not allowed and leads directly to a disqualification. In real life, both sanctionary options are prevalent. For the orienteering map of Figure 1, the result may then look like this:
Result Participant’s name Time (max = 1 hour) Score Sequence of control points # 1 Brock Tirpecker 55’ 43” 230 points {start,16,17,18,11,12,9,end} # 2 Ezra Corkitch 57’ 13” 230 points {start,16,17,18,11,12,9,end} # 3 Ramona Hontuff 54’ 34” 220 points {start,16,17,18,11,12,8,end} # 4 Trina Sprossund 58’ 41” 210 points {start,5,20,15,14,19,4,end} # 5 Roxie Tillman 59’ 31” 210 points {start,5,20,15,14,19,4,end} # 6 Darin Colley 52’ 12” 160 points {start,5,15,14,19,4,end} # 7 Vernon Showkard 1h 01’ 23” DISQUALIFIED {start,20,15,19,18,16,end}
Table 1: Illustrative result of an orienteering event4
2.1. Alternative ways to play orienteering
So far, we have portrayed orienteering in the way it is usually played, namely by running a course within a reasonable time limit. While this is the most common form, several variants exist as well. Apart from realizing the course by foot, the use of mountain bikes could be allowed as well. In this case, we speak of
mountain bike orienteering. In addition, ski orienteering and even canoe orienteering are existing forms
that are popular in certain geographic areas.
3https://orienteering.sport/
5 An alternative to playing orienteering in daylight hours is called night orienteering. Here, an additional difficulty of reduced vision is present during the race. Significant variability may further exist in the time limits that are set by the organisers. Whereas most orienteering events have a time limit between 30 minutes and 2 hours, exceptions exist where time limits run up to 24 hours. A last, well-known variant is called rogaining. Rogaining has its name from the three people who created it, namely Rod Phillips, Gail Davis and Neil Phillips.5 Rogaining is characterized by the fact that it is usually played in teams of 2-5 people, with a high time limit (24 hours in championships) and long distances.6
2.2. Orienteering in Belgium
Whereas orienteering is a popular sport in Scandinavian countries and the UK, the same thing cannot be said about orienteering in Belgium. The Belgian Orienteering Federation ABSO-BVOS is the national federation that is recognized by the IOF. Furthermore, Orienteering Vlaanderen and Fédération Régionale des Sports d’Orientation (FRSO) are two bodies that coordinate orienteering clubs and athletes in respectively Flanders and Wallonia. On the websites of both federations, it can be found that a total of 2800 orienteering players are affiliated with an orienteering club in Belgium. These players are further spread over a number of regional clubs (e.g. Antwerp Orienteers, CO Liege, …).
2.3. What makes a good participant?
The most important skills for orienteering can be grouped into two categories: physical and navigational skills. By physical skills, we mean speed-related abilities such as a runner’s maximum speed and his or her stamina. Basically, all physical aspects that may influence the time in which a participant is able to run a certain sequence of control points fall under the category of physical skills. Navigational skills, on the other hand, contain map reading skills, compass use and the decision of which control points to visit. On some schools, orienteering is therefore a popular way of increasing kids’ map reading and compass use skills (Kobayashi, 2019). In competitive orienteering races there will generally no longer be a difference in skills of map reading and compass use. Rather, the key difference between participants will lie in the decision of which route to run during an event.
These two skills will be decisive for orienteering participants in order to win a race. If a participant has both superior physical and navigational skills, he or she is expected to win the orienteering race. However, if a participant outperforms all the others in only one skill category, we are no longer able to predict who will be the winner. It becomes clear that a certain trade-off is present for these two sets of skills.
5 Source: website of the Setanta Orienteers (http://setantaorienteers.org/)
6 Apart from physical and navigational skills, there are countless other elements that play a role in an orienteering event. Material elements such as appropriate sports gear and suitable lighting (in case of night orienteering) will have a positive impact on a participant’s result. Weather conditions such as rain, heavy wind or hail will change the development of a race. As in any other sport, luck will play a particular role as well. Even though these are all elements that affect the course of a race, they will not be considered in this research.
7
3. Problem Formulation
Like in many sports events, two main parties can also be discerned in orienteering: the participants on the one hand and the organiser on the other hand. This chapter describes these two different points of view on the sports orienteering problem and allows the reader to precisely understand the problem that this dissertation will further deal with.
3.1. The sports orienteering problem
All participants in an orienteering event are provided with a map and a compass, where the map contains a number of nodes (control points) and a related score. The orienteering map is a given piece of input for these participants and their goal is to create the best possible route within the time limit. When we look at the set of nodes and consider the arcs in between them as well, we can say that G = (N,A) is a directed graph where N = {1, …, |N|} is the set of nodes, |N| represents the finishing node and A the set of arcs. The set of arcs (A) consists of all pairs {i,j} ∀ 𝑖, 𝑗 ∈ 𝑁, 𝑖 ≠ 𝑗. In the case of the sports orienteering problem, each node has all the other (unvisited) nodes as potential next destinations. Hence, we are able to say that the sets of nodes and arcs represent a complete graph, denoted as 𝐾|𝑁|. From the point of view of a participant, the sports orienteering problem can intuitively be summarized as follows:
Input All the data that is provided by the organiser to participants or that can be derived from it.
• A complete graph 𝐾|𝑁|, consisting of |N| nodes and |N|* (|N| - 1) arcs • A starting point (node 1) and a finishing point (node |N|)
• A score 𝑠𝑖 ≥ 0, ∀ 𝑖 ∈ 𝑁
• An arc weight representing an estimation of the travel times 𝑡𝑖𝑗 ∀ {𝑖, 𝑗} ∈ A • A time limit 𝑇𝑚𝑎𝑥 set by the organiser
Output A maximal scoring path starting at node 1 and finishing at point |N| such that:
• The constructed path contains each node at most once
• The total weight of the arcs defining the path is smaller than or equal to 𝑇𝑚𝑎𝑥
So far, the intuitive approach of the sports orienteering problem above suffices to understand the needs and constraints of participants. In Chapter 5, this model will be shown mathematically as an Integer Linear Program (ILP).
8
3.2. Fair orienteering map construction problem
For the organiser of an orienteering event, the goal is not the same as for a participant. Everything that is seen as input data for the participants is produced or decided by the organiser. The very first decision that any organiser has to make is to choose the wide area where the orienteering event will take place. Common choices for orienteering events are forests or mixed terrain undergrounds. Based on physical limitations, the organiser is then able to come up with a starting/finishing point and a set of positions to place control points with an attached score. These physical limitations include the presence of water or mud, very steep undergrounds, etc. and make it impossible for organisers to set up a safe control point there.
Although the decision of where exactly to place these control points will have an influence on the fairness of an orienteering event, we will consider this as being out of the scope of our research and assume that an organiser has already decided on the locations of all control points. Based on this set of locations, a matrix can be derived containing all the estimated travel times from one control point to another. These travel times will be correlated to the distance between two nodes, but terrain conditions, barriers, etc. will affect their actual values. Furthermore, the travel times will usually not be symmetric, since a downhill track will be run faster than the reverse, uphill track.
Both the set of control points and the travel times matrix can be used by the organisers to come up with the final orienteering map. One last, very important decision has to be made before this map is complete: Each control point should be associated with a score that can be obtained when passing it. This decision will directly influence the fairness and competitiveness of an orienteering event and thus whether both navigational skills and physical skills are required. Therefore, this assignment of scores to control points will be the center of our research. In later chapters, it will get more clear how we view fairness in orienteering events and how it is influenced by this score assignment.
In Chapters 5 and 6, we will focus entirely on the point of view of the organiser that can be an international federation, a sports club, a single person, etc. The orienteering map has to be new for every event so that no unfair advantage can be attained by any of the participants (e.g. using a computer to find optimal routes). In order to make the race fair and competitive, the creation of a good map is therefore of prime importance.
9
4. Literature Review
4.1. (Team) Orienteering problem
While the sport of orienteering has its long history, no such thing can be said about the studies on the orienteering problem in operations research. The first papers on the subject of the orienteering problem only appear near the end of the 20th century, with Tsiligirides (1984), Hayes & Norman (1984) and Golden, Levy, & Vohra (1987) laying the groundwork for later heuristic and exact algorithm development. While these works provide rather basic and preliminary heuristics, they were the first ones to discover the potential of this problem when applied to comparable business cases.
Adams (1972) and Kirby (1970) are seen as the first research papers that lay out the basics of orienteering as well as any requirements, strategies & benefits. Adams (1972) specifically states that the balance between physical and mental efforts required for orienteering make it a great tool to be used in schools. Kirby (1970) presents similar advantages: increased map-reading abilities, an eye for the countryside, an appreciation of scale and of map content and accuracy and gaining understanding in concepts such as traversing and position resection (resection refers to determining your current position). Furthermore, he emphasizes the fact that it can be viewed as a map-reading activity rather than as a sport.
Apart from the orienteering problem, academics have also considerably described and analysed the team
orienteering problem. Although this is no longer based on an actual sports discipline, it forms an
interesting operations research problem. The team orienteering problem follows the same principles as the orienteering problem, except that people within the same team can now make individual routes, where the same nodes cannot be visited by team members. More details on the team orienteering problem can be found in Chao, Golden, & Wasil (1996b), Vansteenwegen et al. (2011) and Archetti, Hertz, & Speranza (2007).
4.1.1. Related problems
Vansteenwegen et al. (2011) state that the orienteering problem is in fact a combination of two well-known problems from the operations research field: the travelling salesman problem and the knapsack problem.
The Travelling Salesman Problem (TSP) is a straightforward but NP-hard problem that has attracted a lot of research over the past decennia (e.g. Laporte (1992a) and Rego, Gamboa, Glover, & Osterman (2011)). The concept of the TSP is simple: “A salesman is required to visit once and only once each of n different cities starting from a base city, and returning to this city. What path minimizes the total distance travelled by the salesman (Bellman, 1962)?”
10 The knapsack problem is, like the TSP, also an NP-hard problem that is described by Pisinger (2005) as follows: “We are given a set of n items, each item j having an integer profit 𝑝𝑗 and an integer weight 𝑤𝑗. The problem is to choose a subset of the items such that their overall profit is maximized, while the overall weight does not exceed a given capacity c.”
Despite the fact that the orienteering problem is similar to the TSP in many ways, some differences can be noted. Whereas the TSP requires every node to be visited, the orienteering problem often only allows for a subset of nodes to be visited. This implies that a time limit is a prerequisite in the orienteering problem. Furthermore, all nodes will have attached scores that create differences in attractiveness of visiting each node. The knapsack problem, on the other hand, is intrinsically based on the trade-off between profit and weight, where profit and weight can be compared to scores and travel times in the orienteering problem. The trade-off is thus between the attractiveness of a node with a certain score and its distance away from a particular location.
Because of the similarities with these problems, the orienteering problem may be found in the literature under different names as well: Selective Traveling Salesman Problem (STSP, e.g. Gendreau, Laporte, & Semet (1998)) and Time-Constrained Traveling Salesman Problem (TCTSP, e.g. Teng, Ong, & Huang (2004)) are two alternative names often used in the literature.
4.2. Deterministic vs. stochastic setting
The majority of published works on the orienteering problem take a deterministic view on all aspects of the optimization problem (deterministic setting). By this, it is meant that travel times between two nodes, scores assigned to all nodes and, if applicable, service times are known and fixed parameters. Having no stochastic parameters in an optimization model reduces the level of difficulty and allows the application of wide-spread algorithms and (meta)heuristics. On the other hand, stochastic programming techniques have advanced strongly over the years (Shapiro, Dentcheva, & Ruszczyński, 2009) and allow the mapping of a more realistic version of a problem. In some business applications, stochastic travel times make more sense than deterministic travel times.
4.2.1. Deterministic setting
Researchers have already formulated many exact algorithms and (meta)heuristics for solving the orienteering problem. Vansteenwegen et al. (2011) and Gunawan, Lau, & Vansteenwegen (2016) both summarize numerous algorithms as well as benchmark instances and applications that are prevalent. Two of the first notable heuristics for the orienteering problem can be found in Tsiligirides (1984), where both a stochastic (S-algorithm) and a deterministic (D-algorithm) method have been formulated. For the S-algorithm, a desirability level is assigned to all nodes that have not yet been visited. The desirability level
11 for each node takes into account the score of that node and the cost (distance, time, …) of travelling from the previous node to this one. Keller (1989) summarizes the remainder of the S-algorithm as follows: “The four nodes with the highest desirability values are subsequently identified and normalised so that their sum equals unity. A randomly generated number between 0 and 1 determines which of the four nodes gets selected as the next node visited.” This procedure will go on until no more nodes can be added to the route due to the time limit.
Opposed to the S-algorithm, the D-algorithm of Tsiligirides (1984) is not subject to randomness. Keller (1989) states that this algorithm first divides the whole area into sections. The D-algorithm then provides us with a set of rules that will lead to an initial route by constraining this route to be built up in a specific sector (Tsiligirides, 1984). For more details on these rules and division of the area into sections, we would like to refer the reader to the full paper.
Tsiligirides (1984) then applies a route improvement step consisting of three different approaches to the solutions of the D-algorithm and the S-algorithm. First, the position of two nodes in the final sequence may be interchanged which will logically not cause any change in the total score. If the total travelling time decreases, then the change is allowed. Second, a new node may be inserted in the existing sequence, without removing another node. This will always improve the total score (if all nodes have positive scores). If the total travelling time is still below the time limit, the insertion is made. Last, a node may be inserted in exchange for removing another node. If the new, total score is higher than the old score and the travelling time remains under the time limit, the change is made.
Closely after Tsiligirides (1984), Golden et al. (1987) provided us with a center of gravity heuristic for the orienteering problem. Their heuristic exists of three steps: a route construction step, a route improvement step and a center of gravity step. This last step is an iterative process based on a ratio formed by the division of a node’s score and the distance from a node to the route’s center of gravity. In each iteration, nodes are selected in decreasing order of this ratio. This heuristic is based on the knapsack problem (Keller, 1989) and is fairly simple to understand and implement. A comparison of the S-algorithm, D-algorithm and center of gravity heuristic can also be found in Keller (1989).
Vansteenwegen et al. (2011) provide us with an overview of the most significant algorithms and heuristics between 1984 and 2010. Gunawan et al. (2016), on the other hand, extend this overview by also providing us with the improvement of heuristics and exact algorithms in the timespan between 2010 and 2016. Although these two papers are aimed at describing the deterministic orienteering problem, they both briefly mention the existence of stochastic variants. Whereas Vansteenwegen et al. (2011) introduce the Orienteering Problem with Stochastic Profits (OPSP), Gunawan et al. (2016) talk about stochasticity in travel times. We briefly outline the stochastic methods in the next section.
12
4.2.2. Stochastic setting
Stochasticity in the orienteering problem has only been looked at by few researchers (Verbeeck, 2016) and is therefore still mostly an unexplored area of study. The research that has already been conducted can be split up in two parts: research on stochasticity in travel and service times on the one hand and research on stochastic profits on the other hand.
Stochastic travel and service times The orienteering problem can be represented as a set of nodes and arcs, where the nodes represent physical locations and the arcs represent the shortest routes between them. The distances or time periods of these routes are usually represented by fixed numbers and it is assumed that no deviations are allowed or expected. In most real-life orienteering applications, however, travel times can impossibly be seen as fixed. Two reasons why stochastic travel times can be useful in sports orienteering are:
- A first route is made in the head of the participant in the beginning of the race. The participant cannot know yet from the beginning how hard the course will exactly be (uphill, downhill, rough terrain, etc.). Furthermore, it is impossible to predict perfectly how much energy you will have left near the end of the game.
- The participant and the track are subject to sudden incidents, including injuries, mistakes in orientation and extreme weather conditions.
Service times, on the other hand, are meant to represent the time needed at every node. In the sports orienteering problem, service times will often be negligible. Each time a participant passes a control point, this must be checked in some kind of way. Nowadays, competitive orienteering events often work with an electronic punching system (Emit eCard system) where service time is negligible. However, if we purely consider the orienteering problem as an optimization problem, service times may be applicable. An interesting example that shows the value of service times can be found in Golden et al. (1987) and concerns the fuel delivery problem to a large number of customers on a daily basis. In this problem, a higher score will be assigned to nodes where the fuel inventory level is lower (indicating a higher urgency level). In an example like this, it may be interesting to take service times into account, since a lower inventory level will be correlated with a longer service time (if the inventory level is lower, it will take more time to fill the tank up to a predetermined level).
Campbell, Gendreau, & Thomas (2011) have analysed and solved the Orienteering Problem with Stochastic Travel and Service times (OPSTS) and found exact solution methods for three specific cases, each case with a different set of assumptions. For the assumptions and solution approaches, we refer the reader to the respective section in Campbell et al. (2011). For the general case, they have developed a Variable Neighbourhood Search (VNS) heuristic and analysed the results in detail. Teng et al. (2004)
13 labelled this problem the Time-Constrained Traveling Salesman Problem with stochastic travel and service times (TCTSP) and consequently analysed and solved this problem. Compared to the OPSTS, Teng et al. (2004) used only discrete variables for travel and service times in the TCTSP and were able to solve problems with a maximum of 35 nodes.
From the moment we make the switch from deterministic towards stochastic travel and service times, we have to take into account the possibility of exceeding the predetermined time limit by including a penalty. In a deterministic setting, we could easily verify whether or not a tour would satisfy the hard constraint that is the time limit. In the stochastic counterpart, a trade-off will have to be made that takes into account the risk of exceeding that time limit. Tang & Miller-Hooks (2005) discuss the Stochastic Selective Travelling Salesman Problem (SSTSP)7, which is similar to the OPSTS in most aspects. One difference between the OPSTS and the SSTSP lies in how the penalty is included in the model. Tang & Miller-Hooks (2005) include the penalty via a chance constraint into the SSTSP, meaning that routes where the expected duration exceeds a certain, pre-agreed threshold are excluded from the model. In the OPSTS, the economic cost is taken into account for setting the penalty, for instance as a fraction of the reward.
Papapanagiotou, Weyland, Montemanni, & Gambardella (2013) provide an extension of Campbell et al. (2011), more specifically by going deeper into the objective function. Where Campbell et al. (2011) use an exact approach of the objective function, Papapanagiotou et al. (2013) make use of Monte Carlo sampling. Monte Carlo sampling is a method that repeatedly relies on random sampling in order to find a numerical result. In this specific case, the authors created matrices in advance that were filled with precomputed samples for the travel and service times. Papapanagiotou et al. (2013) state that the Monte Carlo sampling method in the OPSTS considerably speeds up the process of solving the problem with only a minimal error. In Papapanagiotou, Montemanni, & Gambardella (2014), an extension is provided for Papapanagiotou et al. (2013) including a hybrid version of both the exact method of Campbell et al. (2011) and Monte Carlo sampling.
Fomin & Lingas (2002) introduced a new group of problems called Time-Dependent Orienteering Problems (TD-OP). Time-dependency refers to the situation where travel times from one node to another will depend on the start moment. While time-dependency is less applicable to orienteering in the context of being a sport, it can be highly useful for other applications. One example that is often used to illustrate time-dependency is the influence of time on road congestion (peak hours).
7 Some authors use the terms Selective Travelling Salesman Problem (STSP) and orienteering problem
interchangeably. Other authors state that the STSP must, unlike the orienteering problem, have the same starting and finishing point. Here, the terms are used interchangeably.
14 Verbeeck (2016) provides us with insights and algorithms for three specific versions of the time-dependent orienteering problem. First, he considers the basic time-time-dependent orienteering problem where travel times take into account time periods (e.g. morning peak, evening peak) and arc categories (e.g. always busy roads, roads with a morning peak). Consequently, he provides a mathematical formulation and an ant colony optimization algorithm (an algorithm based on the behaviour of ants, who are capable of finding the shortest paths between their nest to a food source (Dorigo & Gambardella, 1997)). Next, Verbeeck (2016) also analyses and provides algorithms for the Time-Dependent Orienteering Problem with Time Windows (TD-OPTW) and the Time-Dependent Orienteering Problem with Stochastic Weights and Time Windows (TD-OPSWTW), where stochastic weights simply refers to stochastic travel times.
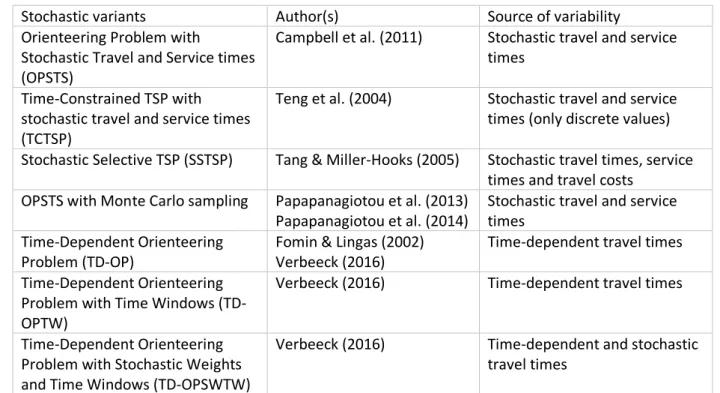
An overview of the stochastic variants that have been discussed in this section can be found in Table 2. For more information on any of the variants, we would like to refer the reader to the corresponding papers.
Stochastic variants Author(s) Source of variability
Orienteering Problem with
Stochastic Travel and Service times (OPSTS)
Campbell et al. (2011) Stochastic travel and service times
Time-Constrained TSP with stochastic travel and service times (TCTSP)
Teng et al. (2004) Stochastic travel and service times (only discrete values) Stochastic Selective TSP (SSTSP) Tang & Miller-Hooks (2005) Stochastic travel times, service
times and travel costs OPSTS with Monte Carlo sampling Papapanagiotou et al. (2013)
Papapanagiotou et al. (2014)
Stochastic travel and service times
Time-Dependent Orienteering Problem (TD-OP)
Fomin & Lingas (2002) Verbeeck (2016)
Time-dependent travel times Time-Dependent Orienteering
Problem with Time Windows (TD-OPTW)
Verbeeck (2016) Time-dependent travel times
Time-Dependent Orienteering Problem with Stochastic Weights and Time Windows (TD-OPSWTW)
Verbeeck (2016) Time-dependent and stochastic travel times
15
Stochastic profits To the best of our knowledge, Ilhan, Iravani, & Daskin (2008) are the first to introduce
stochasticity into the profits of an orienteering problem. Although this OPSP (Orienteering Problem with Stochastic Profits) is no longer relevant for orienteering in the context of being a sport, it can be relevant for other practical applications. The goal of the OPSP is no longer to maximize the total score, but rather the probability of collecting more than a predefined target profit level is maximized (Gunawan et al., 2016). Except for both the starting node and finishing node, all nodes will have a stochastic score with a known distribution.
Ilhan et al. (2008) were motivated to introduce the OPSP due to the existence of a particular problem that they laid out in their paper. This problem was related to an Original Equipment Manufacturer (OEM, company that provides parts to other companies used for further assembly) that cancelled a product line, leading to obsolete inventory at the supplier companies that should be reimbursed by the OEM. Since those supplier companies may overestimate their respective inventory and get an excessive reimbursement, it may be advantageous for the OEM to audit the inventory themselves at the supplier companies. The difference between the potentially overestimated inventory and the audited inventory is thus a random variable. The final problem was then for the OEM to decide on which suppliers to audit in order to maximize the recovered claims (a claim is defined as the difference between the supplier’s estimate minus the audited inventory).
Ilhan et al. (2008) show in their paper that it is not always recommended to try and solve the OPSP, but that the deterministic variant suffices in most cases. They further provide us with an exact algorithm and a bi-objective genetic algorithm. For more details on these algorithms as well as for a structural analysis of some results, we would like to refer the reader to the full paper.
Barros & Evers (2012) go one step further and tackle an orienteering problem where travel times, service times and profits are all stochastic. They illustrate this problem using a specific application called the scouting problem. In the scouting problem, a scout visits several schools within a certain time period in order to find the most talented players of a sport. The distance between the schools is related to the travel times, whereas the time a scout spends at a school is the service time. Lastly, the potential of finding a good or outstanding player represents the profit score here. Whereas Butt & Cavalier (1994) describe this scouting problem with all parameters being deterministic, Barros & Evers (2012) consider the completely stochastic counterpart.
16
4.3. Fairness
Fairness is a complex and dynamic concept that has a varying meaning depending on the user, the context and the time period it is used in. This section explains the difference between fairness and equality. We will provide an overview of some prevalent, fair solution approaches as well as equality measures with their properties. Next, the link between fairness, equality and operations research will be made with fairness in orienteering as an end goal. A profound understanding of fairness and its complexity is of major importance for the remainder of this dissertation.
Although fairness and equality are two terms often used interchangeably, there is an important discrepancy in meaning between them. Fairness is an umbrella term that can stand for equality, but an unequal situation can perfectly be argued fair as well. Equality simply refers to every actor or object having the same amount of a certain good, utility level or other metric. Equality is a concept often used in the context of welfare economics, which is concerned with the welfare of a population on an aggregate level. Dworkin (1981) claims that equality in one way will always lead to inequality in another. He illustrates this by saying that equality in money for all people on this planet will lead to inequality in the satisfaction people are experiencing with it.
Besides equality, fairness can also be interpreted differently. Almås, Cappelen, Sørensen, & Tungodden (2010) state that in reality, people often do not see equality as fair. Rather, they take notions as individual achievements and luck into consideration. According to these authors, people can therefore find it acceptable and fair that money is not equally distributed in the world, given the fact that not everyone accomplishes the same individual achievements. They also describe how inequality acceptance develops through a person’s adolescence and people move more towards a standpoint of fairness.
Operations research problems typically assume a single goal minimizing a cost, time or distance, which we can all refer to as efficiency metrics. Karsu & Morton (2015) have come up with a survey of approaches for the inclusion of fairness concerns in these problems. They state that in many situations an increase in fairness leads to a decrease in the efficiency metric, which is an important trade-off to keep in mind. Whereas equality can easily be defined as the same amount of a good for everyone, defining fairness is not that straightforward. How fairness should be reached is nowadays still an interesting topic of discussion. Academics over the years have come up with new solution approaches, each of which can be justified in some situations. Equality measures and properties have also undergone an evolving process in the past decennia, with a plethora of academic studies as a result, e.g. Trichakis (2011) and Azad, Badia, Rahman, & Zain (2016).
17
4.3.1. Solution approaches
Different solution approaches can be taken when incorporating fairness in the objectives of a problem. These approaches are based on an underlying fairness principle that is often very intuitive. Trichakis (2011) lists several approaches that are prominent in the literature. (Lexicographic) Min-max fairness and proportional fairness are particularly interesting because of their simplicity in nature. Understanding the logic behind these approaches is not only useful for research purposes, but assists in getting a better understanding of societal issues of fairness, where controversy and disagreement are omnipresent.
Min-max fairness The approach of min-max fairness is based on a relatively simple principle, making it
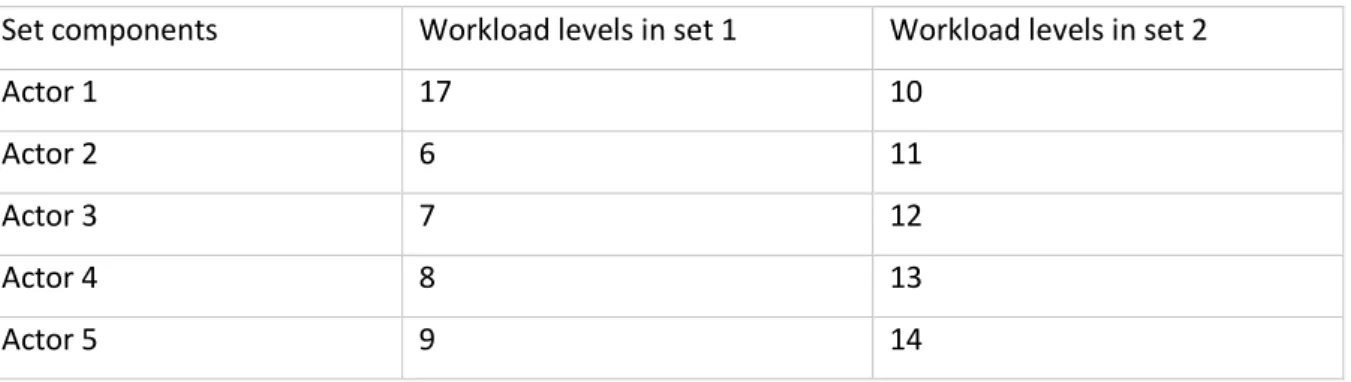
a popular and often-used technique. In this approach, the focus lies on minimizing the highest-ranking workload level in a problem. In a maximization problem, this approach is called max-min fairness and the goal changes to maximizing the lowest-ranking metric. Consider the following example in Table 3.
Set components Workload levels in set 1 Workload levels in set 2
Actor 1 17 10
Actor 2 6 11
Actor 3 7 12
Actor 4 8 13
Actor 5 9 14
Table 3: Workload levels per actor to illustrate min-max fairness
In set 1, all but the first actor are far better off as they have a considerably lower workload level. However, taking in mind the logic behind min-max fairness, the second set would be preferred as the highest workload level of set 2 is lower compared to set 1.
Lexicographic min-max fairness Building on the min-max approach, the lexicographic min-max is an
extension that extrapolates its key reasoning. Whereas the min-max solution approach stops at minimizing the highest workload level, the lexicographic version goes further. Having minimized the highest workload level, the lexicographic min-max solution approach then requires the second highest workload level to be minimized without deteriorating the outcome of the worst actor. This goes on until all actors or objects of a set have been addressed.
Trichakis (2011) describes the lexicographic min-max fairness as being closely related to the idea of Rawlsian justice. Rawlsian justice is the term used for the general idea behind the book a Theory of Justice, written by former American philosopher John Rawls. One of the principles of Rawlsian justice is that people who are the least well off should be given priority. In this context specifically, it is meant that the maximum workload levels of the set of actors should be minimized.
18
Proportional fairness Trichakis (2011) provides us with the following definition of proportional fairness:
“A transfer of resources between two players is favorable and fair if the percentage increase in the utility of one player is larger than the percentage decrease in utility of the other player”. If we consider workload as a metric again, it can be said that if no transfer exists for which one actor’s percentage decrease is higher than the joint percentage increase of other players, then the solution is proportionally fair. Hence, proportional fairness takes into account marginal changes rather than absolute changes. For a formal definition of proportional fairness, we refer the reader to Trichakis (2011).
Li, Pal, & Yang (2008) state that in network resource allocation, (lexicographic) min-max fairness and proportional fairness are widely used concepts. Although network resource allocation is particularly dealing with distributing bandwidth to applications, both concepts can be applied to other operations research problems as well. Both Kelly, Maulloo, & Tan (1998) and Cheng, Fu, Ding, Li, & Yuan (2017) further illustrate the importance of proportional fairness in the field of communication networks by offering algorithms and analyses on the respective problems.
4.3.2. Equality measures and equality axioms
The solution approaches that have been discussed above all incorporate fairness into a problem solution, but they see fairness each in a fundamentally different way. Where the min-max approach aims to minimize the highest workload level, the proportional approach only takes into account percentage changes and allows the highest workload level to become extremely high. A specific case of fairness, however, exists where an equal division of a good is desired among all actors. This specific aspiration within fairness is called equality. The advantage of considering equality as fair lies in the fact that numerous measures exist to quantify equality. In this section, we will go deeper into five equality measures that are prevalent in the literature. The measures that will be discussed are range, mean absolute deviation, standard deviation, Gini-coefficient and Jain index.
Equality measures
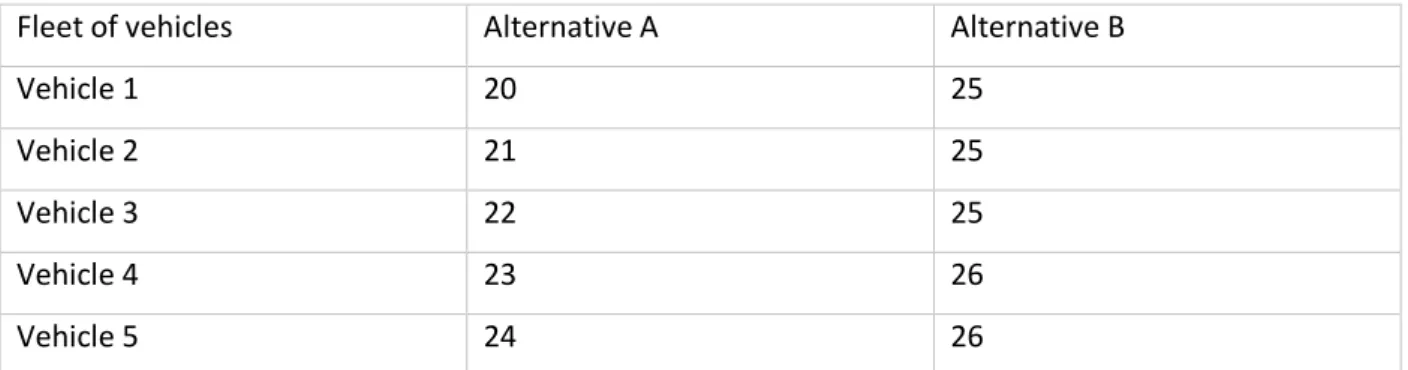
Range As a measure of (in)equality, range can be defined as the difference between the best and the
worst outcome. A negative quality of this measure is that the absolute levels of outcomes are overlooked.
Fleet of vehicles Alternative A Alternative B
Vehicle 1 20 25
Vehicle 2 21 25
Vehicle 3 22 25
Vehicle 4 23 26
Vehicle 5 24 26
19 Consider the two alternative situations of Table 4. Even though the workloads are consistently higher in alternative B than in alternative A, the range as a measure for equality is smaller for alternative B. If we would solely look at equality as an objective, this could lead to an inefficient (but arguably more fair) situation.
Mean Absolute Deviation (MAD) The mean absolute deviation can be described as the mean absolute
difference between the mean outcome and every other outcome. Mathematically, the MAD is shown as 𝑀𝐴𝐷 = 1𝑛 ∑𝑛𝑖=1|𝑥𝑖− 𝑥̅|, with n the number of outcomes, 𝑥̅ the mean outcome and 𝑥𝑖 the outcome ∀ 𝑖 ∈ {1, … , 𝑛}. The main weakness of this measure lies in the fact that transfers between two outcomes on the same side of the mean have no effect on the MAD. This last fact gets more clear when considering an example. Assume a set of 10 outcomes, all between 20 and 80, with a mean of 50. Further assume that two of these outcomes are 20 and 30. If, ceteris paribus, these outcomes would change to 5 and 45, no change would be seen in the MAD. The range, on the other hand, would show a strong increase in inequality after this change.
Standard Deviation Being a very strong and widely used measure, the standard deviation is used far more often than the MAD. Mathematically, the standard deviation of a set (similar to computing the standard deviation of a complete population) can be calculated as follows: √𝑛1∑𝑛𝑖=1(𝑥𝑖− 𝑥̅)² (Matl et al., 2017). Two disadvantages of the standard deviation compared to the MAD is that it is computationally more intensive and less intuitively understandable.
Gini-Coefficient The Gini-Coefficient (details on the origin can be found in Ceriani & Verme (2012))
returns a number between 0 and 1, where more inequality leads to a number closer to 1. While its roots lie in income and wealth equality analysis, it has also been used in operations research problems (e.g. Matl et al. (2017)). Mathematically, the Gini-coefficient can be obtained by the formula (∑𝑛𝑖 = 1∑𝑛𝑗 = 1|𝑥𝑖− 𝑥𝑗|) / 2𝑛2𝑥̅ (Matl et al., 2017).
Jain Index Lastly, the Jain index is another quantitative equality measure described for the first time
in Jain, Chiu, & Hawe (1984). With roots in the field of research on computer systems, the Jain index is easily computable and therefore commonly used. Mathematically, the index can be computed with the following formula: Jain index = (∑𝑛𝑖=1𝑥𝑖)² / (n ∗ ∑𝑛𝑖=1𝑥𝑖2). Jain et al. (1984) illustrate their index with a fairly simple example, where 20 dollars have to be divided among 100 people. If each person receives 0.2 cents, the formula will return 1 (perfectly equal). If 10 people receive 2 dollars each and the others receive nothing then the formula will only return 0.1 which indicates a highly unequal situation.
20
Equality axioms
In this section, a handful of equality axioms will be covered and explained intuitively. These equality axioms are properties that equality measures should ideally satisfy. All of the axioms are easy to grasp and (sometimes) quickly verifiable for equality measures. For more equality axioms or their mathematical formulations, we would like to refer the reader to Matl et al. (2017).
1) The Pigou-Dalton (PD) transfer principle, with its origin in welfare economics, originally refers to the transfer of a good from a rich person to a poor person. For instance, the PD transfer principle states that a money transfer from a rich person to a poor person reduces inequality as long as the poor person does not become richer than the other. This principle can then be extrapolated to situations outside welfare economics where rich and poor may become high-workload and low-workload. Crucial for the PD transfer principle is that after such a transfer, the equality measure should have improved (or at least stayed the same, in which case the measure only weakly satisfies the PD transfer principle). Whether the PD transfer principle is strongly or weakly satisfied thus depends on whether a transfer may leave the equality measure unchanged in some cases or not.
2) The principle of inequality relevance states that if all outcomes are exactly equal to each other, the equality measure should return 0 (or another known and fixed number).
3) The principle of scale invariance refers to a multiplication of all outcomes with a same constant. When all outcomes are multiplied by this number, no change should be noticed in the equality measure.
4) Translation invariance, compared to scale invariance, refers to the addition of a constant to each outcome of a set. Once again, the equality measure should not change in this case.
5) The principle of anonymity, also referred to as symmetry, implies that no matter the order in which the outcomes of a set are placed, the equality measure should be the same.
6) Population independence is a property referring to the influence of the size of a given set of outcomes on the respective equality measure. If an equality measure is population independent, this means that datasets of a different size can be compared to each other without making having to make any modifications.
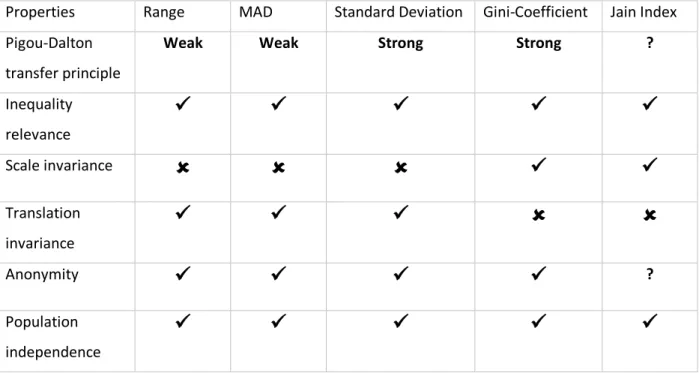
21 Now that we have discussed equality measures as well as equality axioms, we are able to verify which measures are in possession of some or all of the described axioms. An overview can be found in Table 5, where information from a similar table from Matl et al. (2017) is combined with findings from Jain et al. (1984). A check mark and an x mark respectively mean that a measure meets or does not meet the conditions of the axiom in that row. A question mark implies that no conclusive information regarding the property has been found for the particular measure.
Properties Range MAD Standard Deviation Gini-Coefficient Jain Index Pigou-Dalton
transfer principle
Weak Weak Strong Strong ?
Inequality relevance
✓
✓
✓
✓
✓
Scale invariance
✓
✓
Translation invariance✓
✓
✓
Anonymity✓
✓
✓
✓
? Population independence✓
✓
✓
✓
✓
Table 5: Equality measures and their respective properties
As can be seen from the table, no equality measure dominates all the others. Some measures, however, dominate a subset of other measures. From Table 5, we can extract enough information to say that the standard deviation dominates the range and MAD, given the fact that we only look at these particular properties. More equality axioms are present in the literature (e.g. in Matl et al. (2017)), but are not included here.
If we consider the PD transfer principle, we notice that the range will only be affected when one or both of the two extremes (lowest or highest) are involved. A transfer between two actors that are not extremes will leave the range unaltered. Therefore, we say that the range weakly satisfies the PD transfer principle. Other measures, such as the standard deviation, are strongly compliant with the PD transfer principle since a transfer between any two actors (no longer only the extremes) will have an impact on the measure.
22
4.3.3. Fairness and equality in operations research
In the previous sections, fairness and equality have been initiated and three instances of solution approaches have been provided. When applying the concept of fairness to the field of operations research, it is important to understand that one single, perfect measure or approach does not exist. Depending on the specific problem, fairness can be seen and measured from different points of view. Below, we will show first how the concepts of fairness and equality have been applied to the Vehicle Routing Problem (VRP). Second, we will show the existing literature around both concepts in the sports orienteering problem as well as the team orienteering problem.
Fairness in VRPs
With an academic origin dating back to 1959 (Dantzig & Ramser, 1959), the VRP has been studied extensively by researchers. While the underlying idea of the VRP is easy to grasp, its NP-hardness makes it an ever-lasting problem of interest that continuously attracts new algorithms and (meta)heuristics. Laporte (1992b) defines the VRP as the search for optimal routes (implying multiple vehicles) from one or several depots to a given set of cities or customers. Required parameters in the VRP are the distances between these cities/customers and vehicle capacity. Given these parameters, the goal of a VRP is to minimize the total distance covered by all vehicles while fulfilling the constraints of visiting each city/customer and starting/ending at the correct depot. This problem can then be represented by an ILP (e.g. Laporte (1992b)). The result after solving a VRP is a sequence of cities/customer for each vehicle while not exceeding their respective vehicle capacities.
When considered purely as an optimization problem, no such thing as fairness ought to be taken into account. The only goal that is set by the mathematical model lies in minimizing the total distance while keeping all hard constraints satisfied. Once we take a look at practical problems and attempt to take a VRP-approach on solving them, it becomes interesting to consider a certain level of fairness or equality in the achieved results. A situation to avoid may be where one driver is assigned to many cities and a second driver to only a few.
Both fairness and equality can be taken into consideration for VRPs, but one should always keep in mind their difference. If we look first at equality, we can say that all vehicles in a perfectly equal VRP should drive exactly the same amount of kilometres (or a similar metric, such as driving time). In the literature, these load-balancing VRPs can be found in large numbers under the names balanced VRP (e.g. Kritikos & Ioannou (2010)), multi-objective VRP (e.g. Zhou, Song, He, & Liu (2013)) and VRP with load-balancing (e.g. Lee & Ueng (1999)). Matl et al. (2017) provide us with a survey of academic papers related to VRPs with load-balancing.
23 On the other hand, we can also incorporate the broader concept of fairness into VRPs. Whereas equality aims for an equal division of workload, fairness does not necessarily require this. Golden, Laporte, & Taillard (1997) explicitly take a min-max approach and attempt to minimize the mileage associated with the busiest vehicle. Lehuédé, Péton, & Tricoire (2020) apply the lexicographic extension of the min-max approach to the VRP.
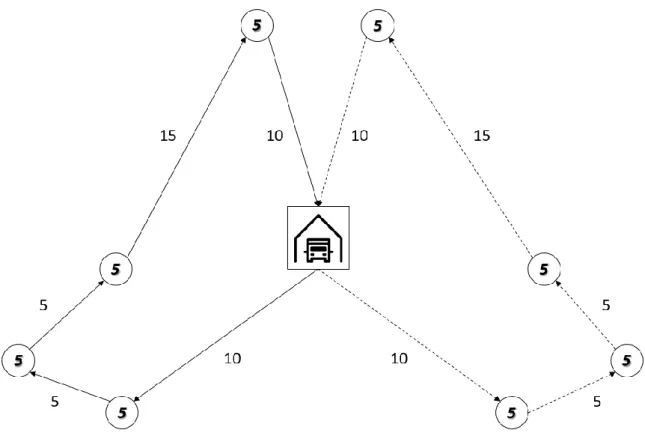
We will look at an example to further clarify the difference between fairness and equality in VRPs. Consider a VRP with two vehicles, one depot that serves as starting and finishing point and 8 cities that need to be visited. Each city has a demand of 5 units, whereas a vehicle has a capacity of 25 units. A graphical representation with the necessary parameters, distance in km and demand in units can be found in Figure 2.
Figure 2: VRP solution with equal workload division
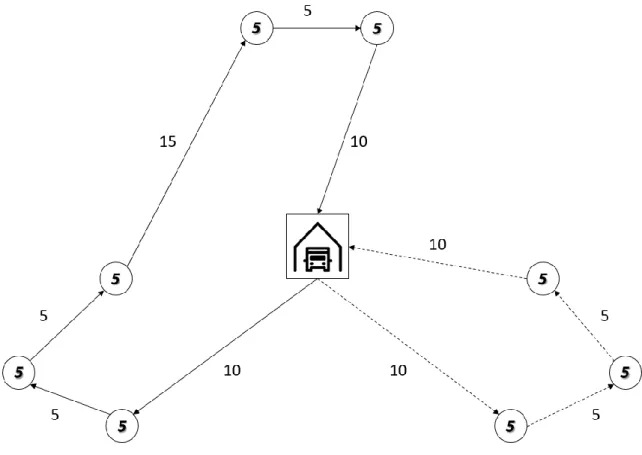
Following the principles of equality, two routes can be drawn visually that result in both vehicles ending up with the same amount of km (both 45). Let us now look at one of the solution approaches that has been described in Section 4.3.1.: the proportional fairness. Following the definition of proportional fairness, a solution is fair if no transfer can be made so that the percentage decrease in workload of one actor is higher than the percentage increase in workload of another actor. In this example, it is still possible to make such a transfer. An alternative solution of the same problem, satisfying the proportional fairness definition, is given below in Figure 3.
24
Figure 3: VRP solution in accordance with the proportional fairness approach
In this situation, the workload is no longer equally distributed between the two vehicles. Vehicle 1 (solid line) now has a workload of 50 km instead of 45 km. Vehicle 2 now has a workload of 30 km instead of 45 km. This solution is now in accordance with the principle of proportional fairness. Due to this transfer, vehicle 1 has seen a 11% increase in workload (from 45 km to 50 km). Vehicle 2 has seen a 33% decrease in workload (from 45 km to 30 km). Since our example is completely symmetrical, we could have increased the 2nd vehicle’s workload as well while decreasing the workload of the 1st vehicle. This would also lead to a proportionally fair solution.
Unfairness and inequality in the distribution of jobs between employees in real-life situations logically enable dissatisfaction and create a bad atmosphere. Azad et al. (2016) have looked at load-balancing issues in the garbage collection problem (also called Waste Collection Vehicle Routing Problem (WCVRP), which is a practical application of the VRP). In essence, the garbage collection problem is a VRP where garbage containers with identical capacities are expected to unload multiple garbage bins at a minimum cost. Further, they state that the garbage containers start at a depot and have to unload the garbage bins before returning to the same depot. The authors have formulated a genetic algorithm and consequently found that high levels of discrimination between routes exist. The goal of this research was not to include equality measures in the objective function, but merely to point out the existence and relevance of load-balancing issues in the results of widespread algorithms such as the genetic algorithm.