bewegingsdata
Activiteitsherkenning voor badminton gebaseerd op
Academiejaar 2019-2020
Master of Science in de industriële wetenschappen: informatica Masterproef ingediend tot het behalen van de academische graad van
Begeleiders: ir. Ben Van Herbruggen, prof. dr. ir. David Plets, ir. Jaron Fontaine
Promotoren: prof. dr. ir. Eli De Poorter, prof. dr. ir. Toon De Pessemier
Studentennummer: 01610254
i
COVID-19-preambule
Om de verspreiding van het coronavirus tegen te gaan, waren gedurende de periode van deze masterproef verregaande maatregelen van kracht. Deze hadden een zware impact hebben op het dagelijkse leven. De maatregelen werden genomen door de Belgische overheidsinstanties op 12 maart 2020 en golden tot na het einde van het academiejaar. Tevens werden er door de Universiteit Gent nog extra maatregelen getroffen.
Deze beperkingen hadden een grote invloed op het verloop van dit pro-ject. Zo kon er geen gebruik gemaakt worden de labo-faciliteiten van de onderzoeksgroep van de Universiteit Gent. Hierdoor waren metingen met het mocap- en UWB-systeem een ruime tijd onmogelijk. De onderzoeken in verband met de lokalisatie op een badmintonplein konder hierdoor niet worden uitgewerkt. De enige mogelijkheid om data te verzamelen was door middel van een accelerometer en gyroscoop binnen de de thuissituatie. Door deze beperkingen werden de onderzoeksvragen, in overleg met de promoto-ren en begeleiders, bijgestuurd. Het onderzoek werd vooral toegespitst op activiteitsherkenning van de slagbewegingen bij badminton. Hierbij werd de effectieve implementatie van de positionering op het veld vervangen door conceptuele aspecten die doorheen deze scriptie aan bod komen. Er werd dieper ingegaan op de optimalisatie van het computermodel voor activi-teitsherkenning en de visualisatie van de gegevens werd uitgebreid t.o.v. de initieel beoogde doelen.
Deze preambule werd in overleg tussen de student en de promotor opgesteld en door beiden goedgekeurd.
Dankwoord
Na vier maanden heb ik de laatste hand gelegd aan deze masterproef. Het was een erg gevarieerd en leerrijk project waarbij verschillende aspecten van de informatica aan bod kwamen. Daarom wil ik graag een aantal personen oprecht bedanken voor de begeleiding en steun tijdens het maken van deze masterproef.
Allereerst wil ik mijn promotor, prof. dr. ir. Eli De Poorter, bedanken voor de opvolging, de aangeboden kansen, de tips en de feedback. Ook mijn begeleiders, ir. Ben Van Herbruggen en ir. Jaron Fontaine wil ik hartelijk bedanken voor de steun, de vele tips en uitgebreide wekelijkse feedback. Jullie bijdrage heeft deze masterproef enorm ondersteund! Vervolgens wil ik mijn vriendin Elise Thienpont bedanken om proefpersoon te zijn gedurende dit project en mij te steunen op alle momenten. Daarnaast wil ik ook nog Matthias De Roo bedanken voor de feedback en de toelichtingen in verband met badmintontrainingen.
Om te eindigen wil ik ook nog mijn ouders bedanken om mij de afgelopen 21 jaar te steunen op alle mogelijke manieren.
Dikke merci allemaal, Tim Steels
steeds gezocht naar technologie¨en die kunnen helpen bij het optimaliseren van de trainingen. Dit omvat onder andere het exact bepalen van de po-sitie en de bewegingen van de speler tijdens de trainingen en spelsituaties. Badminton is een sport waarin tactiek, techniek, positionering en de pre-cisie van de bewegingen van groot belang zijn. Door middel van goedkope en compacte sensorhardware willen we de nodige metingen kunnen uitvoe-ren om relevante, bruikbare info te bekomen. In deze thesis wordt voor de positionering gebruik gemaakt van Two-way ranging. Dit is een sys-teem dat eenvoudig inzetbaar is, zonder dat hier een uitgebreide configura-tie en installaconfigura-tie aan voorafgaat. Om de nauwkeurigheid van dit systeem te verifi¨eren, worden de gemeten resultaten vergeleken met het betrouwbare Mocap-systeem. Metingen tonen aan dat het aantal ankerpunten een grote invloed heeft op de nauwkeurigheid van de positiebepalingen. Door het re-gisteren van de positie in de tijd, kunnen snelheid en afgelegde afstand van een speler eenvoudig bepaald worden. Ook de onderlinge positionering tus-sen meerdere spelers bij dubbelspel, kan hieruit worden afgeleid. Voor het herkennen van de loop- en slagbewegingen op het veld wordt een combina-tie van accelerometer- en gyroscoopdata gebruikt. Uit meetresultaten blijkt dat een sensor onderaan de racket de nauwkeurigste resultaten bekomt. Zo kunnen kleine subtiele wijzigingen in de slagbeweging waargenomen worden. Om de activiteitsherkenning te optimaliseren, wordt ook een hele meetcam-pagne opgezet, waarbij de slagen van meerdere personen geanalyseerd en verwerkt worden. Door data van verschillende spelers te combineren, be-komen we een krachtiger model dat wijd inzetbaar is. De classificatie van de slagen geeft informatie over de mate waarin een speler eerder offensief of eerder defensief speelt. Dit geeft tevens ook een idee ofdat de badmin-tonspeler de bovenhand heeft gedurende het spel. Het detecteren van het tijdstip waarop de racket de shuttle raakt, kan ook informatie verschaffen over de techniek van de speler. Kortom, door het combineren van positione-ring op het veld en slagherkenning, bekomen we een voldoende gegevens om een spelsituatie te reconstrueren en te analyseren. Naast het zoeken naar de optimale methodes om zo accuraat mogelijke data te bekomen, is ook de feedback naar de gebruiker van belang. Hiervoor wordt een interactieve webapplicatie ontwikkeld die op een eenvoudige manier bepaalde interes-sante gegevens naar voren brengt. Zo kunnen de zwakke punten van een speler beter naar voren gebracht worden en kan men hier extra aandacht aan besteden. Deze resultaten kunnen zo een mooie aanvulling vormen in het trainingsproces.
Kernwoorden: badminton, activiteitsherkenning, positionering, UWB, we-bapplicatie
Badminton activity recognition based on motion
tracking
Tim Steels
Supervisor(s): Eli De Poorter, Toon De Pessemier, Ben Van Herbruggen, Jaron Fontaine, David Plets
Abstract—A thorough analysis of sports is becoming increasingly impor-tant during the training process of badminton players at both recreational and professional level. Nowadays, game situations are usually filmed and reviewed afterwards to analyze the game situation, but these video set-ups tend to be difficult to analyze and expensive and intrusive to setup. In con-trast, the aim of this paper is to correctly classify badminton movements by using much cheaper accelerometer and gyroscope data. To this end, a data capturing campaign was organized and we designed a novel neural network using different frame sizes as input. This paper shows that with only accelerometer data, our novel convolutional neural network is able to distinguish activities with 86% precision. Adding the gyroscope data causes an increase of up to 99% precision, compared to respectively 79% and 88% when using a traditional convolutional neural network. Moreover, our pa-per analyses the impact of different sensor placement options and discusses the impact of different sampling rates of the sensors. As such, our approach provides a low cost solution that is easy to use and can collect useful infor-mation for the analysis of a badminton game.
Keywords— Badminton, activity recognition, accelerometer, gyroscope, DNN, CNN
I. INTRODUCTION
B
ADMINTON is an Olympic discipline and one of the most popular racket sports worldwide. It is played at both recre-ational and professional level. For both categories, an analysis of the movements can be of great added value during the train-ing process. To improve the personal performance of badminton players, technologies that can help to optimize training are con-stantly being sought. This includes determining the exact po-sition and movements of the player during training and game situations. Badminton is a sport in which tactics, technique, positioning and the precise execution of the movements are of great importance. Players and coaches are interested in afford-able and compact sensor hardware that has the ability to capture the necessary measurements to obtain relevant, useful informa-tion. Although the focus is on badminton, the techniques used are perfectly expandable to other sports or other domains. Recognition and monitoring of human activities is a research area that has been thoroughly investigated in recent years [1]. The increase in popularity of smart wearable devices such as smartwatches and smartphones has facilitated the necessary data collection process. These mobile devices have built-in sensors such as an accelerometer and a gyroscope that are sufficiently accurate to be useful for the recognition of human daily ac-tivities. This research area is very intriguing because it finds applications in a wide range of domains. Some of the inter-esting applications are tracking the physical activity of athletes [2], predicting the movement of robots and vehicles using sen-sors [3], etc. The aim of this project is to recognize badminton strokes based on measured accelerometer and gyroscope data. The obtained signals are then processed by a computer model. The idea is that the system ’learns’ to distinguish the differentstrokes, based on these measurements. The aim is to achieve an accurate, automatic classification of the movements based on supervised machine learning. By giving the system more varied input data, predictions and interpretations can be made more accurately. The purpose of this classification is to gain a better understanding of a player’s strengths and vulnerabilities. Knowledge of the played strokes provides a good insight into the extent to which a player e.g. mainly plays offensive or de-fensive. The results of this data can be used as support during the training process of both amateur and professional players. A big difference with existing technologies is that we go deeper into the specific movements in badminton, where other studies focus more on coarse-grained activity recognition or other sports. In addition, affordable and easily deployable sensors are used dur-ing this project. We also investigate how we can classify move-ments with a long and short duration as correctly as possible without using a manually chosen fixed frame size. The tech-niques used in this research are not only limited to badminton, but are useful in different types of activity recognition.
The main contributions of this paper are as follows:
• We propose a novel activity recognition approach based on ensemble learning using accelerometer and gyroscope data from different frame sizes.
• We classify a wide variety of badminton strokes.
• We investigate the influence of the sampling rate on the accu-racy of the model.
• We have a look at the most interesting locations on the human body to obtain good results.
• We provide an open source data set for further research The rest of this paper is organized as follows. Chapter 2 dis-cusses related work and the most modern activity recognition techniques. Section 3 describes the measuring techniques for collecting the data, the data set and the sensors we use. Chapter 4 covers the classification process. This includes pre-processing the data and a description of the model used. Finally, in the last section, the conclusions are formed and future work is dis-cussed.
II. RELATED WORK
As mentioned, quite a lot of research has already been carried out into the domain of activity recognition. Mobile devices have become very popular. These devices have built-in sensors such as accelerometer, gyroscope and magnetometer that are suffi-ciently accurate to recognize human daily activities [4, 5]. This research area is intriguing because it finds applications in a wide
sports, extensive research has already been done into recogniz-ing the movements with various techniques. Existrecogniz-ing work usu-ally focuses only course-grained activities or they distinguish different sport categories. In-depth research that specifically fo-cuses on badminton is rare. Tennis is one of the sports most similar to badminton in terms of movements and strokes. The strokes are performed differently, but the concepts in activity recognition are similar. These technologies often have a high cost and systems often need to be calibrated. Not all options are equally easy to use and user-friendly. To develop a system that is interesting in both professional environments and commercial applications, these things must be taken into account. In Table I we give a short overview of related previous research. There are two main categories: technologies based on accelerometer and gyroscope and technologies based on computer vision.
However, the studies mentioned do not always go deeper into a wide variety of movements. In [6] coarse-grained activities are recognized and in [7] only the difference between a service and a non-service is investigated. The number of recognized strokes is often limited and the focus is mainly on finding just a work-ing solution without further comparisons. [8] is quite similar in terms of strokes and approach to our research, but here the chosen position of the sensors is less user-friendly. In [9] use is made of a convolutional neural network. They obtain accuracies of up to 96.5% for their classification of tennis strokes. [10] also uses a CNN, but this time by using visual recognition. Again, the accuracy is very high, about 98.7%. Contrary to the men-tioned papers, we will try to optimize every step. For example, we investigate the minimum sampling frequency and the best position to place the sensors on the body. The impact on accu-racy when fewer sensor axes are used will be examined. We also have a look at the extent to which CNNs make better predictions than Deep Neural Networks (DNNs) without convolutional lay-ers.
III. DATA COLLECTION A. Measurements
At the beginning of the study, a fairly extensive data set of about two hours was captured. The data for two right-handed test persons was measured. These subjects, a male and a female player, are 21 years old and practice badminton at an amateur level. Each was asked to play the different strokes consecu-tively as often as possible. Subsequently, these persons were also asked to play a varied scenario in which all kinds of strokes occurred. Movements were recorded using an accelerometer and gyroscope, attached to the human body or on the badminton racket. The shuttle was not hit during these measurements. The sampling frequencies we examine are 100 Hz, 50 Hz, 25 Hz and 12.5 Hz. By working with these different frequencies, we can deduce the minimum required frequency that is required for ac-tivity recognition. The total data set that was measured consists of 663 954 samples that each contain data from six axes.
strokes:
• Overhead Defensive Clear: The player hits the shuttle overhead from the backfield with a wide arc to the opponent’s backfield to get back into position for the next strike of the opponent in time.
• Dab: The shuttle is struck steeply and quickly from the net on the opponent’s ground.
• Drive: The shuttle is hit in a quick, underhand motion. • Short Serve: This is often the first trick played in a game
situation.
• Lob: The shuttle is hit high and deep in the backfield with an underhand stroke with the aim of getting the opponent as far as possible in the back of the field.
• Net drop: The netdrop is a short ball over the badminton net. However, the shuttle departs from the front of the field. • Smash: The shuttle is hit as hard as possible with the
overhand strike on the ground, so that the opponent does not have time to hit the shuttle back.
We show this in Figure 1. In addition, we also want to be able to classify running movements and moments of standstill.
(a) Dab (b) Drive (c) Short Serve
(d) Lob (e) Net drop (f) Smash Fig. 1: Classified strokes
C. Sensors
The device used during the experiments in this work is the Axivity AX6 6-Axis Logging Device. The AX6 is a data log-ger that can record binary data by a range of integrated sensors. It features a state-of-the-art 6-axis motion sensor that measures linear acceleration and angular velocity with high precision. So it includes both an accelerometer and a gyroscope. In addition, the device also includes the temperature sensor, a light sensor for measuring ambient light and a real-time clock. In this paper, only the accelerometer and gyroscope are used. All collected data is stored in binary format in the built-in flash memory. To allow further processing of the results, the recorded WAV files must be manually transferred to a computer device and con-verted to CSV files.
TABLE I: Comparing recognized activities, number of distinguished classes, sensors and methods proposed in this paper with related work.
Paper Activity Number
of classes
Sensors Method/positions Machine learning
approach
[6] Daily activities 8 Accelerometer +
gyroscope Wrist, ankle SVC, DNN
[6] Coarse-grained sport
categories 9 Accelerometer +gyroscope Wrist, ankle SVC, DNN
[9] Tennis 5 Accelerometer +
gyroscope Wrist, waist CNN
[8] Badminton 5 Accelerometer +
gyroscope On the strings of theracket KNN, SVM
[7] Badminton 2 Cameras Computer vision SOFW
[10] Badminton 2 Cameras Computer vision CNN
This
paper Badminton 9 Accelerometer +gyroscope Grip racket, wrist,upper arm CNN, DNN D. Variety of sensors
The combinations of sensor axes we will investigate is only accelerometer data or a combination of both accelerometer data and gyroscope data. The disadvantage of the gyroscope is the high power consumption, battery size and the extra memory storage that is needed. Because the Axivity AX6 sensor is used, we must take into account the internal memory storage which is not infinite. When we do not store the data locally but process it in real-time, we still have to take power consumption into ac-count. Turning on the gyroscope drastically reduces battery life of a mobile device.
E. Position of sensors
Depending on the position where the sensors are placed, we obtain other information that is measured. The challenge lies in finding the most optimal location for measuring the necessary data for classification of the strokes. During the experiments, different locations for attaching the sensors are considered: the bottom of the racket’s grip, the wrist, and the upper arm. We show this in Figure 2.
In addition, ease of use was taken into account when choosing the positions. Placing a sensor in the middle of the strings of the racket is of course not very practical in a real badminton game. These three positions were determined in consultation with two experts in the field of badminton. A brief survey shows that players prefer the sensor on the bottom of the racket’s grip.
IV. CLASSIFICATION PROCESS
Once the data has been captured, it must of course be con-verted into a way that is easy to interpret for sports analysts and
Fig. 2: Positions sensors
trainers. In the end, the player and his team should have easy access to his game statistics: the strokes he played, how many strokes he played, when he played this strokes, etc.
A. Signal Preprocessing
For deep learning itself the libraries TensorFlow [11] and Scikit-learn [12] are used. In order for the computer model to recognize activities, a large amount of data is given as input dur-ing the traindur-ing process. Based on this data, the model learns the typical course of linear and angular accelerations for each stroke. The input is taken as varied as possible to obtain a gener-ically applicable model that produces good results for different people. The execution of a stroke is different for everyone. The data consists of series of the same successive strokes as well as realistic scenarios with alternating movements and displace-ments between. In addition, all samples are labeled according to
it magnified noise too much which confused the model. Then, we divide the signals into chunks, frames. A large number of badminton strokes involve common movements. It is important to consider large parts of a stroke at once during the classifica-tion. This allows the model to learn to recognize the full course of a specific stroke movement. For each frame, the most com-mon ground truth label is used as the label for the entire frame. We do not use overlapping frames during the training process. B. Layers CNN
For implementing a Convolutional Neural Network, Keras’ Conv2D class is perfect for our goal. The Sequential model type is in this case the easiest way to build a model and allows layer by layer adaptation. The first layer we add to our network is a Conv2D layer. We give the first parameter, ”filters”, a value of 16. The parameter ”kernelsize” is the size of the filter matrix for our convolution. The kernel size chosen means that we will have a 3x3 filter matrix. Activation is the activation function for the layer. The function we use for our first two layers is the ReLU or Rectified Linear Activation. This activation function has been proven to work well in neural networks [14]. When data passes through a deep neural network, the values change, making some too large or too small. By normalizing the data per batch, any disadvantages associated with this are filtered out. This usually ensures better end results.
Dropout layers are added several times. Dropout is a technique in which randomly selected neurons are ignored during train-ing. This prevents overfitting of the model. A ”Flatten” layer is added between the Conv2D layers and the Dense layer. Flatten acts as a connection between the convolution and Dense layers. ”Dense” is the layer type we will use for our output layer. Dense is a standard layer type that is used in many cases for neural net-works.
We have 9 nodes in our output layer, one for every possible out-come. Seven labels are the different strokes we detect. We stick the other two labels on the displacements of the player and mo-ments of rest. The activation is ”softmax”. Softmax makes the output sum to 1, so that the output can be interpreted as proba-bilities. The model then makes its predictions based on which option has the greatest probability. A brief overview of the dif-ferent layers and their output dimensions is given in Figure II. C. Remove impurities in predictions
The classification by the model is not flawless. For example, when switching from a specific striking movement to moments of rest or displacement, the classification can go wrong. As al-ready mentioned, the most common label in a frame is used as the label for the entire frame and the model uses Softmax which is based on probabilities. We notice that with misclassifications the model is quite uncertain about its prediction.
V. RESULTS AND EVALUATION
To determine the accuracy of the model, a scenario from an unseen player is passed on to the model. This scenario
con-Layer Output Dimension
Input 80 x 6 Conv2D (16, 3 x 3), Relu 78 x 4 x 16 Batch normalization 78 x 4 x 16 Dropout 10% 78 x 4 x 16 Conv2D (32, 3 x 3), Relu 76 x 2 x 32 Dropout 20% 76 x 2 x 32 Flatten 4864 Dense (64), Relu, kernel regularizer, bias regularizer 64 Dense (9), Softmax 9
tains every type of stroke, interspersed with rest and running moments. The number of times a type of strokes is played in the scenario is shown in Table III.
TABLE III: Number of strokes in scenario
Stroke #
Overhead Defensive Clear 31
Dab / Block 30 Drive 30 Short serve 31 Lob 30 Net drop 34 Smash 30
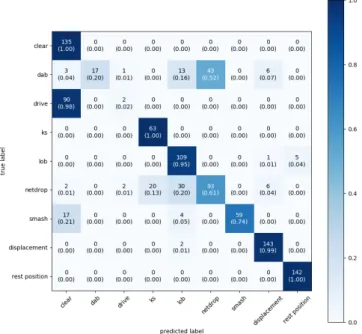
We start our experiments by classifying the strokes on the ac-celerometer data, sampled at 12.5Hz. Frame sizes of 0.4, 0.6, 0.8, 1.0, 1.2, 1.4 and 1.6 seconds are used to classify our bad-minton strokes. The results we obtained through ensemble learning (a technique which will be explained in Section V-A) are shown in Figure 3. What is most striking is the fact that al-most all drives (98%) are classified as a clear. Also the dab is not properly recognized and there is confusion between the smash and the clear. The weighted average accuracy is 76%. These problems are partly solved by adding the gyroscope data. The drive is then recognized with an accuracy of 62%. The global weighted average accuracy increases up to 89%.
If we increase the sampling rate to 25Hz, we get a weighted average accuracy of 96%. Again, we note the same misclassi-fication of the drive when omitting the gyroscope data. Further increasing the sampling rate to 50 and 100Hz produces similar results. We do notice that at 100Hz the drives are recognized by 48% with only accelerometer data. With these higher sampling frequencies, the differences between these two strokes are ob-servable for our model.
Fig. 3: Confusion matrix: only accelerometerdata and a sam-pling frequency of 12.5Hz
What also stands out in the results, is the fact that rest and dis-placement are always recognized with very high accuracy, re-gardless of frame size, sampling rate and number of sensors. This can be explained since the signal of these movements is not very similar to any other class. They are therefore very easy to distinguish.
A. Fixed frame size versus variable frame size
Depending on the frame size we work with, we obtain a com-pletely different accuracy for the different types of strokes. The main conclusion we can draw is that strokes with a short du-ration are more accurately predicted when the frame size is smaller. For strokes that have a longer duration, the recogni-tion is better when using larger frame sizes. The optimal frame sizes per stroke type are shown in Table IV.
TABLE IV: Best frame size by stroke type
Stroke frame size (seconds)
Overhead Defensive Clear 1.60
Dab / Block 1.08 Drive 1.08 Short serve 0.68 Lob 1.28 Net drop 1.20 Smash 0.72
It goes without saying that we want to make the most accurate forecast possible for all strokes. In order not having to choose a trade-off between the frame sizes manually, we train multiple
models with each a different frame size. Frame sizes of 0.4, 0.6, 0.8, 1, 1.2, 1.4 and 1.6 seconds are used. These time intervals cover the average duration of the different strokes. All other parameters during the training of the model remain unchanged. We let each model make a prediction of the same unknown sce-nario. An overview of the accuracy per fixed frame size is given in Table V. After the predictions, the output of all these models is combined to arrive at a composite whole. In this way we try to obtain an optimal combination of the different frame sizes. By combining these different models, we obtain an overall better result: a traditional convolutional neural network with fixed in-put frames has a weighted average accuracy of 87%, compared to 98% when combining different models with different input frame lengths. The combined model performs roughly well for every stroke type. We therefore use this approach during the rest of this paper.
TABLE V: Best accuracy by frame size (100Hz, accelerometer + gyroscope)
frame size (seconds) Accuracy (%)
0.40 80 0.60 81 0.80 88 1.00 88 1.20 92 1.40 88 1.60 93 Ensemble learning 98 B. Added value gyroscope data
To compare the accuracy obtained with or without gyroscope data, we repeat the exact same experiment keeping all other pa-rameters constant. We investigate the impact at different sam-ple frequencies: 12.5Hz, 25Hz, 50Hz and 100Hz. We also use ensemble learning as described in Section V-A. In Figure 4a we show results obtained with only accelerometer data. In Fig-ure 4b we show result when we add the gyroscope data. Omit-ting the gyroscope has a negative influence on the predictions of the model. When we look at the misclassifications in more de-tail, we notice that especially short strokes, such as the dab and the short serve, are sensitive to the omission of the gyroscope. These strokes are barely recognized. Rest moments and dis-placements are not really affected by this. It is clear to see that the overall results are more than ten percent higher by adding the extra sensor. In both situations we see a fairly stable trend up to 25Hz. At 12.5Hz, we see a major drop in the accuracy of the predictions.
C. Influence of sampling rate
We examined four different sampling rates: 12.5, 25, 50 and 100Hz. As expected, we obtain the best results by using higher sampling frequencies. As higher sample rates are more power
multiple frequencies
consuming and require more memory/ data communication, we investigated the accuracy for different sampling rates. With de-creasing the sample rate we observe that between 100 and 25Hz their are just relatively small differences in accuracy. We suspect here that these small differences are due to the certain random-ization that occurs when training the model. There is a sudden drop in accuracy when we sample at 12.5Hz as can be seen in Figure 4. We conclude that this frequency is too low to be able to distinguish the strokes sufficiently accurate and 25Hz is the recommended sampling rate.
D. Position of sensors
We found that we generally get better results with higher sam-pling rates. When we attach the sensor to the wrist, we notice that the model is confused between the dab and the netdrop. When we vary the weights in ensemble learning, no good val-ues were found to distinguish these classes. Both strokes consist of a short forward movement followed by a short stroke move-ment. Too much detail disappears to properly distinguish these movements. The measurements where the sensor is placed on the upper arm do not provide better results then on the racket either.
Nevertheless, we still get very good results here. For the wrist, we obtain a weighted average accuracy of 93% at a sampling frequency of 100Hz. On the upper arm, this is 96% compared to the achieved 98% at the racket. Only the information mea-sured on the wrist and upper arm shows less detail in the signal. The strokes were still distinguishable, but the moment of impact of the shuttle could not be detected. The most detailed infor-mation was obtained by attaching the sensor to the bottom of the racket’s grip. The moment of impact is easy noticeable be-cause of a very short high peak in the signal. The difference between non-hitting and hitting the shuttle can be seen in Figure 5. Knowing where this peak occurs during the movement can also help to further distinguish strokes or might be useful when analyzing the stroke movement.. This position is also most user-friendly since the player does not have to attach sensors to the
body. We conclude that we lose some information when we place the sensor further away from the racket, but these posi-tions are still considerable for activity recognition tasks.
Fig. 5: Impact shuttle
E. From fine-grained actions to stroke types
Something that stands out, regardless of the position of the sensors or the sampling rate, is the (often slight) confusion be-tween strokes such as the clear and the smash. Especially when we have data from multiple players of different levels, it is easy to understand that the model is missing. These strokes are very similar movements. The only difference is that the smash is likely to be a faster, shorter movement. Since the shuttle was not hit during the measurements of the data set, this peak can-not be seen in the data. The location of this peak could possibly clarify the classification between the two strokes. The moment when the shuttle is hit is somewhat different. During a smash movement, the shuttle is hit a little later. If we would combine the clear and the smash in an overarching category, we see that the obtained accuracy is higher. An other way to create supersets is by taking overhand and underhand strokes together or make a division based on offensive and defensive strokes. For example, in Figure 6 we show the capabilities of our model to distinguish overhand and underhand strokes.
Fig. 6: Distinguish offensive and defensive strokes
F. Adding weights
We test a player’s scenario on a model that is only trained on another player’s data. We notice a slight confusion between the clear and the drive on the one hand and the short serve and the netdrop on the other.
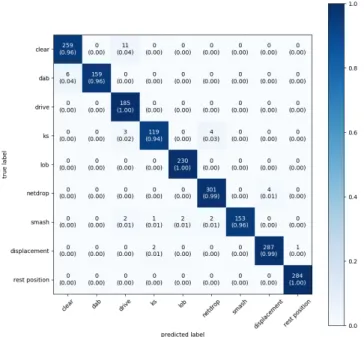
In addition to the fact that we get a whole improvement by ap-plying ensemble learning, we still notice that there is still some space for improvement. We see the largest deviations when pre-dicting the clear and the short serve (respectively the longest and shortest stroke in time). When we make a prediction we get a probability (Softmax) for all frames f per stroke type i. Per frame, the most likely class is then returned as a result. When we notice that there is confusion between two different classes and we know that one of the two is very likely to be incorrect (e.g. recognizing a short serve with a model based on long frame-sizes), we can correct this by using weights. To overcome our issue, we increase the weights for a short service on the models with a smaller framesize. Also the weights for a clear on the models with a larger framesize get a higher value. As a result of this modifications, we obtain almost perfect results for the same scenario as shown in Figure 7.
predicted classes = F \ f =1
indexpredictf(max(weighti·predictf,i))
We conclude from our results that it might be worthwhile to combine several models when the signals, that need to be clas-sified, vary in duration. This might also be useful in other sports or in completely different branches.
G. Using a simple DNN instead of a CNN
In addition to the fact that we can achieve great results by us-ing of a Convolutional Neural Network, we examine whether it is possible to achieve similar accuracy with a Deep Neural Net-work without convolutional layers. The advantages of a DNN are the lower complexity, the generally lower required comput-ing power and the higher speed. We give a brief overview of the used layers and output dimensions in Table VI. We notice that
Fig. 7: Confusion matrix: accelerometer and gyroscope data. A sampling frequency of 100Hz and ensemble learning with extra weights are used. It gives a high accuracy of 98%.
with the combination of layers we propose, we obtain a fairly good accuracy. Of course we will again make use of the en-semble learning technique. At a sampling rate of 100Hz, 93 % accuracy is obtained. The weighted average precision and recall are also 93%. It is striking that the model has more difficulty distinguishing similar movements, e.g. smash and clear, than the model that uses convolutional layers.
TABLE VI: Layers DNN (frame size = 80)
Layer Output Dimension
Input 80 x 6 Dense (1024), Relu 80 x 1024 Dropout 20% 80 x 1024 Dense (512), Relu 80 x 512 Dropout 20% 80 x 512 Dense (256), Relu 80 x 256 Dropout 20% 80 x 256 Dense (128), Relu 80 x 128 Dropout 20% 80 x 128 Dense (32), Relu 80 x 32 Dropout 20% 80 x 32 Flatten 2560 Dense (9), Softmax 9 VI. FUTURE WORK
An interesting extension of this research is the combination of this activity recognition with positioning. Since we attach great
nition even more reliable. Not all strokes can be played on all positions on the field. For example, a netdrop is always played close to the net and never in the back of the field. It would also be a great added value to see which stroke was played in where on the field. When we also track the relative positions between the players, we obtain a full description of the game situation. The entire game can therefore be fully reviewed and analyzed afterwards. This can be an interesting retrospect at high level where weaknesses in technique and tactics can be studied. It allows for more targeted coaching and better preparation for fu-ture matches.
It would be very useful to extend the model to multiple players. In the experiments conducted, data from only two players was used. Data from a large number of players is needed to obtain a model that is more generalizing to a large audience. An interest-ing study would be to compare the data of professional players and amateurs.
VII. CONCLUSIONS
During this paper, we have demonstrated that fine-grained ac-tivity recognition of badminton strokes can be performed using off-the-shelf sensors and still achieve accurate results. We tinguish nine different activities: seven badminton strokes, dis-placements and moments of rest. Accurate predictions can be made with a simple Convolutional Neural Network after fine-tuning the parameters. With only accelerometer data we obtain a maximum precision of 86% for a CNN at a sampling rate of 50Hz. When accelerometer data and gyroscope data are com-bined, this value increases to 99%. By the DNN that we present here, this value is about five percent lower. We notice that quite good results can be achieved with only data from an accelerom-eter. However, the accuracy increases even more when the gy-roscope data is also used. Therefore, a trade-off must be made between accuracy and, for example, power consumption. Sam-ple frequencies of more than 25Hz appear to be sufficient to correctly classify the fast badminton movements. If we lower this frequency further, the model will often make false predic-tions. Subsampling up to 12.5Hz causes a drop in the precision of our CNN. When only accelerometer data is used, it drops to 77%. With the combination of accelerometer data and gyro-scope data, it still reaches 89%. When we take overhand and underhand strokes together afterwards, we notice that these cat-egories can be distinguished with an weighted average accuracy of 99%.
To solve the problem of long and short movements, a form of ensemble learning was used during this paper. The output of multiple models with different frame sizes were combined to achieve a reliable end result. This is not just a technique that is useful in our research, but it can be useful in any form of activity recognition. The best place to attach the sensors is at the bottom of the racket’s grip. Here, the smallest details in the stroke can be observed, making the movements easier to distinguish. In
ad-REFERENCES
[1] O. D. Lara and M. A. Labrador. “A Survey on Human Activity Recogni-tion using Wearable Sensors”. In: IEEE CommunicaRecogni-tions Surveys Tuto-rials 15.3 (2013), pp. 1192–1209.
[2] ML Ireland and JR Andrews. “Shoulder and elbow injuries in the young athlete”. In: Clinics in sports medicine 7.3 (July 1988), pp. 473–494.
ISSN: 0278-5919.URL: http://europepmc.org/abstract/
MED/3042157.
[3] I. Gori et al. “Multitype Activity Recognition in Robot-Centric Scenar-ios”. In: IEEE Robotics and Automation Letters 1.1 (2016), pp. 593–600. [4] Gobinath Aroganam, Nadarajah Manivannan, and David Harrison. “Re-view on Wearable Technology Sensors Used in Consumer Sport Appli-cations”. In: Sensors 19.9 (Apr. 2019), p. 1983.ISSN: 1424-8220.DOI: 10.3390/s19091983.URL: http://dx.doi.org/10.3390/ s19091983.
[5] Zhendong Zhuang and Yang Xue. “Sport-Related Human Activity De-tection and Recognition Using a Smartwatch”. In: Sensors 19.22 (Nov. 2019), p. 5001.ISSN: 1424-8220.DOI: 10.3390/s19225001.URL: http://dx.doi.org/10.3390/s19225001.
[6] Y. Hsu et al. “Human Daily and Sport Activity Recognition Us-ing a Wearable Inertial Sensor Network”. In: IEEE Access 6 (2018), pp. 31715–31728.
[7] Sing Loong Teng and R. Paramesran. “Detection of service activity in a badminton game”. In: TENCON 2011 - 2011 IEEE Region 10 Confer-ence. 2011, pp. 312–315.
[8] M. A. I. Anik et al. “Activity recognition of a badminton game through accelerometer and gyroscope”. In: 2016 19th International Conference on Computer and Information Technology (ICCIT). 2016, pp. 213–217. [9] Luis Benages Pardo, David Buldain Perez, and Carlos Orrite Uru˜nuela.
“Detection of Tennis Activities with Wearable Sensors”. In: Sensors 19.22 (Nov. 2019), p. 5004. ISSN: 1424-8220. DOI: 10 . 3390 /
s19225004. URL: http : / / dx . doi . org / 10 . 3390 / s19225004.
[10] Nur Azmina Rahmad, Muhammad Amir As’ari, and Mohamad Fauzi Ibrahim. “Vision Based Automated Badminton Action Recognition Us-ing the New Local Convolutional Neural Network Extractor”. In: En-hancing Health and Sports Performance by Design. 2020.ISBN: 978-981-15-3270-2.
[11] Martın Abadi et al. “Tensorflow: A system for large-scale machine learn-ing”. In: 12th {USENIX} Symposium on Operating Systems Design and Implementation ({OSDI} 16). 2016, pp. 265–283.
[12] Fabian Pedregosa et al. “Scikit-learn: Machine learning in Python”. In: Journal of machine learning research 12.Oct (2011), pp. 2825–2830. [13] L. Atallah et al. “Sensor Positioning for Activity Recognition Using
Wearable Accelerometers”. In: IEEE Transactions on Biomedical Cir-cuits and Systems 5.4 (2011), pp. 320–329.
[14] Alex Krizhevsky, Ilya Sutskever, and Geoffrey E. Hinton. “ImageNet Classification with Deep Convolutional Neural Networks”. In: Commun. ACM 60.6 (May 2017), pp. 84–90.ISSN: 0001-0782.DOI: 10.1145/ 3065386.URL: https://doi.org/10.1145/3065386. [15] S. V. Mora and W. J. Knottenbelt. “Deep Learning for Domain-Specific
Action Recognition in Tennis”. In: 2017 IEEE Conference on Computer Vision and Pattern Recognition Workshops (CVPRW). 2017, pp. 170– 178.
[16] Ben Van Herbruggen et al. “Wi-PoS : a low-cost, open source ultra-wideband (UWB) hardware platform with long range sub-GHz back-bone”. eng. In: SENSORS 19.7 (2019), p. 16.ISSN: 1424-8220.URL: http://dx.doi.org/10.3390/s19071548.
[17] Matteo Ridolfi et al. “Experimental evaluation of UWB indoor position-ing for sport postures”. eng. In: SENSORS 18.1 (2018).ISSN: 1424-8220.
URL: http://dx.doi.org/10.3390/s18010168.
[18] S. Ha and S. Choi. “Convolutional neural networks for human activity recognition using multiple accelerometer and gyroscope sensors”. In: 2016 International Joint Conference on Neural Networks (IJCNN). 2016, pp. 381–388.
COVID-19-preambule i
Dankwoord iii
Abstract iv
Lijst van Figuren xviii
Lijst van tabellen xx
Afkortingen xxii
1 Inleiding 1
1.1 Bestaande technologie¨en voor localisatie . . . 2
1.1.1 Algemene lokalisatie-technieken . . . 2
1.1.2 Motion Capturing (MOCAP) . . . 3
1.1.3 Ultra-wideband (UWB) . . . 4
1.1.4 Accelerometer . . . 8
1.1.5 Gyroscoop . . . 8
1.1.6 Coollang Koospur Xiaoyu Intelligent Badminton Sen-sor 3.0 . . . 9
INHOUDSOPGAVE xv
1.2 Probleemstelling en doel van de masterproef . . . 11
1.3 Verdere indeling van deze thesis . . . 12
2 Meetcampagne 13 2.1 Overzicht meetcampagne . . . 13
2.2 Welke slagen willen we kunnen onderscheiden? . . . 15
2.2.1 Korte service . . . 15 2.2.2 Clear . . . 15 2.2.3 Smash . . . 16 2.2.4 Netdrop . . . 16 2.2.5 Lob . . . 16 2.2.6 Drive . . . 16 2.2.7 Dab/block . . . 16
2.3 Axivity AX6 sensor . . . 17
2.4 MOCAP: Qualisys . . . 19 2.5 UWB: Time-difference-of-arrival . . . 20 2.5.1 Kalman-filter . . . 21 2.6 UWB: Two-way-ranging . . . 21 2.7 Vergelijken positioneringssystemen . . . 22 2.8 Sensor Fusion . . . 24
2.8.1 Waarom Sensor Fusion gebruiken? . . . 24
2.8.2 Sensordata combineren . . . 24
3 Positionering 26 3.1 Positionering op het veld . . . 26
3.2 Two-way ranging . . . 27
3.3 Snelheid verplaatsingen . . . 29
3.5 Return naar de basispositie . . . 31
3.6 Afgelegde afstand speler . . . 31
4 Badmintonslagen 32 4.1 Machinaal leren: slagen herkennen . . . 32
4.2 Implementatie algoritme . . . 33
4.2.1 Supervised learning . . . 33
4.2.2 Voorbereiding . . . 33
4.2.3 Keras Convolutional Neural Networks . . . 35
4.2.4 Lagen van het model . . . 36
4.2.5 Compileren van het model . . . 37
4.2.6 Trainen van het model . . . 38
4.2.7 Gebruik van het model . . . 38
4.3 Overfitting en underfitting . . . 38
4.4 Voorspellen realistisch scenario . . . 39
4.5 Vergelijken van voorspellingen . . . 40
4.6 Accelerometer en gyroscoop . . . 41
4.7 Alleen accelerometerdata . . . 41
4.8 Meest geschikte positie voor het plaatsen van sensoren . . . 43
4.9 Fouriertransformatie . . . 44
4.10 Zoeken optimale parameters . . . 45
4.10.1 Experimentele bepaling framesize . . . 45
4.11 Lagere samplefrequenties . . . 46
4.12 Ensemble learning . . . 46
4.13 Zekerheid van het model . . . 49
4.14 Overkoepelende categorie¨en . . . 50
4.15 Toevoegen locatie speler . . . 50
INHOUDSOPGAVE xvii 4.17 Bepalen tijdstip raakpunt shuttle . . . 51 4.18 Aantal slagen . . . 52 4.19 Gebruiksgemak . . . 54
5 Houding 55
5.1 Relatieve positie racket op moment van raken shuttle . . . 55
6 Feedback 57
6.1 Webapplicatie . . . 57 6.2 Feedback voor de gebruiker . . . 59
7 Conclusie 62
1.1 Mocap-visualisatie [5] . . . 3
1.2 UWB-shield met externe omnidirectionele antenne . . . 6
1.3 Symmetrische TWR: Timing . . . 7
1.4 Asymmetrische TWR: Timing [10] . . . 7
1.5 Yaw, pitch, roll . . . 9
1.6 Koospur Xiaoyu 3.0 . . . 9
1.7 Coollang badminton app . . . 10
2.1 Beschrijvingen metingen . . . 14
2.2 Clear . . . 15
2.3 Netdrop . . . 16
2.4 Dab . . . 16
2.5 Axivity AX6: accelerometer en gyroscoop . . . 17
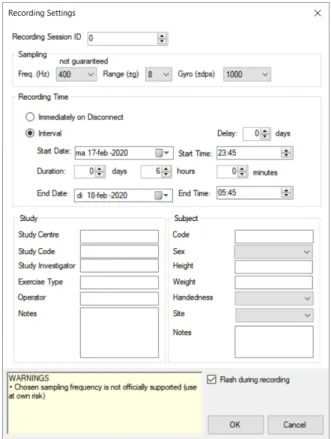
2.6 Open movement - startpagina . . . 18
2.7 Open movement - record . . . 19
2.8 Qualisys Miqus camera . . . 20
2.9 Ruis op UWB-metingen . . . 21
2.10 Resultaat Kalman-filter . . . 22
2.11 Sensordata combineren: tijdstippen . . . 25
3.1 Badmintonveld: afmetingen en slagen . . . 27
3.2 Posities ankerpunten . . . 28
3.3 TWR-anchors op badmintonplein . . . 29
3.4 Snelheidsmeting: TWR . . . 30
3.5 Snelheidsmeting: MOCAP . . . 30
4.1 Overzicht trainingsproces van het model . . . 34
4.2 Samenvatting model CNN . . . 37
4.3 Accuraatheid en loss van het model . . . 40
4.4 Confusionmatrix: voorspelling scenario met enkel accelero-meterdata, bemonsteringsfrequentie = 100Hz . . . 43
4.5 Posities sensoren . . . 44
4.6 Vergelijking precision,recall en f1-score gemeten met enkel ac-celerometerdata of in combinatie met gyroscoopdata bij ver-schillende frequenties . . . 47
LIJST VAN FIGUREN xix 4.7 Ensemble learning: combineren output vijf modellen . . . 48 4.8 Confusionmatrix: framesizes van 0.4, 0.6, 0.8, 1, 1.2, 1.4 en
1.6 seconden, zonder extra gewichten . . . 49 4.9 Samenvatting model DNN . . . 52 4.10 Accelerometerdata: links: slag zonder raken shuttle, rechts:
dezelfde slag waarbij shuttle geraakt wordt. . . 53 4.11 Smash: origineel signaal . . . 53 4.12 Smash: signaal na correlatie en piekdetectie . . . 54 5.1 Mogelijke TWR-opstelling voor het meten van relatieve
posi-tie racket t.o.v schouder . . . 56 6.1 Upload accelerometerdata . . . 59 6.2 Dashboard . . . 61
2.1 Overzicht van de voor- en nadelen van de positioneringssys-temen . . . 23 4.1 Precision, recall en f1 score: accelerometer- en gyroscoopdata 42 4.2 Precision, recall en f1 score: accelerometerdata . . . 42 4.3 Beste framesize voor elk type slag . . . 46
List of Listings
1 Convert mocapdata to csv . . . 69
API Application Programming Interface CNN Convolutional Neural Network CSS Cascading Style Sheets
CSV Comma Separated Value
CWA Continuous Wave Accelerometer Data File DNN Deep Neural Network
DPS Degrees Per Second
HTTP Hypertext Transfer Protocol
Hz Hertz
IEEE Institute of Electrical and Electronics Engi-neers
MOCAP Motion Capturing
MQTT Message Queueing Telemetry Transport MVC Model-View-Controller
OMGUI Open-Movement Graphical User Interface REST Representational State Transfer
RSSI Received Signal Strength Indicator TDOA Time Difference Of Arrivals
TOF Time Of Flight TWR Two-Way Ranging
URI Uniform Resource Identifier UWB Ultra-wideband
WAVE Waveform Audio File Format
“The hardest skill to acquire in sport is the one where you compete all out, give it all you have, and you are still getting beat no matter what you do. When you have the killer instinct to fight through that, it is very special.”
˜Eddie Reese, Olympisch zwemcoach
1
Inleiding
Badminton is een Olympische discipline en ´e´en van de meest geliefde rac-ketsporten wereldwijd. Vooral in Aziatische landen is de sport erg populair. Badminton wordt zowel op recreatief als op professioneel niveau gespeeld. Hierbij zijn techniek, tactiek, positionering, precisie en snelheid van groot belang. Veel recreanten streven er dan ook naar een hoger niveau te be-reiken. Om de persoonlijke prestaties van badmintonspelers te verbeteren, wordt steeds gezocht naar technologie¨en die kunnen helpen bij het optima-liseren van de trainingen. Door het verzamelen van de juiste informatie kan het werk van coaches verlicht worden en wordt een meer objectieve, persoonlijke feedback per speler mogelijk. Deze technische ondersteuningen zorgen er ook voor dat gerichte feedback aan een meer democratische prijs mogelijk wordt. De laatste jaren groeit dan ook de vraag tot zulke techno-logie¨en exponentieel. Ook het onderzoek naar het technisch analyseren van diverse sporten neemt toe. Dit omvat onder andere het exact bepalen van de positie en de bewegingen van de sporter tijdens de trainingen en spelsi-tuaties. Hiervoor worden technologie¨en uit allerlei prijsklassen gebruikt. In de komende secties van 1.1 wordt wat meer aandacht besteed aan de reeds gebruikte technologie¨en.
De meeste huidige technologie¨en richten zich echter op het meten van infor-matie in verband met bewegingen bij tennis. Een bestaande, veelgebruikte methode is motion capturing. Deze technologie heeft als voordeel dat dit erg nauwkeurige resultaten oplevert. Een nadeel echter is de vrij hoge kostprijs en de plaats die nodig is voor zo een volledig systeem op te zetten. Een verdere bespreking over deze optische technologie wordt gegeven in sectie 1.1.2. Door de nadelen van dit systeem wordt voor de positionering vaak
gebruik gemaakt van Ultra-wideband. Deze technologie zal ook in deze ex-perimenten gebruikt worden als onderdeel van de metingen. De werking hiervan wordt verder toegelicht in sectie 1.1.3.
1.1
Bestaande technologie¨
en voor localisatie
1.1.1 Algemene lokalisatie-technieken• RSSI: Received Signal Strength Indicator is een geschatte meting van hoe goed een apparaat signalen kan detecteren en ontvangen. Bij het uitzenden van een signaal naar een grotere afstand wordt dit signaal zwakker en wordt de bandbreedte van de draadloze dataverbinding langzamer. Dit leidt tot een beperktere totale doorvoer van gegevens. RSSI wordt gemeten in decibel. Hoe hoger de waarde, hoe sterker het ontvangen signaal is. Door de ontvangen signaalsterkte van verschil-lende ankerpunten op een bepaalde locatie te meten, kan de exacte locatie van een persoon binnen enorme gebouwen of terreinen zoals de universiteitscampus of het winkelcentrum geschat worden [1].
• Tof: De meest gebruikte techniek om objecten te positioneren, maakt gebruik van drie of meer afstandsmetingen tot bepaalde vooropgestelde ankerpunten. Uit een signaal wordt dan de afstand tot elk van deze punten bepaald. Door het gebruik van drie pakketten wordt de tijd, die afgelegd wordt tussen 2 radios, gemeten. De drie pakketten dienen ervoor om problemen met clock drift en synchronisatie weg te propa-geren. Combinatie van de bekomen gegevens leidt tot de lokalisatie van het object.
Deze techniek wordt trilateratie of multilateratie, in het geval van meer dan drie nodes, genoemd. Voor het meten van de afstand wordt hier gebruik gemaakt van radiogolven. Deze verplaatsen zich aan de lichtsnelheid waardoor de afstand eenvoudig kan afgeleid worden uit de Time of Flight (ToF) [2]. Een voorbeeld hiervan is Two-way ranging dat we verderop in 1.1.3.2 bespreken.
• TDoA: ToA (Time Of Arrival) en TDoA (Time Difference of Arrival) maken gebruik van geometrische relaties, op basis van afstanden of afstandsverschillen tussen een mobiel station en een aantal vaste ter-minals. Op basis van deze techniek kan men de huidige co¨ordinaten van het mobiele doel dan bepalen. Gegevens voor schattingen van afstanden worden afgeleid van de aankomsttijden van radiosignaal-perioden bij een of meer ontvangers. De ToA-methode gebruikt de transittijd tussen zender en ontvanger direct om de afstand te vinden, terwijl de TDoA-methode de locatie berekent op basis van de verschil-len in aankomsttijden gemeten op paren transmissiepaden tussen de doel- en vaste terminals. Zowel ToA als TDoA zijn gebaseerd op het
1.1. BESTAANDE TECHNOLOGIE ¨EN VOOR LOCALISATIE 3 Time-of-Flight (ToF) principe van afstandsmeting waarbij de waarge-nomen parameter, tijdsinterval, wordt omgezet in afstand door verme-nigvuldiging met de voortplantingssnelheid. In ToA worden locatie-schattingen gevonden door het bepalen van de snijpunten van cirkels of bollen waarvan de middelpunten zich op de vaste stations bevinden en de stralen geschatte afstanden tot het doel zijn. TDoA lokaliseert het doel op de kruispunten van hyperbolen of hyperbolo¨ıden, afhankelijk van het feit of er in twee of drie dimensies gewerkt wordt [3].
• AoA: De Angle-of-Arrival van een signaal is de richting waarin het signaal wordt ontvangen. AoA-metingen kunnen gedaan worden door het bepalen van de voortplantingsrichting van een radiogolf die invalt op een antenne. Ook kan het bepaald worden uit de maximale sig-naalsterkte tijdens antennerotatie. De AoA kan overigens ook worden berekend door het tijdsverschil van aankomst (TDoA) tussen indivi-duele elementen van de antenne te meten [4].
Een methode die hiervan gebruik maakt is triangulatie. In tegenstel-ling tot lateratie worden niet alleen de afstanden tot de sensor maar ook hoeken gebruikt om de positie van een object te bepalen. Voor een tweedimensionale locatiebepaling zijn twee hoeken en ´e´en lengte nodig.
1.1.2 Motion Capturing (MOCAP)
Motion capturing is een optische techniek die mogelijk maakt menselijke be-wegingen te registreren en de positie van een object in de ruimte te traceren. Deze techniek is erg nauwkeurig: metingen kunnen, afhankelijk van het ge-bruikte systeem, gebeuren tot op centimeter-, millimeter- of submillimeter-niveau. Het is dan ook erg nuttig voor de experimenten gedurende deze thesis. Zo kan elke beweging van een badmintonspeler in detail geanaly-seerd worden. Tevens is het ook mogelijk hiervan een 2D- of 3D-visualisatie te maken en hier relevante gegevens uit af te leiden.
Figuur 1.1: Mocap-visualisatie [5]
Deze techniek werkt door middel van verschillende tags, ook wel markers genoemd, die op het te positioneren object geplaatst worden. Ook zijn er een aantal camera’s voor de registratie. Deze camera’s werken op basis van
infrarood-straling. Tijdens de experimenten in deze masterproef wordt ge-bruik gemaakt van passieve markers, zoals in Figuur 1.1. Deze zijn allemaal identiek en hebben een reflecterende coating die het uitgezonden licht terug naar de camera’s reflecteert. Het spreekt voor zich dat voldoende tags voor genoeg camera’s in het gezichtsveld moeten liggen om het object te herken-nen. Pas dan kunnen correcte metingen uitgevoerd worden. Voor metingen in drie dimensies moeten de tags minstens door drie camera’s te registreren zijn. De posities van de camera’s en de tags moeten dan ook goed geko-zen worden. Er worden echter meestal veel meer tags op het lichaam van de proefpersoon geplaatst. Hierdoor kan buiten de locatie van een persoon ook de beweging van verschillende ledematen in de drie dimensies in kaart gebracht worden. Deze technologie wordt reeds gebruikt in verschillende toepassingen zoals in gespecialiseerde sport-laboratoria, computeranimaties of bij virtual reality in videogames en films. Meer details over het gebruikte systeem worden besproken in sectie 2.4.
1.1.3 Ultra-wideband (UWB)
De Ultra-wideband radiotechnologie stelt ons in staat om objecten bin-nen en buiten te lokaliseren met een gemiddelde afwijking van minder dan 30 centimeter. Zowel de Time Difference of Arrival (TDoA) als de Two-way ranging-methode kunnen deze nauwkeurigheid bereiken. De Two-Two-way ranging-lokalisatie-techniek over het algemeen nauwkeuriger [6].
Ultra-wideband (UWB) is een hot topic in de binnenlokalisatie, aangezien UWB-zendontvangers, compatibel met de IEEE 802.15.4a-standaard, steeds toegankelijker worden. De korte UWB-pulsen resulteren in een hoge tijds-resolutie in de grootteorde van nano- of picoseconden, waardoor centimeter-precisie lokalisatie mogelijk is met uitstekende immuniteit tegen multipad-vervaging. Bovendien resulteert de hoge bandbreedte (meer dan 500 MHz) van de technologie in een hoge kanaalcapaciteit, volgens de theorie van Shannon-Hartley, wat leidt tot veelbelovende vooruitzichten op het gebied van gegevenssnelheid en stroomverbruik. Ook maakt de hoge kanaalcapaci-teit lage zendvermogens mogelijk, waardoor bandbreedte-interferentie met bestaande draadloze technologie¨en wordt vermeden [7].
We hebben dus veel bandbreedte nodig. Deze is echter erg geliefd voor de vele communicatie-toepassingen. Als iedereen signalen op dezelfde fre-quenties zou uitzenden, zouden alle signalen interfereren en zou er niemand nog iets zinvols kunnen ontvangen. Hierdoor is het gebruik van het frequen-tiespectrum sterk gereguleerd door de overheidsinstanties. UWB-systemen mogen alleen met zeer laag vermogen uitzenden (de vermogensspectrum-dichtheid moet lager zijn dan−41, 3 dBm / MHz ). Deze zeer strikte beper-king betekent dat een enkele puls niet ver reikt: bij de ontvanger zal de puls waarschijnlijk onder het ruis-niveau liggen. Een UWB-pakket bevat in het
1.1. BESTAANDE TECHNOLOGIE ¨EN VOOR LOCALISATIE 5 begin een preamble bestaande uit een, in te stellen, aantal symbolen (64-128-256-512-...). Elk symbool bestaat uit een aantal pulsen en duurt ongeveer 1 nanoseconde. Bij de ontvanger worden de ontvangen pulsen geaccumuleerd en met voldoende pulsen zal het vermogen van de ’geaccumuleerde puls’ boven het ruis-niveau stijgen. Op deze manier is ontvangst mogelijk [2]. Wanneer de ontvanger een piek ziet verschijnen, kan deze synchroniseren met de zender om daarna het data-gedeelte te ontvangen. De timestamp wordt genomen op basis van de geaccumuleerde symbolen. Deze techniek is gekend als Channel Impulse Response (CIR).
1.1.3.1 Gebruikt UWB-systeem
Het UWB-systeem waar is deze paper mee gewerkt wordt is Wi-PoS. Dit is een open source hardwareplatform dat gebruikt kan worden voor nauw-keurige UWB-lokalisatie. Het werd ontwikkeld binnen de onderzoeksgroep van de Universiteit Gent. Hierbij wordt gebruik gemaakt van de Decawave DW1000 UWB-transceiver. Deze heeft een aantal unieke kenmerken:
• Ondersteuning van zowel lange-afstand sub-GHz en 2,4 GHz back-end communicatie tussen knooppunten
• Flexibele interface met externe UWB-antennes
• Eenvoudige implementatie van de MAC-laag met het Time-Annotated Instruction Set Computer-raamwerk (TAISC)
Zowel hardware als software zijn open source en alle parameters van de UWB-ranging kunnen aangepast, gekalibreerd en geanalyseerd worden [7]. Het ontwikkelde UWB-shield en de daarop aangesloten externe omnidirec-tionele antenne, wordt weergegeven in Figuur 1.2. Ook de markers (grijze bolletjes) van het mocap-systeem zijn hierop zichtbaar.
1.1.3.2 Two-Way Ranging
Two-way ranging (TWR) is een proces waarbij radio-transmissies worden getimed tussen twee apparaten en wiskundig worden gecombineerd om de af-stand of het bereik tussen de apparaten te bepalen. TWR omvat drie trans-missies tussen apparaten en lost het probleem van oscillator-synchronisatie op. Gegeven een systeem met gesynchroniseerde oscillatoren zou het mo-gelijk zijn om de zend- en ontvangsttijden voor een enkele transmissie te vergelijken en de afstand (d) te bepalen als het verschil in tijd vermenigvul-digd met de snelheid van het licht (C).
d = C(tt2− tt1)− (ta2− ta1) + (ta3− ta2)− (tt3− tt2) 4
Figuur 1.2: UWB-shield met externe omnidirectionele antenne
Het diagram in Figuur 1.3 toont de typische symmetrische TWR-timing tussen twee apparaten. Het eerste pakket wordt verstuurd door de tag op tijdstip tt1. Er is een vertraging vanwege signaalvoortplanting door de lucht tussen de apparaten. Het signaal wordt vervolgens ontvangen op tijdstip ta1 op het tweede apparaat. Er is een korte vaste vertraging voordat het tweede apparaat terugzendt naar de oorspronkelijke apparaten. Dit proces wordt meermaals herhaald [8].
Het gebruikte Wi-PoS-systeem maakt echter gebruik van asymmetrische TWR. Dit heeft als voordeel dat de klokafwijkingen in zender en ontvanger opgeheven worden, evenals de verschillende antwoordtijden tussen berichten. De werking is weergegeven in Figuur 1.4. Hierbij is het apparaat A dat een eerste round trip measurement initieert waarop apparaat B reageert, waarna apparaat B het tweede round trip measurement start waarop apparaat A op zijn beurt reageert en de volledige uitwisseling voltooit. Elk apparaat houdt de precieze transmissie- en ontvangsttijden van de berichten bij. De resulte-rende schatting van de vluchttijd, Tprop, kan worden berekend met behulp van de uitdrukking [9]:
Tprop =
(Tround1∗ Tround2)− (Treply1∗ Treply2) Tround1+ Tround2+ Treply1+ Treply2
1.1. BESTAANDE TECHNOLOGIE ¨EN VOOR LOCALISATIE 7
Figuur 1.3: Symmetrische TWR: Timing
Figuur 1.4: Asymmetrische TWR: Timing [10]
Two-way ranging vereist enkel dat de tag in het bereik van het anker ligt om ermee te kunnen rangen. Er is geen precieze synchronisatie van de ankers vereist, wat de robuustheid van het systeem verhoogt.
1.1.4 Accelerometer
Een accelerometer is een toestel dat gebruikt wordt voor het meten van versnellingen volgens drie assen: X, Y en Z. Sommige versnellingsmeters maken gebruik van het pi¨ezo-elektrische effect. Deze bevatten microscopi-sche kristalstructuren die een spanning genereren onder invloed van versnel-lingskrachten. Een andere manier om dit te doen is door veranderingen in capaciteiten waar te nemen. Als je twee microstructuren naast elkaar hebt, is ertussen een bepaalde capaciteit aanwezig. Wanneer een versnellings-kracht een van de structuren in beweging brengt, verandert deze capaciteit. De capaciteitsmetingen leiden dus ook tot de gewenste data. Accelerometers worden vandaag de dag in veel diverse toepassingen gebruikt. Ze worden on-der anon-dere ingebouwd in mobiele toestellen, gebruikt in de medische sector en bij transport.
1.1.5 Gyroscoop
De gyroscoopsensor is een apparaat dat de hoeksnelheid van een object kan meten. Dit type sensor is geavanceerder dan een accelerometer doordat het de kanteling en laterale ori¨entatie van het object kan bepalen, terwijl de versnellingsmeter alleen de lineaire bewegingen kan meten. Gemeten in gra-den per seconde is hoeksnelheid de verandering van de rotatiehoek van het object per tijdseenheid. Voor robuustere en nauwkeurigere bewegingsdetec-tie worden in consumentenelektronica gyroscoopsensoren gecombineerd met versnellingsmetersensoren. Afhankelijk van de richting zijn er drie soorten hoeksnelheidmetingen:
• Yaw: de horizontale rotatie op een vlak oppervlak wanneer het object van bovenaf wordt gezien
• Pitch: Verticale rotatie zoals het object van voren wordt gezien • Roll: de horizontale rotatie wanneer het object van voren wordt gezien. Deze assen worden ook visueel voorgesteld in Figuur 1.5
Gyroscopen werken volgens het concept van Coriolis-krachten. In deze sen-sor om de hoeksnelheid te meten, wordt de rotatiesnelheid van beweegbare onderdelen binnen de sensor omgezet in een elektrisch signaal.
Gyroscopen hebben een groot aantal toepassingen. Zo worden ze gebruikt in vliegtuigen, elektronische stabiliteitscontrolesystemen van voertuigen, bewe-gingsdetectie voor mobiele games, camerabewebewe-gingsdetectiesystemen in di-gitale camera’s, radiogestuurde helikopters, robotsystemen, enzovoort...[11]
1.1. BESTAANDE TECHNOLOGIE ¨EN VOOR LOCALISATIE 9
Figuur 1.5: Yaw, pitch, roll
1.1.6 Coollang Koospur Xiaoyu Intelligent Badminton Sen-sor 3.0
Figuur 1.6: Koospur Xiaoyu 3.0 Een reeds bestaand commercieel
product, weergegeven in Figuur 1.6 [12], is de Koospur Xiaoyu 3.0. Dit kleine toestel bevat een geomagne-tische sensor, een 3-axis accelerome-ter en een 3-axis gyroscoop. Dit ap-paraat is eenvoudig te bevestigen op de achterzijde van de badmintonrac-ket en kan via Bluetooth met een smartphone verbonden worden. Op basis van de ingebouwde sensoren worden de uitgevoerde bewegingen
gecategoriseerd en visueel weergegeven in de bijhorende mobiele applicatie. Er worden zes soorten slagen herkend: clear, drive, lift, smash, block/dab en slice/netdrop. Voor ieder type slag wordt weergegeven hoe vaak deze gespeeld werd. Van de laatst gespeelde slag wordt ook de snelheid weerge-geven. Dit wordt getoond in Figuur 1.7a. Het overzicht van de gespeelde slagen geeft een goede indicatie van het spelgedrag van de badmintonner. De slagen worden door de applicatie ingedeeld in vijf categorie¨en zoals te zien in Figuur 1.7b: de smash, forehand overhead shot, backend overhead shot, forehand underarm shot en backend underarm shot. Op basis van het aantal slagen die zich in elke klasse bevinden, classificeert de applicatie het spelgedrag in ’balanced ’ of ’unbalanced ’. Er wordt ook een schatting gemaakt van het aantal verbrande calorie¨en.
(a) startscherm (b) categorie¨en (c) detailinfo Figuur 1.7: Coollang badminton app
Er is bovendien ook een mogelijkheid om de historiek van alle gespeelde slagen te bekijken. Hierbij wordt het soort slag, de snelheid, de kracht en een welbepaalde hoek weergegeven. Dit wordt weergegeven in Figuur 1.7c. Ondanks het feit dat de applicatie er mooi uitziet, zijn er toch een aan-tal tekortkomingen:
• Aangezien de applicatie en sensor amper gedocumenteerd zijn, is het niet echt duidelijk waarvoor alle weergegeven data precies staat. • Het is niet mogelijk de zuivere data uit de ingebouwde sensoren te
achterhalen.
• De betrouwbaarheid is niet optimaal. Dit blijkt ook uit de testen die werden uitgevoerd met deze sensor. Zo is de categorisatie van bepaalde slagen niet steeds correct: een clear wordt soms als een slice of lift geclassificeerd.
• De sensor wordt aan de onderkant van de grip van de racket bevestigd waardoor de gewichtsverdeling van de racket verstoord wordt.
• Er wordt geen rekening gehouden met de stand van de voeten en po-sitionering op het badmintonveld.
1.2. PROBLEEMSTELLING EN DOEL VAN DE MASTERPROEF 11 Kortom, deze sensor en bijhorende applicatie zijn een leuke tool voor de doorsnee badmintonamateur maar verder hebben deze amper een weten-schappelijke waarde. Ze zijn dan ook op hoger niveau niet echt bruikbaar.
1.2
Probleemstelling en doel van de masterproef
Badminton is een erg populaire sport bij zowel jong als oud. Idealiter zouden spelers de hele tijd gecoacht moeten worden door specifiek opgeleide trai-ners om zaken zoals tactiek en techniek te optimaliseren. Dit brengt echter een hoge kostprijs met zich mee en trainers zijn ook niet altijd beschikbaar. Een alternatief is om de speler zo veel mogelijk zelfstandig te laten oefenen en zijn bewegingen op het veld in kaart te brengen. Hierbij verzamelt een systeem informatie over het spelgedrag en technische imperfecties. Op basis van de gemeten data kunnen trainers doelgericht de kwetsbare punten bij een individuele speler aanpakken door hier extra de nadruk op te leggen. Huidige commerci¨ele systemen zijn niet erg uitgebreid en niet nauwkeurig genoeg voor professioneel gebruik. Tevens verbergen ze sommige cruciale informatie waardoor er geen correct totaalbeeld van het spelersprofiel kan worden opgesteld. Alternatieven zoals motion capturing zijn erg nauwkeu-rig maar hebben een hoge kostprijs en vereisen nauwkeunauwkeu-rige installatie en kalibratie. Ook is het voor spelers niet gebruiksvriendelijk wanneer men tientallen mocap-tags op het lichaam moet bevestigen.Het doel van deze thesis is door middel van verschillende beschikbare techno-logie¨en zo relevant mogelijke informatie te bekomen van een badmintonspeler die dan ook bruikbaar is in de praktijk voor professionele opvolging en bege-leiding. Deze informatie moet voldoende uitgebreid en nauwkeurig zijn om hier achteraf bepaalde relevante conclusies uit te kunnen trekken. Tijdens het onderzoek zal onderzocht worden welke sensoren de meest bruikbare data opleveren en tevens in beperkte mate hinderlijk zijn voor de spelers zelf. Bovendien zal er rekening moeten gehouden worden met beperkingen van de hardware. Zo zal er een afweging gemaakt moeten worden tussen nauwkeurigheid, de maximaal haalbare rekencapaciteit, connectie naar het internet, energieverbruik en verplaatsbaarheid. Daarnaast moet er ook naar de kostprijs gekeken worden. Het opmeten van een badmintonspeler zal tot doel hebben om een analyse uit te voeren en een volledig spelersprofiel op te stellen. Hierdoor kunnen mogelijke onzuiverheden in de techniek die re-sulteren in chronische blessures vroegtijdig opgespoord worden.
Onderzoeksvraag 1: Hoe kan men op een zo effici¨ent mogelijke manier correcte, bruikbare data verzamelen om de prestaties van een badmintonner te analyseren?
Onderzoeksvraag 2: Hoe nauwkeurig kunnen slagbewegingen correct geclassificeerd worden op basis van accelerometer- en gyroscoopdata?
Onderzoeksvraag 3: Hoe goed presteren bestaande commerci¨ele pro-ducten in vergelijking met dure, accurate technieken?
1.3
Verdere indeling van deze thesis
Het vervolg van deze masterproef wordt als volgt ingedeeld: In het volgende hoofdstuk wordt er dieper ingegaan op welke zaken we willen meten. Hier-bij worden ook verschillende bestaande systemen, die gebruikt zullen worden tijdens de metingen, kort toegelicht. We bespreken er ook het combineren van sensordata. Vervolgens geeft Hoofdstuk 3 een vergelijkende studie van de gebruikte positioneringstechnieken. Er wordt ook gekeken in hoeverre hier op een betrouwbare manier extra informatie kan bepaald worden. In Hoofdstuk 4 wordt dieper ingegaan op activiteisherkenning gericht op bad-minton en het trainen van het computermodel. We onderzoeken ook welke andere relevante informatie we kunnen afleiden uit dit signaal. Hoofdstuk 5 bekijkt hoe we de houding van de speler op het veld kunnen monitoren. In Hoofdstuk 6 wordt gekeken hoe gebruikers op een eenvoudige manier de bekomen data kunnen raadplegen en hoe deze data de trainingen kan on-dersteunen. Ten slotte worden in Hoofdstuk 7 de besluiten geformuleerd, gevolgd door de bibliografie en enkele bijlagen.
2
Meetcampagne
2.1
Overzicht meetcampagne
Het eerste deel van de meetcampagne is het bepalen van de scenario’s die we willen meten. Hierbij wordt in hoofdzaak gekeken naar de mate waarin de meting relevant is. Er wordt onderscheid gemaakt tussen relevantie op het vlak van techniek en training enerzijds en tactiek/strategie anderzijds. Ook wordt er bepaald op welke manieren deze zaken gemeten kunnen worden. Een overzicht wordt gegeven in Figuur 2.1. De metingen worden onderver-deeld in drie categorie¨en: positionering, slagtechniek en houding.
Per categorie worden de metingen gerangschikt volgens hun score op het vlak van relevantie. Indien een meting geen score krijgt voor een welbe-paalde categorie, heeft de meting geen relevante inbreng in deze categorie. In de daarop volgende kolom worden de technologie¨en, die mogelijks gebruikt kunnen worden voor deze specifieke meting, beschreven. Ook de te onder-zoeken posities voor het bevestigen van de sensoren worden opgegeven. Een verdere bespreking van de technologie¨en volgt verderop in dit hoofdstuk. In de laatste kolom wordt een beschrijving gegeven van wat de meting juist inhoudt en waarom het relevante info kan opleveren.
Voor deze thesis werd gekozen om de metingen die in het vet zijn aangeduid in de tabel gedetailleerd uit te werken. Dit omvat de positionering van de speler, het bepalen van het type activiteit en de relatieve positie van de rac-ket op het moment van het raken van de shuttle. Positionering door middel van een accelerometer zal niet uitgewerkt worden. De eerste metingen geven namelijk aan dat de afwijkingen in de accelerometer te groot zijn om hieruit correcte posities uit af te leiden.
Figuur
2.1:
Besc
hrijvingen

![Figuur 1.4: Asymmetrische TWR: Timing [10]](https://thumb-eu.123doks.com/thumbv2/5doknet/3273349.21358/31.892.154.700.750.945/figuur-asymmetrische-twr-timing.webp)