Modelling local
environmental
quality and its
impact on health
Background document for an
international scientific audit of
PBL team LOK
Assessment of local environment and health and policy evaluation
In June 2008, the Quality of the Local Environment Team (LOK) of the Netherlands Environmental Assessment Agency (PBL) was submitted to an international scientific audit. Subject of the audit were the methods used by the team for the evaluation of government policy, concerning the quality of the physical local environment and the consequences thereof for human health and well-being. This concerns the dossiers air traffic, noise, air quality, external safety and health in relation to environmental quality.
This report has been compiled to provide the audit committee with the necessary information to conduct the audit.
The present report extensively addresses the methods and data that are important to these dossiers and the uncertainties that play a role in them. A separate chapter describes how uncertainties are dealt with in the policy evaluation. Besides making a scientific evaluation of the work, the audit committee has also been requested to evaluate whether the scientific research sufficiently links up with the policy evaluations. The report, therefore, briefly describes the relevant policies in the various dossiers, with examples of policy evaluations.
Background Studies
and its impact on health
Modelling local environmental quality
and its impact on health
© Netherlands Environmental Assessment Agency (PBL), Bilthoven, August 2008 PBL-rapport 550034001
W.F. Blom (ed.) A.J. van Beek L. van Bree A.G.M. Dassen H.S.M.A. Diederen E.M. Kunseler P. Lagas F.J.A. van Rijn C.B.W. Schilderman O.C. van der Sluis K. van Velze
A.E.M. de Hollander
Design and layout
RIVM Publishing / Uitgeverij RIVM
Contact
Wim Blom, wim.blom@PBL.nl, telephone: +31 30 2743029
This research has been conducted on behalf of the PBL management, as part of the international audit of the PBL
This publication can be downloaded from the website www.pbl.nl/en. A hard copy may be ordered from reports@mnp.nl, citing the PBL publication number.
Parts of this publication may be used for other publication purposes, providing the source is stated, in the form: Netherlands Environmental Assessment Agency: Modelling local
environmental quality and its impact on health - Background document for an international scientific audit of PBL team LOK, 2008.
Netherlands Environmental Assessment Agency PO Box 303 3720 AH Bilthoven T: 030 274 274 5 F: 030 274 4479 E: info@pbl.nl www.pbl.nl
Abstract
Modelling local environmental quality and its impact on health
Background document for an international scientific audit of PBL team LOK
This report describes the methods used by the Quality of the Local Environment Team (LOK) for the evaluation of government policy concerning the quality of the physical local environment and the consequences thereof for health and well-being. This report has been written because of an international scientific audit of this part of the LOK programme.
The Advisory Council of the ‘Netherlands Environmental Assessment Agency’ (PBL in Dutch) has requested that an international audit of the PBL methods be conducted. As part of this PBL-wide audit, the dossiers for the physical local environment of the LOK team will be evaluated. This report has been compiled to provide the audit committee with the information required to conduct the audit. Besides making a scientific evaluation of the work, the audit committee has also been requested to evaluate whether the scientific research links up sufficiently with the policy evaluations. The report therefore briefly describes the relevant policy in the various dossiers, with examples of policy evaluations. This concerns the following dossiers: air traffic, noise, air quality, external safety and health in relation to environmental quality.
Because the policy dossiers are based on different traditions and approaches, the approach to research and policy evaluation also differs between the dossiers. The present report extensively addresses the methods and data that are important to these dossiers and the uncertainties that play a role in them. A separate chapter will describe how uncertainties are dealt with in the policy evaluation.
Contents
1 Introduction 9
2 The LOK dossiers on the physical local environment and health impacts 11 2.1 Air traffic 11
2.1.1 Developments in air traffic in the Netherlands 11 2.1.2 Air traffic as a subject of policy evaluation 12 2.1.3 PBL evaluations of Dutch airport policy 13 2.2 Noise 16
2.2.1 Developments concerning noise levels in the Netherlands 16 2.2.2 Noise as a topic for policy evaluation 17
2.2.3 PBL evaluations of noise policy in the Netherlands 18 2.3 Air quality 22
2.3.1 Developments concerning air quality in the Netherlands 22 2.3.2 Air quality as a topic for policy evaluation 23
2.3.3 PBL evaluations of air-quality policy in the Netherlands 24 2.4 External safety 28
2.4.1 Developments relating to External Safety in the Netherlands 28 2.4.2 PBL evaluations of External Safety policy in the Netherlands 29 2.5 Health impact 33
2.5.1 Environmental health context 33
2.5.2 Environment and health in a policy perspective 33 2.5.3 PBL evaluations of policy on environmental health 34 2.5.4 Developing an environmental health planner 40 3 Methods and data 41
3.1 Air Traffic 41
3.1.1 General characteristics of calculation models for air traffic noise and external safety risks 41
3.1.2 Reliability of the noise model 43
3.1.3 The reliability of the model for external safety risks 45 3.1.4 Prognosis 46
3.2 Noise 47
3.2.1 Indicators 47
3.2.2 Model description 50
3.2.3 The EMPARA roads database 51 3.2.4 Emissions 53
3.2.5 Noise propagation 56 3.2.6 Comparison of models 60
3.2.7 Validation of noise propagation modelling 63 3.2.8 Sensitivity analysis 67
3.3 Air quality 74 3.3.1 Indicators 74
3.3.2 Luvotool in schematic form 77 3.3.3 Traffic emissions 78
3.3.4 Urban dispersion 80 3.3.5 Non-urban dispersion 83
3.3.6 Contribution from traffic to the concentration 88 3.3.7 Large-scale concentration 90
3.3.8 Concentrations map of The Netherlands 92 3.3.9 Calculating indicators 92
3.3.10 Validation and uncertainties 93 3.4 External safety 101
3.5 Health impact 101 3.5.1 Context 101
3.5.2 Environmental health indicators 102 3.5.3 Emission-exposure modelling 104
3.5.4 Health impact assessment methods and tools 106 3.5.5 Uncertainties 112
3.5.6 Current and future EHP developments 117 4 Dealing with uncertainties 121
4.1 Air traffic 121 4.2 Air quality 122 4.3 Noise 124 4.4 Health 125 References 127
Appendix 1 Noise propagation 129
Appendix 2 Noise – Transmission attenuation due to barriers 131 Appendix 3 Noise – Object attenuation in the urban area 133 Appendix 4 Health Impact – Indicator specification 135 Appendix 5 Health Impact - Policy targets 137
Appendix 6 Health impact - Calculations according to different models 139 Appendix 7 Health impact - Input data for calculations 143
1 Introduction
This report describes the methods used by the Quality of the Local Environment Team (LOK) for the dossiers on the physical local environment and health. These methods are being subjected to an international audit. The aim of this report is to provide the audit committee with the neces-sary information.
Context and aim of the audit
Models play a crucial role in the work of the Netherlands Environmental Assessment Agency. It is impossible to understand the current environmental situation as a whole by means of meas-urements alone. Still more important is the fact that many evaluations concern future situations and the exploration of policy alternatives, where measurements are impossible by definition. The mission of the PBL and its practical implementation require that these models and
approaches correctly represent the current state of knowledge. Therefore, the Advisory Council of the PBL has requested that an international audit of these methods be conducted. The audit of the work of the LOK is one component of this larger audit.
The most important questions for this audit are the following: Do the models used by the
1. PBL present a relevant reflection of reality? Are the
2. PBL models in accordance with the scientific state-of-the-art? Is the input for the models sufficiently reliable, valid and up-to-date? 3.
Are the policy evaluations of
4. PBL/LOK sufficiently supported by the output of the models? Does the
5. PBL deal properly with the uncertainties in the model outputs?
In view of the answers to the preceding questions, can the audit committee make any recom-6.
mendations to the PBL for the future?
The mission of the PBL
The Netherlands Environmental Assessment Agency (PBL in Dutch) supports political and societal decision-making concerning economic, ecological, spatial and social-cultural qualities by evaluating the policy being conducted and exploring future developments, especially with respect to ecological quality.
Implementing the mission
The PBL provides evaluations and explorations of the quality of life in our country in relation to the environmental issue at the European and global scales. We focus primarily on supporting national decision-making on issues involving nature and the environment. We do this in coop-eration with other independent planning agencies in the Netherlands and with other research institutions. According to law, the PBL can provide independent advice to the government. Every year, the PBL publishes reports on the Environmental Balance and Nature Balance. Every four years, an Environmental Outlook and a Nature Outlook are published. These publications pay special attention to the possible effects of environmental policy on the health and well-being of people.
As part of this publication process, the Quality of the Local Environment Team (LOK) focuses specifically on local environmental quality and the corresponding impacts on health and well-being.
Readers guide
An international audit committee has been requested to evaluate the model-based activities of the LOK in the context of policy evaluation. This means not only that it is being asked to evalu-ate the methods (models and data), but also whether the models and the conclusions that emerge from the models are compatible with the context in which they are applied. This report has been drawn up in order to provide the audit committee with the knowledge it requires to conduct the audit. To help the committee evaluate the context of the methods and the policy evaluations, Chapter 2 provides a summary of the policy aspects that play a role in the various dossiers. In this chapter several examples of recently published policy evaluations are provided for each dossier. Chapter 3, with its descriptions of methods and data, forms the core of this report. The understanding of uncertainties plays an important role in research and in the evaluation and communication of research results. Chapter 4 therefore discusses how uncertainties are dealt with in policy evaluation and communication.
2 The LOK dossiers on the physical local
environment and health impacts
This chapter describes the dossiers of the Quality of the Local Environment Team (LOK) that concern the physical local environment and the health impacts due to the physical environmental burden. For the dossiers Air Traffic, Noise, Air Quality, External Safety and Health, the chapter describes the most important discussions, the contribution of the PBL to these discussions and how the policy evaluation takes place.
2.1
Air traffic
2.1.1 Developments in air traffic in the Netherlands
Air traffic causes noise annoyance and external safety risks for local residents and it contributes to local air pollution and the global climate issue. The massive increase in air traffic requires continued understanding and options to optimize the balance between the economy and ecology. The annual Environmental Balance always discusses noise annoyance and external safety risks from air traffic in the Netherlands. In addition, the PBL has published three policy evaluation reports about the developments around Schiphol Airport (PBL(a), 2005; PBL(a), 2006 and PBL(b), 2006) and one about the planned policy for regional airports (PBL(b), 2005). The reasons for these separate reports were 1) the evaluation of the Schiphol policy by the Ministries of V&W (Transport and Public Works) and VROM (Housing, Spatial Planning and the Environment), 2) the subsequent Cabinet decision on Schiphol Airport in May 2006 and 3) the change in legisla-tion for regional and military airports (Regeling Burgerluchthavens en Militaire Luchthavens, RBML, 2006). Reports PBL(a), 2005 and PBL(a), 2006 not only discuss noise annoyance but also external safety risks from air traffic. Report PBL(a), 2006 discusses the development in air quality around Schiphol. The main conclusions to these studies and the complete reports can be found at http://www.mnp.nl/nl/dossiers/luchtvaart/publicaties/index.html (all in Dutch).
More than 90% of the air traffic (passenger and freight) passes through Schiphol, the national airport. Schiphol is the fourth largest airport in Europe. The air traffic through Schiphol over the past 25 years has increased, on average, by nearly 8% annually. To enable further growth in the future, Schiphol was expanded with a fifth runway in 2003. At present, additional possibilities for expanding air traffic capacity in the Netherlands are being explored.
In addition to the national Schiphol Airport, the Netherlands has four civil airports for larger aircraft and about ten sites for smaller aircraft. There are about eight military airports, some of which can also be used by the general public.
In 2003, 12% of Dutch adults reported that they suffered serious annoyance from the noise of aircraft, 29% reported that they suffered
from the noise of road traffic, 22% from noise in their neighbourhood, and 2% from rail traffic noise. The absolute external safety risks involved in air traffic are very low. However, they are relatively high in the Netherlands when compared to the risks of other dangerous acti-vities such as the production and transport of hazardous substances. The noise annoyance near Schiphol Airport is particularly severe. The external safety risks are highest around the regional airports of Maastricht and Rotterdam. The detrimental impact of air traffic on the local air quality is small (< 2%) but is growing fast in absolute and relative terms. International studies show that the contribution of global air traffic to the emissions of greenhouse gases is between 2% to 5%. This contribution is expected to grow rapidly to approximately 10% in 2050.
2.1.2 Air traffic as a subject of policy evaluation
For over 15 years, Dutch air traffic policy has been aimed at giving Schiphol Airport the space it needs to develop into an airport with a large number of intercontinental destinations with connecting flights to the rest of Europe. This is known as the mainport concept. The Dutch government pursues this policy because the Dutch domestic market is deemed too small for a high-quality network with which Dutch passengers and shippers can reach the rest of the world easily and reliably. Such a network requires some of the intercontinental traffic flows to use Schiphol Airport as their stopover to their destination in Europe and vice versa. A large interna-tional airport is also attractive for internainterna-tional companies –often cited as a reason in favour of Schiphol expansion.
At the beginning of the 1990s it was decided to expand Schiphol Airport with an additional runway – the fifth runway – in order to allow it to handle the growing volume of air traffic. The were two main preconditions for the fifth runway: the noise annoyance had to be considerably reduced and the external safety risks were not to increase compared to the reference year 1990. This ambitious combination of expansion and improvement of the living conditions in the local environment became known as the dual aim.
Between 1998 and 2002, the current standard for the five runway system at Schiphol Airport was drawn up. The current standard deviates from the standard that was used before and that still applies to regional and small airports. Until 2003, when the fifth runway at Schiphol Airport was opened, the noise standards at Schiphol Airport were maintained on the basis of noise zones. Within these zones, requirements had been laid down for both the noise load and for the built-up zone, i.e. for the existing houses, insulation of houses or the construction of new houses. The idea behind noise zones was to have ‘optimal harmony’ between air traffic and the buildings on the ground. When the fifth runway came into use in February 2003, the aircraft noise level around the zones was no longer enforced. Since then, there are limit values in Lden for the annual aircraft noise on 35 sites around Schiphol Airport and in Lnight for the nocturnal noise on 25 sites. In addition, there are maximums for the aircraft noise produced in total (Total Volume, also in Lden and Lnight
From 2003 until early 2006, the Upper House of Parliament commissioned research to evaluate whether the aims of the policy had been fulfilled. This research mapped out the developments as they had taken place since 1990 in relation to noise, external safety risks and air traffic emis-sions (V&W and VROM, 2006). The government also carried out extensive research into the societal significance of Schiphol Airport as a mainport. In May 2006, the main findings of this research and of the evaluation were articulated in the Cabinet standpoint on Schiphol Airport, which continued the earlier theme of air traffic growth with simultaneous improvement of the living conditions in the local environment.
The Cabinet standpoint is currently being elaborated into tangible policy proposals and measures. Increasingly, it is being questioned whether all growth should be accommodated at Schiphol Airport, or whether some growth should be accommodated at one or more regional airports. Currently, the regional airports have limited capacity for taking on any traffic from Schiphol Airport. Moreover, in 2006 it was decided to put the provincial authorities in charge of the policy for these airports. The national government provided a number of rules for this, including several conditions regarding environmental norms and spatial planning. In practice,
these rules will lead to standards comparable to those for Schiphol Airport. Meanwhile, it has been decided that the national government will remain in charge of Lelystad Airport.
The policy process in the Netherlands can be characterized as ‘corporatistic’, which means that a relatively large number of stakeholders participate in the policy process and that a consensus is sought regarding the direction of policy. In addition, a relatively large role is given to several research institutes and planning offices, which can advise and inform the government on the basis of scientific and economic research.
Problem definition and research questions
The characteristics of the policy process with respect to the content and administration are important in the PBL evaluations. On the basis of these characteristics, PBL has defined the problem as follows.
– Is it possible to further optimize the relationship between the economic advantages of an increase in air traffic and the negative effects of this air traffic on the residents near Dutch airports?
This problem definition has been converted into the following research questions:
– What are the negative effects and how can they be assessed and weighed? How can the nega-tive effects be weighed against the posinega-tive economic effects?
– Can improvements be achieved mainly through technological innovations of the fleet, inno-vations in flying procedures (use of runways and routes), better adaptation of the airport to its surroundings (spatial planning), reconfiguration of the airport, rearrangement or expansion of the Dutch aviation infrastructure, or combinations of these factors? What are the advantages and disadvantages of these options?
– How do the various options relate to the broader national and international context? How does the policy for air traffic relate to the policy for other sources of noise annoyance and external safety risks? How do Dutch airports perform in comparison to each other and how does Schiphol Airport perform in comparison to other large European airports?
– What are the possibilities for attuning the norms to the basic principles of the policy?
2.1.3 PBL evaluations of Dutch airport policy
Air traffic in the Environmental Balance
Environmental Balance 2005
“The noise annoyance from air traffic from Schiphol Airport has nearly been halved in the last 15 years, and will remain stable until 2010. With the fifth runway, the number of houses falling within the local risk contours was halved and was below the level of 1990. In 2010, the group risk for external safety will approximately double due to more aircraft movements and more offices and industry near the airport.
Environmental Balance 2006
“The policy goals for noise annoyance and safety risks from Schiphol Airport air traffic were attained. However, such goals only apply to the most heavily affected residential areas around the airport. Most annoyance and risks occur in a much larger area around Schiphol Airport, where the noise annoyance has developed less favourably and where the external safety risks have increased.
Environmental Balance 2007
“A considerable reduction in the total number of people suffering from serious annoyance and sleep disturbance can be achieved around Schiphol Airport. If air traffic intensifies further, this will only be possible if the current system of noise norms is reconsidered and/or some of the air traffic is relocated to Lelystad.
The environment around Schiphol 1990-2010; Facts And Figures (August 2005)
Less noise annoyance
Since 1990, the total number of people suffering from noise annoyance caused by Schiphol Airport air traffic has decreased by about 40%. This is mainly due to the use of new, quieter aircraft. The decrease in aircraft noise is not the same everywhere. In some places, there may even be an increase, for instance under new air routes once the fifth runway became operational. The noise norms limit the current annoyance to about 330,000 people suffering serious noise annoyance and 140,000 with serious sleep disturbance.
More safety risks
The number of houses that may be hit by a crashing plane more than once every million years, (houses within the risk contour) has remained about the same due to the fifth runway. However, the risk of a plane crash with several fatalities on the ground (the group risk) is about twice as large as it was in 1990. The group risk has mainly increased because of new offices and houses being built around the airport. In addition, the risk of a plane crash at Schiphol Airport has increased by 30% to 40% since 1990. Flight safety may have improved per flight, but this is completely nullified by the increase in the number of flights.
The fifth runway has little effect on decreasing the noise annoyance
The opening of the fifth runway in 2003 did not contribute much towards decreasing the noise annoyance (5%). However, the fifth runway has decreased the external safety risks considerably. The number of houses within the risk contour of the four runways doubled between 1990 and 2003, but this increase was almost completely counteracted by the fifth runway. From 1990 to 2002, the group risk became three times as large. It is currently about twice as large as in 1990. It is unlikely that the noise annoyance and the risks will decrease due to any further expansion of Schiphol Airport involving additional runways. Any expansion that spreads out the air traffic further will mean even more annoyance.
Relatively little environmental impact compared to other countries
Around Frankfurt, Paris Charles de Gaulle and London Heathrow, the exposure to aircraft noise is 2-10 times as large as that at Schiphol Airport. The extent of the total group risk for Frank-furt and London Heathrow is 30-50 times as large. At Schiphol Airport, the location of the five runways is relatively favourable in relation to the houses.
Nationally, the environmental norm for Schiphol Airport is relatively lenient; there are stricter norms for other sources of noise annoyance and external safety risks. If air traffic were treated according to these stricter norms, this would lead to more restrictions for air traffic or to much larger areas where plans for new construction would have to take the air traffic into account.
For now, noise standards will determine the growth of Schiphol Airport
It is not the physical capacity of the runways or the external safety norm, but the noise standards that will most determine Schiphol Airport’s capacity for growth in the next 10 to 15 years. In
2010, between 480,000 and 550,000 flights can be handled within the noise norms. However, in order to reach this target, the airport would have to handle a limited number of the noisi-est flights during the day instead of during the late evening or night. About 420,000 flights are currently being handled (2005). After 2010, capacity for growth will greatly depend on the air fleet becoming quieter.
Options for Schiphol policy, balance between inner and outer area (June, 2006)
It is not possible to simultaneously let Schiphol Airport grow, stabilize the noise annoyance and risks in the inner area, and reduce the noise annoyance in the outer area. Earlier investigation showed that considerable growth of the air traffic within the current norms for Schiphol Airport is possible (see Het milieu rond Schiphol 1990-2010 - Feiten en Cijfers, PBL 2005 (The Environment around Schiphol Airport 1990-2010 – Facts And Figures)). However, a simultaneous substantial reduction of the noise annoyance in the outer area is not possible.
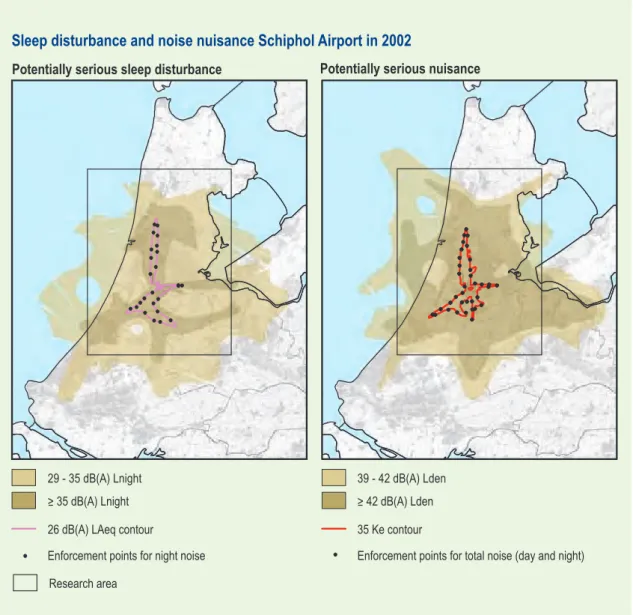
Sleep disturbance and noise nuisance Schiphol Airport in 2002
Research area
> 42 dB(A) Lden 39 - 42 dB(A) Lden 35 Ke contour
Enforcement points for total noise (day and night)
Potentially serious nuisance
29 - 35 dB(A) Lnight 26 dB(A) LAeq contour
Enforcement points for night noise > 35 dB(A) Lnight
Potentially serious sleep disturbance
Figure 2.1 Enforcement points for noise (total noise (day and night) on the left, night noise on the right) and the areas which are affected by noise annoyance (on the left) and sleep disturbance (on the right). The map shows the contours of the inner area (within the enforcement points) and the outer area where most people who experience noise annoyance live.
Substantial reduction of annoyance is possible
If an effective policy is implemented for the outer area (see Figure below), it is possible to decrease the number of people that are suffering serious noise annoyance by 45,000 and the number of people suffering serious sleep disturbance by 60,000, assuming growth in aircraft movement from 420,000 to over 600,000 in 2020. This is also beneficial for the extent of the external safety risks, the required space and the environmental costs of the air traffic. The price to be paid is a net increase of a few thousand houses with a high noise level in the inner area. The noise level and air traffic risks are highest in this area, but only 2% to 3% of the local residents experiencing noise annoyance live there.
Environmental costs increase when air traffic increases
An increase in the environmental burden from air traffic causes additional health effects and risks. This could result in increased costs for housing insulation, loss of space and lost value of houses; these aspects may no longer weigh against the advantages of extra travel options for the Dutch consumer. An increasingly strict norm for the outer area can result in maximum use of innovations and fewer flights over more densely populated areas.
The proposed trade-off is not effective
The trade-off proposed by the Cabinet, which maintains the current protection of the inner area, does not offer the intended growth for air traffic. Adapting the limit values to the enforcement points will be effective only if it is made subsidiary to improvements to the outer area.
Explanation of Figure 2.1, Noise annoyance and sleep disturbance at Schiphol Airport
Based on annoyance research around Schiphol Airport, it can be expected that when local resi-dents are exposed to 39 dB(A) Lden (total noise, day and night) and 29 dB(A) Lnight (night noise) about 5% of the people will still experience serious annoyance from aircraft noise and 3% will experience sleep disturbance. Other European countries assume threshold values for such effects of 42 dB(A) Lden and 35 dB(A) Lnight. Within the ring of enforcement points, the maximum noise level is limited. The ring of enforcement points contains about 3% of the total number of people who experience serious noise annoyance, and 2% who experience sleep disturbance. Outside the ring of enforcement points the noise level decreases, but the actual noise level may vary greatly. The noise contours are based on the air traffic in 2002. The report, Het milieu rond Schiphol, 2010 - Feiten en cijfers (PBL, 2005), (The Environment Around Schiphol Airport 1990-2010 – Facts And Figures), maps out the realised and expected development in noise annoyance and the external safety risks for the period 1990 to 2010, within the research area.
2.2 Noise
2.2.1 Developments concerning noise levels in the Netherlands
Environmental noise can be a annoyance and lead to sleep disturbance. Surveys have shown that it is especially noise from road traffic, neighbours, air traffic, railroads and industry that can be a annoyance. In the Netherlands, there is an extensive noise policy applying to traffic noise and industrial noise. For the purposes of this audit, the description of noise will focus primarily on noise from road traffic and rail traffic. For these sources, the research was conducted entirely by the PBL with the aid of the EMPARA model. For air traffic and industrial noise, data from third parties was used.
Environmental noise is addressed regularly in the annual Environmental Balance of the PBL. In recent years, no separate reports have been published with evaluations of noise policy. However, the recent Sustainability Outlook titled Nederland– Later examined the expected developments in road traffic noise. The conclusions of the PBL in the Environmental Balance publications concern the development of the noise level that affects houses and noise-sensitive areas. But not many conclusions were made about the effects of noise. This is because the policy focuses on reducing the noise exposure of houses and noise-sensitive areas.
The following section provides a brief sketch of the noise abatement policy in the Netherlands. The section after that contains examples of recent data and conclusions from the PBL about environmental noise.
2.2.2 Noise as a topic for policy evaluation
The first legislation for noise abatement went into force in the 1970s. The Noise Abatement Act (1979) and the Aviation (Schiphol Airport) Act (1978) included limit values for maximum exposure to noise from road traffic and air traffic near airports. Following the enactment of this legislation, there were many supplementations and amendments (including limit values for noise from industry and railroads).
At the end of the 1980s, the government established the objective of preventing increased annoyance due to environmental noise and even to reduce serious noise annoyance to a negligi-ble level by 2010. At the beginning of the 21st century, however, this objective was abandoned. It turned out to be unfeasible due to the low sound levels at which noise annoyance occurs. Instead, the fourth National Environmental Policy Plan (NMP4) emphasized ‘acoustic quality’. The national government did not provide a substantive definition of this concept. The basic idea is that acoustic quality depends on the character of a specific area. However, as part of the national infrastructure, the national government did establish a concrete target for houses with a relatively high noise level as part of the plans for national infrastructure; these are referred to as hotspots. This concerns houses near motorways with a noise level of 65 dB(A) Lden and higher and houses near railroads with a noise level of 70 dB(A) and higher.
A list was also drawn up of houses with high noise levels (>60 dB(A) not only near motorways, but also near secondary roads and in the inner cities. The intention is to improve the noise situ-ation of the houses that appear on this list. For eliminating the hotspots and providing noise abatement for houses, a large budget has been reserved for the period until 2020 (approximately €1 billion). For the actual noise abatement, the national government relies primarily on initia-tives from provincial and municipal governments.
At this time, the Noise Abatement Act is being amended. This will lead to phased modifications in the legislation for road, railroad and industrial noise. As part of the current phase, the system of legislation is being assessed. To promote source control measures, an enforcement method using ceiling values for the noise emission of the sources is being considered.
The national government wants to promote the development and implementation of noise source policy. To this end, a noise abatement innovation programme was established several years ago. This programme was recently terminated.
In addition, the EU Directive on Environmental Noise and the Noise Action Plans are seen as instruments that must promote initiatives for noise abatement.
The problem formulation used by the PBL when evaluating noise policy is the following: “Is it possible to achieve the noise abatement objectives with the strategy that the Dutch government plans on using?”
The problem formulation can be converted into the following research questions: – What are the options for achieving the noise abatement objectives?
– What are the costs and benefits of the Dutch policy (expressed in not only in monetary terms, but also in terms of the effects on health and well-being)?
– At which levels of scale should noise policy be given shape and implemented? What have been the benefits until now of EU policy (source-based and otherwise) as well as national and local policy?
– What are the options to optimally link up the norms with the basic principles of the policy? – How does the Netherlands perform compared to other countries?
2.2.3 PBL evaluations of noise policy in the Netherlands
In recent years, the publications of the PBL have included indicators with various noise level standards. This concerns different 24-hour noise weighting methods. There are two reasons for these differences. First, in connection with policy, various noise standards are used for various indicators. Second, the indicator for the exposure of houses to road traffic noise has been recently changed from L24h to Lden.
The following are the main conclusions about noise from the last three editions of the
Environmental Balance: Environmental Balance 2007:
Due to noise abatement measures on motorways and railroads, the number of houses with high noise levels has recently decreased. In contrast, the total area with low noise levels has shrunk during the last 20 years due to increased road traffic and the expansion of the road network. Environmental Balance 2006:
Most noise hotspots are the result of municipal roads. Environmental Balance 2006:
The new indicator Lden is less sensitive to noise at night. Environmental Balance 2005:
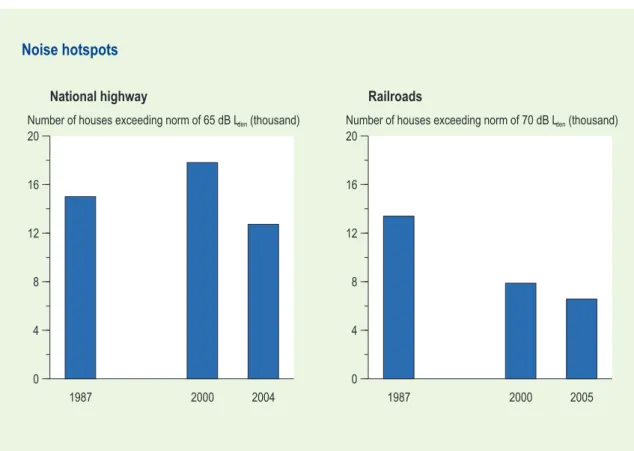
For eliminating the noise hotspots along motorways in 2020, source policy, focusing on aspects such as quieter tyres and road surfaces, is more cost effective than installing noise barriers. Included below is an example from the Environmental Balance 2007; it shows the historical progression of the number of houses with a noise level higher than 65 Lden due to motorways and higher than 70 dB Lden due to railroads.
The development as shown for national highways in the above figure may be too optimistic because acoustic properties of road surfaces may be less effective than previously assumed .
For open graded asphaltic mixes, the national calculation method assumes a noise reduction effect of approximately 4 dB on motorways. However, recent research has shown that the actual reduction is less (M+P, 2007). The average noise-abatement effect of open graded asphaltic mixes decreases as the road surface ages, but there are also large differences between individual road sections. Taking account of the age of the road surfaces, the average noise-abatement effect on the major road network is estimated to be 3 dB, with an uncertainty margin of ±1 dB. As a result, the number of houses near motorways with a noise level higher than 65 dB Lden rises to nearly 13,000, with an uncertainty margin of ± 3,000). The Directorate for Public Works and Water Management is conducting additional research into the acoustic properties of open graded asphaltic mixes; at the same time, the possibilities of efficiently anticipating the results are being studied.
In the Environmental Balance 2006, the number of future hotspots is shown on the map of the Netherlands.
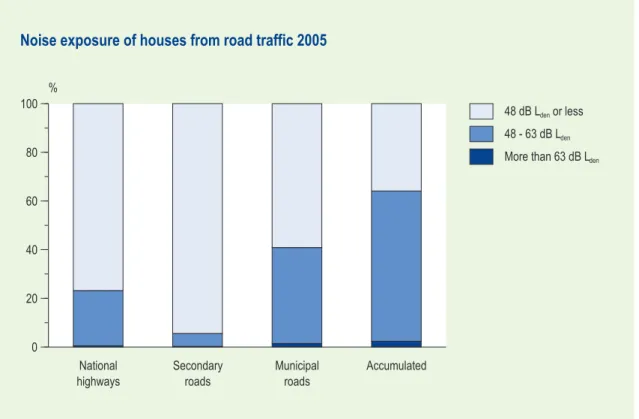
Because noise annoyance is not limited to houses with the highest noise level, the PBL has also published a document showing the exposure of houses to noise in a different fashion (as an extension of the formal concrete policy objective). The figure below includes not only national highways as a noise source, but also shows the exposure of houses to all road traffic according to individual road type, as well as the cumulative noise level.
The Sustainability Outlook 2 (Nederland – later) showed the effect of the development in the number of houses on this indicator.
1987 2000 2004 0 4 8 12 16 20
Number of houses exceeding norm of 65 dB Lden (thousand)
National highway Noise hotspots 1987 2000 2005 0 4 8 12 16 20
Number of houses exceeding norm of 70 dB Lden (thousand)
Railroads
Figure 2.2 Development of noise hotspots near national highways and railroads, from the
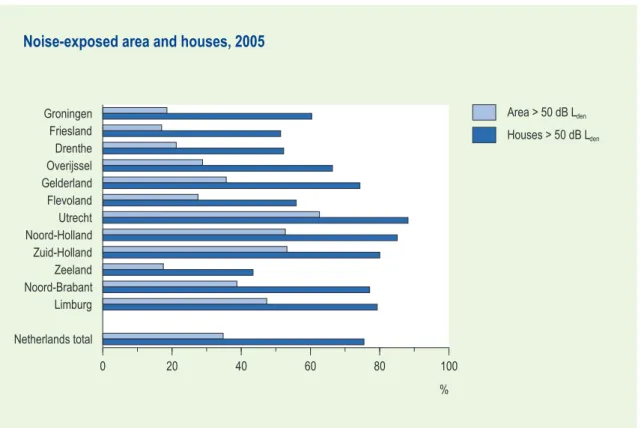
Besides the noise level on houses, the area with a specific noise level or a higher was also used as an indicator. The example below shows the results for individual provinces.
Current urban area and national highways
Noise nuisance near national highways
Hotspots solved by planned measures 50 - 100 houses above 65 dB Lden 100 - 200
200 - 400 400 - 800 800 - 1600 Remaining hotspots
50 - 100 houses above 65 dB Lden 100 - 200
200 - 400 400 - 800 800 - 1600
2020
Figure 2.3 Estimation of noise hotspots near motorways in 2020.
National
highways Secondaryroads Municipalroads Accumulated 0 20 40 60 80 100 % 48 dB L den or less 48 - 63 dB Lden
More than 63 dB Lden Noise exposure of houses from road traffic 2005
Figure 2.4 Noise exposure of houses from different kinds of roads and the accumulated expo-sure, 2005.
The noise level area is also shown on maps. In the example below, the quality of noise abatement areas and nature reserves is shown.
Trend scenario Trend scenario High spatial pressure scenario 0 2 4 6 8 10 12 millions of houses
Less than 48 dB Lden
Existing houses in 2000 Housing construction after 2000 48-55 dB Lden Existing houses in 2000 Housing construction after 2000 More than 55 dB Lden
Existing houses in 2000 Housing construction after 2000
Noise exposure of houses
2010
2040
Figure 2.5 Effect of development in the number of houses on the indicator “noise exposure of houses”. Groningen Friesland Drenthe Overijssel Gelderland Flevoland Utrecht Noord-Holland Zuid-Holland Zeeland Noord-Brabant Limburg Netherlands total 0 20 40 60 80 100 % Area > 50 dB Lden Houses > 50 dB Lden Noise-exposed area and houses, 2005
Figure 2.6 Noise-exposed area and houses, differentiated to provinces and the total for the Netherlands. (Source: NLR, AEA Technology, AVV, provincial governments.)
For several cases in the past, the development of noise is shown by means of an average noise level.
2.3 Air quality
2.3.1 Developments concerning air quality in the Netherlands
In recent decades, air quality has improved greatly. Nevertheless, further improvement is necessary because the air quality does not comply with all standards. However, even if the standards are complied with, detrimental health effects will still occur, especially due to particulate matter. This component does not have a ‘no-effect level’. Air quality policy focuses on the norms for NO2 and PM10 (the coarser fraction of particulate matter) because for these components, the norms are currently being exceeded. In the near future – when the new European air-quality directive goes into force – there will also be a norm for PM2.5 (the finer fraction of particulate matter). The limit values for PM10 went into force in 2005; for NO2 the limit values will go into force in 2010. The limit values for PM10 are being exceeded, and those for NO2 will also be exceeded in 2010. In the current situation, this occurs primarily in busy streets in large cities and along motorways. In the Netherlands, one of the consequences of the
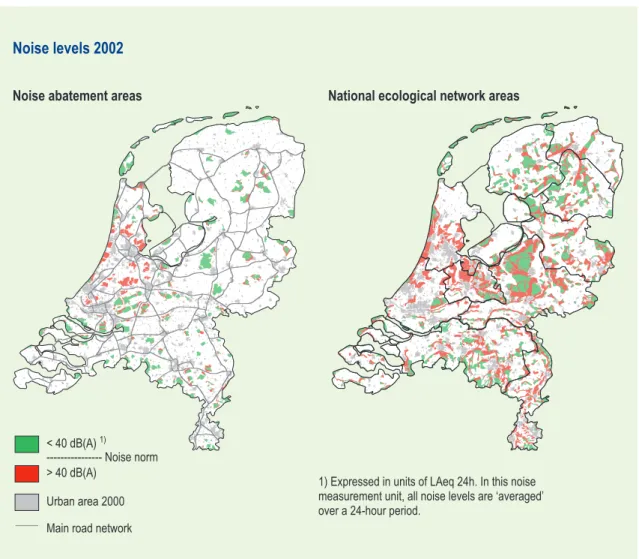
Noise abatement areas
1) Expressed in units of LAeq 24h. In this noise measurement unit, all noise levels are ‘averaged’ over a 24-hour period.
< 40 dB(A) 1)
--- Noise norm > 40 dB(A)
Urban area 2000 Main road network
National ecological network areas
Noise levels 2002
Figure 2.7 Noise levels in 2002, in noise abatement areas and national ecological network areas. (Source: RIVM, NLR, AVV, AEA Technology, Alterra.)
norm exceedences (expected or actual) is that construction programmes for infrastructure and projects involving land-use planning (business estates, new housing projects) will be halted based on legal grounds.
The new European directive offers the possibility for postponing the date when the limit values go into force (derogation). The Netherlands has requested such a postponement and expects approval because it has shown that the Dutch government is seriously trying to comply with the norms. This means that under the new regime, the limit values for PM10 will go into force in 2011 and those for NO2 in 2015. For PM2.5 the limit values will go into force in 2015. Without supplementary policy at the European, national and local levels, exceedences of the norms will still occur after the postponement. Therefore, major efforts at all policy levels are still required to comply with the norms in a timely fashion.
2.3.2 Air quality as a topic for policy evaluation
The Netherlands’ air quality policy is multifaceted and focuses on both national and interna-tional measures. In addition, legislation is being assessed and the government pays attention to the implementation of air-quality policy at all policy levels.
The national measures focus primarily on reducing emissions from traffic, industry and agriculture.
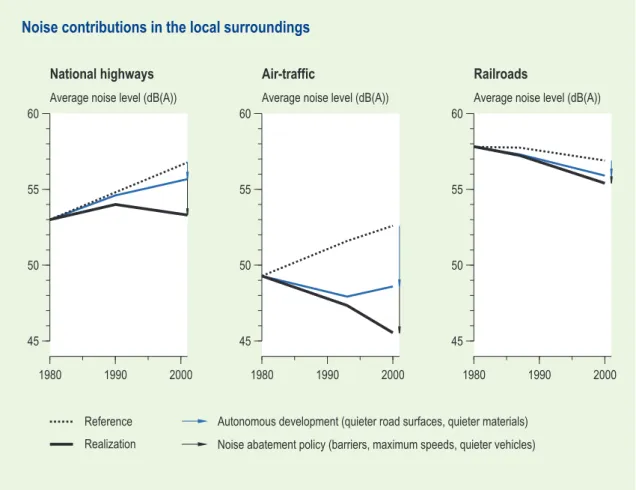
1980 1990 2000 45
50 55
60 Average noise level (dB(A))
Reference Realization
National highways
Noise contributions in the local surroundings
Autonomous development (quieter road surfaces, quieter materials) Noise abatement policy (barriers, maximum speeds, quieter vehicles)
1980 1990 2000 45
50 55
60 Average noise level (dB(A))
Air-traffic
1980 1990 2000 45
50 55
60 Average noise level (dB(A))
Railroads
Figure 2.8 Noise contributions of national highways, air-traffic and railroads in the local surroundings.
The Netherlands cannot comply with the norms without major efforts at the European level. Therefore, the Netherlands is arguing especially in favour of stricter European norms regarding emissions from passenger cars, trucks and boats.
Amendments to legislation should make it possible to deal more effectively with the problems related to air quality. For example, it will become possible to make a more flexible trade-off between spatial development and air quality.
Within the Netherlands, all policy levels (national, regional and local) must work together in order to comply with the norms in a timely fashion. In order to give optimal shape to this form of cooperation, the government has established the National Air Quality Cooperation Programme (Nationaal Samenwerkingsprogramma Luchtkwaliteit – NSL). The NSL combines and coordinates all programmes that aim to improve air quality.
Problem definition and research questions
For the purposes of policy, it is important to know the effects of measures at the European, national and local scales. The question here is whether the measures that have been taken or are planned are adequate to comply with the norm; if not, what extra measures are required? For the PBL, this problem definition leads to the following research questions:
– What are the effects of the measures that have been taken and are planned?
– How do the measures affect the number/magnitude of locations with norm exceedences? – How can measures be applied optimally in the combination of European, national and local
levels?
– What are the costs and benefits of Dutch policy?
2.3.3 PBL evaluations of air-quality policy in the Netherlands
Within the PBL, the team LED (European Air Quality and Sustainability Team) calculates the effects of European and national measures on the large-scale air quality in the Netherlands (large-scale basis map). The team LOK uses Luvotool to provide supplementary calculations about the effects of these measures at the local scale. This concerns only the addition of local effects due to road traffic. Luvotool is not suitable for calculating the effects of specific local measures. Based on Luvotool, statements are made for the past and the future about the follow-ing: the areas where norm exceedences occur, the possible level of the concentrations and the number kilometres of roads in cities and along motorways where exceedances of the norm for air quality occur. These statements are based on the air pollution map of the Netherlands; this is the large-scale basis map with the addition of the map showing the contributions of road traffic, which is calculated by Luvotool (see Figure 2.9. Concentration map for PM10, yearly average concentrations for 2006. Detail: area around Rotterdam).
Number of hotspots declines sharply with current policy
(PBL, 2006, available only in Dutch)
With current policy, the number of particulate matter hotspots will decline by more than 50% between 2005 and 2010 (Figure 2.10). Until 2010, the number of hotspots for nitrogen dioxide will decline by around 20% on motorways and by 50% on urban streets. Some policy meas-ures also have an effect over the longer term. As a result, the number of hotspots will continue to decline between 2010 and 2015. The number of hotspots for particulate matter and nitrogen
dioxide, assuming current policy, will stabilize after 2015. With current policy, particulate matter hotspots are still expected to occur along busy streets in the big cities in the Randstad and in the southern part of the Netherlands. After 2010, with current policy, the particulate matter hotspots are expected to become concentrated around large cities with large amounts of traffic and industrial activity, such as Amsterdam and Rotterdam.
With current policy, it is unlikely that the annual limit value for nitrogen dioxide will be com-plied with everywhere in the Netherlands in 2010 and 2015. With supplementary European, national and local policy, it could be possible to eliminate the remaining hotspots for nitrogen dioxide around the year 2015. However, the current proposal of the European Commission for more stringent requirements on the NOx emission of diesel passenger cars does not go as far as was assumed in the Thematic Strategy. With the less stringent requirements that are now pro-posed, it will possible to eliminate all hotspots with local policy only after 2015.
Concentration PM10 in 2006
Detail of area around Rotterdam
< 28 µg/m3 28 - 30 30 - 32 32 - 34 > 34 0 2 4 8km
Figure 2.9 Concentration map for PM10, yearly average concentrations for 2006.
2005 2010 2015 2020 0 100 200 300 400 500 km
Particulate matter levels near motorways
Norm exceedences for particulate matter and NO2
2005 2010 2015 2020 0
40 80 120
160Index (number of streets with exceedences in 2005 = 100)
With current policy Estimate
Uncertainty of estimate
With supplementary policy Estimate
Uncertainty of estimate
Particulate matter levels near urban streets
2005 2010 2015 2020 0 100 200 300 400 500 km
NO2 levels near motorways
2005 2010 2015 2020 0
40 80 120
160Index (number of streets with exceedences in 2005 = 100)
NO2 levels near urban streets
Figure 2.10 The number of hotspots for particulate matter and nitrogen dioxide with current policy and supplementary policy. Topmost figures: kilometres of motorways with exceedances. Lowermost figures: number of urban streets with exceedances. For ascertaining particulate matter hotspots, the contribution of sea salt is not included, in accordance with the Netherlands Air Quality Decree 2005.
Environmental Balance 2007
(PBL, 2007, available only in Dutch)
With current policy, air quality will continue to improve during the next 10 years, and the number of air-quality hotspots will decline sharply. However, under current policy it will be impossible to comply with EU limit values at all locations during the period until 2015, even with the options for postponing the application of limit values offered by the new EU air-quality directive.
It cannot yet be ascertained whether this will be possible after the implementation of approved policy, including the regional and local measures that are envisioned in the National Air Quality Cooperation Programme (NSL); this is partly because it is still unclear which measures will be implemented in the NSL and what their effects will be. Moreover, there are uncertainties in the economic and technological developments, as well as uncertainties regarding the dispersal of air pollutants. The ring roads of the major cities and the busiest urban streets in the Randstad are some of the most stubborn air-quality hotspots.
Cost-effectiveness of supplementary measures for cleaner air
(Smeets et al., 2007, available only in Dutch)
Until 2015, air quality in the Netherlands regarding particulate matter (PM10) and nitrogen dioxide (NO2) can be primarily improved by taking a number of supplementary national and local measures. Such measures can be implemented relatively quickly. This contrasts with more far-reaching European emissions policies, such as source measures and emission ceilings, which require a long time to achieve a full effect. These supplementary national measures are the following: implementation of road-use pricing, technical measures for the storage and handling of bulk goods, soot filters and NOx technology in inland shipping, advanced dust abatement technologies in industry and air scrubbers on larger pig and poultry housing units. In view of the reduction of the exposure of the population to particulate matter, these national measures are more cost effective than the implementation of more stringent European emission norms (Euro6/VI) for road vehicles. Table 2.1 shows an example of the results from this study.
Table 2.1 Estimate of the NO2 concentration near motorways in 2020 with current policy (both excluding and
including the recently approved Euro6 NOx emission standards for light vehicles) and for the two policy extremes
‘national emission policy’ and ‘European emission policy’. The calculations show the average values for a small number of the most heavily-polluted sections of motorways near Amsterdam and Rotterdam.
excluding Euro6 NOx norms light vehicles including Euro6 NOx norms light vehicles National emission
policy European emission policy
NO2 concentration 2020 µg/m3 42.6 39.5 37.2 33.0
Concentration reduction 2020 µg/m3 - 3.1 5.4 9.6
Costs 2020 €M/yr - 130 280 470 Source: Smeets et al., 2007 (in Dutch)
2.4 External safety
2.4.1 Developments relating to External Safety in the Netherlands
Statutory norm for location-related Risk not greater than once in 1 million years
In 2004, the External Safety (Establishments) Decree (BEVI, Besluit Externe Veiligheid voor
Inrichtingen) created a link between spatial planning and the environment. The BEVI contains hard targets for realizing a minimum level of protection for citizens. At locations with houses or other vulnerable objects, by 2010 the annual risk of dying as a result of an incident with hazardous substances must not be greater than once in 1 million years (PR=1×10⁻⁶).
Group risk: the probability of a disaster involving many people
There is no statutory norm for group risk as there is for location-related risk. For group risk there is an orientation value. Public authorities must specify reasons for allowing activities that deviate from this value. In making such decisions, they must consider factors such as self-reliance and controllability.
Norms for airports are more flexible
A location-related risk above 10-6/year and up to 10-5/year is accepted around airports with 5,000 to 7,000 individuals living in the vicinity. This is 10 times higher than the permitted norm for other activities. Around the regional airports, there are currently no restrictions on office construction. If these airports become the responsibility of the provincial authorities in 2008, the authorities can formulate their own criteria for this.
Transport network for hazardous substances
The Ministry for Transport, Public Works and Water Management (V&W) is preparing to intro-duce road, rail and water transport networks for hazardous substances (V&W, 2005). In 2010, if this intended policy is implemented, certain routes will be subject to transport restrictions and others to spatial planning restrictions. Some routes will be subject to both types of restriction.
Still no uniform approach to external safety policy in EU
In general, it can be said that there are many different approaches to external safety within the EU, and different parties interpret concepts in different ways. This means that a uniform EU-wide approach is an unrealistic ambition at present. In the United Kingdom and Germany, as in the Netherlands, a policy on external safety has been introduced that addresses the various aspects of external safely.
European Union policy on external safety is determined by the Seveso II Directive (96/82/EC) from 1996. The original Seveso Directive (1982) focused mainly on the technical aspects of safety, but over time it has become clear that organization and communica-tion are also essential aspects in terms of preventing major accidents and incidents. The Seveso II Directive therefore requires the compa-nies to which it applies to provide information on the technical and or-ganizational measures they have in place to prevent major accidents and minimize the consequences for people and the environment.
Substantial differences in computing models and methodologies used in different countries
In a number of countries, external safety is an extension of internal safety. The risk source is a specific activity (companies that work with hazardous substances), and requirements are therefore placed on the responsible party via the permit system.
There are significant differences between the use of computing models and methodologies and their outcomes:
– Effect-oriented approach: Germany, Sweden and USA – Probability approach: Italy, France, Switzerland and Wallonia – Risk approach: the Netherlands, Flanders and United Kingdom Spatial planning plays a role in all countries neighbouring the Netherlands. In many cases, companies with a high external-safety risk are concentrated in large industrial zones surrounded by safety zones within which, for example, no vulnerable objects must be located.
2.4.2 PBL evaluations of External Safety policy in the Netherlands
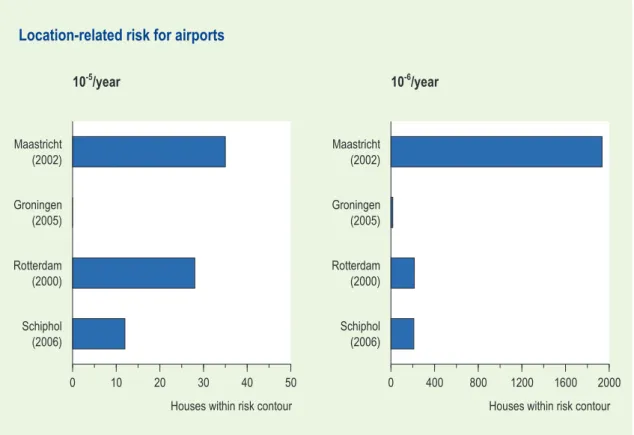
More houses within PR 10-6 contour around regional airports than around Schiphol In 2006, approximately 200 houses around Schiphol were subject to a location-related risk greater than 10-6 /yr. This was nearly 40 fewer than in 2005 and approximately 1,400 fewer than in 2002, before the fifth runway was built. In 2006, fewer than 20 houses were subject to a risk greater than 10-5/yr. Under the present norm for external safety, up to 900 houses around Schiphol could be exposed to a location-related risk greater than 10-6/year (PBL, 2005b), and a few dozen to a risk greater than 10-5/year. Around the regional civil airports, this risk figure is approximately 2,200 and 60 houses, respectively. The largest number are located around Maas-tricht Airport (Figure 2.11), where built-up areas are relatively close to the runways.
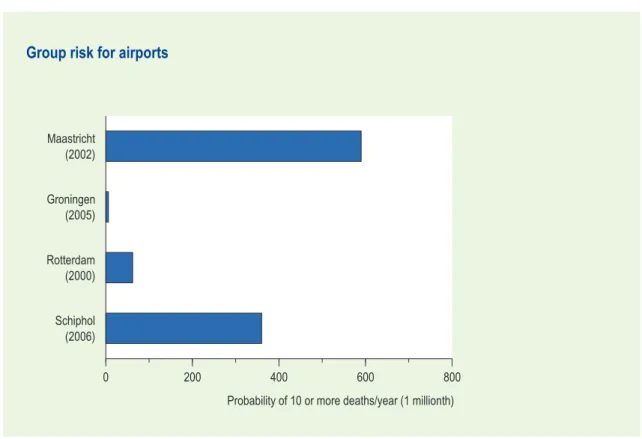
Group risk for Maastricht comparable to that for Schiphol
The group risk for Maastricht Airport is comparable to that for Schiphol (Figure 2.12 and Figure 2.13). The relatively high external-safety risk at regional airports is mainly due to the fact that they are located close to built-up areas. For all regional airports combined, the total number of houses within risk contours and the risk of an aviation accident are therefore greater than for Schiphol. The external safety risk within the existing environmental space may increase considerably as a result of planned construction around regional airports (PBL, 2005b). In 2006, the group risk around Schiphol was approximately half of the maximum permitted risk for the external-safety norm. In 2006, the total group risk around Schiphol was almost equal to the group risk in 2005.
In a densely populated country like the Netherlands, people are exposed to a certain level of risk from dangerous activities such as the use, storage and transport of hazardous substances, or risks from air traffic. These risks are classified under the heading ‘External Safety’ (known by
Maastricht (2002) Groningen (2005) Rotterdam (2000) Schiphol (2006) 0 10 20 30 40 50 Houses within risk contour
10-5/year
Location-related risk for airports
Maastricht (2002) Groningen (2005) Rotterdam (2000) Schiphol (2006) 0 400 800 1200 1600 2000 Houses within risk contour
10-6/year
1990 1994 1998 2002 2006 2010 0 400 800 1200 1600 2000 Number of houses Actual risk
Maximum for compliance with external safety norm
Location-related risk (greater than 10-6/year)
External safety risks for Schiphol
1990 1994 1998 2002 2006 2010 0
40 80 120
160 Probability (1 millionth per year)
Group risk (40 or more deaths)
Figure 2.13 Development of location-related risk (left) and group risk (probability of a disaster with more than 40 victims) (right) from air traffic around Schiphol. Calculations for all years are based on actual volumes of air traffic.
Maastricht (2002) Groningen (2005) Rotterdam (2000) Schiphol (2006) 0 200 400 600 800 Probability of 10 or more deaths/year (1 millionth)
Group risk for airports
the Dutch abbreviation EV). External safety risks are determined by the scale and location of a high-risk company/object. For example, chemical companies in large industrial zones contribute far less to disaster risk than the transport of hazardous substances through urban areas or LPG filling stations in residential areas. Figure 2.14 gives a picture of the external safety risks in the Randstad.
Target for dealing with problem areas within the 10-5 risk contour around LPG filling
stations and safety risk companies
On the basis of current information, the 2007 target has been met for dealing with problem areas within the 10-5/year location-related risk contour around LPG stations and companies required to submit a safety report (safety-risk companies). It is not yet certain whether the target for 2010 for dealing with problem areas within the 10-6 location-related risk contour will be met because plans to introduce transport networks for hazardous substances have not yet been realized. Furthermore, there are still a number of external safety problems relating to pipelines. This is discussed in more detail in the Environmental Balance 2007.
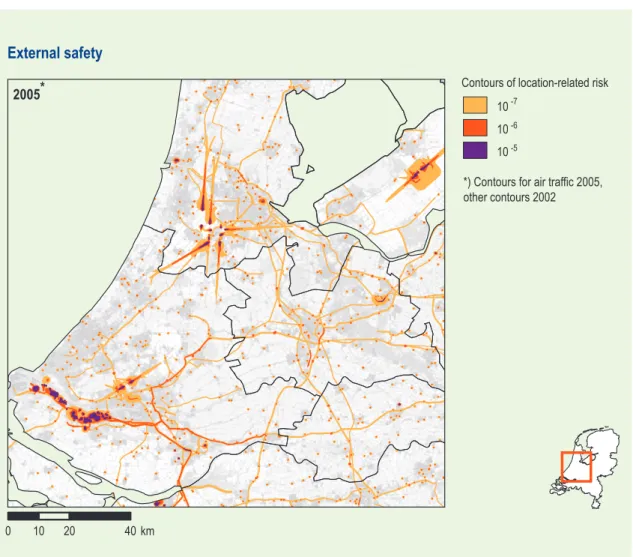
It is not yet certain whether the target for 2010 for dealing with problem areas within the 10-6 location-related risk contour will be met because plans to introduce transport networks for
External safety
Contours of location-related risk 10-7
10-6
10-5
2005*
0 10 20 40km
*) Contours for air traffic 2005, other contours 2002
Figure 2.14 External safety risks in the Randstad: contours for roads, rail transport, aviation, LPG stations and safety risk companies.
hazardous substances have not yet been realized. Furthermore, there are still a number of exter-nal safety problems relating to pipelines.
In 2004, the External Safety (Establishments) Decree (BEVI) was extended to cover safety-risk companies (large chemical companies that are required to submit a safety report) and LPG filling stations. This means that situations that do not comply with the decree must be remediated within three years. This objective has been met through at-source measures or through the reme-diation of vulnerable objects located within the 10-5 risk contour. The problem areas at other BEVI installations (e.g. ammonia cooling plants) have not yet been precisely identified. The BEVI has applied to railway yards since 2007. The number of people exposed to the 10-6 risk contours for natural gas pipelines is not yet included in Table 2.2.
In 2005, more than 10,000 people (Table 2.2) lived within the 10-6 contours around high-risk activities such as transport routes for hazardous substances or large chemical plants. For all these people, the risk of becoming the victim of an accident involving hazardous substances is greater than once in 1 million years. The number of people within the 10-6 risk contours for natural gas pipelines is not yet known and is therefore not included in the calculations. Of these 10,000 people, 7,700 live too close to LPG filling stations. The large number of people exposed to risks along rail routes (2,500) will have decreased considerably by 2010 due to the opening of the Betuwe Route.
Location-related risks around Schiphol have fallen since 1990
In 2005, almost 600 people in 246 houses in the vicinity of Schiphol were exposed to a risk greater than once in 1 million years of being killed in an aircraft accident (Table 2.2). For approximately 30 people (in 16 houses), this risk was greater than once in 100,000 years. Now that the fifth runway is in use, the number of people living within the 10-6 contour has decreased considerably in relation to 1990. The opening of the fifth runway led to a temporary reduction in the probability of a disaster with multiple deaths due to an aircraft accident because there are fewer flights over built-up areas. However, this group risk is higher than in 1990. The probability of a disaster involving 10 or more deaths is now approximately once in 3,000 years (1 divided by 3.5×10⁻⁴).
Table 2.2 No. of people living within a location-related risk contour greater than 10-6 in 2005.
Risk source Number of people within risk contour
Safety risk companies 410
LPG filling stations 7,700
Railway yards 4
Transport by road 40
Transport by rail 2,500
Transport by water 2
Pipelines Not yet calculated
Total 10,656
2.5 Health impact
2.5.1 Environmental health context
Traditional environmental policies and risk management practices have led to substantial improvements of environmental quality. As a result, many risks to human health and ecosystems have been considerably reduced. However, a number of persistent and complex environmental health risk problems still exist, amongst which are air pollution (PM10 /PM2.5, ozone), noise, external safety (aviation, transport, and industry), microbiological contamination of water, indoor environment, risks of flooding, and soil contamination. In addition, climate change impacts on health may appear in the near future with increased infections, allergies, heat waves and summer smog. Moreover, new and emerging environmental problems and technological innovations might pose health risks that are not yet fully understood. In general, the increased understanding of health risks provided by scientific studies (often showing effects at lower exposures than previously anticipated) and the frequently voiced concern of citizens regarding risks (sometimes alleged or very small) provide input to a broad discussion in society about health risks and safety problems related to current environmental exposures.
Assessing the impact of environmental factors to human health varies greatly depending on the extent of knowledge about the key variables of concern, such as exposure risk and susceptibility factors, and the certainty and nature of the relationship between the risk and the potential outcome. Probably the most familiar method is that of human risk assessment.
The assessment of health effects resulting from exposure to factors in the environment and surroundings also depends on how health is defined. The World Health Organization (WHO) defines health as a state of complete bodily, mental and social well-being, and not just the absence of obvious disorders or diseases. In the RIVM public health model, health is described on the basis of various determinants. In addition to endogenous determinants (inherited or acquired) that can determine human susceptibility, health is also based on exogenous determi-nants, such as the physical environment and surroundings, lifestyle and the social environment.
2.5.2 Environment and health in a policy perspective
A frequently used paradigm for environmental health policy is the following: Decisions, regulatory actions, and legislation
•
Improvement and sustainable development of the quality of the environment −
Compliance with
− EU standards and WHO environmental quality guidelines Table 2.3 External safety risks around Schiphol (Dassen and Diederen, 2006).
1990 1997 2002 2005 Location-related Risk (houses)
>10-5/yr 4 28 21 16
>10-6/yr 764 1,513 1,626 246
>10-7/yr 8,242 11,211 15,446 4,445
Group risk (probability)
N>10 3.0×10⁻⁴ 5.7×10⁻⁴ 6.4×10⁻⁴ 3.5×10⁻⁴
N>40 3.8×10⁻⁵ 8.4×10⁻⁵ 1.3×10⁻⁴ 6.1×10⁻⁵
Risk management analysis •
Regulatory options and abatement plans −
Evaluation of public health, social, and economic consequences −
Health impact and benefit assessments, cost-efficiency, scenario analyses, multicriteria −
analyses
Risk communication •
Data and information exchange −
Stakeholders’ needs and participation −
Health impact, exposure assessment, and quality of life analyses •
Quantifying health impacts, exposures, and source contributions −
Indicators to assess the impact – and benefit – of ‘number of lives’ and ‘healthy life −
years’, including morbidity and annoyance Risk perception and acceptance
−
Sustainable quality of life −
Environmental health policy has therefore to deal with a multi-factor, multi-effect phenomenon. A primary focus is on compliance with environmental quality limit values and health-based guidelines. A secondary focus is to strive for a high quality and sustainable environment and quality of life and place.
2.5.3 PBL evaluations of policy on environmental health
The PBL supports national and international decision makers by analysing the environmental impact of policies and of trends in society and acts thereby as an interface between science and policy. The PBL addresses a number of the above-mentioned environmental health issues, strives to develop frameworks and tools for impact assessment and policy analysis, and frequently conducts and reports on impact and benefit assessments. These include publications such as the
State of the Environment, the Environmental Outlook and specific policy evaluation reports. The following sections describe examples from PBL studies on current and future health risks and impact of policy measures and abatement scenarios.
Air pollution assessment – PM10 and ozone (I)
The health impacts of the air pollutants PM10 and ozone are periodically assessed for the present and near future in the Environmental Balance report (Milieubalans, published only in Dutch). A general conclusion is that the health impacts of both air pollutants will probably remain the same or decline only slightly in the years to come, and may even rise due to demographic changes (i.e. an ageing population and increased numbers of the elderly).
Air pollution assessment – PM10 and ozone (II)
In the study Prosperity and the Environment (Welvaart en Leefomgeving, CPB et al., 2006 – available only in Dutch) the health impacts of the air pollutants PM10 and ozone have been assessed, both for current and future years, under different proposed economic scenario’s up to the year 2040. The example given below illustrates the assessment for PM10 in the four largest cities in The Netherlands, shown in Figure 15. Again, it can be concluded that the health impacts of PM10 do hardly or not decline in the coming years and may even rise partly due to demo-graphic changes, i.e. ageing and the increased numbers of older people.