DECARBONISATION OPTIONS
FOR THE DUTCH CONTAINER
AND TABLEWARE GLASS
INDUSTRY
I. Papadogeorgos, K.M. Schure
12 December 2019
Decarbonisation options for the Dutch container and tableware glass industry © PBL Netherlands Environmental Assessment Agency; © ECN part of TNO
The Hague, 2019
PBL publication number: 3720
TNO project no. 060.33956 / TNO publication no. 2019 P11916 Authors
I. Papadogeorgos and K.M. Schure Acknowledgements
We are thankful to Sven-Roger Kahl (Ardagh), Joost Laven (O-I), Marco van Valburg (Libbey) and Oscar Verheijen (Celsian) for providing us with valuable insight and feedback regarding the current glass production processes.
MIDDEN project coordination and responsibility
The MIDDEN project (Manufacturing Industry Decarbonisation Data Exchange Network) was initiated and is also coordinated and funded by PBL and ECN part of TNO. The project aims to support industry, policymakers, analysts, and the energy sector in their common efforts to achieve deep decarbonisation. Correspondence regarding the project may be addressed to: K.M. Schure (PBL), Klara.Schure@pbl.nl, or A.W.N van Dril (TNO), Ton.vanDril@tno.nl. Production coordination
PBL Publishers
This publication is a joint publication by PBL and ECN part of TNO and can be downloaded from: www.pbl.nl/en. Parts of this publication may be reproduced, providing the source is stated, in the form: I. Papadogeorgos and K.M. Schure (2019), Decarbonisation options for the Dutch container and tableware glass industry. PBL Netherlands Environmental
Assessment Agency and ECN part of TNO, The Hague.
PBL Netherlands Environmental Assessment Agency is the national institute for strategic policy analysis in the fields of the environment, nature and spatial planning. We contribute to improving the quality of political and administrative decision-making by conducting outlook studies, analyses and evaluations in which an integrated approach is considered paramount. Policy relevance is the prime concern in all of our studies. We conduct solicited and
unsolicited research that is both independent and scientifically sound.
ECN part of TNO has a twofold mission: to accelerate the energy transition and to strengthen the competitive position of the Netherlands. ECN part of TNO conducts independent and internationally leading research and we stand for an agenda-setting, initiating and supporting role for government, industry and NGOs.
This report was reviewed by Ardagh Glass Dongen B.V., O-I Netherlands B.V., Libbey Holland, PBL and ECN part of TNO remain responsible for the content. The decarbonisation options and parameters are explicitly not verified by the companies.
Contents
Summary 4
INTRODUCTION
5
1 GLASS PRODUCTION IN THE NETHERLANDS
6
1.1 The importance of the European glass industry 6
1.2 The Dutch glass manufacturing industry 7
1.3 Ardagh Group 9
1.4 O-I Netherlands B.V. 9
1.5 Libbey Glass 10
2 MANUFACTURING PROCESSES OF GLASS
12
2.1 Container glass production 12
2.1.1 Batch preparation 15
2.1.2 Melting & fining 15
2.1.3 Refining & conditioning 17
2.1.4 Forming & moulding 17
2.1.5 Annealing 18
2.1.6 Surface treatment 18
2.1.7 Inspection 18
2.1.8 Overall container glass-making process 19
2.2 Tableware glass production 21
3 GLASS PRODUCTS AND APPLICATION
22
3.1 Container glass in the Netherlands 22
3.2 Recycling of glass 24
4 OPTIONS FOR DECARBONISATION
26
4.1 Fuel substitution 28
4.2 Feedstock substitution 29
4.3 Process design 29
4.4 Recycling and re-use 36
4.5 Product design 36
4.6 Residual energy use 36
4.7 Carbon Capture, Storage and Utilisation (CCS/CCU) 37
5 DISCUSSION
38
REFERENCES
40
APPENDIX A – CONVENTIONAL TECHNOLOGIES
45
APPENDIX B – ALTERNATIVE BATCH COMPOSITIONS
48
FINDINGS
Summary
This report outlines the current situation of the Dutch container glass and tableware glass production and the options and preconditions for its decarbonisation.
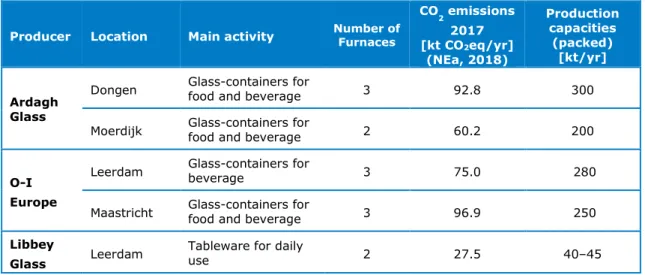
Currently, manufacturing of container glass in the Netherlands takes place at four locations: Dongen (Ardagh Group), Moerdijk (Ardagh Group), Leerdam (OI Netherlands) and Maastricht (OI Netherlands). Tableware glass is produced in Leerdam (Libbey Holland). An overview of their production capacities and the registered emissions (NEa, 2018) is given in Table S1. Table S1 Overview of ETS registered glass producers of container glass and tableware glass in NL (2017).
Producer Location Main activity Number of Furnaces
CO2 emissions 2017 [kt CO2eq/yr] (NEa, 2018) Production capacities (packed) [kt/yr] Ardagh Glass
Dongen Glass-containers for food and beverage 3 92.8 300
Moerdijk Glass-containers for food and beverage 2 60.2 200
O-I Europe
Leerdam Glass-containers for beverage 3 75.0 280
Maastricht Glass-containers for food and beverage 3 96.9 250
Libbey
Glass Leerdam
Tableware for daily
use 2 27.5 40–45
Glass production takes place through a series of processes, consisting of batch preparation, melting & fining, refining & conditioning, forming, annealing, surface treatment, and inspection. The furnace, where melting and fining of the glass takes place, accounts for the majority of energy consumption. In container glass production, this part of the process typically consumes about 75–80% of the energy. Tableware glass production is somewhat more energy intensive, where forming and moulding consume more energy, such that the relative contribution of the furnace to the energy consumption is approximately 65–70%. Combustion emissions from the furnace account for the majority of the emissions, but from the furnace also process emissions take place, which accounts for approximately 15%. The main findings are:
• All-electric melting, as well as biofuel and hydrogen combustion are promising
alternatives to traditional natural gas consuming melting activities, provided that they are developed further, and their impact on the process and the respective risks have been thoroughly investigated. These options depend on availability and sustainability of large volumes of those energy carriers as well as the presence of infrastructure and pricing conditions.
• The potential of waste heat recovery options can be further exploited by exploring their optimal use within traditional melting and coupling with innovative melting methods. • A sound legal and regulatory framework for technology deployment is necessary for
FULL RESULTS
Introduction
This report outlines the current situation of the Dutch container glass and tableware glass production and the options and preconditions for its decarbonisation. It is part of the MIDDEN project: the Manufacturing Industry Decarbonisation Data Exchange Network. MIDDEN aims to support industry, policy makers, analysts and energy sector in their common efforts to achieve deep decarbonisation.
It addresses energy requirement and CO2 emissions estimates, and includes a review of decarbonisation options. The focus is on the operations of two producers of container glass within the context of the Dutch industry, namely Ardagh Group and O-I, and one tableware glass producer; Libbey.
Scope
The aim of the MIDDEN project is to compile a database of material and energy uses of industrial processes at a plant level for the Dutch manufacturing industry. The scope of this research will focus specifically on the manufacturing of container glass and of tableware glass in the Netherlands1.
Production locations include:
• Dongen (Ardagh Group), Moerdijk (Ardagh Group), Leerdam (OI Netherlands, Libbey) and Maastricht (OI Netherlands).
Processes include:
• Batch preparation, melting & fining, refining & conditioning, forming, annealing, surface treatment, and inspection.
Products include:
• Container glass for food and beverage of varied colours (i.e. flint (colourless), dark/light amber, and emerald green) and tableware glass.
The main decarbonisation options are:
• Full electrification of the industrial process, oxy/fuel furnaces coupled with waste heat recovery options (and/or syngas production), biomethane furnaces, on-site steam/electricity generation and post-/oxyfuel-combustion CCS.
Reading guide
Section 1 gives a general introduction to the glass industry in the Netherlands. In section 2 we describe the current situation of glass production processes in the Netherlands and in section 3 we describe the relevant products of these processes. Options for decarbonisation are systematically quantified and evaluated in section 4. The feasibility and requirements of those decarbonisation options are discussed in section 5.
1 Separate MIDDEN reports are published on the glass wool and fibre glass industries in the Netherlands, see
1 Glass production in
the Netherlands
1.1 The importance of the European glass industry
The glass manufacturing industry is an energy- and capital-intensive industry which has one of the highest production volumes per capita worldwide (Eurostat, 2011). It is a rather heterogeneous sector which is responsible for the production a multitude of packaging formats for applications such as beverage, food, pharmaceuticals and personal care, and also for the production of tableware glass, fiber glass, glass wool, and some other niche
applications. Nearly 62% of the European glass packaging market is held by the beer, cider and food markets, where the largest user of glass packaging is beer which accounted for 22.7% of the total glass packs used by European countries in 20182. The demand in the food sector is experiencing growth, mainly due to an increase in demand from seasonings,
dressings and sauces.
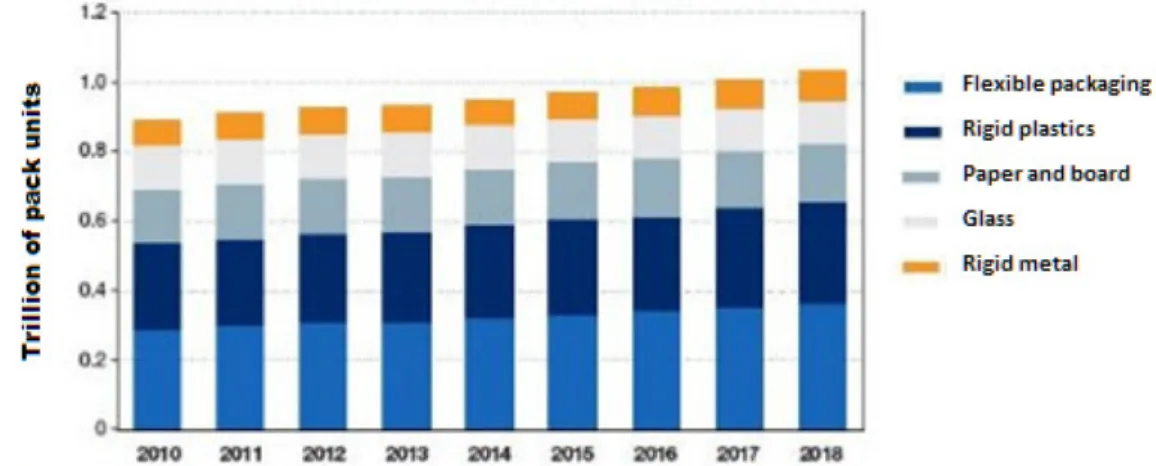
Overall, European countries have experienced growth of around 2.1% CAGR3 in the period 2014–18, reaching a total of 1.043 trillion packs (i.e. rigid plastics, metal, glass etc.) in 2018 (Figure 1; PCI, 2015). Driven by a diminished demand in the beer, cider and soft-drinks industries, glass experienced a slight decrease by about 0.27% in a European level in the period 2014–2018. Globally the packaging market is expected to grow with a CAGR of 5% between 2019–2023, of which a large driver is an increase in the alcoholic beverage market in Asia Pacific (Market Research Future, 2019).
Figure 1 European packaging market by material in the period 2010–20182. Glass-making operations in EU27 are often interlinked to location-specific economic
conditions and energy polices, as well as fluctuations of fuel and electricity prices, availability of resources and supplier network in the value chain (Schmitz et al. 2011; Ecofys, 2009). About 80–90% of the process heat in European glassmaking industries are produced by means of natural gas which is the main cause of the carbon dioxide (CO2) emissions of the industry. (Fiehl et al. 2017). The ambitious EU27 objectives associated with the significant reduction of CO2 emissions is gradually increasing the pressure on the European glass industry for achieving deep decarbonisation by 2050.
2 Canadean (2015); cited in: https://www.all4pack.com/Archives/Packaging-market-challenges-2016. 3 Compound annual growth rate (CAGR)
1.2 The Dutch glass manufacturing industry
The Dutch glass industry has been at the forefront of using the latest technologies, performing at world level in terms of quality, production and energy efficiency, and
environmental performance (VNG, 2012). Typical examples are the introduction of the first oxy/fuel furnaces in Europe by O-I in 1994, the first batch and cullet preheater by Ardagh Group in 1997, and the world's first fully thermochemical-based glass melting furnace installed at Libbey (technology owned by Praxair/Linde) in 2017 (van Valburg, 2017). The Dutch glassmaking operations are highly diverse, consisting of five glassmaking sectors with 8 production sites and 19 melting furnaces. Container glass exceeds 75% of total glass production at a national level and the rest comprise glass wool, stone wool, glass fibres, tableware, and special glass production. Six companies participate in the Emissions Trading System (ETS) as part of internationally operating groups, while the flat glass production was discontinued in 2015.
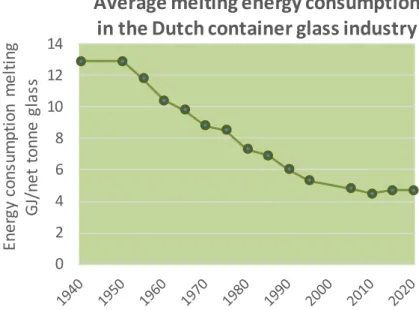
The developments in the container glass industry are driven by advancements in the food and beverage industry together with the demand for glass as packaging material. Such developments are associated with improvements in manufacturing process efficiency, with an emphasis on curtailing energy use and carbon emissions (FEVE, 2016). Over the period 1992–2010, the sector achieved an energy efficiency improvement of 22%, mitigated CO2 emissions by 10% and reduced SO2-, dust- and NOx-related emissions by 65–75% (VNG, 2012; FEVE, 2016). This trend of reduced energy consumption of container glass furnaces was primarily driven by factor such as furnace size, pull rates (amount of glass melted per unit of time), selected raw materials (carbonated or calcined), recycled glass content (cullet), efficiency of residual heat recovery systems (if any), level of furnace insulation and sealing, and share of electric boosting. However, the average energy use has begun to plateau (Figure 2), showing that the practical limits for energy efficiency have been reached and breakthrough technologies are needed to achieve further energy reduction towards the theoretical minimum and alternatives are needed to achieve major further CO2 emission reduction.
Figure 2 Average melting energy consumption in the Dutch container glass industry (melting tank only). Best practical limits are between 3.0–3.55 GJ using 50% cullet (recycled glass) (incl. wall losses and preheating systems) (Beerkens, 2012;
Fraunhofer, 2019a).
Nearly 550,000 tonnes of primary raw materials are used annually in the Dutch glass production sector: silica sand (55%), limestone (20%), soda ash (17%) and other materials
0
2
4
6
8
10
12
14
Ene
rg
y c
ons
um
pt
io
n
m
el
ting
GJ
/ne
t t
onne
g
la
ss
Average melting energy consumption
in the Dutch container glass industry
(8%) (JRC Report, 2013). Recycled glass in the form of cullet (i.e. broken pieces of glass) is used in the majority of glassmaking sectors to substitute virgin raw material, among which the container and fibre glass are the products with the highest recycled content (Schmitz et al. 2011; Section 3.2). Natural gas is the dominant energy source, which is particularly used for melting, refining and annealing (see Section 2). Non-melting processes typically account for about 20–25% of the total energy demand, where a substantial share of this amount refers to electricity consumption.
Table 1 Overview of ETS registered glass producers of container glass and tableware glass in NL (2017).
Producer Location Main activity Number of Furnaces
CO2 emissions 2017 [kt CO2eq/yr] Production capacities (packed) [kt/yr] Ardagh Glass
Dongen Glass-containers for food and beverage 3 92.8 300
Moerdijk Glass-containers for food and beverage 2 60.2 200
O-I Europe
Leerdam Glass-containers for beverage 3 75.0 280
Maastricht Glass-containers for food and beverage 3 96.9 250
Libbey
Glass Leerdam
Tableware for daily
use 2 27.5 40–45
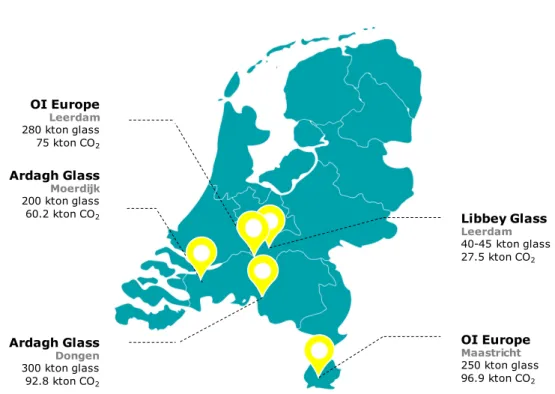
Figure 3 Overview of container glass and tableware glass production locations in the Netherlands.
[1] CO2 emissions retrieved from NEA database; Reference year 2017.
Ardagh Glass Moerdijk 200 kton glass 60.2 kton CO2 OI Europe Maastricht 250 kton glass 96.9 kton CO2 OI Europe Leerdam 280 kton glass 75 kton CO2 Libbey Glass Leerdam 40-45 kton glass 27.5 kton CO2 Ardagh Glass Dongen 300 kton glass 92.8 kton CO2
1.3 Ardagh Group
Headquartered in Dublin, Ardagh Group S.A. is a glass producer which has consistently increased its scope, scale, and geographic presence in the past few decades (Ardagh Group, 2017a). The company expanded on a global level after a series of acquisitions by Yeoman International in 1998, playing a major role in the consolidation of the global metal and glass packaging industries. The company is now active in 22 countries worldwide with over a hundred facilities for beverage and can manufacturing, 33 of which manufacture 5 million tonnes of glass per year. The company employs approx. 23,500 people, half of which are employed within glass packaging activities. The company had approximately EUR 7.6 billion in full year revenue in 2017 (increased by 20% compared to 2016), where glass packaging revenues represented 39% of total revenues. The top ten customers in glass packaging accounted for 42% of total glass revenues in 2017, some of which include Heineken, AB InBev, and PepsiCo.
Ardagh Glass Dongen B.V. and Ardagh Glass Moerdijk B.V are two of the principal operating subsidiaries in the Netherlands. They employ approx. 600 employees in its two production facilities, which are located in key industrial areas with a favourable access to transportation network (Ardagh Group, 2017b). Established in 1961, the Dongen plant and its nine
production lines account for the annual production of 1.3 billion bottles and jars. The plant includes 3 classic regenerative furnaces, two of which produce flint (colourless glass) and one that produces emerald green glass. The furnaces operate with natural gas and electric boosting, and incorporate batch and cullet preheating. The average recycling amount of glass is 76%, out of which 10% is domestic.
Located in an industrial area, Moerdijk plant was built in 1998 and contains 2 oxy/fuel furnaces with bubbling technology. The plant produces exclusively for Heineken, having a long-term supply agreement which covers the investment. In 2009, a EUR 45 million project leaded to the construction of its second furnace, which is dedicated for the production of two different sized bottles (Heineken, 2018). The investment has reduced the CO2 footprint of the plant by 1–2% and delivered annual cost savings that exceed the initial investment. The average recycling amount of glass is 83%, steam is produced from exhaust gases for driving a cooling air fan and electric boosting will be applied shortly in both furnaces for increasing capacity by 10%4.
The company’s glass production facilities are regulated under the EU ETS, and hedges a portion of its carbon purchases using European Union Allowance future contracts (Ardagh Group, 2017a). Ardagh seeks to optimise the use of recycled glass in the production process, aiming for prolonging furnace life and for decreasing energy costs and carbon emissions (Ardagh Group, 2018). In the Dongen plant, the company recently installed equipment to measure CO in the exhaust gases to increase energy efficiency by heating up less air (i.e. 200ppm CO). Ardagh has been working on the development of more environmentally friendly packaging design, as well as the infinite exploitation of permanent recyclable materials.
1.4 O-I Netherlands B.V.
Owens-Illinois Inc. (known as “O-I” since 2005) is a company headquartered in Perrysburg, Ohio, US which specialises in container glass products. The global footprint of O-I spans 23 countries, employing 26,500 people at 78 plants, out of which 8,000 are employed in 11 European countries. In 2018, the company reached a market value of EUR 3.1 billion with EUR 5.97 billion revenues and EUR 8.5 billion worth of assets5. The company is improving its competitive advantage through investments in R&D, launching new product solutions on an
4 Sven-Roger Kahl, Ardagh Glass Dongen B.V., Personal communication. 5 Retrieved from Fortune: http://fortune.com/fortune500/owens-illinois/
annual basis. O-I distinguishes itself by the ability to maintain flexible production lines, as well as the use of lean six sigma processes for projects evaluation, priority setting and problem solving. The company is also the preferred partner for many leading food and beverage brands, including Diageo, SAB Miller, Nestle Waters and Coca-Cola.
In the Netherlands, the closure of an installation in Schiedam in August 2017 moved a part of its production to the peripheral O-I plants. The company now operates 2 facilities for container glass production with 650 employees combined, initially owned by Vereenigde Glasfabrieken and incorporated in 1995 into the French Danone Group before acquired by O-I (Wikipedia, 2019). The first bottle in Leerdam was produced in 1765. The current
Leerdam’s beer bottle plant has an oxy/fuel and two end-port regenerator furnaces. Regular production is 800–900 tonnes per day in 7 production lines6, comprising 200 different products of green, light amber and dark amber glass with a recycled content of about 75%. O-I completed a EUR 21 million investment in 2014, which included a furnace rebuild, machine upgrades and quality equipment to strengthen the plant’s production and quality capabilities, targeting at a 15% decrease in CO2 emissions (Derijck, 2013). The Maastricht plant produces approx. 1 billion jars and bottles per year, with a gradual increase in the beer bottle production (currently 30%). It operates since 1834 and the current facility includes 3 end-port regenerator furnaces for the production of flint and amber glass. Nearly 400 different products are manufactured in 9 production lines, having a recycled content of 60– 65%.
The company announced its long-term sustainability goals in 2009, regarding the reduction of energy consumption and CO2 equivalent emissions per container. According to a 2007 baseline, the average manufactured container consisted of 34% post-consumer glass and required 2.14 MJ to produce, resulting in 0.179 kg of direct and indirect CO2 emissions. The company now aims to increase post-consumer recycled content in their products to 50% by 2025 while achieving a 25% reduction in emitted greenhouse gas by 2030 (O-I, 2019). O-I is currently using more post-consumer glass than any other glass-container maker (approx. 4.5 million tonnes), and targets at a 60% global average of containers that consist of recycled materials.
1.5 Libbey Glass
Originally founded in East Cambridge, Massachusetts in 1818 and based in Toledo, Ohio, Libbey Inc. (formerly “Libbey Glass Company”) is one of the largest glassware and tableware manufacturers worldwide. The company operates six manufacturing facilities and added glassware, dinnerware and flatware to its line-up in 1997 through the acquisition of World Tableware Company. The company produces over 1.2 billion pieces consisting of 1,000 stock glassware items, while employing 6,600 people worldwide and supplying tabletop products to retail, foodservice and business-to-business customers in over 100 countries (Libbey, 2018). Libbey’s retail customers include Crate & Barrel, Target and WalMart. By collaborating with technology providers such as Praxair, Libbey puts particular strain on the development of technologies for increased glass efficiency. The company is committed to reduce emissions, save energy and lessen its reliance on natural resources, aiming to align with the European roadmap towards a carbon free economy by 2050 and position its Leerdam location as sustainable and premium production tableware site (de Diego et al. 2017; 2018).
Libbey introduced partnership with Royal Leerdam in 2002, which implemented changes in its glassware furnace in May 2017 for shifting from recuperative to oxy fuel combustion. Starting from November 2017, a project partially funded by European Union with a LIFE
grant (LIFE 15 CCM/NL/000121) of EUR 2.3 million aimed at the advanced heat recovery in a second oxy/fuel fired glass furnace with a capacity of over 100 tonne per day (tpd) (Praxair, 2017). The concept which is broadly known as OPTIMELT™ Thermochemical Regenerator (Optimelt TCR) takes advantage of the high temperature flue gas using a regenerative system and reforms natural gas into hot syngas (Section 4.3). It is reported that fuel consumption reaches 440–480 m3/hr for glass pull 65–85 tpd (de Diego et al. 2018). A vacuum pressure swing adsorption (VPSA) system by Praxair is used for the on-site oxygen production of about 56 tonnes per day at Libbey’s facility (de Diego et al. 2016). Royal Leerdam glassware now offers a broad range of glass tableware products for the retail market, the foodservice market, next to a Libbey-branded glassware range.
The Leerdam plant emitted around 25–30 kt of CO2 in 2017. The company set the goal of reduced energy consumption and CO2 emissions of 45–60% and annual NOx emissions by 25–35% compared to its past oxy/fuel installation and in line with Low-NOx burners for glass (Herbst et al. 2017; Laux et al. 2016). The first reductions in air emissions were reported in 2018 after upgrading to Optimelt TCR. Given the high potential in energy savings of the Optimelt technology compared to other existing options for using waste heat, the company targets at the exploitation of residual heat in percentages greater than 20%. This would enable the application of additional energy efficiency measures such as oxygen, natural preheating or batch/cullet preheating with subsequent benefits of reduced CO2 emissions. Lastly, the goal of increasing the recycled glass content final products to over 50% would allow further reductions in process emissions but requires higher cullet quality from the market.
2 Manufacturing
processes of glass
Glass manufacturing involves the conversion of raw materials into finished products that fulfil certain requirements (Chang, 1995). This conversion is accomplished using a great variety of activities that apply energy (i.e. mechanical, thermal, electrical, or chemical) to produce controlled changes in the configuration properties of materials (NAP, 1995). However, industry emissions are intrinsically linked to the production process due to those activities (CAT, 2017). Therefore, CO2 and energy efficiencies need to be assessed in light of the melting techniques which are applied, as well as the existing infrastructure, fuel input, and glass characteristics.
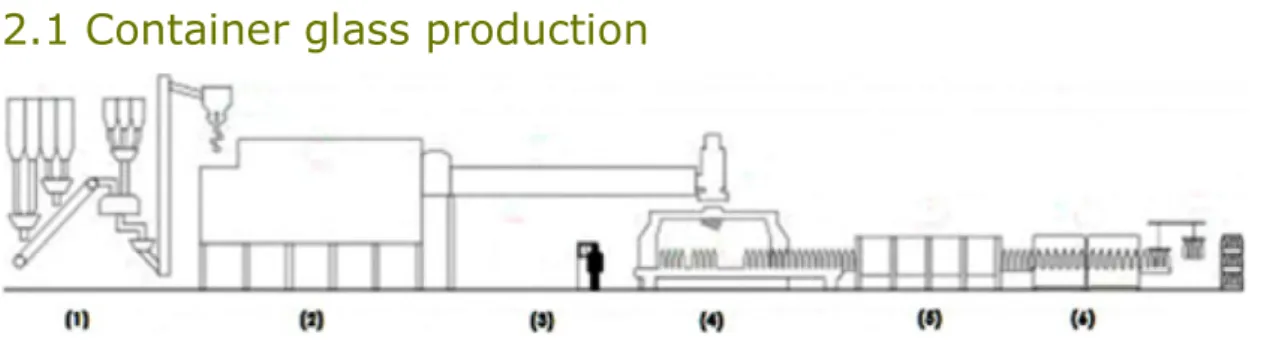
2.1 Container glass production
Figure 4 Process activities of glass-container production (Emhart Glass, 2012). The production of container glass can be roughly subdivided into seven process steps: batch preparation, melting & fining, refining & conditioning, forming & moulding, annealing, surface treatment and inspection which are further described in the following Sections. Most of the energy is consumed in the melting of the heterogeneous mix up to the conditioning step. This part is assumed to be responsible for about 88% of the total energy consumption of the plant.
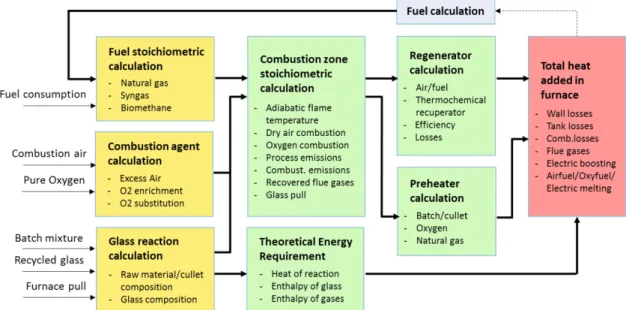
The methodology that we apply to estimate the melting heat starts by determining the energy requirement for the fusion of input materials in quantities which are retrieved from publicly available reports. That way, the heat released in the combustion space can be obtained by subtracting the melting heat, the enthalpy exchange of input materials and the heat losses through combustion space and glass tank refractory from the enthalpies of fuel and flue gases (Koshmanesh et al. 2007). Heat losses can be very furnace specific, but in our estimate any unknown values are initially filled with industry averages. Depending on energy recovery options and/or electric boosting applied in the process as well as the oxidant used for the combustion of fuel, the respective temperature windows of flame, furnace and flue gases are extracted and an estimate for the energy use is obtained. A reduction of the energy required, because of energy recovery options or the application of electricity for part of the energy requirement, results in a reduction of the amount of fuel demanded, which in turn requires less heating of air/oxygen for combustion. To achieve an estimate of energy consumption of the glass melting process, this calculation is done in an iterative way, illustrated in Figure 5. Values are expressed per tonne of molten glass when related to the
furnace, and expressed per tonne of packed glass when referring to the glassmaking process as whole7.
Figure 5 Method followed for estimating specific energy consumption of furnaces. These more detailed calculations for specific plant types and glass types were performed and are presented in Appendices B and C. The generic process flow chart in Figure 6 is deemed representative for the average Dutch container glass manufacturing process.
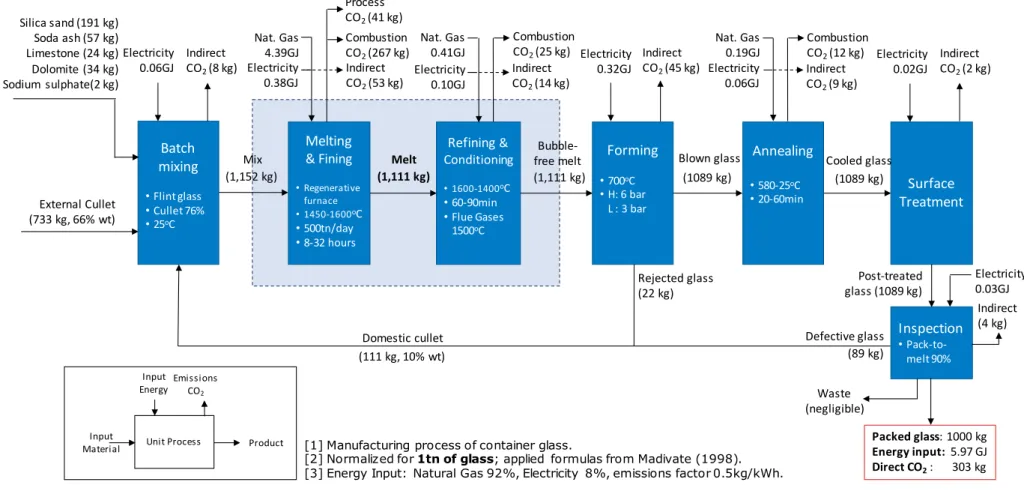
Figure 6 Flowchart of the manufacturing process of container glass8.
8 Regenerative furnace; Natural gas to total fuel input ratio 92%, indirect emissions factor 0.5kg/kWh. Formulas applied from Madivate (1998); normalised for 1 tonne of packed glass.
Packed glass: 1000 kg Energy input: 5.97 GJ Direct CO2: 303 kg [1] Manufacturing process of container glass.
[2] Normalized for 1tn of glass; applied formulas from Madivate (1998). [3] Energy Input: Natural Gas 92%, Electricity 8%, emissions factor 0.5kg/kWh.
Inspection
• Pack-to-melt 90% Domestic culletBatch
mixing
• Flint glass • Cullet 76% • 25oCSurface
Treatment
Annealing
• 580-25oC • 20-60minForming
• 700oC • H: 6 bar L : 3 bar Refining & Conditioning • 1600-1400oC • 60-90min • Flue Gases 1500oCMelting
& Fining • Regenerative furnace • 1450-1600oC • 500tn/day • 8-32 hours Silica sand (191 kg) Soda ash (57 kg) Limestone (24 kg) Dolomite (34 kg) Sodium sulphate(2 kg) External Cullet (733 kg, 66% wt) (111 kg, 10% wt) Mix (1,152 kg) Nat. Gas 4.39GJ Electricity 0.38GJ Process CO2 (41 kg) Combustion CO2 (267 kg) Melt (1,111 kg) Indirect CO2 (8 kg) Electricity 0.06GJ IndirectCO2 (45 kg) Electricity 0.32GJ IndirectCO2 (2 kg) Electricity 0.02GJ Bubble-free melt (1,111 kg) Blown glass (1089 kg) Cooled glass (1089 kg) Rejected glass (22 kg) Defective glass (89 kg) Post-treated glass (1089 kg) Combustion CO2 (25 kg) Nat. Gas 0.41GJ Electricity 0.10GJ Combustion CO2 (12 kg) Nat. Gas 0.19GJ Electricity 0.06GJ Waste (negligible) Electricity 0.03GJ Unit Process Input Material Input Energy Product Emissions CO2 Input Material Product Indirect CO2 (53 kg) Indirect CO2 (14 kg) Indirect CO2 (9 kg) Indirect (4 kg)2.1.1 Batch preparation
The glass melting process starts from a granular mixture of natural and/or synthetic raw materials (i.e. batch). Soda-lime-silica glass is usually made by melting batches of silica sand (SiO2), soda ash (Na2CO3), limestone (CaCO3) and dolomite (CaMg(CO3)2). Alumina carriers (Al2O3) are added as stabilisers to enhance the chemical durability, while fining agents such as sodium sulphate are added to promote the removal of bubbles from the melt (Hujova et al. 2017). Small quantities of other additives are included to give desired characteristics to individual glasses (Ecofys, 2009). Recycled glass is used in variable quantities and can be found in proportions as high as 60–90% for external and 5–25% for internal cullet which originates from production losses. The materials are fed into the weighing area, carefully sorted and mixed according to a precise formula to form to a homogenous composition. Variations in batch compositions are used among glass-making companies which ultimately define the colour (i.e. flint, dark/light amber, and emerald green; see Appendix C) and other desired characteristics of the produced container glass (see Chapter 3). Depending on the demand for glass and location-specific type of production, the plant may switch to other products for about 5–9 times per week9. The operation requires electricity as primary energy source and accounts for approximately 1.0–1.5% of total energy demand (IETD, 2018), but this may depend on the glass type.
Table 2 Batch preparation energy & material requirements.
Parameter Amount Unit per tonne of packed glass Comments
Input
Electricity 0.05 GJ Assumed to be 1% of
total energy use
Silica sand 190–195 kg Table C1; Average of
three glass types
Soda ash 50–58 kg Table C1; Average of
three glass types
Limestone 25–35 kg Table C1; Average of
three glass types
Dolomite 20–35 kg Table C1; Average of
three glass types
Sodium sulphate 1–2 kg Table C1; Average of
three glass types
External cullet 733 kg Assumed 66% external cullet
Domestic cullet 111 kg Assumed 10% internal cullet
Output
Indirect CO2 8 kg Emission factor 0.5 kg CO2
per kWh (WEC Report, 2018)
Batch mix 1152 kg Heterogeneous
glass mix
2.1.2 Melting & fining
For transforming the batch and cullet mixture into molten glass, furnaces employ combustion heating (e.g. air/oxy-fuel burners), direct electrical heating or their combinations (e.g. electric boosting; see Appendix A). The melting accounts for about 75–80% of total energy
use (i.e. 4.6 GJ/t packed glass), typically 50% of which is dispersed in the exhaust gases and in structural losses depending on the degree of insulation, sealing and heat recovery options (Tapasa et al. 2012; see Section 4.3). The majority of total heat is absorbed by the raw materials mixture during the first 0.75–1 hour, while the molten glass resides in the furnace between 8–32 hours depending on the melting technique, furnace capacity and glass quality standards. Process emissions occur due to carbonate decomposition in the process input and account for 10–15% of total direct emissions (Ecofys, 2009). Glass production is a
continuous process and the furnace operates for many years at a time, as long as its lifetime allows for. Downtime for furnace maintenance typically lasts 35–40 days.
Melting of raw materials, homogenisation and fining takes place in the melting end of the tank. After the glass went through a narrow channel called throat, the refining, final homogenization and conditioning of the glass takes place in a refiner and forehearth. The cold batch is heated by electrical heating and mainly by fuel-burning systems until batch-to-melt conversion takes place between 850–1200°C. The resulting glass batch-to-melt contains bubbles and is further heated to temperatures of maximum 1550°C depending on glass specifications (i.e. colour, quality specifications, etc.). The mixture is continuously charged into the furnace to compensate for the glass withdrawn and keep the glass level in the furnace constant (IETD, 2018).
Depending on location-specific strategies by container glass companies, dolomite may be used in the batch mixture. The decomposition of calcium carbonate occurs in a two-stage process (Olszak-Humienik et al. 2015):
CaMg(CO3)2(s) + Heat
CaCO3(s) + MgO(s) + CO2(g), ΔΗf=-1780 kJ/(kg CaCO3) (1)CaCO3(s) + Heat
CaO(s) + CO2(g), ΔΗf=-3303 kJ/(kg CaO) (2)Sodium carbonate serves as a flux for silica, enabling a decrease of the melting point of the mixture hence decreasing the residence time of the melt in the furnace (Hubert, 2015). Sodium carbonate requires lot of heat to completely decompose:
Na2CO3(s) + Heat
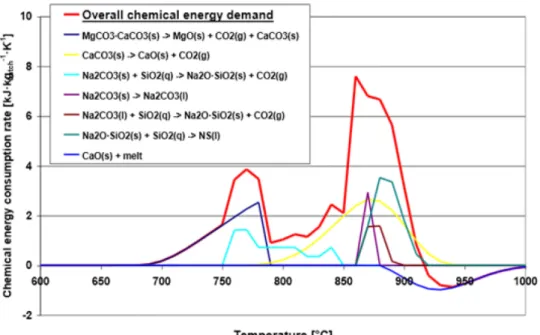
Na2O(s) + CO2(g), ΔΗf=-3576 kJ/(kg Na2O) (3)Decomposition of carbonates occurs between 600–900°C or even lower when dolomite is used while the addition of cullet can accelerate the melting of the mixture (Deng et al. 2018). The mix starts exhibiting liquid characteristics in temperatures around 800–850°C. Gases are released from fining agents across all temperature trajectories of the glass melt. Chemical homogenization is achieved in the bulk of the glass melt in the glass melting tank and further downstream10.
Figure 7 Chemical energy demand for the production of a SLS glass (Hubert, 2015).
2.1.3 Refining & conditioning
The other separated section of the tank is the refiner (i.e. refining end) in which the melt starts to cool and to condition toward its uniform working viscosity. An initially bubble-rich melt is produced by CO2 from carbonate-containing batch ingredients, together with water and air trapped in the interstices of the raw material batch (De Jong et al. 2011). After the fining process completes, the remaining bubbles require the refining process, taking place under controlled temperatures, starting from 1550oC and dropping down to 1400oC where the solubility of the gases in the melt increases with decreasing temperature (Hubert, 2015; Butler et al. 2011). The refining time typically lasts 60–90 minutes and can influenced by a number of factors such as viscosity, batch composition, sulphate used and melting time (Watts, 2017).
The bubble-free molten glass is then distributed to a forehearth, a brick lined canal which delivers glass to the forming machine. The forehearth can be gas-fired or electrically heated, and its performance is determined by the range of pull rates (i.e. amount of molten glass produced), range of temperatures where the production maintains an acceptable degree of homogeneity, and its ability to maintain temperature stability (Beerkens, 2012). The outcome is a thermally and chemically homogeneous melt made available at the defined temperature level (Conradt, 2008). Energy required in both activities is 6–7% of the total consumption (JRC Report, 2013).
2.1.4 Forming & moulding
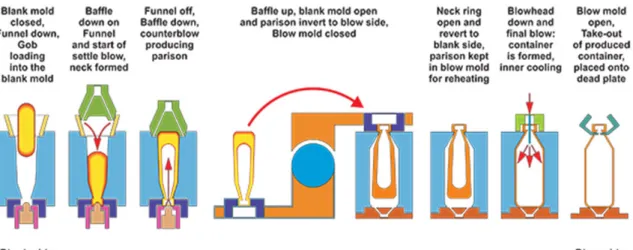
The conditioned glass exits the melting tank and is transported to forming machines at a constant rate, where a plunger pushes it down through a narrow tube (Emhart Glass, 2012). As the stream of glass emerges from the tube, it is cut off using shears and turned into gobs of molten glass (i.e. even shapes which can be moulded). This takes place in 8–20 machines called Individual Sections (IS) which can be independently maintained. The forming
machines give shape to the container glass through automated processes known as press-blow (mainly for jars) and press-blow-press-blow (mainly for bottles). By pressing the sheared gob into a blank mould using compressed air, the gob gets its intermediate shape (i.e. parison) which is then moved from the blank side to the blow side for final blowing and shaping (Figure 8). The energy used in forming containers is about 5–6% of the total energy use, and depends largely on the electricity for compressed air and the weight of the container.
Figure 8 Blow-blowing process for container glass forming (Qorpak, 2019).
2.1.5 Annealing
Once the blown containers are formed, they are loaded through a conveyor belt into a lehr for thermal treatment (i.e. annealing). Their temperature is rapidly brought back up to approx. 580°C, then reduced gradually and uniformly until no further strain can be induced (IETD, 2018). The product is cooled afterwards by fan air to room temperature. Without this activity, which accounts for approx. 4–5% of the total energy consumption, the glass would be low-resistant to cracks under small thermal or mechanical shocks (Hubert, 2015). The duration of the activity is important, both for the successful relieving of the glass from its internal stresses and for the reduction of the costs associated with the energy requirement. Depending on the product type (i.e. size and wall thickness), a 15-minute residence is required close to the annealing heating point, followed by a 30–60 minute residence close to a higher, strain point. Emerging from the lehr, the container glass is fully cooled and
conveyed to further steps.
2.1.6 Surface treatment
The coating of glass surfaces gives to the glass new physical and optical properties. Glass containers are coated with organic compounds to give the surfaces a degree of lubricity, thus preventing abrasion in handling (IETD, 2018). The two main types are stearate- and
polyethylene-based coating, which add strength to the container, facilitates the application of labels and enables glass manufacturers to make lightweight products (Worrell et al. 2008). In contrast, the Internal Fluorination Treatment (IFT) is the process that makes soda-lime glass to treated soda-lime glass and is applied to prevent blooming (Qorpak, 2019). The energy required for post treatment is about 0.3–0.8% of the total energy use (Beerkens, 2012).
2.1.7 Inspection
Before the shipping of the final product, further activities include the Inspection, which uses fully automated devices to eliminate defective containers, and the Packaging of glass for transportation to the client’s factory (Meuleman, 2017). It includes measurements in terms of height, diameter, verticality, choke and thickness of containers. Critical defects are discarded as dangerous, while main-faults defects make the container unusable. Secondary defects represent a lowering of the quality of the container but do not affect the functionality of the container. As a result, the inspection contributes to the plant’s domestic cullet,
Table 3 Post-melting energy & material requirements.
Parameter Amount Unit per tonne of packed glass Comments
Input
Natural gas 0.54 GJ Needed for annealing
Electricity 0.48 GJ Needed for forming, annealing,
surface treatment & inspection
Molten glass 1.1 t Glass melt exiting the furnace
Output
Direct CO2 30 kg Emitted from annealing lehr
Indirect CO2 61 kg Emission factor 0.46 kg CO2
per kWh (Schoots et al., 2017)
Glass product 1000 kg Packed glass
2.1.8 Overall container glass-making process
The total energy consumption of a container glass plant is estimated at 5.8–6.5 GJ per tonne of packed glass and depends on the glass colour and amount of furnaces and articles
produced11. Energy is coming from both gas and electrical boosting and electricity is normally used in rates 8–15% of the total melting energy (Figure 6; see Appendix A). Figures 9 and 10 illustrate the energy consumption and related direct and indirect emission for the various subprocesses.
Figure 9 Energy input per subprocess for the production of container glass.
Figure 10 Total direct and indirect CO2 emitted per industrial glass-making subprocess.
Furnace designs are bound to the plant’s space, while the investment decision on a furnace type is mostly affected by the quality of the product, stability and lifetime. The frequency of furnace maintenance as well as the future of a furnace which approaches its end of life (approx. 15 years) depends on the company strategy. An indication for the latter would be a steep increase of energy consumption or the considerable wear of refractories which
increases the risk of unexpected leaks.
The otherwise lost residual heat is taken as heating medium from the waste gas channel of the melting end. Waste heat recovery options are interlinked to the furnace type (i.e. air/fuel, oxy/fuel) as well as the temperature and purity of the flue gases exiting the furnace or the regenerator (see Appendix A; Section 4.3). The recovered heat from flue gas is about 60–68% depending on the heat recovery system, which helps to maintain the primary energy input for melting at the levels of 4.5–4.8 GJ per tonne of glass. A heat recovery system of high efficiency results in residual gases of low heat content which prevents a further use of the exiting gases. Options that do not use the residual heat directly back to the melting process may be more preferable for process control reasons (see Section 4.6), but may also require the cleaning of flue gases and also stay above 200oC to avoid sulphuric acid (e.g. preheating natural gas for annealing).
Flue gas Treatment
Due to organic contamination in high cullet-containing batches as well as the sulphur originating from fining agents, the exhaust gases are often cleaned in an electrostatic filter when exiting the furnace and after entering a regenerator. Desulphurisation and normal operation of the filter takes place in temperatures between 250–380°C. Pollutant-abatement systems may be installed after the regenerator for cleaning this stream of process and combustion emissions (e.g. deSOx and deNOx).
The furnace can be sealed using a baghouse filter, an air pollution control device and dust collector which is attached to the furnace. As a consequence, if a regenerative furnace is connected to a baghouse filter it is mandatory to cool the flue gasses, because filter bags only withstand 220°C (TNO, 2010). Waste gas cooling takes place in a quench chamber that is operated either with air or water, or a combination of both (Sorg, 2011). If the flue gases are
cooled down a lot, the cleaning system of flue gases may not work properly (HREII, 2018). For sulphur removal, scrubbing takes place at a temperature of around 350°C and it is filtered at around 200°C . Below this temperature range, undesired sulphuric acid is formed.
2.2
Tableware glass production
Royal Leerdam is originally specialised in stemware and uses a production technology which is partly differentiated from container glass making. The furnace currently in use to produce tableware glass has been constructed in 2018 and is of the innovative Optimelt type. The Optimelt Thermochemical Regenerator (Optimelt TCR) takes advantage of the high temperature flue gas using a regenerative system and uses 20% of the flue gas together with natural gas to make a hot syngas in the right mixture (Section 4.3). It uses oxygen rather than normal air for combustion, and a vacuum pressure swing adsorption (VPSA) system by Praxair is used for the on-site oxygen production of about 56 tonnes per day at Libbey’s facility (de Diego et al. 2016). The remaining flue gas is of insufficient volume to use for additional preheating purposes, given the oxy/fuel technique and size of the furnace. Compared to container glass production, the energy consumption of the forming and moulding fase of tableware glass production takes significantly more energy. Whereas for container glass production the furnace consumes 80% of the total energy/t packed glass, for tableware glass this is only 65–70%, with the additional 15% going to forming and moulding. Typically, cullet rates that can be used are lower because of the quality required for
tableware glass. Only internal cullet is currently used in the process, as there is no tableware cullet available in the cullet market.
Special thermal processes are followed downstream the melting with the prospects to produce durable glassware with prolonged service life. Duratuff© Treatment and Heat Treat are the activities which increase the glass resistance to thermal and mechanical shocks by strengthening the upper portion of pressed tumblers and blown ware, respectively. By treating just the upper third of the glass at a lower temperature puts a safer amount of stress on the glass and positively affects the way that glass breaks (i.e. smaller jagged pieces). Other activities include SheerRim/DTE® that features a crack-off rim which is fire polished to smooth the edge and improve durability12. In addition, one-piece stemware is made from one continuous piece of glass which is stretched in a second machine process, while two-piece glassware has the bowl made in one machine and the stem and foot in a second one.
The production of container and tableware glass are among the processes which allow product light-weighting as an effective means to reduce environmental impacts (IFC, 2007). This can be done by increasing the product count that can be manufactured from a given weight of molten glass (see Section 3.1).
3 Glass products and
application
This chapter consists of an overview of the main materials used in the glass-making process, as well as physical/chemical/economic/environmental properties of the respective
compounds. Emphasis is also given on the recycling of glass products and the benefits associated with their use. Aside from container glass, grades of commercial glass products include:
• E-glass (CaO.Al2O3.B2O3.SiO2) is the glass type which is known for its low electrical conductivity and mechanical strength. Its properties makes it a good fit for the
production of optical products such as fibre glass for electronics. Variations of this type may replace B2O3 with MgO or TiO2.
• A-glass (Na2O.CaO.B2O3.SiO2) is a low-cost type of glass which is mostly known for its fiberisability. This makes it applicable for insulation (i.e. glass wool) and reinforcement purposes (i.e. fibre glass).
• Borosilicate Glass (Na2O.B2O3.SiO2) is known as for its laboratory use (e.g. Pyrex, Duran), as well as for the production of cooking utensils and headlights. Its resistance to thermal shocks is among the most important properties.
• Quartz (SiO2) has a high-temperature and thermal-shock resistance, making it useful for telecommunications (i.e. optical glass fibres), as well as for laboratory and chemical equipment. Although pure silica can be made into high quality glass (i.e. vitreous silica), this would require the batch to be heated in temperatures far above 1700oC.
3.1 Container glass in the Netherlands
Depending on the batch mixing formulas, variations in the chemical compositions give desired characteristics and properties to the glass product (Qorpak, 2019). Soda Lime Glass (Na2O.CaO.SiO2) is commonly used for the production of container, flat and tableware glass, as well as lenses and lighting. Annealed and tempered soda-lime are two of its grades, which show differences in terms of mechanical, thermal and electrical properties13. Flint and emerald green consist of oxidised glasses, while light/dark amber of are known as “reduced” glasses containing high level of carbon (GPI, 2019). The low-cost feedstock allows the mass production of this type.
An increase of sodium oxide (Na2O) content may decrease the viscosity of the glass product, which is a measure of its resistance to flow and its tendency to prevent crystallisation. Calcium oxide (CaO) improves the chemical resistance of glass, while an increased content of aluminium oxide (Al2O3) makes a favourable influence on the tensile strength (Figure 11).
Figure 11 Relation between oxides and effect on glass properties (Hubert, 2015).
Applications of Container glass
Glass products contribute in a major way to society’s sustainability goals for the reduction of energy use, renewable energy production and efficient use of resources (WBG, 2004). At the same time, the production meets the strictest requirements in food and other critical
contacts, responding to growing marketplace and the high levels of customer demand for more sustainable packaging (PB & DNV GL, 2015). Container glass manufacturers provide with a comprehensive line of stock products for the following categories:
• Beer, wine, spirits, specialty, non-alcoholic beverages (i.e. bottles) – 75%; • Food (i.e. jars, bowls, plates, cups), pitchers, vases – 20%;
• Pharmaceuticals, chemicals, cosmetics (i.e. flacons), and personal care – 5%.
Production of Container glass
Being dependent on sales of food and beverages, the demand for glass containers does not fluctuate greatly with business cycles compared to flat glass demand (Butler et al. 2011). Yearly production of glass containers in Europe is projected to reach 17.74 million metric tonnes (t) by 2020 with a compound annual growth rate of 3.32%14. In the Netherlands, the organic growth of container glass industry is estimated at 1.0–1.5% per year15. Despite the closing down of the float glass facility by AGC, the total production capacity of 1.26 million tonnes reduced by only 0.5% in 2015 compared to 2012 (van Valburg, 2017). Apart from the anticipated process enhancements (see Section 1.3.2; 1.3.3), no expansion investment plans have been publicly announced by the Dutch glassmakers.
Market value
The light-weighting industry trend, as well as the growth of end use industries have been some of the main drivers of the glass market (Hatzilau et al. 2016). At the same time, gas and electricity prices and the competition from alternative materials play a role in shaping price levels in the glass industry. Depending on market preferences, costs and packaging developments, the position of glass relative to its competitors varies widely between regions and products. Such competitors can be plastics (e.g. PET-polyethylene), metals (e.g. steel and aluminium) and laminated cartons (JRC Report, 2013).
Glass furnaces that use significant electric boosting and contain a large amount of molten glass could be able to accommodate some flexibility needed to profit from rewards, grants
14 Retrieved from the Ceramic Industry:
https://www.ceramicindustry.com/articles/95243-glass-container-market-expected-to-see-steady-growth-in-europe-through-2020
and lower electrical tariffs (Eurotherm, 2019). Lower peak power demand can lead to lower tariffs, therefore the overall cost of electrical energy can be decreased by ensuring that agreed peak power levels are not exceeded (Eurotherm, 2019). Glass container
manufacturers have a scope to increase their margins by joining forces with glass recycling companies to develop efficient glass collecting practices16. According to CE Delft (2016), the opportunity costs of the freely obtained ETS allowances were forwarded in glass-container product prices to a lesser extent than other glass products (i.e. 20–50%)17.
3.2 Recycling of glass
Role of recycled glass in the glass industry
The container glass sector draws the vast majority of recycled glass, which comes from post-consumer glass or glass processing plants (Drummond, 2011). The recycled glass content of the total heterogeneous glass mix varies between 50–80% for external recycled cullet and 10% for internally recycled glass and depends on the requested glass quality and operating constraints (e.g. product changes per year)18. By partly replacing a batch of mineral raw materials with recycled glass, the facility reduces:
• the use of heat for the endothermic chemical reactions between batch components during the glass formation by the same rate (De Jong et al. 2011);
• the fuel consumption by around 2.5% for every 10% addition of cullet, for typically used cullet ranges, purely calculated as melting energy saved (Madivate, 1998; Drummond, 2011; Butler et al. 2011). For tableware the energy savings are somewhat lower (1.5–2% per 10% cullet addition).
• the demand for raw materials, among which the most significant are carbonates such as soda ash, limestone and dolomite that decompose in the furnace releasing CO2. In principle, the addition of 1 tonne of recycled glass leads to a reduction of 1.2 tonnes of primary raw materials, along with consequent cuts in process emissions (JRC Report, 2013).
Recycling rate of glass in the Netherlands
The Netherlands is amongst the best performing countries in Europe in the field of recycling waste, setting higher collection targets for packaging glass than its European counterparts (KIDV, 2016). At the same time, the glass recycling landscape is evolving and there is a lot of public attention for further increasing the return of container glass from household residual waste to the glass industry. In 2013, the amount of packaging material introduced to the Dutch market per capita was 167 kg and the total percentage for collected packaging waste was 94% (Eurostat, 2016, cited in KIDV, 2016). In 2015, 83% of the consumed 492.000 glass tonnes were collected, resulting in a gradual increase of 3% compared to the previous year19.
National recycling rate (%) =National tonnage of cullet collected (National glass consumption20 (in tonnes)tonnes) x 100 (1)
Headquartered in Eindhoven, Maltha Glass Recycling is responsible for the recycling of glass containers in the Netherlands. The main challenge for environmentally and cost-effective recycling of container glass arises from the dispersed nature of its sources, and the
16 Retrieved from Businesswire:
https://www.businesswire.com/news/home/20180514005833/en/Glass-Packaging-Market-Europe---Compatibility-Glass
17 For hollow glasses, the range of average expected cost pass-through is 30–80% (CE Delft, 2016). 18 Joost Laven, O-I Netherlands Schiedam B.V., Personal communication.
19 Data on glass container collection for recycling (FEVE, 2015).
20 The national consumption of glass containers is equal to the national production of all glass containers (incl.
consequent need for infrastructure regarding its colour separation, identification and removal of glass-ceramics21, collection, and transportation to processors to produce furnace-ready feedstock (Butler et al. 2011; VNG, 2012).
Glass waste and disposal
The cullet ratio depends on glass colour, level of impurities and market availability (Glusing, 2003). In theory, container glass can be made from 100% cullet and can be endlessly recycled without losing its intrinsic properties (FEVE, 2016). However, there are practical limitations to this approach. Firstly, the marginal environmental and financial burdens of collecting too much post-consumer waste may exceed the marginal benefits (Butler et al. 2011). Secondly, at least 1% of batch composition is typically used for controlling the colour and fining of the glass. By melting a cullet-only batch, the final product would contain lots of gaseous inclusions called “blisters”, which can be released by heating the glass at high temperature for a long time25. Bubble removal takes place by adding fining agents to initiate the fining process (approx. 0.2–0.55% of total amount of glass) and to neutralize
contamination from recycled cullet.
Figure 12 Life cycle of primary/secondary material for container glass22.
The industrial process does not create residual waste glass. Everything is reused as domestic cullet, with the exception of some very contaminated glass which were disregarded during quality check (approx. 25 t rejected every 6 years). In the Netherlands, no recycled cullet is land filled as waste. Roughly 70–75% can be used in the CG industry, the rest is dismissed for quality reasons and used in other applications. The reason behind this is the likelihood of problems associated with foaming, bubbles and refining when using low-quality cullet. This happens due to organic contamination caused by plastic labels, misplaced items which contaminate the entire load, or crushed cullet of extremely small particle size23.
21 Oscar Verheijen, Celsian Glass and Solar B.V., Personal communication.
22 VDI (2015), cited in Anglarill, A.G. (2018). Life cycle assessment of a conventional float glass production and
comparison with regenerative alternatives.
4 Options for
decarbonisation
Developments associated with increased recycled cullet, improved furnace design and combustion control, improved insulation, and more effective regenerators have led to significant energy efficiency and emission improvements in the glass-container industry (Hatzilau et al. 2016). A transition to innovative methods is needed to unlock new possibilities for reducing combustion-related CO2 emissions, making a step forward in the aftermath of improving energy efficiency (HRE, 2018; Meuleman, 2017). After industry consultation and literature review, the main decarbonisation options discussed in this report are air/fuel, oxy/fuel and electric furnaces. These options may go hand in hand with options such as alternative energy carriers, waste heat recovery, batch reformulation and innovative processes (see also Appendix A). We categorise the various decarbonisation options
according to a framework laid out in Figure 13, in which seven categories are distinguished.
Figure 13 Categories of emission-reduction options in the full production chain.
An overview of potential options and measures is shown in Table 4, where the technologies and their characteristics are summarised. Their level of development is indicated by the “Technology readiness level” (TRL), which ranges from 1 for basic technology research to 9 for successful end-use operation. The costs of CO2-recuding technologies are related to annual production capacities (or emissions in the case of CCS), and ranges may be provided for Capex when data are partly over- or underestimated. Note that the costs only include on-site costs and exclude any costs associated with changes outside of the fence (such as heavier electricity infrastructure, or heat transport infrastructure. The maximum emissions reductions refer to combustion emissions, process emissions are excluded from this table, and energy savings are expressed in tonnes of glass product.
Table 4 Basic and innovative technology options register for CO2 and energy reductions in the Container glass industry.
Option TRL Market Entry (EUR million)Capex 24,25
CO2 (C) -
Energy (E)
savings26 Data Source
Fuel Substitution:
Substitution of the currently used fossil fuels Full
electrification27 6–7 2030 /kt glass 0.5 15–25% (E) 100% (C) Fraunhofer (2019a)
Green gas instead
of natural gas 8 2020 - 100% (C) - (E) PB & DNV GL (2015b Fraunhofer (2019a) Hydrogen
combustion 4 - 75–84% (C) - (E) WEC Report (2018)
Process Design:
Energy efficiency improvements and/or substitution of production processes Electric furnace 7 2030 (typical size 10 MW furnace) (3.5–5 per MW installed
(tableware 5–6 MW) 100% (C) 15–25% (E) Reynolds (2019) PB & DNV GL (2015b Meuleman (2017) Oxy-fuel furnace 9 Present 15 8–10% (C) - (E) Sundaram (2016) Baukal (2013) Batch/cullet preheating 9 Present 3–4 15% (C) 10–20% (E)28 Wallenberger (2010) PB & DNV GL (2015b Electricity generation 8 2020 1.7–4.9 5% (E) - (C) Forni et al. (2014) Ricardo-AEA (2013) PB & DNV GL (2015b Optimelt TCR Plus 7 2025 15+3.5–4.5 for 100 kt/yr furnace 15–25% (E)15–25% (C) 29 de Diego (2016)
Residual Energy use:
Ways of heat exploitation such as steam and/or electricity generation
Building heating 8 2020 1.0–2.130 1–2% (C)
1–2% (E) PB & DNV GL (2015b IETD (2018) District heating 8 2020 1.0–2.1 - (C) - (E) Forni et al. (2014) Ricardo-AEA (2013)
Carbon Capture and Utilisation and/or Storage:
Process of capturing and storing CO2 or alternative uses of the potentially emitted gases
24 Values expressed in rates of the year of respective sources.
25 Only on-site costs taken into account. Out-of-fence costs are not in scope of this report.
26 Values expressed as CO2 from combustion and energy savings per tonnes of glass product compared to a state-of-art
end-port regenerative furnace of 4GJ/t glass SEC, 220 kg/t glass direct CO2, 76% cullet, 92% natural gas.
27 For container glass production – for tableware glass forming&moulding so far has no electrification option. 28 Fuel savings for cullet preheaters are 6% less compared to batch/cullet preheaters (Baukal, 2013). 29 Approx. 20% compared to oxy/fuel; approx. 30% compared to air/fuel furnace.
Carbon Capture31 5-732 2030 50 EUR/kt packed glass 75% (C) - (E) PB & DNV GL (2015b Fraunhofer (2019a) VNPI (2018)
4.1 Fuel substitution
The fuel predominantly used in the container glass industry is natural gas, which accounts for about 90% of the fuel mix. Fuel switching is challenging, as it may impose changes in operating permits and adjustment to installations such as new burners and control systems. The goal of fuel substitution is to rely on fuels with a lower carbon footprint but, at the same time, keep the same general manufacturing processes (Fraunhofer, 2019a). According to HRE (2018, Table 10), the diffusion level of the fuel switch option is estimated to be 88% by 2030 and approx. 99% in the horizon of 2050.
Full Electrification
The substitution of fossil fuel input with electricity typically refers to the use of electric furnaces (Section 4.3) or electric boosting in the melting process and the electrification of downstream activities (i.e. fining and annealing). This measure is interlinked to the glass quality specifications, as well as economic (i.e. electricity price, investment cost) and physical conditions (e.g. missing infrastructure, position of electrodes into the furnace) (Reynolds, 2018). All-electric solutions are applied in some niche glass manufacturing applications. However, significant furnace innovation is required for its adoption in high-scale container glass production, especially in the case of high cullet rates. The process
prerequisites a steady supply of great amounts of electricity which requires additional reinforcement for the local grid (Fraunhofer, 2019a). The post-melting process of container glass is regarded to be suitable for electrification without substantial need for innovation. All-electric options can have emissions benefits provided the All-electricity comes from a renewable source (PB & DNV GL, 2015).
Green gas (biomethane) combustion
Green gas can potentially be used for glassmaking purposes, given the similar energy content of biomethane to natural gas. Green gas can be either upgraded biogas from anaerobic digestion or cleaned syngas from gasification of biomass, being 100% renewable (EBA, 2013). Using this fuel as a replacement source of heat would bring carbon emissions to net zero, as biomethane lifecycle absorbs the emitted CO2 during production (Fraunhofer, 2019a). Material testing indicated that there were no negative consequences of biomethane firing for the material properties (Fiehl et al. 2017). However, the durability of the refractory of industrial furnaces as well as trace contaminations found in the biogas may pose
additional challenges. Other concerns include the availability and sustainable production of biogas, as well as “the existence of a reliable and upgraded supply” (Fraunhofer, 2019a). Capital costs would not be incurred by switching to this fuel, provided that the system runs on gas burners (Fraunhofer, 2019a), so CAPEX estimates are identical to similar furnace types running on natural gas. It is assumed green gas is of the same quality as natural gas and can be directly substituted in equal amounts.
Hydrogen combustion
Hydrogen is often produced on an industrial scale using a steam methane reformer (SMR) or through a non-catalytic reforming process (see Section 4.3). Despite the evident benefits of this carbon-free fuel (WEC Report, 2018), hydrogen does not have a proven applicability in
31 All costs are for CO2 capture alone, including CO2 purification and compression. Costs associated with transport
and storage/utilisation are excluded (PB & DNV GL, 2015). Assumed that 50 EUR/t packed glass corresponds to 45 EUR/t melt. 75% of total emissions are avoided, which is 75% of 0.29 t CO2 (including post-melting process) in reference technology. Assumed 30% energy penalty, of which 60% natural gas and rest electricity. Cost per tonne CO2 captured is then EUR 174.
the container glass industry. Water vapour which is released from a complete hydrogen combustion creates foam and affects energy consumption, efficiency on the yield, and integrity of the furnace (PB & DNV GL, 2015). At the same time, hydrogen emits sub-optimally in the required wavelength compared to the heavy-fuel air flame of natural gas33, which may change the efficiency.
Current research examines whether pure hydrogen or a blend with fossil energy achieve better radiative properties of the flame (e.g. by spraying biodiesel in a hydrogen flame), hence qualify for container glass making. This would allow a stepwise increase of hydrogen and make the process more renewable, but would also impact on the process (e.g. different burners and control schemes). The future availability and price of hydrogen also guides investment decisions, while its on-site production requires energy which can originate from fossil fuels or renewable sources. For a discussion of the various production processes of hydrogen, with their energy requirements and related emissions, can be found in Cioli et al. (2019).
4.2 Feedstock substitution
Batch reformulation
Decarbonising the existing batch can be achieved through the use of low-carbon materials for replacing currently used carbonates. For instance, process emissions can be potentially reduced by replacing limestone and soda ash with burnt lime and sodium-containing raw materials, respectively (VNG, 2012; Wallenberger, 2010). However, this alternative would transfer rather than combat the target of reducing CO2 emissions to another sector. As to the drawbacks of this option, the quality of final product remains uncertain under current furnace designs, accompanied with an increase in material costs, transportation and chemical
preparation (PB & DNV GL, 2015).
Alternatively, lower temperatures for mixing or melting may be achieved by adding small quantities of more innovative materials, hence reduce fuel consumption (PB & DNV GL, 2015). Also known as “batch separation” or “smart melting concepts”, raw materials can be split into portions with different compositions, melting temperatures and reaction paths. That way, the desired reactions between the fluxes and quartz are promoted at correct timing, resulting in up to 50% shorter melting time and allowing more time for the refining process (Carty, 2013; PB & DNV GL, 2015). Shorter melting times are also achieved through the production of pre-mixed pellets with the correct proportions of ingredients. The technology was expected by 2020 for low-cullet containing batches at a relatively small additional cost (i.e. EUR 0.28 million), with the possibility to apply pelletised batch preheating with flue gas heat (VNG, 2012; Hatzilau et al. 2016, also discussed in Section 4.6), but no major
developments have been made in recent years, pushing back the potential availability of this technology.
4.3 Process design
The industrial processes have already been substantially optimised, but process
enhancements can continue to further reduce the energy consumption of high-temperature processes (Berntsson, 2017; NPI, 1998). Such improvements implicate a more complex technology that may result in additional maintenance and capital expenditure, the use of non-environmentally friendly chemicals, and limitations to equipment lifespan (Meuleman,
33 Sven-Roger Kahl, Ardagh Glass Dongen B.V., Personal communication; Oscar Verheijen, Celsian Glass and