Guidance for deriving Dutch Environmental Risk Limits from EU-Risk Assessment Reports of existing substances
M.P.M. Janssen, T.P. Traas, J-P. Rila and P.L.A. van Vlaardingen
This investigation has been performed by order and for the account of the Directorate-General for Environmental Protection, Directorate for Chemicals, Waste and Radiation, within the framework of project 601501, ‘Setting Integrated Environmental Quality Standards’.
Abstract
In this report the methodology is given for deriving Dutch environmental risk limits for substances for which EU risk assessment reports (EU-RARs) are available in the context of the Council regulation (EEC) no 793/93 on the evaluation and control of the risks of existing substances
Presented here are the minimum requirements for reporting the derivation of risk limits, along with an overview of proposed environmental risk limits based on EU-RAR results. This report also documents the differences between the European ‘predicted no effect concentrations’ (PNECs) and the Dutch environmental risk limits (MPCs), indicating how PNECs can be used to calculate these environmental risk limits.
Preface
This report is part of the project ‘Setting Integrated Environmental Quality Standards’ (RIVM-project 601501). We want to acknowledge drs E.M. Maas (Ministry of Housing, Spatial Planning and the Environment), who is involved in the RIVM-project 601501 in which the work was performed.
The results as presented in this report have been discussed by the members of the ‘Setting Integrated Environmental Quality Standards Advisory Group’ (OZBG-eco), who are acknowledged for their contribution. The advisory group provides a non-binding scientific comment on the final draft of a report in order to advise the steering committee of the project Setting Integrated Environmental Quality Standards (INS) on the scientific merits of the report.
Contents
Samenvatting 5 Summary 6
1 Introduction 7
2 Background, comparison and methods proposed 9 2.1 Using EU-risk assessment reports 9
2.2 Comparison of the EU method and the INS method 9 2.3 Main differences summarised 15
2.3.1 Negligible concentration (NC) and Serious Risk Concentration (SRCECO) 15
2.3.2 Compartments 16
2.3.3 Intercompartmental harmonisation 16 2.3.4 Application of extrapolation factors 16
2.4 Methods proposed for deriving MPCs and NCs from PNECs 17
2.4.1 Estimation of the Kp and Kcompartment-water 17
2.4.2 PNECwater 19
2.4.3 PNECsoil 20
2.4.4 PNECsediment 21
2.4.5 Multiplication factors summarised 22
3 Reporting ERLs for EU-RAR compounds 24
4 Summary of MPCs for EU-RAR compounds 25
References 26
Appendix 1: Mailing list 28
Samenvatting
In 1993 is in de Europese Unie de bestaande stoffen verordening (793/93) van kracht geworden, waarin een samenhangend kader wordt gegeven voor de risico-evaluatie en beheersing van bestaande chemische stoffen. De beginselen voor de beoordeling van de risico’s voor mens en milieu zijn vervolgens vastgesteld met Verordening (EG) nr. 1488/94 en resulteerde in het zogenaamde Technical Guidance Document (TGD). Dit document ondersteunt tevens Richtlijn 93/67/EEG die betrekking heeft op nieuwe stoffen en Richtlijn 98/8/EG die betrekking heeft op het op de markt brengen van biociden.
De resultaten van de risico-evaluaties voor bestaande (prioritaire) stoffen worden gepubliceerd in ‘risk assessment reports’ (EU-RARs). In de milieuparagraaf van deze zgn. rapporten worden milieurisico-grenzen afgeleid, die ‘predicted no effect concentrations’ (PNEC) worden genoemd. Deze PNECs worden vergeleken met zogenaamde ‘Predicted Environmental Concentrations’ (PECs). Indien nodig kunnen er daarna maatregelen worden voorgesteld om de emissies van de betreffende stof te beperken.
De PNECs worden afgeleid aan de hand van een uitgebreid document, het zogenaamde Technical Guidance Document, op een manier die vergelijkbaar is met de afleiding van het in Nederland gebruikte Maximum Toelaatbaar Risiconiveau (MTR). De Stuurgroep Integrale Normstelling heeft hierop aangegeven PNEC-waarden te beschouwen als voldoende weten-schappelijke basis voor de onderbouwing van Nederlandse milieurisicogrenzen.
In dit rapport worden de verschillen tussen de afleiding van de Europese PNEC en het Nederlandse MTR op een rij gezet en worden voorstellen gedaan om deze verschillen te overbruggen. Daarna wordt de wijze waarop de PNEC waarden worden vertaald in Nederlandse milieurisicogrenzen nader belicht. De minimale eisen voor de verslaglegging worden gegeven en besloten wordt met een overzicht van reeds eerder voorgestelde milieurisicogrenzen op basis van EU-RARs.
Summary
In 1993 the Council of the European Communities adopted Council Regulation (EEC) 793/93 or the Existing Substances Regulation (ESR), thereby introducing a comprehensive framework for the evaluation and control of ‘existing’ chemical substances. The principles for the assessment of risks to man and the environment of existing substances were laid down in Commission Regulation (EC) No 1488/94 and resulted in the so-called Technical Guidance Document (TGD). This document also support Commission Directive 93/67/EEC on risk assessment for new notified substances and Directive 98/8/EC of the European Parliament and of the Council concerning the placing of biocidal products on the market. The risk assessment results for existing substances are published in European Union Risk Assessment Reports (EU-RAR). The derivation of environmental risk limits for environmental compartments, called ‘predicted no effect concentrations’ (PNEC), takes place within the environmental section of a RAR. These PNEC values are compared with so-called Predicted Environmental Concentrations (PECs) and, if necessary, measures to reduce emissions are also proposed. The derivation of a PNEC is comparable to that of the maximum permissible concentration (MPC), the environmental risk limit used as an advisory value within the Dutch national framework for setting environmental quality standards. The Steering Committee (INS) has indicated that it considers PNECs as being sufficiently scientifically based for deriving Dutch environmental risk limits.
Presented here are the minimum requirements for reporting, along with an overview of proposed environmental risk limits based on EU-RAR results. This report also documents the differences between the European PNECs and the Dutch MPCs, indicating how PNECs can be used to calculate environmental risk limits.
1 Introduction
In 1993 the Council of the European Communities adopted Council Regulation (EEC) 793/93 or the Existing Substances Regulation (ESR), thereby introducing a comprehensive framework for the evaluation and control of ‘existing’ chemical substances. This is a legal instrument that was proposed by the European Commission upon approval of the Fourth Community Action Program on the Environment (1987-1992) by the Council. Several other directives and regulations adopted the same methodology for evaluating the risks of chemicals:
• Commission directive 93/67/EEC on risk assessment for new notified substances, • Commission regulation (EC) no 1488/94 on risk assessment for existing substances and • Directive 98/8/EC of the European parliament and of the council concerning the placing
of biocidal products on the market.
The Commission, in consultation with member states drew up four priority lists for substances that are to be evaluated for both human and environmental risks. For priority compounds, this process will result in a European Union Risk Assessment Report (RAR). In the environmental section of a RAR, environmental risk limits are derived for environmental compartments, which are called ‘predicted no effect concentrations’ (PNECs). The PNEC for each environmental compartment is compared with the predicted environmental concentration (PEC) in the same compartment in order to estimate the risk of a certain compound. The risk is considered to be unacceptable when the PEC-PNEC ratio is higher than 1.
The Dutch environmental risk limits (ERLs) of a certain compound are used as advisory values within the Dutch national framework of setting environmental quality standards (EQS). The environmental quality standards indicate when risks of a certain compound are considered negligible, when adverse effects may appear and at which concentration functions or species will be seriously affected. The functions and relations of ERLs and EQSs are shown below (Table 1). Although the purpose of the PNECs and the ERLs is different, the methods of estimation and the values estimated are roughly comparable.
At present the Ministry of Housing, Spatial Planning and the Environment (VROM) has the policy to consider PNEC values as sufficient scientific basis for deriving ERLs. When a request for deriving ERLs for a substance is formulated, PNECs from an existing RAR for that substance will be used preferentially.
The results from the EU-RARs can not be transferred directly into the INS framework. Some basic principles of the approaches differ, which leads to values calculated in one, but not in the other approach and vice versa. Differences of a more detailed nature may hinder a direct implementation of the PNEC values estimated in the EU-Risk Assessment Reports in the Dutch INS framework.
This report documents the differences between the methodology to derive PNECs and ERLs, and how PNECs can be used to calculate ERLs. Minimum requirements how to use PNECs for national risk limits are presented, and finally, an overview is given of current ERLs derived from EU risk assessments.
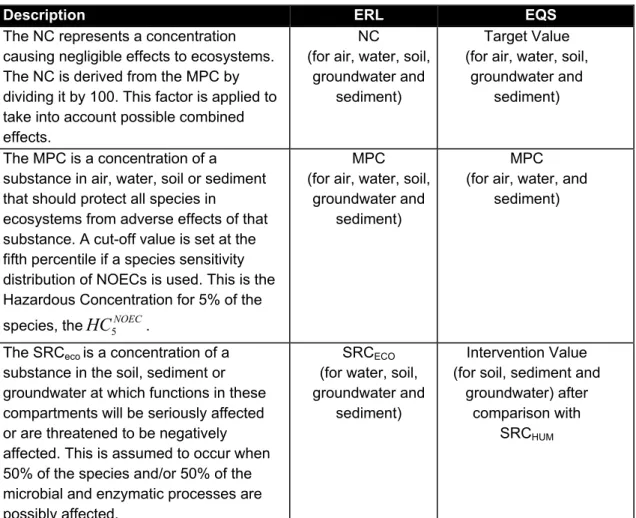
Table 1. Environmental Risk Limits (ERLs) and the related Environmental Quality Standards EQSs) that are set by the Dutch government for the protection of ecosystems (see Traas, 2001).
NC Negligible Concentration
MPC Maximum Permissible Concentration
SRCeco Serious Risk Concentration for the ecosystem
Description ERL EQS
The NC represents a concentration causing negligible effects to ecosystems. The NC is derived from the MPC by dividing it by 100. This factor is applied to take into account possible combined effects.
NC
(for air, water, soil, groundwater and
sediment)
Target Value (for air, water, soil,
groundwater and sediment)
The MPC is a concentration of a substance in air, water, soil or sediment that should protect all species in
ecosystems from adverse effects of that substance. A cut-off value is set at the fifth percentile if a species sensitivity distribution of NOECs is used. This is the Hazardous Concentration for 5% of the species, theHC5NOEC.
MPC (for air, water, soil,
groundwater and sediment)
MPC (for air, water, and
sediment)
The SRCeco is a concentration of a
substance in the soil, sediment or groundwater at which functions in these compartments will be seriously affected or are threatened to be negatively affected. This is assumed to occur when 50% of the species and/or 50% of the microbial and enzymatic processes are possibly affected.
SRCECO
(for water, soil, groundwater and
sediment)
Intervention Value (for soil, sediment and
groundwater) after comparison with
2 Background, comparison and methods proposed
EU PNECs are derived as part of a risk assessment. If appropriate, risk reduction measures may follow the risk assessment when risks have been identified. In the latter case, PNECs may play a further role when risks to the environment have been identified and, if needed, a subsequent risk reduction strategy is implemented. Environmental Risk Limits (ERLs) in the Netherlands are used in environmental policy as effects thresholds (effect oriented) and also for an emission reduction (source-oriented) strategy (Sijm et al., 2002). The main differences
between the two policy frameworks are elaborated below.
• The PNECs in the EU risk assessments do not have a formal status as environmental risk limits, but are part of a total risk assessment and subsequent risk management strategy. • It may be desirable to give PNECs from EU-RARs a clear (legal) status within
environmental regulations in the member states.
• Stricter limits than enforced by the EU only seem sensible if necessary (risk reduction) action can be taken without interference from other member states. Possible problems are emission sources, in other EU countries, which can not be reduced using national legislation, legal problems on market admission etc.
2.1 Using EU-risk assessment reports
In compliance with the current viewpoint of the ministry of VROM, the PNEC values will be regarded as equivalent to MPC values (Steering Committee INS, 2003a).
Only finalized EU-RARs will be used as a source for MPC values. To derive an MPC while the EU-RAR is not yet finalised is not preferable since new data (e.g. toxicity studies) may be added to the data set that may alter the PNEC and therefore also the outcome of the MPC derivation. When a final version of the draft EU-RAR is published and ERLs are requested by the ministry, MPCs based on the EU-RAR will be presented in a concise report.
2.2 Comparison of the EU method and the INS method
Although the methods described in the TGD (ECB, 2003) and in the INS guidance (Traas, 2001) are similar on various important points, there are also differences. Some of these differences originate from a different point of view; others depend on another definition or composition of the compartments for which the risk limits are estimated. Also differences in data selection and different extrapolation procedures may lead to different values for the MPC values derived through the INS method and the PNECs for the same compound. The differences are summarised below. A few important differences considering the whole framework are summarised in section 2.3. Methods to solve differences in approach are proposed in section 2.4.
The guidance documents reflect the practice at a certain moment. The risk assessment practice may gradually change during time until a new guidance update is released. Examples are the incorporation of the species sensitivity distribution in the TGD and averaging similar data using the geometric mean instead of the arithmetic mean. One should also keep in mind that both Traas (2001) and the TGD (ECB, 2003) are guidance documents and not recipe books. As stated in the TGD (ECB, 2003) about the assessment factors for the terrestrial environment in section 3.6.2.2: ‘In summary, the assessment factors proposed in Table ‘z’ must be regarded as indicative.’ Thus, specific cases may deviate from the guidance given in the documents.
1. Environmental quality standards derived. The TGD (ECB, 2003) presents a single type of quality standard: The PNEC for water, sewage treatment plants (STPs), soil and sediment. In the Dutch INS approach, three different types of risk limits are derived. The MPC is considered equivalent to the EU-RAR PNEC. Apart from the MPC, the NC is defined as MPC/100 and the SRCECO is defined as a trigger for soil or sediment
remediation.
2. Compartments. In the TGD 5 compartments are distinguished for the inland environment: the aquatic and the terrestrial ecosystem, sediment, STPs and the atmosphere. Top predators are considered separately. Beside these compartments, the marine ecosystem is distinguished, which is separated in a saltwater and a sediment part. In the INS method estimations are made for water, sediment, soil, air and top predators. Fresh- and saltwater toxicity data are taken together in the INS approach if not statistically significant different (Traas, 2001; sections 3.3.3.1.1 and 6.1.2). At present, applications for the atmospheric environment are limited to specific volatile compounds. 3. Freshwater versus saltwater. In the TGD saltwater and freshwater risk assessment are
treated differently. Due to the higher biodiversity of saltwater ecosystems, additional precaution is warranted. In risk assessment for salt water, more strict assessment factors are used than for freshwater. In the context of INS, fresh- and saltwater are only treated differently when statistical analysis shows a difference between species sensitivities. 4. Harmonisation. Environmental risk limits are harmonised between the compartments in
the Dutch approach. This means that intercompartmental transfer may not lead to exceeding a risk limit in one compartment due to intercompartmental exchange. This is not the case in the TGD approach. Risk limits are estimated for the compartments separately, and harmonization is not included explicitly. In general, the theory of equilibrium partitioning between compartments is used in INS. In practice risk limits for soil and sediment are often derived from results of the aquatic compartment due to lack of data.
5. Data quality and relevance. See TGD (ECB, 2003) section 3.2. Criteria for accepting or rejecting the available data can be different between EU-RARs and INS, due to different expert interpretation of available guidelines.
6. Lumping data for (soil) processes and organisms. In the TGD the importance of soil microorganisms is recognised, but they are not mentioned in the suite of soil tests that are needed in generating toxicity data (ECB, 2003 section 3.6.2.). In the section on PNEC calculation using assessment factors, microorganisms are mentioned as taxonomic group, but endpoints needed are not defined, which suggests that they are taken together with data from other taxonomic groups. Data on microbial mediated processes in soil and single species tests are mentioned explicitly in the section on SSD methods. Here these two types of tests are considered separately due to fundamental differences between the tests. The TGD does not indicate how these differences should be evaluated, but states that ‘The results should be compared and evaluated on a case by case basis in deciding on a final PNEC for the soil compartment’ (ECB, 2003; section 3.6.2.3.). In the INS procedure the data for microbial processes and species are taken separately (if available) and for each an MPC is estimated. The lowest value is taken.
7. Experimental endpoints used. In the Dutch approach population related endpoints (biomass, reproduction, lethality, growth rate) are used to estimate environmental risk limits. The TGD allows endpoints such as photosynthesis and behaviour besides endpoints directly related to populations. However, in such cases expert judgement must be used whether such data can be interpreted for use in the assessment (TGD section 3.2.1.2; interpretation of data). For sediment, sediment avoidance and burrowing activity are considered to be the most relevant endpoints besides reproduction, growth and emergence (TGD, sections 3.5.4 and 4.3.2.4.) (ECB, 2003).
8. Base set of toxicity data. For the aquatic compartment the TGD prescribes a minimum of three short-term toxicity tests: the base set. The test organisms should represent at least three trophic levels: algae, Daphnia and fish. In that case a factor of thousand is applied
to the lowest L(E)C50. Lower assessment factors can be applied if more data are present.
When the base set is not complete no ERL is derived. Exceptions: if acute toxicity can not be tested because of hydrophobicity (log Kow >3). For such substances it is recommended
to carry out a qualitative risk assessment in order to decide if long term tests are required. A long-term toxicity test is required if the PEClocal/regional is 1/100th of the water solubility
(TGD section 5.6; TGD section 3.3.1.1).
A base set is not requested for the sediment and terrestrial compartments, as standardised tests are hardly available. The TGD (ECB, 2003) states that standardised methods exist for the soil compartment, but toxicity tests with terrestrial organisms are not yet included in the base set.’
INS does not request a baseset. Traas (2001) indicates that, when the base set is incomplete and the TGD tables with assessment factors can not be applied, the modified EPA method is used.
9. Trophic levels versus taxonomic groups. The TGD requests representatives from different trophic levels and prescribes using algae, Daphnia and a fish for deriving the
PNEC for the aquatic ecosystem. For the terrestrial compartment the focus is on trophic levels as well, whereas for the sediment data from species representing different living and feeding conditions are requested (ECB, 2003).
The INS method focuses on representatives from different taxonomic groups. The description used in INS is less stringent than that in the TGD, as it does not prefer representatives of specific taxonomic groups.
10. The use of assessment factors. In the EU, the TGD assessment factors are used. In the TGD (ECB, 2003), the possibility is given to use statistical extrapolation under specific conditions (see 9). In the INS method the EU/TGD assessment factors were introduced in 1999. Before 1999, modified EPA assessment factors were used in INS. Some modifications have been applied to the original TGD schemes:
• In INS, if 4 or more NOECs from at least 4 taxonomic groups are present, statistical extrapolation is used to derive the MPC. If fewer data are available, the same assessment factors as in the TGD are used. If fewer data than the base set are available, other assessment factors are used, but never less strict than those of the TGD are. See INS Guidance for details (Traas, 2001).
• For terrestrial and sediment data in INS, a comparison with the MPC derived with equilibrium partitioning is made in all cases of preliminary risk assessment (using assessment factors).
11. Statistical extrapolation. Within the INS framework the method of Aldenberg and
Jaworska (2000) is preferred for deriving ERLs when NOECs for four or more taxonomic groups are available (Traas, 2001). The TGD proposes to use statistical extrapolation only if 10 or more (and preferably more than 15) chronic toxicity data from at least eight taxonomic groups are present (ECB, 2003). Thus, in practice most PNECs are derived using assessment factors, as will be MPCs estimated using these PNECs.
AVGaqua average of all log-transformed aquatic NOECs [-]
STDaqua standard deviation of all log-transformed aquatic NOECs [-]
ks extrapolation constant, dependent on sample size and conf. level [-]
AFstat assessment factor for statistical extrapolation, between 1 and 5 [-]
PNECstat PNEC for aquatic organisms with statistical method [mg.L-1]
Another difference between the EU and INS is the use of an additional safety factor in the EU (AFstat) to reduce the calculated PNEC by a factor between 1 and 5. More detail
can be found in the TGD.
stat STD k -AVG stat AF = PNEC aqua s aqua ⋅ 10
12. Averaging similar data. If more than one data are available for one species and the same toxicological endpoint, the data can be averaged. When more than one L(E)C50 or NOEC
is present and when the differences can not be attributed to differences in test conditions the both EU/TGD and the INS method request for the geometric mean (Traas, 2001 section 6.2.1; Beek and Oudendijk, 2001).
Within the European Commission (Water Framework Directive) there is still some debate on application of the geometric mean on long term NOECs from one species with the same endpoint. The calculation of a mean value when several (long term) NOECs for one species and one endpoint are present is not clearly described in the TGD when assessment factors are used in the estimation of the PNEC (ECB, 2003, section 3.3.1.1). However, not applying this technique would be inconsistent with the procedure followed for both short term tests applied in calculation of PNEC using assessment factors (section 3.3.1.1) and NOECs and L(E)C50s used for calculation of PNEC using statistical extrapolation
techniques (section 3.3.1.2.). In these cases a geometric mean is calculated. It is expected that the geometric mean will be applied to the first category as well in the future.
13. Intermittent release. Intermittent release is not relevant for derivation of MPCs, which reflect long term effects. Therefore, this item is not included in the Dutch INS approach (Traas, 2001 section 6.2.1). Intermittent release is included in the EU/TGD (section 3.3.2) to take into account short term effects of such releases. In such cases a PNECwater, intermittent
is estimated from short-term L(E)C50 data.
14. Use of field data. Field data or model ecosystems can be included in the derivation of the PNECwater. The TGD indicates that there are no internationally accepted guidelines for
field studies. However, criteria for field data are given in Appendix III. The assessment factor to be applied on field data should be reviewed on a case by case basis (ECB, 2003, section 3.3.1.1; table 16). Field data can be used in INS as well, such as bioconcentration factors (BCFs) determined from field data. At present, the guidelines do not indicate whether field data, or data from toxicity tests should be preferred in estimating the ERLs.
15. Secondary poisoning. When a chemical fulfils several criteria, e.g. indication of a bioaccumulation potential, secondary poisoning has to be addressed (ECB, 2003). These criteria are that the substance:
• has a log Kow ≥ 3,
• is highly (ab)sorptive, or,
• belongs to a class of substances known to have a potential to accumulate in living organisms, or,
• there are indications from structural features,
• and there is no mitigating property such as hydrolysis (half life less than 12 hours) (see ECB (2003), section 3.8),
• when substances have a log Kow >5, an additional safety factor may be used for
theory, an additional factor of 10 is used in the EU to protect benthic organisms against risks due to sediment ingestion. In INS, this aspect should be covered by additional bioaccumulation studies.
In the Dutch INS method, the same criteria are adopted. In the EU, risks for fish-eating or worm-eating birds and mammals are calculated, based on predicted environmental concentrations. In INS, the calculations are inverted to calculate environmental risk limits that do not lead to toxicity for birds and mammals.
16. Composition standard water. The composition of standard water differs between the TGD and the INS approach. For the Dutch standard water a distinction is made between ‘dissolved’ and ‘total’, for which a standard amount of 30 mg.L-1 dw suspended matter is assumed, consisting of 11,8% organic carbon and 40% clay. For the recalculation of organic matter to organic carbon content a factor of 1.7 is used (Traas, 2001).
The EU ‘standard water’ consists of 15 mg/l suspended matter with an organic carbon content of 10% (Table 5 TGD part II, 2003). No standard is reported for clay content. Both the EU-RARs and INS report the PNEC and the MPCwater as dissolved. The ‘total’
concentrations may be mentioned as well (TGD, 2003, see section 2.3.8.1), but are always calculated when INS ERLs are derived from the PNEC.
17. Composition standard soil and standard sediment. The PNECsoil and the PNECsediment,
as reported in EU RAR reports, are based on a different organic carbon content in the soil or sediment than the ERLs in the Netherlands. The organic carbon content of standard soil in the EU is 2%, whereas in INS it is 5.9%. The organic carbon content of sediment in the EU is 5%, which is almost equal to the INS standard of 5.9%. Recalculation to the Dutch INS standard can be done for organic compounds where sorption is predominantly based on organic carbon content. For metals, a recalculation to Dutch standard soil is only possible if the same standards are used (Dutch reference lines are mentioned in an annex to the TGD).
18. Wet weight or dry weight soil/sediment. In EU-RARs, ERLs for soil and sediment are often estimated for fresh (wet) weight. In the INS reports published soil and sediment concentrations are based on dry weight. Recalculation of soil or sediment wet weight to dry weight is possible using the percentages and density of solids, water and air given in the TGD (ECB, 2003) section 2.3.4.
19. Kp sediment. If no toxicity data are present for sediment, the EU-PNEC is estimated
from the PNEC for water using the Kp for suspended matter and the bulk density for
suspended matter (1150 kg.m-3). A trigger value of log Kow or log Koc of ≥ 3 is
recommended as trigger value for sediment effect assessment in the TGD to avoid extensive testing (ECB, 2003; section 3.5.2). The PNEC is based on properties of recently deposited sediment, i.e. recent sedimentation of suspended matter. Monitoring is also
based on suspended matter concentrations. In the INS approach, the MPC for sediment is based on partitioning to sediment, normalised on carbon and/or clay content.
20. The added risk approach. The added risk approach is well described in Traas (2001) section 6.4. The procedure is developed to take natural background levels of metals or organic substances into account. The implication for risk assessment is, that natural background levels have a negligible influence on the toxicity of the total (background + added amount) toxicity. Therefore, the ERL is composed of two parts: MPC = Background + maximum permissible addition. The added risk approach is also introduced in the TGD.
2.3 Main differences summarised
Most differences between the INS method and the method described in the TGD (2003) are of minor importance. They lead only to small differences or can be solved quite easily by recalculation of PNEC values. Chapter 2.4 gives guidance on how to deal with PNEC values from EU-RARs technically.
In this chapter some of the main differences between both methods are summarised. These differences can not be solved technically. The Steering Committee INS (2003b) decided to estimate Dutch environmental quality standards according to the TGD and also made some decisions on how to handle these differences.
2.3.1 Negligible concentration (NC) and Serious Risk Concentration
(SRC
ECO)
The negligible concentration (NC) represents a value causing negligible effects to ecosystems. The NC is derived from the MPC by dividing it by 100. This assessment factor takes into account combination toxicity (VROM, 1989a,b). There is no equivalent to the NC in the EU-RAR.
The SRCECO is not included in the EU-RAR procedure since there is no EU equivalent. In
INS, SRCECO values are based on the geometric mean of all approved chronic data if at least
four chronic data from at least four taxonomic groups are available. If fewer data are available, a comparison is made between acute and chronic data. The geometric mean of acute (LC50) data divided by 10 is compared to the geometric mean of all chronic data. The
lowest value determines the SRCECO. Derivation of the SRCECO will have to be judged on a
case by case basis for each RAR. In the estimation of the SRCECO for PCOC (see Table 6) a
re-evaluation of the individual data was carried out.
The Steering Committee INS (2003b) decided in 2003 to maintain both the NC and the SRCECO by using the data provided in the EU-RAR. In the case of the SRCECO this may lead
to an underestimation. It is not clear if the EU-RARs always provide all data available. If not, it will probably focus on the lowest values.
2.3.2 Compartments
At present, MPCs are estimated for water, soil and sediment within the INS framework, if possible. The values for the various compartments are harmonised. In EU-RARs a PNEC for water is often provided. However, PNECs for soil and sediment may be lacking, due to a lack of data or because generating these PNECs is not relevant (e.g. log Kow < 3). In such cases, it
should be decided if additional data will be gathered in order to generate values for these compartments within the INS framework.
It is recommended to follow the estimations carried out in the EU-RAR. If there is a need for quality standards for compartments for which PNECs are lacking, they may be estimated by equilibrium partitioning method or by gathering new data.
2.3.3 Intercompartmental harmonisation
Compounds are initially emitted into one or more compartments. Harmonisation of ERLs is undertaken within the INS framework because substances in the environment distribute over the different environmental compartments due to intercompartmental exchange processes. This harmonisation is carried out generically, comprising four compartments: soil, sediment, water and air. These compartments are not linked to a specific geographical region. Explanation of this procedure is given in Traas (2001), chapter 6.6.
In the EU-RARs, PNECs are estimated for the different compartments independently and these are not harmonised. This difference regarding intercompartmental harmonisation may lead to different values for a specific compartment between INS and the EU-RAR. The Steering Committee INS (2003b) decided in 2003 not to harmonise among the compartments any more.
2.3.4 Application of extrapolation factors
Within the TGD (ECB, 2003) data for 10 different species from eight taxonomic groups should be available before the statistical method (SSD) can be applied. As for most compounds less data are present, extrapolation factors are often applied. In practice this may lead to lower values than the ones estimated within the INS approach where the statistical method is already applied, where at least chronic data for four different taxonomic groups are required. The Steering Committee INS (2003b) decided to estimate Dutch environmental quality standards according to the TGD. In order to get some insight in the sensitivity of the quality standards for extra data the Steering Committee INS (2003b) recommended to incorporate statements in the Dutch report concerning this sensitivity, e.g. by applying an SSD on less than eight taxonomic groups.
2.4 Methods proposed for deriving MPCs and NCs from
PNECs
Data collection and screening within the INS framework is described extensively in chapter 3 of Traas (2001). For the compounds for which a European PNECs has been derived, collection and screening of the literature on toxicity and physico-chemical data, have taken place as part of the PNEC derivation in the EU-RAR. Therefore, no additional data search will be performed for the derivation of MPCs based on finalised EU-RARs.
In the previous sections, differences between the EU method as described in the TGD (ECB, 2003) and the INS method (Traas, 2001) have been summarised. Here methods will be presented to recalculate the values presented in EU-RARs to Dutch values taking into account characteristics of Dutch standard water, soil and sediment, and enabling a presentation on a dry weight basis.
The methods comprise:
• Recalculation of PNECwater-dissolved to PNECwater total,
• Recalculation of PNECsoil and PNECsediment from PNECwater dissolved using Kp,
• Recalculation of PNECsoil and PNECsediment based on wet weight to values in dry weight,
• Recalculation of PNECsoil using different organic carbon content for Dutch standard soil
and EU standard soil.
2.4.1 Estimation of the K
pand K
compartment-waterFor most compounds presented in EU-RARs, enough aquatic ecotoxicity data are present to derive a PNECwater, but data for sediment are scarce. In such cases PNECsediment may be
estimated from the PNECwater by means of the equilibrium partition method. For PNECsoil a
similar approach is often followed.
For the estimation of the Predicted No Effect Concentration in a compartment (PNECcomp)
through the equilibrium partition method, the parameter Kcomp-water is used. This Kcomp-water can
be estimated from the solid water partition coefficient, Kp, of the compartment. The Kps of
the various compartments can be calculated with the formula:
Kp=Foc*Koc (formula 23 in TGD part II),
in which:
Kp = the solid water partition coefficient [L.kg-1]
Foc = the fraction organic carbon [kg.kg-1], and
Koc = the partition coefficient organic carbon – water [L.kg-1].
The fraction organic carbon (Foc’s) of the various compartments are presented in Table 2, as
equivalent to the values presented in Table 5 of part II of the TGD (2003). An example of the estimation of the Kp is given in Table 3 for short chained chlorinated paraffins (see also Rila,
2002).
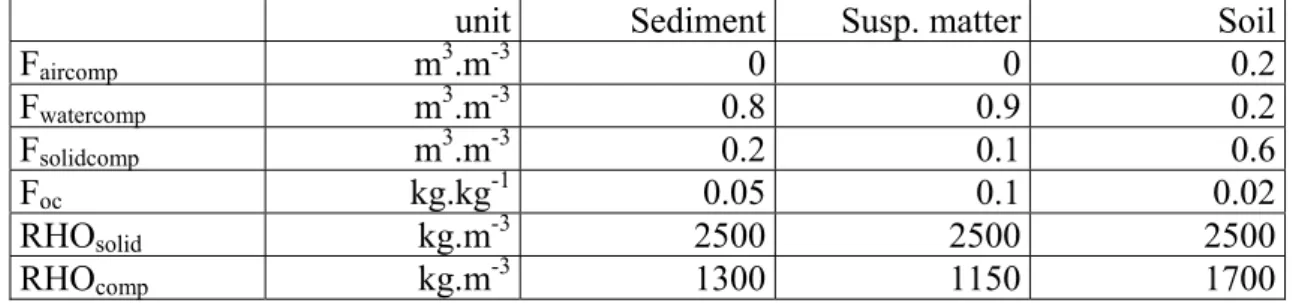
Table 2. Key parameters to be used in the estimation of a PNECcompartment through equilibrium partioning (EU-method)
unit Sediment Susp. matter Soil
Faircomp m3.m-3 0 0 0.2 Fwatercomp m3.m-3 0.8 0.9 0.2 Fsolidcomp m3.m-3 0.2 0.1 0.6 Foc kg.kg-1 0.05 0.1 0.02 RHOsolid kg.m-3 2500 2500 2500 RHOcomp kg.m-3 1300 1150 1700
Fcomp = fraction of air/water/solid phase in the compartment
Foc = weight fraction of organic carbon
RHOcomp = bulk density of the compartment
The Kcomp-water, which is used for the estimation of the PNECcompartment, and can be estimated
by:
Kcomp-water = Faircomp* Kair-water + Fwatercomp + Fsolidcomp*((Kpcomp)/1000)*RHOsolid,
which can be replaced by:
Kcomp-water = Faircomp* Kair-water + Fwatercomp + Fsolidcomp*((Koc*Foc)/1000)*RHOsolid
where:
Faircomp = the volume fraction air in the compartment [mair3.mcomp-3],
Kair-water = the air water partitioning coefficient [-],
Fwatercomp = the volume fraction water in the compartment [mwater3.mcomp-3],
Fsolidcomp = the volume fraction solids in the compartment [msolid3.mcomp-3],
Koc = the partition coefficient organic carbon – water [L.kg-1],
Foc = the fraction organic carbon [kg.kg-1] and
RHOsolid = the density of the solid phase [kgsolid.msolid-3].
A number of key parameters to be used in these formula are given in Table 5 of the TGD (2003) part II and are summarised in Table 2. Faircomp only plays a role in soil, not in sediment
or suspended matter, however its effect in terms of weight is only small.
Using these Kcomp-water values the PNECcompartment can easily be estimated using the generic
formula:
PNECcomp =(Kcomp-water/RHOcomp) *PNECwater(dissolved) *1000
in which:
PNECcomp = predicted no effect concentration for the compartment [µg.L-1or
Kcomp-water = compartment to water partition coefficient: [m3.m-3]
RHOcomp = the density of the compartment [kgcomp.mcomp-3].
PNECwater(dissolved) = predicted no effect concentration for the water compartment [µg.L-1]
In this formula ‘comp’ can be replaced by sediment, suspended matter, or soil. The formula is equivalent to formula 70 and 72 in TGD part II (ECB, 2003).
Table 3. Kp and Kcomp-water for short chained chlorinated paraffins using a Koc of 91201[L.kg-1]
parameter unit sediment suspended matter soil
Foc kg.kg-1 0.05 0.1 0.02
Kp sccp’s L.kg-1 4560 9120 4560
Fsolidcomp m3.m-3 0.2 0.1 0.6
Kcomp-water m3.m-3 2281 2281 2736
2.4.2 PNEC
waterThe EU-RARs generally report a PNECwater,dissolved, excluding suspended matter. The Dutch
MPCwater,dissolved is equivalent to this value.
The Dutch MPC for dissolved organic compounds in water can be recalculated to the total water phase, based on differences in the content of organic matter. The following equation is used to calculate the MPCwater,total :
MPC
water,total= MPC
water,dissolved(1 + K
ppm* 0.001 * 0.03)
With 0.001 = conversion constant [g.kg-1]
0.03 = content of suspended matter [g.L-1] (considered the Dutch standard) Kppm = partition coefficient suspended matter/water,
Kppm is calculated from the Kp for sediment/water or from the Koc. Suspended matter is
standardised at an organic matter content of 20% (or organic carbon content of 11.76 %), twice as high as standardised soil or sediment. This means that the Kppm is twice as high as
the Kp for sediment/water. If the Kp sediment/water is estimated from the Koc, the following
equation applies for suspended matter as well:
Kppm = Foc * Koc
in which:
Kppm = partition coefficient for standard suspended matter [L.kg-1]
Foc = fraction organic carbon [0.1172 g OC.g-1 suspended matter dw]
Only studies in which the humic matter content or organic carbon content is reported are accepted. Organic carbon content [g OC.g-1 dw] can be derived from the organic matter content [g OM/ g dw] by dividing the organic matter content by 1.7 [g OM.g-1 OC].1
Foc = Fom/1.7
See further Traas (2001), section 3.3.2.
The partition coefficient between organic carbon in the soil/sediment and water (Koc) is used
to derive an MPC for soil/sediment when no data on terrestrial or sediment-dwelling organisms are available. By applying equilibrium partitioning, the Koc is used to harmonise
the MPCs between the different compartments. See also Traas (2001), section 6.5. When a Koc is used, preference will be given to the Koc values reported in the EU-RAR.
2.4.3 PNEC
soilWhen no terrestrial toxicity data are available the PNECsoil is calculated using equilibrium
partitioning theory. Within the EU framework the following equation is used:
soil water water soil soil 1000 RHO PNEC K PNEC = − ⋅ ⋅ in which:
PNECsoil predicted no effect concentration for the soil compartment [µg.kg-1 wet weight]
Ksoil-water soil to water partition coefficient: [m3.m-3]
PNECwater predicted no effect concentration for the water compartment [µg.L-1]
1000 conversion factor from liters to m3 [L.m-3]
RHOsoil bulk density of wet soil: 1700 [kg.m-3 wet weight]
The PNECs presented in EU-RARs are often expressed in wet weight. These values can be recalculated to dry weight using the fractions and densities presented in Tables 2 and 4. According to the TGD ‘wet’ standard EU soil contains 60% solids v/v (density 2500 kg.m-3), 20% water v/v (density 1000 kg.m-3) and 20% air by volume, i.e. 88% solids by weight. This results in a multiplication factor of 1.13 to achieve the PNECsoil on a dry weight basis.
Dutch standard soil and standard sediment contain 10% organic matter (OM) and 25% lutum (Traas, 2001). Accordingly, the organic carbon content is 5.9%. The European standard soil is defined in the TGD (ECB, 2003) and contains 2% organic carbon (ECB, 2003, Table 5). Therefore, a different amount of substance bound to soil can be expected. Normalisation of
1Recently a factor of 2 was proposed (Smedes, 1999). However this change has not yet been
the PNECs for standard EU soil (Foc = 0.02) to standard NL soil (Foc = 0.059) can be achieved
by multiplying the result by a factor of 2.9 (= 0.059/0.02). An example is given in chapter 4 (see also Janus and Posthumus, 2002, section 2.2).
The Dutch MPCsoil can be calculated from an EU PNECsoil by:
MPCsoil [mg.kg-1 dw] = PNECsoil * 1.13 * 2.9 [mg.kg-1 ww]
2.4.4 PNEC
sedimentAnalogous to the PNECsoil, the PNECsediment is calculated using equilibrium partitioning
theory, when no terrestrial toxicity data are available. Within the EU framework the following equation is used:
susp water water susp sediment 1000 RHO PNEC K PNEC = − ⋅ ⋅ in which:
PNECsediment predicted no effect concentration for the sediment compartment [µg.kg-1wet
weight]
Ksusp-water suspended matter to water partition coefficient: [m3.m-3]
PNECwater predicted no effect concentration for the water compartment [µg.L-1]
1000 conversion factor from liters to m3 [L.m-3]
RHOsusp bulk density of suspended matter: 1150 [kg.m-3 wet weight]
Results in the EU-RAR documents for sediment are given on a wet weight basis. According to the TGD ‘wet’ sediment consists of 90% v/v water (density 1 kg.L-1) and 10% v/v solid
particles (density 2.5 kg.L-1), which results in a ‘wet’ density of (0.9 × 1) + (0.1 × 2.5) = 1.15 kg.L-1. The dry weight is consequently 0.25 kg (per liter wet sediment) and the ratio wet:dry is 1.15/0.25 = 4.6. Therefore, EU-RAR sediment PNECs can be recalculated to dry sediment: PNECsediment dry = PNECsediment wet * 4.6. A summary of the conversion factors for soils and
sediments is given in Table 4.
The factor of 4.6 is also mentioned in Lijzen and Rikken (2003) who made a comparison of EUSES 2.0 and EUSES 1.0. They indicated that calculating the PNECsed on the basis of the
equilibrium partitioning theory is changed: Ksusp-water and RHOsusp is used instead of Ksed-water
and RHOsed. Because of this change also the conversion factor for suspended matter
concentrations (PNECsediment) from wetwt to drywt should be changed based on suspended matter (instead of sediment): CONVsusp=(RHOsusp)/(Fsolidsusp·RHOsolid)= 4.6. The TGD does
not mention this modification explicitly. This change has been approved by the EUSES 2.0 Working Group (Lijzen and Rikken, 2003)
The European standard sediment and the Dutch standard sediment, as well as the suspended matter, differ slightly in the fraction organic carbon. To correct for this difference a factor of
1.18 should be applied to the EU standards. The conversion for the difference in organic carbon concentration of the various compartments is summarised in Table 5.
The formula for recalculating PNECsediment to MPCsediment is:
MPCsediment [mg.kg-1 dw] = PNECsediment * 4.6 * 1.18 [mg.kg-1 ww]
2.4.5 Multiplication factors summarised
The ratios for the conversion from wet to dry are summarised in Table 4. The multiplication factors for soil, suspended matter, and sediment based on the characteristics in the Tables 2 and 4 are 1.1, 4.6 and 2.6, respectively. However, as the TGD assumes recently settled sediment as being most relevant for risk assessment, the factor estimated for suspended matter should be applied to sediment as well.
PNECcomp,dry = PNECcomp,wet * multiplication factor compartment (see Table 4).
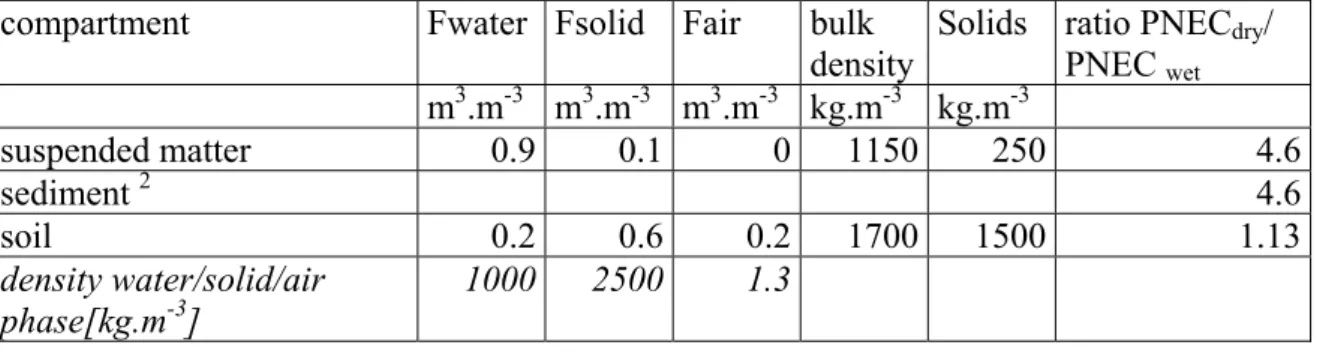
Table 4. Multiplication factors for recalculating wet weight to dry weight concentrations for the various compartments.
compartment Fwater Fsolid Fair bulk
density
Solids ratio PNECdry/
PNEC wet m3.m-3 m3.m-3 m3.m-3 kg.m-3 kg.m-3 suspended matter 0.9 0.1 0 1150 250 4.6 sediment 2 4.6 soil 0.2 0.6 0.2 1700 1500 1.13 density water/solid/air phase[kg.m-3] 1000 2500 1.3
2according to the specifications for sediment the dry/wet ratio for sediment would be 2.6. As the
PNECsediment is estimated using suspended matter parameters, conversion from wet to dry will be
based on suspended matter parameters as well (see text). Thus a factor of 4.6 should be applied to the PNECsediment.
IMPORTANT NOTICE:
In the previous TGD Ksed-water and RHOsed were used instead of Ksusp-water and RHOsusp.
Therefore, the estimation in old EU-RARs is still based on sediment parameters (e.g. in the case of acetonitrile, benzene C10-13 alkyl derivates, cumene, SCCPs, nonylphenol, and MBTE). As the Ksed-water and the Ksusp-water are similar (see Table 3), and the RHOsusp 10%
lower than the RHOsed, the PNECsediment based on the current TGD (ECB, 2003) will be
slightly higher than the one estimated using the previous TGD. It should be noted that results in the EU-RAR documents for sediment are given on a wet weight basis.
For compounds for which a PNECsediment is estimated using the previous TGD, it is
recommended to use sediment characteristics instead of suspended matter characteristics for converting the PNECsediment ww to PNECsediment dw. In these cases a factor of 2.6
The ratios for the conversion from EU standard soil to Dutch standard soil considering the differences in organic matter are summarised in Table 5.
Table 5. Multiplication factors for recalculating of EU sediment/soil to Dutch standard sediment/soil considering the differences in organic carbon content (Foc). Organic matter content (Fom) and clay content are provided in addition.
compartment EU EU NL NL NL Ratio NL oc/ EU oc
Foc Fom Foc Fom clay EU → NL
sediment 0.05 - 0.059 0.1 0.25 1.18
soil 0.02 0.034 0.059 0.1 0.25 2.9
suspended matter 0.1 - 0.118 0.2 0.4 1.18
EU data from ECB (2003) part II, Table5, Dutch data from Traas (2001) section 4.4.2 and 4.4.3 and annex 10
Using suspended matter parameters in estimating the PNECsediment
In the previous TGD the PNECsediment was estimated using the parameters of sediment,
whereas in the present TGD (ECB, 2003) the parameters of suspended matter are used in estimating the PNECsediment. This has resulted in discussions about the validity to use
suspended matter parameters (e.g. Crane, 2003) and resulted in confusion among the people applying the TGD. As the Kp differs by a factor of 2, how much difference in PNECvalues
can be expected?
For estimation of the PNECsediment the Ksusp-water is being used (see section 2.4.4). As shown in
Table 3 this value is similar to the Ksediment-water. These two parameters are similar, because the
effect of a difference in Kp is counteracted by a difference in Fsolidcomp (see the formula for
Kcomp-water in section 2.4.1 and Table 3).
As the Ksed-water and the Ksusp-water are similar (see Table 3), and the RHOsusp is 10% lower than
the RHOsed, the PNECsediment based on the current TGD (ECB, 2003) will be slightly higher
than the one estimated using the previous TGD (see section 2.4.4).
For estimation of the PNECsediment in dry weight using the suspended matter parameters
instead of sediment parameters leads to a difference of a factor of about two, because the fraction solids in sediment is twice as high. Therefore, PNECsediment based on the present
TGD (ECB, 2003) will be a factor of two less stringent than the PNECsediment based on the
3 Reporting ERLs for EU-RAR compounds
Generally, ERLs derived for the Ministry of Housing, Spatial Planning and the Environment (VROM) follow the procedure as described in Traas (2001). These ERLs are reported in extensive reports focussing on data collection and evaluation, the chemical characteristics of the compounds, the ecotoxicology data used for deriving the ERls and the expected effects. ERLs derived according to the protocol presented in this report will be presented to the Ministry of VROM in brief reports without details on data collection, evaluation and integration. These details have already been mentioned in the EU-RARs of the substances considered.
Standard items that will be reported in each ERL derivation based on an EU-RAR evaluation are:
• a short overview of the methods used (see e.g. Rila, 2002),
• a short summary of the physico-chemical properties of the compound as described in the RAR,
• the acute or chronic data set used for final evaluation and derivation of PNEC in the RAR,
• the PNEC value derived in the RAR and the MPC based on the PNEC,
• other risk limits derived from data in the RAR such as NC and, if possible, the SRCECO,
• if the SRCECO is derived, possible additional datasets (i.e., acute toxicity data) as reported
in the RAR are listed,
• a recalculation of risk limits to other compartments (e.g. soil or sediment) based on equilibrium partitioning.
In many cases additional information about the EU-priority substance is available. In some cases, it may be useful to provide background information on a substance. The goal of this is to make users of the ERLs aware of possible problems or pitfalls associated with the specific substance.
4 Summary of MPCs for EU-RAR compounds
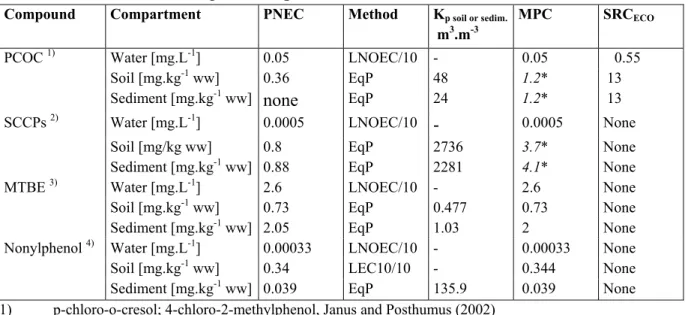
For a limited number of EU-RAR compounds Dutch MPCs have already been derived. Table 6 gives a summary of these data.
Table 6. PNEC given in the EU-RARs, methods used for estimation of these ERLs, Kp values, MPCs and SRCECOs for different compounds in NL standard water, soil and sediment as estimated in various RIVM reports using the PNECs
Compound Compartment PNEC Method Kp soil or sedim.
m3.m-3
MPC SRCECO
PCOC 1) Water [mg.L-1] 0.05 LNOEC/10 - 0.05 0.55
Soil [mg.kg-1 ww] 0.36 EqP 48 1.2* 13
Sediment [mg.kg-1 ww]
none EqP 24 1.2* 13
SCCPs 2) Water [mg.L-1] 0.0005 LNOEC/10
- 0.0005 None
Soil [mg/kg ww] 0.8 EqP 2736 3.7* None
Sediment [mg.kg-1 ww] 0.88 EqP 2281 4.1* None
MTBE 3) Water [mg.L-1] 2.6 LNOEC/10 - 2.6 None
Soil [mg.kg-1 ww] 0.73 EqP 0.477 0.73 None
Sediment [mg.kg-1 ww] 2.05 EqP 1.03 2 None
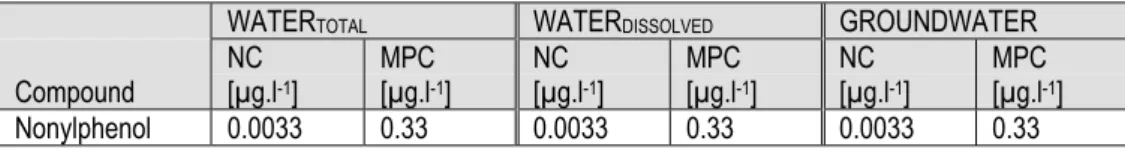
Nonylphenol 4) Water [mg.L-1] 0.00033 LNOEC/10 - 0.00033 None
Soil [mg.kg-1 ww] 0.34 LEC10/10 - 0.344 None
Sediment [mg.kg-1 ww] 0.039 EqP 135.9 0.039 None
1) p-chloro-o-cresol; 4-chloro-2-methylphenol, Janus and Posthumus (2002) 2) Short chained chlorinated paraffins, Rila (2002)
3) Methyl-tert butyl ether, Ciarelli et al. (2004) 4) Van Vlaardingen, Posthumus and Traas (2003)
5) LNOEC = lowest NOEC
6) LEC10 = lowest EC10
7) EqP = Equilibrium Partitioning method * reported on dry weight basis
In the EU-RAR on PCOC (ECB, 2002), terrestrial toxicity data is not included and thus only the EqP method was used, resulting in a PNECsoil of 0.36 mg.kg-1wet standard EU soil. This
PNEC is equivalent to 0.41 mg.kg-1 dry soil. Normalisation of this PNEC for standard EU soil (Foc = 0.02) to standard NL soil (Foc = 0.059) results in an MPC of 1.2 mg.kg-1dry soil,
References
Aldenberg, T and Jaworska, J (2000). Uncertainty of the hazardous concentration and fraction affected for normal species sensitivity distributions. Ecotox. Environ. Saf. 25: 48-63.
Beek, MA and Oudendijk, M. (2001). Milieukwaliteitsnormen (MTR) voor prioriteitsstoffen volgens de EU-methodiek zoals voorgesteld in de Kaderrichtlijn Water. RIZA Werkdocument 2000.099X.
Ciarelli, S, Posthumus, R, Vos, JH, Fleuren RHLJ and Traas, TP (2004). Environmental Risk Limits for several volatile compounds for water, soil and sediment. 1. Ecotoxicological evalutation. Report 601501016, RIVM Bilthoven, The Netherlands.
Crane, M (2003). Proposed development of sediment quality guidelines under the European water framework Directive: A critique. Toxicol. Letters 142: 195-206.
ECB (1999). European Union Risk Assessment Report: Alkanes, C10-13, Chloro-, CAS-No. 85535-84-8, EINECS-No. 287-476-5, Risk Assessment. 1st Priority List, Volume 4. ECB (2002). Risk-Assessment Report Vol.11, 2002 for: 4-chloro-o-cresol (pcoc), CAS-No.
1570-64-5, EINECS-No. 216-381-3. Publication: EUR 19757 EN. Danish Environmental Protection Agency.
ECB (2003). Technical Guidance Documents in support of the Commission Directive 93/67/EEC on Risk Assessment for New Notified Substances and the Commission Regulation (ec) 1488/94 on Risk Assessment for Existing Substances. Ispra, Italy.
Janus, JA, and Posthumus, R (2002). Environmental Risk Limits for 2-propanol, formaldehyde and 4-chloromethylphenols- updated proposals. Report 601501015, RIVM Bilthoven, The Netherlands.
Kalf, DF, Van den Hoop, MAGT, Rila, JP and Posthuma, C (2003). Environmental Risk Limits for Ethylene Diamine Tetra Acetic acid (EDTA) CAS No. 64-02-8, EINECS No. 200-573-9. Report 601501010, RIVM Bilthoven, The Netherlands.
Lijzen, J and Rikken, M (eds). (2003) Comparison of EUSES 2.0 with EUSES 1.0. EUSES 2.0 specifications approved by the EUSES 2.0 Working Group. RIVM/CSR-report 08982A00
Rila (2002). Afleiding van PNEC’s voor de kort-ketenige chloorparaffines (m = 10-13) voor de Nederlandse situatie. CAS No. 85535-84-4, EINECS No. 287-476-5. RIVM Briefrapport, december 2002.
Smedes, F (1999). Van organisch stof naar elementair koolstof. RIKZ/IT werkdocument nr. 99.633x, RIKZ, Den Haag.
Sijm, DTHM, Van Wezel, AP, and Crommentuijn, T (2002). Environmental risk limits in the Netherlands. In: Species Sensitivity Distributions in ecotoxicology. (Eds: Posthuma, L, Suter, GW and Traas, TP). Lewis Publishers, Boca Raton, FL, USA.
Steering Committee INS (2003a) Minutes Steering Committee INS 20-05-2003. Steering Committee INS (2003b) Minutes Steering Committee INS 06-11-2003.
Traas, TP (ed.) (2001). Guidance document on deriving environmental risk limits. Report 601501012, RIVM Bilthoven, The Netherlands.
Van Vlaardingen, PLA, Posthumus R and Traas TP (2003). Environmental Risk Limits for alkylphenols and alkylphenol ethoxylates. Report 601501019, RIVM Bilthoven, The Netherlands
VROM (1989a). Ministry of Housing, Spatial Planning and Environmental Protection. National Environmental Policy Plan. To choose or lose. Second Chamber, session 1988-1989, 21137, no. 1-2.
VROM (1989b). Ministry of Housing, Spatial Planning and Environmental Protection. Premises for risk management. Risk limits in the context of environmental policy. Second Chamber, session 1988-1989, 21137, no 5.
Appendix 1: Mailing list
1. Ing. M. Adams (DGM-SAS) 2. plv. DG Milieubeheer
3. Hoofd afdeling stoffen, DGM-SAS 4-11 Stuurgroep INS
12-36. OZBG-eco
37. prof. dr. R. Laane (RIKZ) 38. dr. G.J. Zwolsman (RIZA) 39. ing. G. Broseliske (RIZA) 40. drs. G. Niebeek (RIZA) 41. ing. G. B.J. Rijs (RIZA) 42. ing. D.F. Kalf (RIZA)
43. Depot Nederlandse Publicaties en Nederlandse Bibliografie 44. Directie RIVM
45. Sectordirecteur Stoffen en Risico’s 46. Hoofd Stoffen Expertise Centrum
47. Hoofd Laboratorium voor Ecotoxicologische Risico’s 48. dr. D. van de Meent (RIVM/LER)
49. drs. T. Aldenberg (RIVM/LER) 50. drs. J.A. Janus (RIVM/SEC) 51. drs. R. Luttik (RIVM/SEC) 52. ir. R.J. Luit (RIVM/SEC)
53. drs. M.H.M.M. Montforts (RIVM/SEC) 54. R. Posthumus (RIVM/SEC)
55. drs. M.G.J. Rikken (RIVM/SEC) 56. dr. D. Sijm (RIVM/SEC) 57. dr. W. Slooff (RIVM/SEC) 58. dr. E.J. Verbruggen (RIVM/SEC) 59. drs. T. Vermeire (RIVM/SEC) 60. dr. M.P.M. Janssen (RIVM/SEC) 61. drs. T.P. Traas (RIVM/SEC) 62. drs. J.P. Rila (RIVM/SEC)
63. ing. P. van Vlaardingen (RIVM/SEC) 64. SBC/afd. Communicatie
65. Bureau Rapportenregistratie 66. Bibliotheek RIVM
67-71. Bureau Rapportenbeheer 72-90 Reserve-exemplaren
Appendix 2: An example: Derivation of ERLs for
nonylphenol
A2 Nonylphenol
The general name nonylphenol designates a group of isomeric compounds that may vary in the position of the nonyl chain on the phenol ring and the degree of branching of the nonyl group. The isomer that is predominantly produced commercially is 4-nonylphenol, in which the degree of branching varies and is usually undefined. Nonylphenol is defined as straight chain (unbranched) nonylphenol only by Chemical Abstract Service (CAS). However, straight chain nonylphenol is produced only in minor quantities in commercial mixtures. For this reason nonylphenol as used in the EU-RAR covers all isomers that are not nonylphenol. Hence, the EU-RAR addresses the potential risks of all nonylphenols, with 4-nonylphenol named explicitly, and with 4-nonylphenol used as general name for all other isomers.
A2.1 Introduction
In 1993 the Council of the European Communities adopted Council Regulation (EEC) 793/93 or the Existing Substances Regulation (ESR), thereby introducing a comprehensive framework for the evaluation and control of ‘existing’ chemical substances. This is a legal instrument that was proposed by European Commission upon approval of the Fourth Community Action Programme on the Environment (1987-1992) by the Council.
The Commission, in consultation with member states draws up priority lists for substances that are to be evaluated for both human and environmental risks. For a given prioritized compound, this process will result in a European Union Risk Assessment Report (RAR) at step 3 of the regulation. In the environmental section of a RAR, environmental risk limits are derived for each environmental compartment, which are called 'predicted no effect concentrations' (PNEC). A PNEC is comparable to the maximum permissible concentration (MPC), which is the environmental risk limit (ERL) used as an advisory value within the Dutch national framework of setting environmental quality standards (EQS). At present the Ministry of Housing, Spatial Planning and the Environment (VROM) has the policy to take over PNEC values from a RAR for an existing substance when these PNECs have already been or are being derived at the time the Ministry seeks advice (that is, requests for an MPC to be derived) for that substance.
At present, a preliminary draft version of an EU RAR for p-tert –butylphenol, a finalized draft version of a targeted (environmental) EU RAR for 4-tert-octylphenol (Environment Agency of England and Wales, 2002) and a final EU RAR for 4-nonylphenol (branched) and nonylphenol exist (ECB, 2002). In compliance with the present viewpoint of the ministry of
VROM, the PNEC values of nonylphenol will be taken over as MPC values. The RARs for butylphenol and octylphenol are draft versions from which no data may be used for publication until the final report is issued. For that reason we will not present data of those compounds in the present report. To derive an MPC while a PNEC is underway is not preferable either since new data (e.g. toxicity studies) may be added to the data set that may alter the outcome of the ERL derivation. When a finalized version of the two current draft EU-RARs is issued, RIVM will present the MPCs based on the EU-RAR in a concise report.
The EU RAR for will be used as the sole source for physical and chemical data, toxicity data and MPCs that will be presented in this report.
A2.2 Substance properties
Alkylphenols are phenol compounds with one or more chained alkylgroups attached to the aromatic ring. Their general structural formula is:
n O
H
Figure A1. General structural formula of alkylphenols. n denotes the number of C atoms in the alkyl chain. The alkyl chain is drawn as a linear structure, but it may also be branched.
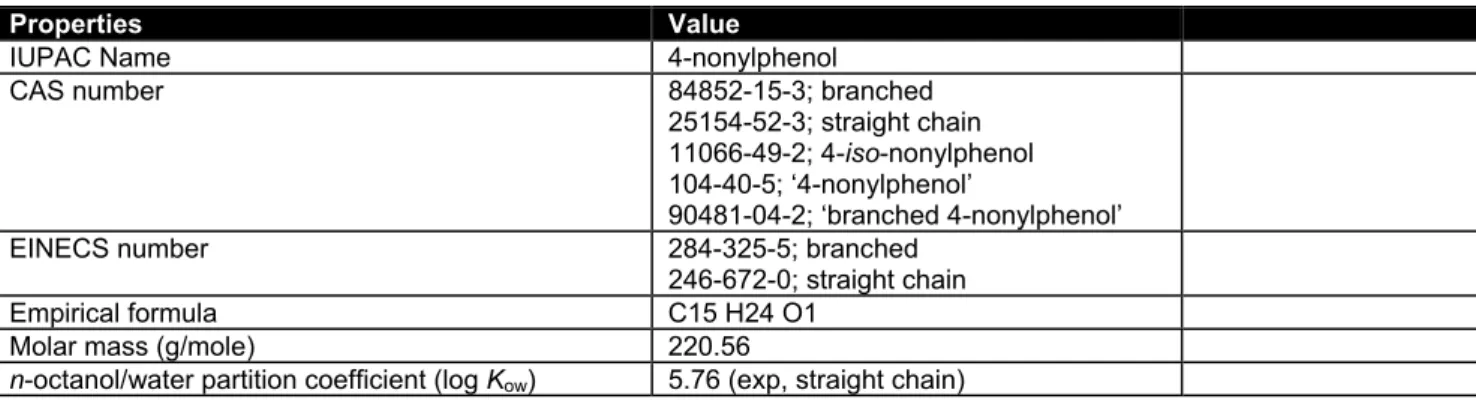
The position of the hydroxy group on the aromatic ring, relative to the position of the alkyl chain, may vary. Most commercial products are technical mixtures of compounds in which the structure of the alkyl chain varies. E.g. 4-Nonylphenol is a mixture of phenols that are para subsituted with alkyl chains containing nine C atoms, having different degrees of branching. Most individual nonylphenols have their own CAS registry number. Physico-chemical characteristics are shown in Table A1.
Table A1. General physicochemical properties and identification of 4-nonylphenol.
O H
The alkyl chain is drawn as a linear structure but may also be branched.
Properties Value
IUPAC Name 4-nonylphenol
CAS number 84852-15-3; branched
25154-52-3; straight chain 11066-49-2; 4-iso-nonylphenol 104-40-5; ‘4-nonylphenol’
90481-04-2; ‘branched 4-nonylphenol’
EINECS number 284-325-5; branched
246-672-0; straight chain
Empirical formula C15 H24 O1
Molar mass (g/mole) 220.56
5.61 (exp. iso-nonylphenol) 4.48 (exp, branched) 4.2 (exp, branched, HPLC) 4.1; 4.2 (est)
6.21 (est, straight chain) 6.1 (est, iso-nonylphenol) Organic carbon/water sorption coefficient (log Koc) 3.58a
4.79 (straight chain) 4.71 (iso-nonylphenol) Water solubility (mg/l) 1.57 at 25°C
7, 6.35 at 25°C (exp.; straight chain) 4.9 ± 0.4 at 25°C
89.9 (est.; iso-nonylphenol) Melting point (°C) 42 (exp.; straight chain)
Vapour pressure (Pa) 0.0126 at 25°C (iso-nonylphenol) 0.0126 at 25°C (exp.; straight chain) Henry’s law constant (Pa.m3.mole-1) 3.4 (exp.; straight chain)
0.6 at 25°C (iso-nonylphenol) at 25°C (straight chain)
BCF 280 (k1/k2)
1280 (est) pKa value (dissociation constant) n.a.
aAverage of 3 values measured in 3 different soils
A2.3 PNEC derivation: general remark
It is emphasised here, that PNEC values (and consequently MPC values based on PNEC values) derived in the following sections (A2.3.1, A2.3.2 and A2.3.3) are not derived according to INS guidance, but according to EU-TGD guidance and are in fact cited from the EU-RAR for nonylphenol [46], the reason for which is explicated in section (2nd paragraph). Observed deviations from INS guidance are therefore attributable to the choice to use EU-TGD based risk limits, that are based on a different underlying framework for environmental risk assessment.
A2.3.1 PNEC
waterTable 1 shows the lowest values of chronic and acute toxicity data for algae, invertebrates and fish for nonylphenol; these values are used to derive the PNEC. For an overview of all toxicity data we refer to the EU-RAR [46].
Table 1. Toxicity data used for the derivation of the PNECwater for nonylphenol [46].
Trophic level Species Endpoint Parameter Duration
(d) Concentration(µg/l) Acute data, freshwater
Invertebrates Ceriodaphnia dubia EC50 n.r. 4 69
Daphnia magna EC50 n.r. 2 85
Hyalella azteca EC50 immobilisation 4 20.7
Fish Pimephales promelas LC50 lethality 4 128
Acute data, salt water
Invertebrates Mysidopsis bahia LC50 lethality 4 43
Fish Cyprinodon variegatus LC50 lethality 4 310
Chronic data, freshwater
Algae Scenedesmus subspicatus
EC10 biomass 3 3.3 Scenedesmus
Trophic level Species Endpoint Parameter Duration (d) Concentration (µg/l) Scenedesmus subspicatus EC10 growth rate 3 25.1 Scenedesmus subspicatus EC50 growth rate 3 323 Selenastrum
capricornutum EC50 cell growth 4 410
Invertebrates Ceriodaphnia dubia NOEC reproduction 7 88.7
Daphnia magna NOEC lethality F1 21 24
Fish Pimephales promelas NOEC lethality 33 7.4
Chronic data, saltwater
Algae Skeletonema costatum EC50 cell growth 4 27
Invertebrates Mysidopsis bahia NOEC growth 28 3.9
n.r. = not reported
Remarks
1. The algal toxicity data in Table 1 are placed under the chronic toxicity data because the test duration in algal tests lasts for several algal generations and is therefore considered to be chronic with respect to the organism. According to the TGD the EC50 from algal tests is used to complete the base-set (in that case,
treating the results as acute data), from which the most sensitive trophic level during acute exposure is identified [41]. If necessary, the EC10 of an algal test can be used as NOEC for the assessment of long term
effects on the trophic level of primary producers.
2. Before combining toxicity data of freshwater and salt water species for PNEC derivation it should be tested whether the sensitivity of these two groups to nonylphenol does not differ significantly. Since this comparison was not reported in the EU-RAR, the data were checked for differences in sensitivity (F-test followed by an unpaired t-test with Welch's correction in case of unequal variances). Acute toxicity of nonylphenol did not differ significantly between freshwater and salt water invertebrates (P=0.60) nor between freshwater and salt water fish (P=0.93). A statistical comparison between algal data could not be made because there was only one test result for a marine algal species available. A statistical comparison between chronic data could not be made because there were no NOEC values for salt water algae, only one NOEC value for salt water invertebrates and no chronic data for salt water fish. Based on the data that could be compared, freshwater and salt water species did not differ in sensitivity to nonylphenol and the combination of datasets is justified.
Acute toxicity data at three trophic levels (see remark 1 in the above text) for both freshwater and salt water are available as well as chronic toxicity data at three trophic levels for freshwater and at two trophic levels for salt water. The most sensitive species in chronic toxicity tests is the green alga Scenedesmus subspicatus, which showed an EC10 of 3.3 µg/l
for toxicity of nonylphenol to biomass growth. An assessment factor of 10 is applied to this value, leading to a PNECwater of 0.33 µg/l.
Recalculation into PNECwater, total and PNECwater, dissolved
In the Netherlands, ERLs for water are derived for both the dissolved and total fraction. Dutch standard water contains 30 mg suspended matter (dw/l), with 20% organic matter (11.72% organic carbon). For the calculation method we refer to the Guidance document on deriving environmental risk limits [120]. The partition coefficient between suspended matter and water used in the calculation is derived from the value as reported in the EU-RAR, which is based on an organic carbon content of 10%. EUSES uses:
Kp, susp = Focsusp*Koc with a Koc value of 5360 l.kg-1. This means that for the Dutch situation
Kp, susp = 0.1172*5360 = 628 l.kg-1.
The PNECwater of 0.33 µg.l-1 should be regarded as PNECwater, dissolved. PNECwater, total is
A2.3.2 PNEC
soilThere is a limited number of toxicity data available for terrestrial organisms. For an overview of the data we refer to the EU-RAR for nonylphenol [46]. Toxicity data are available for micro-organisms (2 processes), plants (4 species) and invertebrates (2 species).Table 2 shows the most sensitive species from three trophic levels.
Table 2. Toxicity data used for the derivation of the PNECsoil for nonylphenol [46].
Trophic level Species Endpoint Parameter Duration
(d) Concentration(mg/kg) Micro-organisms Soil community NOEC CO2 production 40 ≥100
Soil community NOEC N-mineralisation 100 ≥500 Soil community LOEC nitrification 100 ≥500 Plants Sorghum bicolor NOEC growth 21 100
Helianthus rodeo NOEC growth 21 100
Glycine max NOEC growth 21 100
Invertebrates Apporectodea caliginosa EC10 reproduction 21 3.44
Since toxicity data are available for three trophic levels, an assessment factor of 10 may be applied to the lowest NOEC. Reproduction of the earthworm A. caliginosa was the most sensitive endpoint, showing an EC10 of 3.44 mg/kg. The EC10 value is regarded as equivalent
to a NOEC. The PNECsoil is calculated to be 0.34 mg/kgww.
Since the PNECsoil is derived using preliminary risk assessment, the PNECsoil is also
calculated using equilibrium partitioning [120]. Within the EU framework the following equation is used: soil water water soil EqP ww soil 1000 RHO PNEC K PNEC = − ⋅ ⋅ Equation 1 in which:
PNECsoil ww EqP predicted no effect concentration for the soil compartment (µg.kgww-1)
Ksoil-water soil to water partition coefficient (m3.m-3)
PNECwater predicted no effect concentration for the water compartment (µg.l-1)
1000 conversion factor from litres to m3 (l.m-3) RHOsoil bulk density of wet soil (kg.m-3)
The PNECsoil ww EqP is calculated using PNECwater = 0.33 µg.l-1, Ksoil-water = 161 m3.m-3 [39],
and RHOsoil = 1700 kg.m-3 [39]. The PNECsoil ww EqP is calculated to be 31.3 µg.kg-1ww.
Recalculation to dry weight and standard soil
PNECsoil derived using preliminary risk assessment.
The PNECsoil derived using preliminary risk assessment (0.34 mg/kgww) can not be
recalculated to dry weight and standard soil, since the dry weight and organic matter content of the test soil are not reported in the EU-RAR.
![Table 3. K p and K comp-water for short chained chlorinated paraffins using a K oc of 91201[L.kg -1 ]](https://thumb-eu.123doks.com/thumbv2/5doknet/3082129.9466/19.892.114.768.320.449/table-comp-water-short-chained-chlorinated-paraffins-using.webp)
![Table 1. Toxicity data used for the derivation of the PNEC water for nonylphenol [46].](https://thumb-eu.123doks.com/thumbv2/5doknet/3082129.9466/31.892.101.772.854.1156/table-toxicity-data-used-derivation-pnec-water-nonylphenol.webp)
![Table 2. Toxicity data used for the derivation of the PNEC soil for nonylphenol [46].](https://thumb-eu.123doks.com/thumbv2/5doknet/3082129.9466/33.892.103.770.266.428/table-toxicity-data-used-derivation-pnec-soil-nonylphenol.webp)