Report 680740004/2010
E.M. Schreurs | E.N.G. Verheijen | C.J.M. Potma | J. Jabben
Noise monitor 2009
RIVM Report 680740004/2010
Noise Monitor 2009
Measurements and validation of environmental noise
E.M. Schreurs E.N.G. Verheijen C.J.M. Potma J. Jabben Contact: Eric Schreurs
Centre for Environmental Monitoring
This investigation has been performed by order and for the account of the Ministry of Housing, Spatial Planning and the Environment (VROM DGR-LOK), within the framework of the project ‘Monitoring Geluid’ project number M/680740/10/MO
© RIVM 2010
Parts of this publication may be reproduced, provided acknowledgement is given to the 'National Institute for Public Health and the Environment', along with the title and year of publication.
Abstract
Noise Monitor 2009
Measurements and validation of environmental noise
Road traffic noise levels measured in 2009 practically agree with previous results in 2008, except for the A10 motorway. At this site the average noise level has decreased by 1 dB as opposed to the increasing trend in previous years. Furthermore, sample measurements conducted in Utrecht match well with calculated noise emissions from the Dutch calculation method. This computation method is provided by the Dutch Ministry of Housing, Spatial Planning and the Environment to calculate noise due to road and railway traffic.
Noise monitor results for railway noise were provided by Prorail, and consisted of data from two monitoring sites in 2009. The results show that the noise emission at normal driving speeds
corresponds well with the calculated emission according to the Dutch calculation method. Also, it was found that the speed-dependency of the noise emission is in line with the national standard.
Furthermore, in 2010 RIVM carried out a pilot study to aircraft noise in a sanctuary near Zegveld, in the province of Utrecht. Noise levels from various types of aircraft near Schiphol Airport were
measured from January to March 2010. These measurements were compared with the Integrated Noise Model (INM), a standard calculation tool to determine the noise impact in the vicinity of airports. Average noise emission levels as measured for different airplane types follow predicted levels from INM. Additionally it was found that newer types of aircraft produce less noise than older types. These are the main results from the RIVM noise monitor programme in 2009. The measurements serve as to monitor trends in noise emission and validation of the standard Dutch calculation methods for roadway and railway traffic. Noise measurements on road traffic have been conducted from continuously operating monitoring stations at the A2 (Breukelen), A10 (Amsterdam), A12 (The Hague/Voorburg) and N256 (Colijnsplaat, province of Zeeland) motorways.
Key words:
Rapport in het kort
Geluidmonitor 2009
Trend- en validatiemetingen aan omgevingsgeluid
De geluidsbelasting door wegverkeer die in 2009 is gemeten komt grotendeels overeen met de resultaten uit 2008, behalve voor de A10-West bij Amsterdam. Op deze locatie is de gemiddelde geluidsbelasting gedaald met 1 decibel, een trendbreuk met geluidstoename die in de voorgaande jaren was gemeten. Daarnaast zijn steekproefmetingen verricht aan stedelijk wegverkeer in Utrecht. De uitkomsten komen overeen met de voorgeschreven geluidsemissies volgens het Nederlandse Reken- en Meetvoorschrift. Dit voorschrift wordt door het ministerie van VROM uitgegeven om de
geluidsbelasting door weg- en railverkeer te berekenen en te toetsen.
Voor railverkeer is gebruikgemaakt van resultaten die ProRail in 2009 op twee verschillende locaties heeft gemeten. Hieruit bleek dat bij normale rijsnelheden de geluidsemissies overeenstemmen met de geluidemissies volgens het Nederlandse Reken- en Meetvoorschrift. Ook het verband tussen snelheid en geluidsemissie bij de metingen komt overeen met wat dit voorschrift voorschrijft.
Ten slotte zijn in de Geluidsmonitor resultaten opgenomen van een pilotstudy naar luchtvaartgeluid die in de eerste helft van 2010 in een stiltegebied bij Zegveld (provincie Utrecht) is uitgevoerd. Hiervoor zijn van januari tot en met maart van dat jaar geluidsniveaus gemeten van verschillende typen
vliegtuigen die van en naar Schiphol vlogen. Deze resultaten zijn vergeleken met het Integrated Noise Model, een Amerikaans standaardrekenmodel dat door veel luchtvaartbedrijven wordt gebruikt. Hieruit bleek dat de gemiddelde geluidemissies als gemeten van een aantal verschillende vliegtuigtypes redelijk overeenkomen met dit model. Ook bleek dat de nieuwere typen vliegtuigen minder geluid produceren dan oudere.
Dit zijn de belangrijkste resultaten uit de Geluidsmonitor 2009. De metingen worden gebruikt om trendanalyses van geluidsemissies te maken en standaard rekenmethoden voor weg-, rail- en luchtvaartverkeer te valideren. Voor het wegverkeersgeluid zijn metingen verricht langs de A2 bij Breukelen, de A10-West bij Amsterdam, de A12 bij Voorburg en de N256 in Noord-Beveland. Trefwoorden:
Contents
Summary 9
1 Introduction 11
1.1 Goal 11
1.2 Monitor locations in 2009 11
2 Road traffic noise 13
2.1 A2 motorway near Breukelen 13
2.2 A10-West motorway in Amsterdam 14
2.3 A12 motorway nearVoorburg 19
2.4 N256 motorway Noord-Beveland 22
2.5 Sample noise measurements in Utrecht 27
3 Railway noise 31
3.1 Monitoring stations ProRail 31
3.2 Results 32 3.3 Influence of speed 34 3.4 Conclusion 35 4 Airport noise 37 4.1 Introduction 37 4.2 Measurement set up 37 4.3 Results 38
4.4 Comparison with INM data 40
5 Conclusions 43
References 45
Appendix 1 Measurement sites 47
Appendix 2 Description of measurement equipment 53 Appendix 3 Measured versus calculated noise N256 55
Appendix 4 Emission of railway vehicles 57
Summary
This RIVM report ‘Noise Monitor 2009’ describes the results obtained in 2009 from a number of noise monitor stations at motorways and railways in the Netherlands. Also sample measurements of urban road traffic and aircraft noise performed in 2010 are included in this report. The results are used for evaluation of trends in noise emission and for validation of noise calculation methods. In the following, the main findings from the measurements in 2009 are briefly outlined:
Road traffic noise
In 2009 results were analysed for four measurement sites: the A2 motorway at Breukelen (near Utrecht), the A10 motorway west of Amsterdam, the A12 motorway near Voorburg (The Hague) and the N256 in the province of Zeeland.
A2 motorway near Breukelen
Due to the reconstruction of the A2 motorway, which is broadened from 2 - 3 lanes to 2 - 5 lanes and is being repaved, in 2009 no meaningful measurements could be obtained here. Previous measurements were conducted continuously from 2000-2008. They showed no significant change in average vehicle noise emissions over this period, but the average noise emissions measured here appeared 1-2 dB higher than the standard Dutch calculation method. The new pavement will consist of double layer porous asphalt (DLPA). Anticipating on the new situation, in 2009 the microphone height has been increased from +1.5 to +4 m with respect to the pavement, improving acoustical sight on the road. We expect that a new time series can be started in 2011 after the reconstruction works have been finished. A10 motorway in Amsterdam
Previous measurements, conducted continuously from 2003 to 2008 show a gradual increase in noise levels, that was only interrupted in 2006 after the introduction of a 80 km/h speed limit. This gradual increase in noise levels is probably due to a deterioration of the porosity of the pavement. However, as opposed to the previous trend, the average measured noise level in 2009 came out 1 dB lower as compared to the situation in 2008. Although here traffic volumes have also decreased slightly from 2008-2009, this fact alone cannot fully account for the observed reduction of average noise levels in 2009.
A12 motorway near Voorburg/The Hague
Previous noise measurements here were conducted continuously from 2005 to 2008 and showed a decrease of noise levels due to a speed limit introduced in November 2005 and a DLPA repaving in September 2007. In 2009, measurements were conducted until July. In August 2009, the noise monitor had to be removed from the traffic portal, because it was not sufficiently accessible and maintenance turned out to be problematic. In December 2009 a new collapsible stand was installed alongside the motorway, which allows sufficient accessibility and maintenance. The measurements up to July 2009 hardly differ from the results in 2008 and the sound reducing properties of the DLPA laid in September 2007 still seem to be completely present. A diminishing of noise reduction as found at the A10
motorway so far has not been observed at the A12.
N256 motorway near Colijnsplaat (Noord-Beveland, province of Zeeland)
Results in 2009 are practically equal to the measurements in 2008. Here the measured noise emissions from all vehicle categories, on a dense asphaltic pavement, exceed predicted noise emissions according to the standard Dutch calculation by 2-3 dB.
Sample measurements Amsterdamsestraatweg Utrecht
In addition to the (unmanned) measurements at the noise monitor stations along motorways, in 2010 also a limited set of (manned) sample measurements were conducted according to the SPB (Statistical Pass By) method aimed at noise emissions of roadway vehicles at medium speed in an urban situation on a dense asphaltic concrete pavement. Contrary to the result found at the N256 motorway, for this sample the predicted noise emission from the standard Dutch calculation method appeared to agree well with measured noise emissions.
Railway noise
Since 2006 the ProRail monitoring stations have been used to assess railway noise emission. This year, also freight trains could be analysed. Data from the two monitoring sites that were operational in 2009 show that the noise emission at normal driving speeds corresponds well with the calculated emission according to the Dutch calculation method. Also, it was found that the speed-dependency of the noise emission is in line with the national standard.
Airport noise
In 2009 a noise monitor was installed in Zegveld, a sanctuary located 17 km south of Schiphol Airport. With it a total number of 330 aircrafts departing and taking off from Schiphol Airport were measured in the first three months of 2010. These aircrafts were classified in 22 different types, for which an average Sound Power Level (LW ) in dB(A) can be derived. These measured LW values were
subsequently compared with sound power levels provided by the Integrated Noise Model of the Federal Aviation Association (FAA). It was found in this study that the measured and predicted sound power levels agree fairly well. The results show that the measurement set up in combination with flight data allows to identify in situ the noisy airplanes from more quiet airplanes. Although only a relatively small number of airplanes have been measured, the tentative results seem to endorse the effect of Schiphol Airports policy to use the newest and most quiet aircrafts available.
1
Introduction
1.1
Goal
This report gives the results and interpretation of noise measurements in 2009 from the RIVM monitoring programme. This programme aims at monitoring noise emissions from road and railway traffic under various meteorological conditions, by use of continuously operating measurement sites. The measurements can be used to analyse trends in sound emissions, and validate the noise propagation models which are used to support the Dutch national noise policies.
1.2
Monitor locations in 2009
Road traffic at motorways
The measurements of road traffic noise by the RIVM take place at several locations, and monitoring at these locations is almost continuous. The topographic details of the measurement sites are given in Appendix 1. The four current measurement locations are the following:
A2 motorway near Breukelen
This is a measurement site at a distance of nearly 15 m of the A2 motorway near Breukelen. The A2 connects two of the largest cities in the Netherlands, Utrecht and Amsterdam, and subsequently is one of the busiest motorways in the Netherlands. The site is also used by the Dutch National Air Quality Monitoring Network (LML in Dutch), and the noise monitor shares its power supply and housing with the air quality monitors. Measurements at this site started in 1999, and since February 2000 the measurements are performed continuously.
A10-West motorway in Amsterdam
This measurement site is located east of the A10-West, which is the western part of the Amsterdam beltway, and measurements are performed since 2003. In 2001, the road at this site was reconstructed and paved with a porous asphalt layer. Additionally at this site a maximum speed limit of 80 km/h has been introduced in November 2005.
A12 motorway near Voorburg
In June 2005 monitoring started at the A12 motorway near Voorburg. The A12 is the principal arterial road for the city of The Hague. The noise monitor was placed at the north side of the A12, on top of a traffic portal (signaling bridge). As with the A10-West, a speed reduction was implemented in November 2005. In September 2007, the road was resurfaced with a double layer of porous asphalt (DLPA).
N256 provincial road near Colijnsplaat (Noord-Beveland, province of Zeeland)
This site aims at monitoring the noise emission of three vehicle categories (passenger cars, medium and heavy trucks) separately. The noise monitor is operational since December 2004. A counting device is used here to determine the vehicle type and pass-by speed at each pass by. During night time form 2.00 to 4.00 a.m. the vehicle flow rate is low enough to measure separate pass-by events. Measurements in
these hours are used to assess the speed-dependency of the noise emission per vehicle category and to compare the results with the emissions according to the Dutch standard calculation method for road traffic noise (RMW, 2006).
Urban road traffic
Apart from the continuous measurements at motorways, since 2005 also repeatedly sample
measurements in Utrecht of motor vehicles driving on urban roads are carried out. The objective is to find out if certain vehicle types have a higher noise emission than other types. Also the low frequency content of noise emission is investigated. Sample measurements in 2010 are reported here and have been extended in size. The measurements in Utrecht 2010 are compared with the reference curves of the Dutch standard calculation method (RMW, 2006). Results are given in section 2.5.
Railway traffic
Since 2006 the measurement results of the ProRail monitoring stations have been used to evaluate the noise emission of trains. In this report the results of two locations referring to the four main categories of passenger trains have been analysed in chapter 3.
Airport noise
In June 2009 RIVM set up a monitor location near Zegveld, a sanctuary located approximately 17 km south of Schiphol Airport. The noise monitor is capable of determining the sound source position based on sound arrival direction. The directional system allows to separate airplane noise events from other (ground) noise sources. Ground noise events were eliminated from the measurement data before relating these to airplane passages. The results from measurements performed in the first three months of 2010 are given in chapter 4.
2
Road traffic noise
2.1
A2 motorway near Breukelen
The measurement site is located at a distance of approximately 15 m east of the motorway, and is part of a measurement site of the Dutch National Air Quality Monitoring Network. Noise has been monitored here continuously since 2000. From December 2008 until mid 2010, northbound traffic is redirected due to a major reconstruction of this road. During this period, the road has been widened from 2-3 to 2-5 lanes. The reconstruction did not allow for a meaningful monitoring of noise levels, since the traffic configuration has been temporarily completely altered and free sound propagation has been obstructed by a sand wall. The picture below shows the empty northbound lanes at the monitor site as of June 2010. Noise monitoring will be continued as soon as the reconstruction work has been finished and a stable traffic configuration has been realised. We expect this will be the case by the end of 2010. Anticipating on the new situation, in 2009 a new measurement position has been set up in which the microphone is placed at +4 m with respect to the road surface (which used to be +1.5 m). New results will be available in next year’s issue of this report. Further details are shown in Appendix 1.
The situation at the A2 near Breukelen in June 2010, with the newly constructed DLPA road (a), and the noise monitor on the pole (b).
2.2
A10-West motorway in Amsterdam
2.2.1
Description
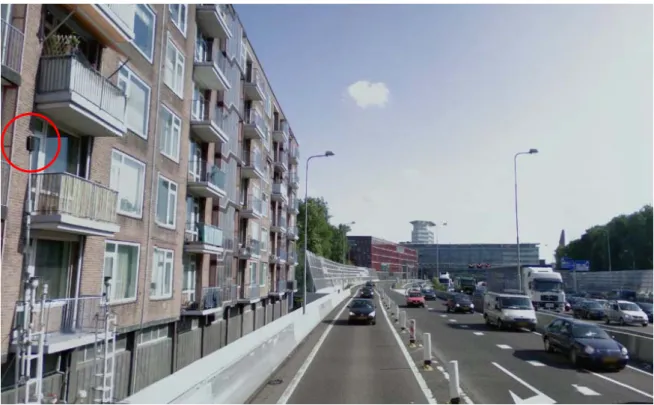
This RIVM noise monitor site is located at the east side of the A10-West in Amsterdam. Monitoring started in 2003. The details of the location of this site are given in Appendix 1. The noise monitor is located between the A10-West motorway and an apartment building, so the monitor cannot be
considered to be in the free field. A correction of 2 dB, subtracted from the measured levels, is applied to the measurements in order to compensate for the façade reflection. The maximum speed is 80 km/h, which is strictly enforced using the average speed check system Trajectcontrole since November 2005.
The monitor location at the A10-West, indicated by the red circle on the left. On the right, the traffic in the north direction. The three exit lanes are separated from the main road by a low barrier. Source: Google StreetView. The motorway is divided in twelve traffic lanes, of which three on each side are exits and weaving lanes. The road surface of the A10-West mostly consists of DLPA, but at some locations the road consists of a Porous Asphalt Concrete (PAC) layer or a Dense Asphalt Concrete (DAC) layer. The PAC layers are mainly situated at bridges and the DAC layers at exit lanes. At the location of the measurement site, the road surface consists of a PAC layer as well as a DAC layer at the exit lanes.
2.2.2
Monitor results 2003-2009
Yearly average 24-hour distribution
2003 2004 2005 2006 2007 2008 2009 60 65 70 75 80 0 6 12 18 0 6 12 18 0 6 12 18 0 6 12 18 0 6 12 18 0 6 12 18 0 6 12 18 Hour H o u rl y A v er a g ed L A e q ( d B ) (PAC/DAC) A10-West Amsterdam
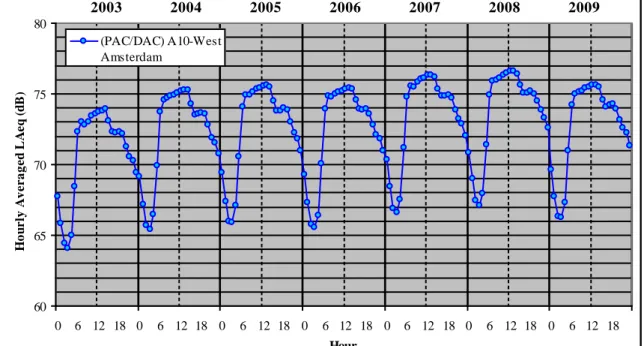
Figure 2.1 Average 24-hour noise level distributions, measured at the A10-West motorway in Amsterdam over the years 2003-2009.
Table 2.1 shows the equivalent noise levels for the day, evening and nighttime periods and the weighted 24-hour average Lden.
Table 2.1 Equivalent noise levels LAeq and Lden measured at the A10-West in Amsterdam
2003 2004 2005 2006 2007 2008 2009
LAeq, 7-19h 73.0 74.6 74.9 74.8 75.7 76.0 75.1
LAeq, 19-23h 71.1 72.6 72.8 72.6 73.7 74.2 73.0
LAeq, 23-7h 68.0 69.5 69.8 69.6 70.6 71.0 70.1
Lden 75.8 77.3 77.6 77.4 78.4 78.8 77.8
It can be seen that the average sound levels in 2009 have decreased by approximately 1 dB as compared to the results in 2008. This reduction is present at all hours. The average equivalent noise levels and the Lden of 2009 are approximately the same as in 2005.
Traffic intensities and speeds
Table 2.2 shows the number of vehicles and their average speeds measured at the site, using counting data provided by Rijkswaterstaat, the Dutch road authority.
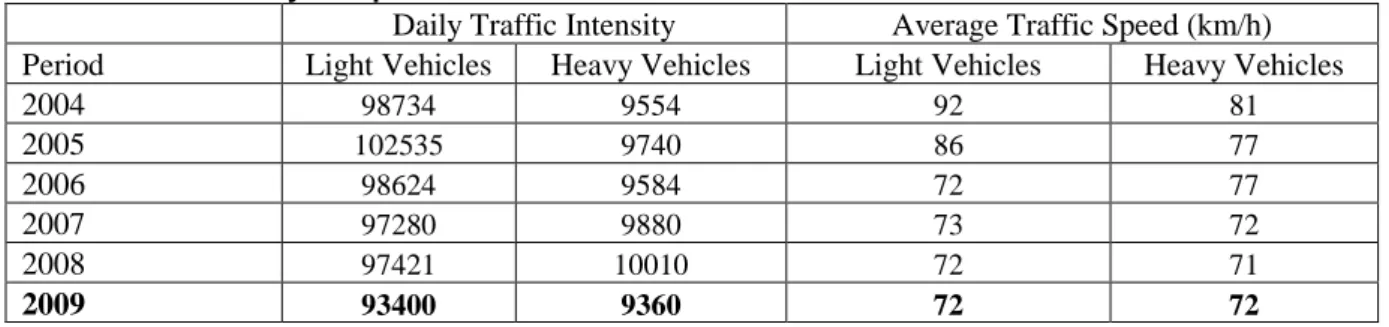
Table 2.2 Traffic intensity and speed at the A10-West Amsterdam since 2005
Daily Traffic Intensity Average Traffic Speed (km/h) Period Light Vehicles Heavy Vehicles Light Vehicles Heavy Vehicles
2004 98734 9554 92 81 2005 102535 9740 86 77 2006 98624 9584 72 77 2007 97280 9880 73 72 2008 97421 10010 72 71 2009 93400 9360 72 72
Source: Rijkswaterstaat-DVS (counting point 35675 Geuzeveld)
As compared to 2008, the traffic intensities of light and heavy vehicles have decreased by 4.1% and 6.6% respectively. The average speeds in these categories have hardly changed.
2.2.3
Evaluation
In contrast with the increasing trend as observed during 2003-2005 and 2006-2008, the noise level distribution of 2009 shows a decrease compared to 2008. This is the first time a decrease of the average noise levels is observed since 2006. In 2006 the reduced average level was due to the decrease in maximum speed from 100 km/h to 80 km/h, which was enforced in November 2005. In the Noise Monitor 2008 (Schreurs et al., 2009) it was suggested that pollution and deterioration of the pavement caused the increase of noise levels over the years. In view of this aspect one would expect a further slight increase of noise levels, or a stabilisation at best.
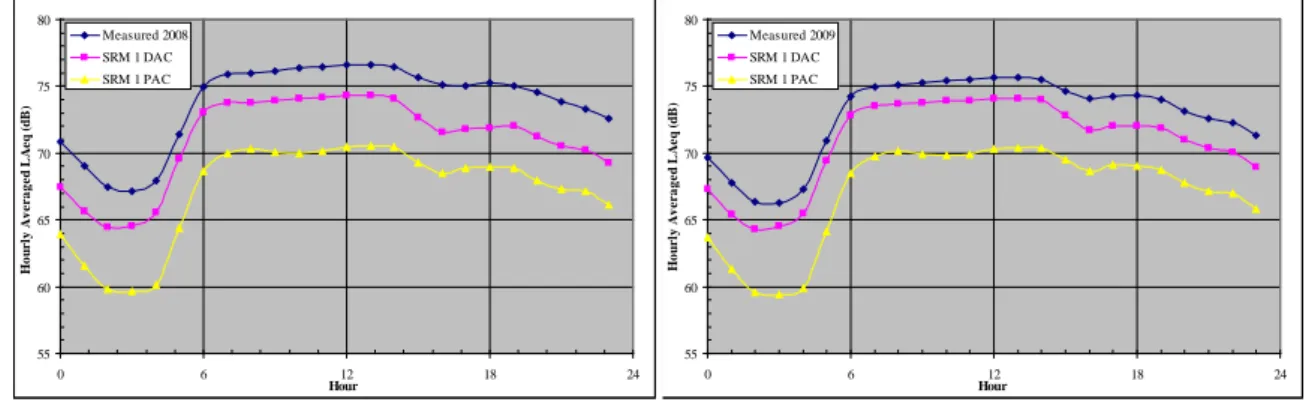
For 2009 however, as far as is known, no speed reduction or other noise measures were taken at this site. Table 2.2 shows that the traffic intensity of 2009 has decreased slightly compared with 2008. From 2004 until 2008, traffic intensities were relatively stable, but for 2009 the lowest intensity in 6 years was observed for both light vehicle traffic and heavy vehicle traffic. To examine if traffic intensity can fully explain the change of noise levels, a comparison was done between measured and calculated noise levels for 2008 and 2009. Noise level calculations were done according to the SRM1 from the Dutch Standard Calculation method for road traffic noise (RMW, 2006). For the calculations the traffic intensity of 2008 and 2009 was used, and as a reference surface either DAC or PAC pavements were used. Given the fact that lanes with DAC as well as PAC pavements contribute to the noise at the monitoring location, the measured noise level can be expected to lie between these reference values. The results of the comparison are shown in Figures 2.2a and b.
(a) (b)
nl.w
Figure 2.2 Comparison of the measured 24-hour noise level distributions with SRM1 calculated noise distributions for DAC and PAC pavings, for the years 2008 (a) and 2009 (b).
In these Figures 2.2 a and b, it can be seen that for 2008 and 2009, the calculated levels decrease only slightly compared to the measured levels. For both the DAC and PAC calculations, the difference in traffic numbers between 2008 and 2009 cause a decrease of the noise levels of around 0.2 dB. This means that 0.8 dB of the reduction from 2008 to 2009 is unaccounted for.
2.2.4
Influence of precipitation on the noise emission
As in previous years for the A10-West monitoring site, the influence of precipitation on the measured noise levels was analysed. The amount of precipitation was based on a KNMI1
− ‘dry’ hours for which in the previous 48 hours less than 1 mm of rain has fallen;
weather station at approximately 10 km from the site. The results are shown in Figure 2.3, which shows the measured spectra for different hours:
− ‘wet’ hours for which in the previous 48 hours more than 1 mm rain has fallen and which are not saturated;
− ‘saturated’ hours for which in the previous 12 hours more than 8 mm of rain has fallen; − all hours for the measurement, included for comparison.
1 Dutch meteorological institute. Schiphol station
55 60 65 70 75 80 0 6 12 18 24 Hour H o u rl y A v er a g e d L A e q ( d B ) Measured 2009 SRM 1 DAC SRM 1 PAC 55 60 65 70 75 80 0 6 12 18 24 Hour H o u rl y A v er a g e d L A e q ( d B ) Measured 2008 SRM 1 DAC SRM 1 PAC
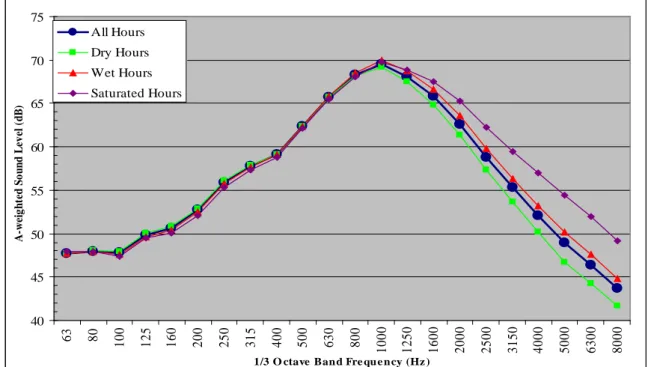
40 45 50 55 60 65 70 75 6 3 8 0 1 0 0 1 2 5 1 6 0 2 0 0 2 5 0 3 1 5 4 0 0 5 0 0 6 3 0 8 0 0 1 0 0 0 1 2 5 0 1 6 0 0 2 0 0 0 2 5 0 0 3 1 5 0 4 0 0 0 5 0 0 0 6 3 0 0 8 0 0 0
1/3 O ctave Band Fre que ncy (Hz )
A -w ei g ht ed So und L ev el ( dB ) All Hours Dry Hours Wet Hours Saturated Hours
Figure 2.3 Influence of precipitation on the spectrum measured at the A10-West site in 2009.
From Figure 2.3 it can be concluded that above 100 Hz, in the wet and saturated hours the noise emission from the road is higher. This is in line with observations reported in previous Noise Monitor reports. The increase of noise due to precipitation may probably be explained by the fact that rain water fills the porous cavities of the surface, decreasing the amount of the acoustic absorption by the road surface.
Table 2.3 shows the averaged A-weighted noise levels for the different weather types. Table 2.3 Averaged LAeq levels measured at the A10-West in 2009.
Dry hours All Hours Wet hours Saturated Hours
Averaged LAeq (dB(A)) 73.1 73.6 74.0 74.2
Difference with All hours -0.5 - 0.4 0.6
Percentage occurring 53% 100% 44% 2%
The measured difference in noise emission between a wet pavement and a dry pavement is about 1 dB. The large spectral difference between a saturated pavement and a wet pavement at high frequencies (Figure 2.3) is reduced considerably after A-weighting. However, caution is required when interpreting these figures, as the saturated hours only occurred 2% of the time in 2009. The large spectral difference between a saturated and wet surface at high frequencies has only a small effect on the broadband level because the difference at frequencies below 1250 Hz is small.
2.3
A12 motorway nearVoorburg
2.3.1
Description
In July 2005, RIVM set up a noise monitor site alongside the A12 motorway at Voorburg, near The Hague. The A12 at this site consists of six traffic lanes, three in each direction. In July 2005 when monitoring started, the maximum speed was 100 km/h. The pavement on the northern traffic lanes consisted of a Double Layer of Porous Asphalt (DLPA) and on the southern lanes it consisted of a single layer of porous asphalt concrete (PAC). Subsequently two measures were taken at this site which influenced the noise emission. First in November 2005, the maximum speed was lowered to 80 km/h, as enforced by Trajectcontrole, the same average speed camera system as at A10-West. Finally in September 2007, the complete pavement, in both directions, was replaced with a DLPA.
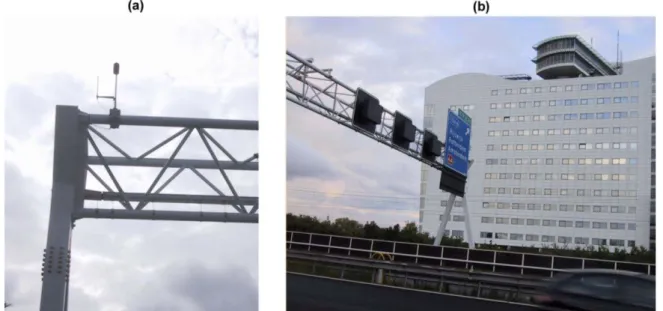
The noise monitor, a Larson-Davis 870 microphone, was placed on a traffic portal, as shown in the picture below. In August 2009, the microphone was removed from the portal, as it was not sufficiently accessible and maintenance turned out to be problematic. In December 2009 a collapsible stand was installed alongside the motorway, which allows sufficient accessibility and maintenance. The measurement data and analysis as reported here only include measurements up until July 2009. The picture below shows the location of the monitor as it was until July 2009.
The microphone (Larson-Davis 870) as it was placed on the portal (a) and the portal itself at the A12 (b).
2.3.2
Monitor results 2005-2009
Figure 2.4 shows the yearly averaged 24-hour noise level distributions from July 2005 until July 2009. It should be noted that the yearly averaged noise level distributions for 2005 and 2009 are technically half-yearly averaged, as monitoring started in July 2005 and ended in July 2009.
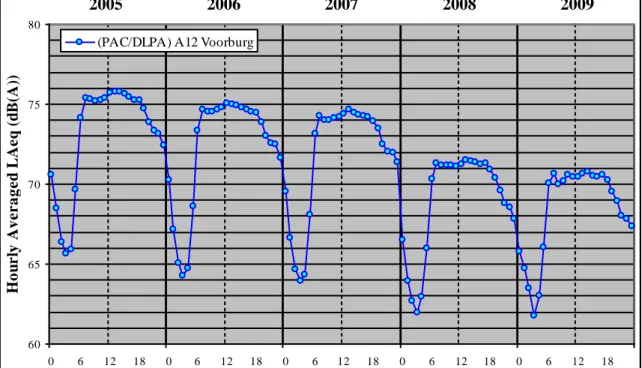
2005 2006 2007 2008 2009 60 65 70 75 80 0 6 12 18 0 6 12 18 0 6 12 18 0 6 12 18 0 6 12 18 Hour H o u r ly A v e r a g e d LA e q (d B(A ))
(PAC/DLPA) A12 Voorburg
Figure 2.4 Average 24-hour noise level distributions, measured at the A12 motorway near Voorburg over the years 2005-2009.
Figure 2.5 shows the monthly averaged noise levels at this site, from July 2007 up until July 2009, when the microphone was removed from the portal. Furthermore, red arrows indicate when the two noise reducing measures came into effect.
60 65 70 75 80 ju l-0 5 a u g -0 5 se p -0 5 o c t-0 5 n o v -0 5 d e c -0 5 ja n -0 6 fe b -0 6 m a r-0 6 a p r-0 6 m a y -0 6 ju n -0 6 ju l-0 6 a u g -0 6 se p -0 6 o c t-0 6 n o v -0 6 d e c -0 6 ja n -0 7 fe b -0 7 m a r-0 7 a p r-0 7 m a y -0 7 ju n -0 7 ju l-0 7 a u g -0 7 se p -0 7 o c t-0 7 n o v -0 7 d e c -0 7 ja n -0 8 fe b -0 8 m a r-0 8 a p r-0 8 m a y -0 8 ju n -0 8 ju l-0 8 a u g -0 8 se p -0 8 o c t-0 8 n o v -0 8 d e c -0 8 ja n -0 9 fe b -0 9 m a r-0 9 a p r-0 9 m a y -0 9 ju n -0 9 ju l-0 9 Month M o nt hl y A v e r a g e d L A e q ( dB (A )
(PAC/DLPA) A12 Voorburg july 2005 - july 2009 Max. speed lowered to 80 km/h
Paved with DLPA
Figure 2.5 Average 24-hour noise level distributions, measured at the A12 motorway near Voorburg over the years 2005-2009.
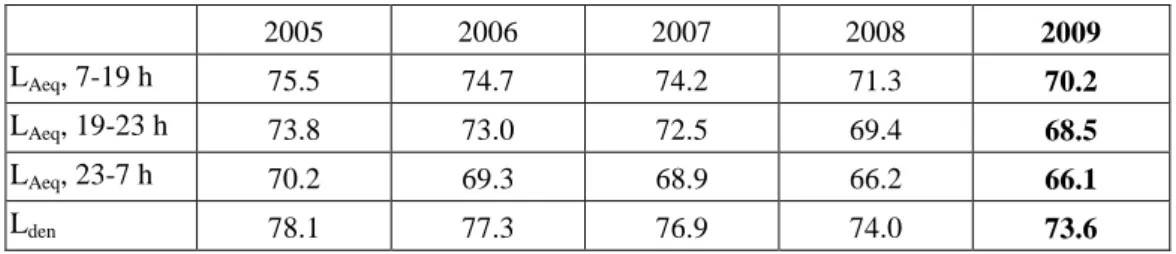
Table 2.4 Equivalent noise levels LAeq and Lden measured at the A12 near Voorburg. 2005 2006 2007 2008 2009 LAeq, 7-19 h 75.5 74.7 74.2 71.3 70.2 LAeq, 19-23 h 73.8 73.0 72.5 69.4 68.5 LAeq, 23-7 h 70.2 69.3 68.9 66.2 66.1 Lden 78.1 77.3 76.9 74.0 73.6
2.3.3
Evaluation
Figure 2.4 and Table 2.4 show a considerable decrease of the noise at this site over the years, at first with 0.8 dB and 0.4 dB, and subsequently a decrease of 3 dB from 2007 to 2008. In 2009 a further decrease of the Lden level with 0.4 dB was observed, with the comment that measurements were done
until July 2009. The decrease in levels in 2006 and 2008 are respectively caused by the decrease of the maximum speed at this site in November 2005, and the repaving with DLPA in September 2007. The influence of these measures can be observed more clearly in Figure 2.5, where the monthly averaged equivalent noise levels are shown from July 2005 up until July 2009. The decrease of noise emission from 2008 to 2009 is probably partly caused by a decrease of traffic intensity. Also as measurements in 2009 were carried out only during the first six months they are not fully comparable to the
measurements in 2008. The difference is small however and in any case the sound reducing properties of the DLPA laid in September 2007 still seem to be completely present. A diminishing of noise reduction as found at the A10 motorway so far has not been observed at the A12.
2.4
N256 motorway Noord-Beveland
2.4.1
Measuring site
In August 2004 a noise monitor site was set up at the N256 motorway Noord-Beveland near Colijnsplaat in the province of Zeeland.
RIVM monitoring site at N256 motorway (Noord-Beveland).
At the site, apart from noise levels, also for each car pass-by the type of vehicle and its speed are registered using an automated counting device. This allows for further differentiation of noise emissions for three different categories: light vehicles, middleweight trucks and heavy weight trucks. At the other road traffic sites (A2, A10-West and A12), this differentiation is only possible using a multiple regression technique, which contains a relatively large uncertainty. Due to this uncertainty, small changes in the emission per category cannot be monitored accurately.
At the site along the N256, noise levels are only registered during the night time from 02:00 to
04:00 a.m. Furthermore, only noise events with a separation time over 30 seconds are registered, so that the probability of measuring two or more events simultaneously is minimized.
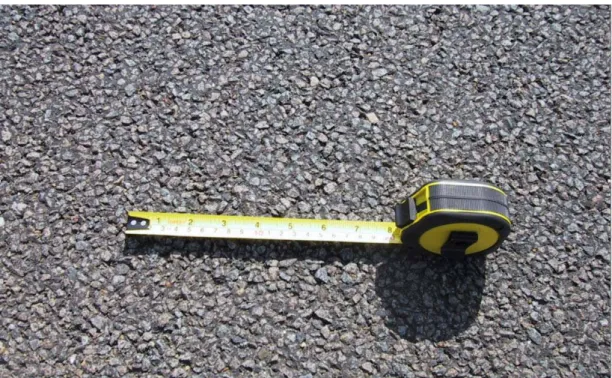
The road surface consists of a Dense Asphaltic Concrete layer with stone chipping from 0-11 mm (DAC 0-11). The pavement is shown in the picture below. The microphone is placed at a distance of 7.5 m from the road centreline and at a height of 4 m. Appendix 1 shows a map of the surroundings.
Pavement of the N256 near the RIVM monitoring site.
2.4.2
Measured results 2009
Only the noise events that could be matched unambiguously with the registered pass-by times and with a minimum separation time of 30 seconds (approximately 650 m at 80 km/h) were used in the analysis. Table 2.5 shows the average sound power levels LWA of the different vehicle categories over the years 2004 up to 2009. The sound power levels were derived from the measured Sound Exposure levels (SEL). These levels are valid for a reference speed of 80 km/h for light vehicles and 70 km/h for middle weight and heavy weight trucks. Also the difference between the average measured sound power level and the value according to the Dutch standard calculation model (RMW, 2006) is given.
Table 2.5 Sound power levels LWA 2004-2009 as measured at the N256 Noord-Beveland. All levels are valid for passages between 02:00 and 04:00 a.m.
2004 2005 2006 2007 2008 2009 Difference 2009–2008 Level 2009 – RMW2006 Lightweight 106.0 105.8 105.6 105.3 105.7 105.9 +0.2 +3.5 Middleweight 109.4 109.1 108.6 108.5 108.9 108.4 -0.5 +2.2 Heavyweight 111.4 111.4 110.8 111.2 112.0 111.6 -0.4 +2.6
LWA = Sound Exposure Level (SEL)*(Vref)+33
As compared with 2008, the noise emissions of middle and heavy weight traffic have decreased
slightly. Most notable is the rather large difference of approximately 3 dB for all categories between the measured levels and the values deduced from the Dutch calculation method.
Influence of speed
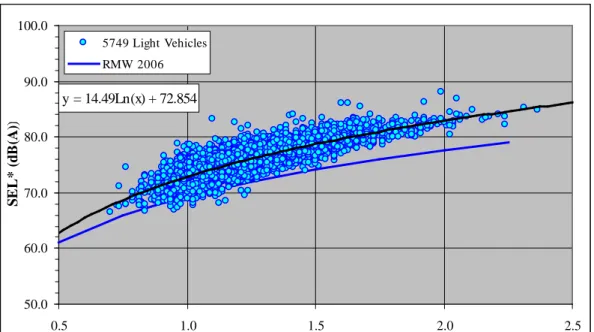
Figures 2.6 - 2.8 show the scatter diagrams in which the normalized SEL* value (see Appendix 3) is plotted versus the relative speed V/Vref. The diagrams contain 5749, 1123 and 1689 pass-by events of respectively light vehicles, middle weight and heavy weight vehicles. All measured results were obtained between 02:00 and 4:00 a.m. In each scatterplot a regression line and its coefficients are given for the measurements, specified by the equation. The regression line can be compared with the
calculated values according to the Dutch calculation method (RMW, 2006), which is also shown in the diagrams. y = 14.49Ln(x) + 72.854 50.0 60.0 70.0 80.0 90.0 100.0 0.5 1.0 1.5 2.0 2.5 V/Vref S E L * (d B (A )) 5749 Light Vehicles RMW 2006
Figure 2.6 Normalized SEL* values measured from passages of light vehicles between 02:00 and 4:00 a.m. in 2009 versus the relative speed V/Vref; Vref = 80 km/h for light vehicles.
y = 9.2425Ln(x) + 75.392 50.0 60.0 70.0 80.0 90.0 100.0 0.5 1.0 1.5 2.0 V/Vref S E L * (d B (A )) 1123 Middleweight Vehicles RMW 2006
Figure 2.7 Normalized SEL* values measured from passages of middleweight trucks between 02:00 and 4:00 a.m. in 2009 versus the relative speed V/Vref; Vref = 70 km/h middleweight trucks.
y = 10.923Ln(x) + 78.604 50.0 60.0 70.0 80.0 90.0 100.0 0.5 1.0 1.5 2.0 V/Vref S E L * (d B (A )) 1689 Heavyweight Vehicles RMW 2006
Figure 2.8 Normalized SEL* values measured from passages heavy weight trucks between 02:00 and 4:00 a.m. in 2009 versus the relative speed V/Vref; Vref = 70 km/h for heavy weight trucks.
2.4.3
Evaluation
After a small decrease in 2006, the sound power levels for passenger cars as well as trucks in 2009 were at approximately the same level as in 2004 and 2005. Therefore no trend is present and the noise emissions over 2004-2009 can be considered constant for all categories. The rather large difference between the measured levels and the calculated values from the Dutch Calculation Method requires attention. There are at least two possible causes: heavy wear of the road surface layer and an underestimation of present-day vehicle emissions on dense asphaltic concrete pavements. The latter cause is supported by observations elsewhere (Peeters, 2009). If their preliminary findings – an underestimation of noise levels by 1 or 2 dB – are confirmed at more measurement sites, this may lead to a revision of the reference emissions in the standard Dutch calculation method.
2.5
Sample noise measurements in Utrecht
In addition to the continuous measurements at the motorway monitoring stations, in 2010 also a limited set of (manned) sample measurements have been carried out at medium speeds in an urban
environment. The aim is to evaluate noise emissions of different road vehicle categories in an urban environment and to compare results with emission data from the standard Dutch calculation method (RMW, 2006).
2.5.1
Measurement location and method
Measurements were carried out at the Amsterdamsestraatweg in Utrecht on a normal dense asphaltic concrete (DAC) pavement. For each vehicle pass-by, the SEL value and speed were registered. At the measurement site the speed limit is 50 km/h. The measurements took place on 11 May 2010, at 9 °C and cloudy but dry weather.
The measurement method followed the Statistical Pass By (SPB) method. The microphone was placed at 1.3 m height on a collapsible stand behind the observation car that was parked alongside the street. Besides the Lmax spectrum also the SEL value at pass by was measured using the ‘fast’ setting of the
analyser. The pass-by speed is assessed using a stop watch, rendering an accuracy of about ± 2.5 km/h. By means of the license plate number the database of RDW2
2.5.2
Results
on the internet was used to manually look-up the vehicle features (make and type, engine features, year of first registration).
From the measurement data the normalized SEL* values were determined for all vehicle pass by’s (see Appendix 3). In Figure 2.9 the SEL* of passenger cars is shown as a function of the normalized speed V/Vref and in Figure 2.10 this is done for vans. Both passenger cars and vans are classified in the Dutch Calculation Method (RMW, 2006) as ‘Light weight vehicles’. The reference speed for this class according to the Dutch standard calculation method is 80 km/h. In addition to the measurements, also the predicted SEL* values according to the Dutch Calculation Method are shown. The prediction according to this method is:
SEL*= 69.4+27.6*log(V/80).
y = 15.563Ln(x) + 71.357 40 45 50 55 60 65 70 75 80 85 90 0.2 0.4 0.6 0.8 1.0 1.2
normalized speed V/Vref
S EL* [ d B] Passenger cars SEL*_RMW06 Log. (Passenger cars)
Figure 2.9 Normalized SEL* values, measured for passages by cars at the Amsterdamsestraatweg on May 11, 2010 in Utrecht and comparison with predicted regression curve from (RMW, 2006).
y = 14.997Ln(x) + 71.603 40 45 50 55 60 65 70 75 80 85 90 0.2 0.4 0.6 0.8 1.0 1.2
normalized speed V/Vref
S EL* [ d B] Vans SEL*_RMW06 Log. (Vans)
Figure 2.10 Normalized SEL* values, measured for vans at the Amsterdamsestraatweg on May 11, 2010 in Utrecht and comparison with predicted regression curve from (RMW, 2006).
In Figures 2.11 and 2.12, results are given for buses and for middle weight trucks (RMW-class middleweight vehicles; SEL*= 73.2+19*log(V/70)). As the number of vehicles here is rather small, no regression curve has been plotted.
40 45 50 55 60 65 70 75 80 85 90 0.2 0.4 0.6 0.8 1.0 1.2
normalized speed V/Vref
S EL* [ d B] Buses SEL*_RMW06
Figure 2.11 Normalized SEL* values, measured for buses at the Amsterdamsestraatweg on May 11 2010 in Utrecht and comparison with predicted regression curve from (RMW, 2006).
40 45 50 55 60 65 70 75 80 85 90 0.2 0.4 0.6 0.8 1.0 1.2
normalized speed V/Vref
S EL* [ d B] Trucks SEL*_RMW06
Figure 2.12 Normalized SEL* values, measured for middle weight trucks at the Amsterdamsestraatweg on May 11, 2010 in Utrecht and comparison with predicted regression curve from (RMW, 2006).
2.5.3
Evaluation
It should be stressed, that the sample measurements in Utrecht do not compose a thorough validation of the noise emissions according to the Dutch standard calculation method. To this aim more
measurements at more DAC sites would be needed. However, at the investigated site at the
Amsterdamsestraatweg, the measured SEL* values agree well with the predicted values. Contrary to the motorway site N256 (see section 2.4), where the predicted emissions are 2-3 dB lower than the measured values, the regression curves from (RMW, 2006) for passenger cars and vans agree very well with the values measured at the Amsterdamsestraatweg up to 60 km/h (V/Vref~0.8). At higher speeds, measured values seem to be somewhat higher than predicted values, but to affirm this, more
measurements at higher speeds would be needed. The measured SEL* values for buses and middle weight trucks are well predicted by the (RMW, 2006) curve.
3
Railway noise
3.1
Monitoring stations ProRail
In 2005, the Dutch rail infrastructure management organization ProRail installed a small number of noise monitoring stations at specific locations of the railway network. RIVM has been granted access to the internet site with the measurement data. In this Noise Monitor, pass-by measurements taken at Esch and Tilburg are analysed, see Figure 3.1.
Esch
Tilburg
Figure 3.1 Measurement sites of ProRail. Tilburg (= mobile station) and Esch were operational during 2009. The monitoring stations have been equipped with a microphone at 7.5 m form the track. Recognition of passenger trains is automated by reading the RFID tags of the vehicles. Freight trains cannot be
identified this way, but a new filter module at the internet site now enables sorting out freight trains. The noise monitoring stations render the SEL spectrum of the whole train pass-by as well as SEL spectrum of the separate vehicles. In this report, only the A-weighted SEL of the whole train pass-by is used. A detailed description of the monitoring stations is given in Verheijen et al. (2008).
3.2
Results
The measurement data from the tracks and time periods given in Table 3.1 were used in the analysis. The selected months are based on periods in which the stations were fully operational.
The monitoring stations do not allow for a direct calculation of the Lden. This is because not all
pass-by's are measured: measurements are rejected if trains cross at both tracks just in front of the
microphone. Besides this, unfavorable (weather) conditions should be avoided. This means that only measurements that fulfill the following requirements are used: dry weather, wind speed below 8 m/s and stable train speed during pass by.
Table 3.1 Measurement period and track.
site track line period (in 2009)
Esch A Eindhoven – Utrecht Jan. and Jul.–Dec.
Tilburg A Breda – Tilburg Feb.–Nov.
Instead of evaluating the Lden, the railway noise is evaluated by comparing the measured normalized
so-called emission number E* with the value that it should have according to the national Computation Method (RMR, 2006) and the Emission Register3. The relationship between E* and the SEL is shown in Appendix 4.
The measured noise emission is presented with and without correction for the local rail roughness. However, as for location Tilburg no rail roughness spectrum is available, here only the uncorrected figures are presented. Applying a rail roughness correction is necessary if the measurement results need to be generalized.
The pass-by measurements of each relevant train category (out of the eleven categories distinguished in the national computation method) are averaged and then compared to the value given by the Emission Register for that category. The results for 2009 are summarized in Table 3.2 en Figure 3.2.
Table 3.2 Normalized emission number E* in dB(A) according to the Emission Register (Aswin) and its deviation from measurement (measurement minus computation) in Esch (Es) and Tilburg (Tb).
Aswin
Without roughness
correction With roughness correction
Category * speed [km/h] E* Es Tb Es Tb 1 140 65.5 0.1 1.2 0.9 - 2 140 66.7 -0.4 -0.4 0.3 - 3 120 62.6 - 2.4 - 4 90 63.4 1.0 -0.3 1.9 - 8 140 60.3 -2.4 -4.2 -0.1 -
Normalized Emission Number E* (1 ve hicle per hour) in dB(A)
55 60 65 70
1. Mat64 2. ICR/DDM1 3. SGM 4. Cargo 8. DDM2/ICM4/IRM
Aswin Esch Tilburg
Figure 3.2 Comparison of the emission number E* (normalized at 1 vehicle per hour) according to Aswin and the monitoring stations at Esch and Tilburg (without rail roughness correction).
The differences observed between measurements and calculations are mainly caused by:
- The local rail roughness. Rail roughness tends to grow slowly until ProRail commissions the rails to be ground. Although the Esch measurements could be corrected for roughness, the rail
roughness spectra used are somewhat outdated. Therefore it is expected that the measured results may differ up to 1 dB from the calculated results.
- The actual pass-by speed. The Emission Register gives only the maximum speed, not the average actual speed. As the actual speeds may differ, the measured emission may deviate somewhat from the calculated emission.
- Deviations due to features related to the rolling stock. For instance, the wheel roughness may vary slightly during the seasons. Variations of a few decibels on a seasonal scale are not exceptional (Verheijen et al., 2007a).
The measurement station at Esch is the only station that has been operational every year since 2006. The historical results, as can be found in the Noise Monitors since 2006, have been listed in Table 3.3. These series show that the normalized emission, corrected for rail roughness, can increase or decrease slightly between subsequent years. There is no clear trend.
Table 3.3 Deviation between measured and calculated E* in Esch with roughness correction (measurement minus computation). Category * 2006 2007 2008 2009 1 0.8 0.4 0.3 0.9 2 0.4 0.1 -0.7 0.3 4 - - - 1.9 8 0.6 0.7 1.6 -0.1
3.3
Influence of speed
The speed-dependency is assessed for the measurement site Tilburg. Though no rail roughness correction is available for this site, its 2009 dataset covers all important train types. Also, this site provides a large spread of pass-by speeds, unlike Esch. The speed-dependency is shown in Figure 3.3 for the five most common train categories.
If rail roughness deviates from the average network roughness, the effect is largest for trains with disk-brakes (smooth wheel tread), like category 8. As trains of this category are less noisy at this site than usual, the rail roughness at this location must be lower than standard rail roughness. It is remarked here that at present most of category 8 rolling stock consists of the IRM type, which is known to emit about 2 dB less noise than the category 8 curve, even on tracks with standard roughness (Verheijen, 2007b). This implies that only part of the lower emission for category 8 can be attributed to lower rail
roughness. The measured speed-dependency of the other trains (black regression line) compares well with the standard curve (green line).
50 60 70 80 90 100 110 40 60 80 100 120 140 160 Speed [km/h] LA eq [ dB (A )] Measurements RMR cat.1 y = 12.8Ln(x) + 31.4 Category 1 50 60 70 80 90 100 110 40 60 80 100 120 140 160 Speed [km/h] LA eq [ dB (A )] Measurements RMR cat.2 y = 15.9Ln(x) + 16.5 Category 2 50 60 70 80 90 100 110 40 60 80 100 120 Speed [km/h] LA eq [ dB (A )] Measurements RMR cat.4 y = 13.1Ln(x) + 31.1 Category 4 50 60 70 80 90 100 110 40 60 80 100 120 140 160 Speed [km/h] LA eq [ dB (A )] Measurements RMR cat.8 y = 13.5Ln(x) + 17.5 Category 8 50 60 70 80 90 100 110 40 60 80 100 120 140 160 Speed [km/h] LA eq [ dB (A )] Measurements RMR cat.3 y = 13.9Ln(x) + 23.3 Category 3
Figure 3.3 The LAeq of the pass-by is plotted versus speed (without rail roughness correction). The green curve shows the standard speed-dependency as calculated with the standard calculation method.
3.4
Conclusion
The railway noise emission at normal driving speeds, as measured at two monitoring sites in 2009, corresponds well with the calculated emission according to the national calculation method. Also, the speed-dependency of the noise emission, as checked at the Tilburg site, is in line with the national standard.
4
Airport noise
4.1
Introduction
There are several measurement systems for airport noise in the Netherlands that aim to monitor the noise levels as caused by airport noise by means of direct measurement. Amsterdam Airport Schiphol uses its own Noise Monitoring network, which is called NOMOS (NOise MOnitoring System). In addition there are the monitoring networks of ‘Geluidsnet4
4.2
Measurement set up
’, and 'Geluidconsult' using a ‘Luistervink’ system (Andringa et al., 2004) that acquire noise data in various municipalities in the neighborhood of airports. Rotterdam Airport uses the RANOMOS system that allows one to relate complaints from inhabitants to specific airplanes.
Although the output of these measurement systems is not used in legislation regarding maximum allowable noise levels (these are evaluated using standard calculation of noise levels), the monitoring sites do provide valuable information as to trend developments and validation of standard models. For an extensive discussion of noise monitoring systems for airport noise see Jabben and Potma. (2005) and Jabben et al. (2007).
As to the existing measurement systems, in general they do not provide - by standard - information on the noise levels caused by individual airplanes together with the type of the airplane. Such information can be useful, because in combination with the distance to the receiver the sound power levels
(indicating the amount of ‘emitted’ or produced noise) of airplanes in situ can be estimated. By consistently monitoring noise levels, airplane types and nearest distances between plane and receiver over relatively long periods of time, gradually a representative picture of noise emissions
characteristics of the airport fleet can be determined. Such an approach is often used in measuring noise emission in situ along roadways or railway lines, but both on national or international level it is not practice in airport noise.
4.2.1
Measurement site
In order to evaluate the possibilities to relate individual noise levels from airplanes to the type of airplane and to assess sound power levels in situ, a pilot study was set up at a measurement site in the Zegveld sanctuary. The location is shown in Appendix 1. The site is located approximately 17 km south of Schiphol Airport, and when the southernmost runways are in use (the ‘Kaagbaan’ and the ‘Aalsmeerbaan)’, the monitor can register planes taking off from or arriving at these runways.
4.2.2
Measuring apparatus
For this pilot study noise measurements were carried out using a RION NA-375
4 http://www.geluidsnet.nl/, visited in June 2010
5 http://www.rion.co.jp/dbcon/pdf/NA-37-E.pdf, visited in June 2010
. The NA-37 is capable of determining the sound source position based on sound arrival direction. The directional system
allows to separate airplane noise events from other (ground) noise sources. Ground noise events were eliminated from the measurement data before relating these to airplane passages. For each airplane noise events, the Sound Exposure Level and the maximum noise level were measured and stored.
4.2.3
Airplane data
In order to derive sound power levels of airplanes in situ using the measurements in Zegveld, data regarding:
− airplane type − speed and height
− minimum distance to the Zegveld receiver and − time of passage
is needed. These data are to be matched with measured noise events. They were estimated from aircraft transponder information for planes heading for or leaving from Schiphol Airport, which can be called back online using the Casper Live Aircraft Tracking website6
4.2.4
Determination of sound power levels
. As not all aircraft provide transponder information, not all noise events as measured at Zegveld could be matched to a specific airplane. Also the transponder information regarding the position points of the flight tracks is less accurate as compared to the FANOMOS database from air traffic control. The aim of the pilot however was to obtain a sample set of passages for which noise event level and flight data could be matched and not to determine accumulated noise levels of all planes passing by. To this aim the data was considered sufficient.
To first approximation, the airplanes were considered as omnidirectional point sources. Sound Power Levels (LW ref 10
-12
Watt ) were determined according to:
Lw ≈ SEL + 10log(4av) + 0.002a (4.1)
in which
LW : Sound Power Level in dB(A) ref 10
-12
Watt
SEL : Measured Sound Exposure Level at the receiver in Zegveld [dB(A)] a : minimum distance [m] between airplane and receiver during passage v : speed [m/s]
The last term in equation 4.1 accounts for an average noise attenuation of 2 dB per km due to air absorption.
4.3
Results
Measurements conducted in the first three months of 2010 were analysed according to the method described in section 4.2. In that period of time a total of 330 measured aircrafts could be identified using the Casper website. Of these aircrafts, 92 were taking off from Schiphol Airport, and 238 were approaching the airport. The full details of the different aircraft types are given in Appendix 5. Table 4.1 shows the calculated emission levels LW for the 238 approaching aircrafts, derived from the measured SEL levels using Equation 4.1. The columns show the LW levels rounded off to the nearest
show the total number of encounters for each aircraft type, and an average sound power level 〈LW〉
derived from all the sound power levels encountered for each aircraft type. Table 4.1 Distribution of the derived sound power levels LW for approaching airplanes.
type 121 123 124 125 126 127 128 129 130 131 132 133 134 135 136 137 138 139 140 141 142 143 145 Total 〈LW〉 a300-600 1 1 143 a310 1 1 143 a319 1 1 1 3 3 2 2 1 1 15 136 a320 1 2 4 3 1 1 1 13 136 a330-200 1 3 1 5 137 b737-200 1 1 2 134 b737-300 1 1 1 3 135 b737-400 1 1 1 3 134 b737-500 3 1 2 1 1 3 1 12 137 b737-600 1 1 1 1 1 5 135 b737-700 4 2 2 4 3 1 1 17 134 b737-800 1 7 2 6 14 11 10 3 5 1 60 133 b737-900 2 1 2 1 1 1 1 9 133 b747-200 2 2 4 137 b747-400 2 4 4 8 2 3 3 1 1 28 140 b777-200 1 2 5 5 3 2 1 1 20 134 bae-146-200 2 1 2 1 1 7 130 f100 1 1 2 1 2 1 8 130 f70 1 1 1 2 3 1 2 3 3 3 3 1 1 25 132 Average 135
The sound power levels show a range of more than 20 dB. The largest sound power levels were found for the relatively old Airbus types (A330 and A310), although these were only measured once. Of the aircraft types that were measured often (Airbus A319/A320, Boeing 737), the difference is relatively small, with a maximum difference of 3 dB(A). Of the larger aircraft types (Airbus A330, Boeing 747 and 777), the 6 dB difference in average sound power level between the older Boeing 747 aircrafts and the newer Boeing 777 aircrafts is remarkable. Finally it is found that the smaller aircrafts (BAe 146, Fokker 100 and 70) have relatively low sound power levels, which was expected as they have smaller engines.
Table 4.2 shows the results for the 92 airplanes taking off.
Table 4.2 Distribution of the derived emission levels LW for airplanes taking off.
type 132 133 134 136 137 138 139 140 141 142 143 144 146 Total 〈LW〉 a319 2 2 138 a320 1 1 3 1 1 7 139 a321 1 1 2 1 5 140 a330-200 1 2 1 1 5 143 b737-700 1 1 1 1 4 140 b737-800 2 2 2 10 6 1 1 24 140 b737-900 3 2 3 1 1 10 141 b747-200 1 1 137 b747-400 1 1 146 b767-400 1 1 132 b777-200 2 1 1 4 2 10 139 bae-146-200 1 1 1 1 4 135 bae-146-300 1 1 133 f100 1 2 3 2 1 1 10 140 f70 1 3 1 2 7 138 Average 140
Table 4.1 shows that for airplanes taking off the average emission levels are generally higher than for the approaching aircrafts, as the engines operate with higher thrust settings when taking off. The aircraft types that appear quite often (Boeing 737, Airbus A320/321) all have an average emission level of around 140 dB(A). The BAe 146 aircraft, commonly known as the ‘whisperjet’, indeed appears noticeably more silent than the other aircraft types.
It is also interesting to compare sound power levels of modern aircraft with obsolete airplanes like the military AWACS airplanes at use in Geilenkirchen (Germany). These airplanes, type Boeing 707, have now been fully phased out in civil flight traffic, but are still widely used at military airports. AWACS sound power levels during a take off range from 160-170 dB(A), to be compared with the average 140 dB(A) in Table 4.2.
4.4
Comparison with INM data
These measured results can be compared with sound power levels provided by the Integrated Noise Model of the Federal Aviation Association (FAA), which is widely used for evaluating aircraft noise (INM, 2007). From the INM model sound power levels LW in dB(A) can be estimated using different thrust settings for the aircraft types, and using an average height of 680 m (2000 ft) for approaching aircrafts and 1915 m (6300 ft) for aircrafts taking off. The details are given in Appendix 5.
Figures 4.1 and 4.2 show the measured and estimated sound power levels for aircrafts approaching and taking off respectively. The agreement for most aircraft types is reasonably well, save for some aircrafts which appeared only a few times. When the INM model predicts aircrafts having high noise levels, in general this is confirmed by the measurements. For instance for the Boeing 747 and the Airbus A300 aircrafts INM predicts relatively high levels. Also for the smaller aircrafts (the BAe 146 and the Fokker 100 and 70) the measured and estimated levels agree relatively well.
120 125 130 135 140 145 a 300-600 a 310 a319 a320 a 330-200 b737-200 b737-300 b737-400 b737-500 b737-600 b737-700 b737-800 b737-900 b747-200 b747-400 b777-200 ba e -146-200 f100 f7 0 Aircraft Type Lw (d BA ) Measured INM
Figure 4.1 Measured and estimated emission levels LW for approaching airplanes .
115 120 125 130 135 140 145 150
a319 a320 a321
a330-200 b737-700 b737-800 b737-900 b747-200 b747-400 b767-400 b777-200 ba e- 146-200 ba e- 146-300 f100 f70 Aircraft Type Lw ( d BA ) Measured INM
Figure 4.2 Measured and estimated emission levels LW for airplanes taking off.
It should be noted that the measured data only represent a relatively small sample of the total airplane fleet. Also, in comparing the measured SPL with the INM data, we have made assumptions regarding the thrust settings of the engines, which increase uncertainties.
The results do show that the measurement set up in combination with flight data allows to identify in situ the noisy airplanes from more quiet airplanes. It also allows to evaluate the constitution the ‘average’ fleet of an airport and to which extent it uses the quietest airplanes available. The tentative results as found in this pilot, seem to endorse the effect of Schiphol Airports policy to use the newest and most quiet aircraft available.
5
Conclusions
Road noise
- For the first time since 2006, the noise level at the A10-West site in Amsterdam in 2009 has decreased with respect to the year before. Since 2006 the noise level was increasing with approximately 1 dB each year, which was probably caused by silt up and texture wear. In 2009 a decrease of 1 dB was measured with respect to 2008. Although a slight decrease in traffic intensity was found in 2009, it can not explain fully the 1 dB reduction.
- The noise reduction obtained in 2007 at the A12 motorway near Voorburg sustains in 2009. This reduction is caused by repavement with double layered porous asphalt and by a speed limit reduction.
- The noise emission of the N256 site in Noord-Beveland (DAC road surface) is substantially higher than predicted by the Dutch calculation method. Similarly, the A2 site and the sample
measurement sites of chapter 3, all paved with DAC, exhibit higher noise emissions. Apparently, noise emission on DAC may deviate considerably from the reference values.
Railway noise
- The differences between the noise emissions measured at sites Esch and Tilburg in 2009 and the emissions as calculated using the national computation method (RMR, 2006) are within 2 dB. Higher deviations are found if the measurements are not corrected for rail roughness.
- Part of the differences can be explained by the fact that the passenger trains run at lower speeds than those listed in the Emission Register (‘Aswin’).
- Furthermore, a noise versus speed dependency analysis was performed for the data from the Tilburg site. It was found that this dependency of the noise emission is in line with the national standard.
Airport noise
- Measurements performed in Zegveld sanctuary can clearly identify airplanes approaching and taking off from Schiphol Airport.
- Combining the measurements with flight data allow to distinguish in situ between the noisy airplanes from more quiet airplanes. The tentative results seem to endorse the effect of Schiphol Airports policy to use the newest and most quiet aircraft available.
- The measured Sound Power Levels were subsequently compared with levels provided by the Integrated Noise Model of the FAA. It was found in this study that the measured and predicted levels agree fairly well.
References
Andringa, T.C., van Hengel, P.W.J., Muchall, R., Nillesen, M.M. (2004) Aircraft sound level
measurements in residential areas using sound source separation, Proceedings of Internoise conference, Prague.
INM (2007) Integrated Noise Model (INM) version 7.0 User’s Guide, Federal Aviation Administration, Washington DC.
Jabben, J., Potma, C. (2005) Praktijkmogelijkheden Geluidmetingen Luchtvaart in het buitengebied van Schiphol, RIVM Report number 680001001, RIVM, Bilthoven.
Jabben, J., Potma, C., du Pon, B. (2007) Geluidmonitor 2006 (Noise Monitor 2006), RIVM Report number 680300004, RIVM, Bilthoven.
Peeters, B. (2009) Actualisering emissiegetallen wegverkeer in het RMW, Proceedings national congress 'Geluid, Trillingen en Luchtkwaliteit'.
Schreurs, E.M., Verheijen E.N.G., Potma, C.J.M., Jabben, J. (2008) Geluidmonitor 2007 (Noise Monitor 2007), RIVM Report number 680740001, RIVM, Bilthoven.
RMW (2006) Ministry of Housing, Spatial Planning and the Environment, Appendix III to chapter 3 on Road Noise of the Reken- en meetvoorschrift geluidhinder 2006.
RMR (2006) Ministry of Housing, Spatial Planning and the Environment, Appendix IV to chapter 4 on Railway Noise of the Reken- en meetvoorschrift geluidhinder 2006.
Verheijen, E.N.G., Roovers, M.S., van den Brink, J.W. (2007a) Statistical analysis of railway noise: trackside monitoring of individual trains, Proceedings of the International Workshop on Railway Noise and Vibrations, Paper S5.1, Munich.
Verheijen, E.N.G. (2007b) Geluidemissie van de spoormaterieelcategorieën, Onderdeel 2 van project Analyse gegevens geluidmeetposten, report no. PRO020-01-16.
Verheijen, E.N.G., Roovers, M.S., van den Brink, J.W. (2008) Railway Noise Statistics by Monitoring Stations – Input for Dutch Prediction Method RMR and Track Access Charging, Noise and Vibration Mitigation for Rail Transportation Systems NNFM 99, pp. 165-171.
Appendix 1 Measurement sites
Site A2, Breukelen as of June 2010
Amsterdam
Utrecht
A2
17 m 5 m 1.5 m Direction Amsterdam 89 m Direction Utrecht Sound pathAppendix 2 Description of measurement equipment
Figure A2.1 Measurement system on monitoring locations.
Figure A2.1 shows how the measurement system is used as noise monitor. One noise monitor consists of:
- microphone stand+pre-amp, manufactory Larson-Davis, type 2100K; - microphone, manufactory Larson-Davis, type 2541;
- statistical Analyser, manufactory Larson-Davis, type 870; - gsm-modem with antenna;
- battery and charger; - container.
This type of microphone stand is useful for measurements outside. The microphone itself is equipped with a rain cover and heating. The pre-amp has a heating to prevent the amp from moisture. The microphone is covered with a wind screen. The microphone stand comes with built-in pre-amp to amplify to the signal. To prevent the microphone and the pre-amp from moisture, silica gel is used and will be replaced every three months. The statistical analyser measures the signal of the microphone and calculates various statistical parameters like A-weighted level LAeq.
The analyser has an internal GSM modem with antenna, which is connected to the microphone. A computer attached with a standard modem has to connect to the GSM modem, in order to retrieve the measurement data. On this computer a NMS (Noise Monitoring System) application of Larson-Davis has been installed. The measurements collected from all locations are stored on a NMS database on a monthly basis. Microphone cover antenna Microphone container charger battery Power supply
Appendix 3 Measured versus calculated noise N256
In order to make a direct comparison with the noise emissions of the legal computation method, the normalized SEL values (SEL*) measured at the N256 motorway have been plotted against the ratio V/Vref. The measured SEL* is defined as:SEL*meas = SEL meas + 10·log(V/3600) + 10·log(R) + Dground + Dair (A3.1)
where:
SEL* = normalized SEL value
SEL = sound exposure level (dB(A)) of the measured vehicle pass-by
V = speed (km/h)
Vref = reference speed (80 km/h for light vehicles and 70 km/h for middleweight and heavy vehicles)
R = distance lane – receiver (6.7 en 9.2 m for nearest and farthest lane, respectively) Dground = ground attenuation according to (RMW, 2006), set at an average value of 1 dB
Dair = air attenuation ~ 0.1 dB
According to the (RMW, 2006) the normalized SEL* value is given by:
SEL*RMW06 = a + b·log (V/Vref) (A3.2)
If the measured SEL*are plotted against the normalized speed V/Vref a logarithmic regression curve through the measurement points should coincide closely with according the curve given in (A3.2), which gives the predicted SEL*RMW06 values.