Effects of nine election platforms
on the economy and the environment
Chapters 1: Background information and approach
and 2: Summary overview
The Hague, May 20th, 2010
1
Background information and approach
“There is no such thing as a free lunch”
1.1
A difficult point of departure
The point of departure with respect to government finances is an extremely unfavourable
one for future governments. The credit crunch resulted in a 4% shrink in the Dutch
economy in 2009, which is an historic all-time low. The aftermath of this shock has
caused considerable problems for government finances. We anticipate that there will be a
4.9% budget deficit by 2011. At the same time, the ageing of the population will take a
heavier toll on the government budget than was previously forecast. People are living
increasingly longer, and in increasingly better health. Although this is good news, it does
create financial problems for the government. Unless the government amends its policy,
the combination of the credit crunch and the ageing population will result in a
sustainability deficit of 4½ % of the gross domestic product (GDP), i.e. 29 billion euros,
by 2015. Our society will have to come to an agreement sooner or later on measures for
covering this deficit. This poses a tremendous challenge for political parties, comparable
in magnitude to the budget cuts implemented after the 1983 Wassenaar Agreement. This
analysis shows that all the parties involved have taken up this challenge.
Retrenchments of this order can only be achieved by implementing structural
measures. Such measures have one feature in common: the results of the policy will only
become visible after some time has elapsed. There are a number of reasons for this: first
of all, citizens must be given time to prepare themselves for the new policy, and
substantial changes can only be introduced at a gradual rate. In addition, a great deal of
new policy affects the influx and outflow in a scheme in the first instance, not the number
of persons who benefit from this scheme. For this reason, the effects on the number of
people —and thereby on government finances— will only be discernible in the long term.
However, the reverse is actually true in the short term. Most retrenchment measures
result in a decrease in demand during the first four years, and thereby in a lower GDP and
higher unemployment. A political party which implements more cutbacks will initially
suffer more from this type of negative effect. The economic situation will eventually
enter a new upswing, and the structural effects will prevail. This also corresponds with
experiences gained from retrenchments after the Wassenaar Agreement, whose
magnitude was comparable to the present task confronting political parties during the
next four years. The favourable results of these retrenchments did not actually become
plainly discernible until 1990. Since retrenchments are inevitable in any event, the
primarily a question of the rate at which cutbacks are implemented. After all, these
cutbacks will have to be made sooner or later.
However much the structural long-term effects may be surrounded by uncertainty,
they are of far greater significance to a political assessment of the consequences of policy
than the cyclical effects. Political parties’ fundamental political choices are actually
revealed in the long-term effects. Does a certain party attach more value to equality of
income or to growth? Does a party give priority to education for the younger generations,
or to the care of the elderly? Does a party consider it to be worthwhile (or not) to pay a
high price for ensuring a clean environment and restricting emissions of greenhouse
gases? It is these more structural choices which demonstrate how a party sets its political
priorities, and the main purpose of this study is to portray these choices. For this reason,
not only the consequences with respect to 2015 are of importance when assessing an
election programme, but we must also examine the structural effects for the long term.
This, the latest edition of Keuzes in Kaart (Charted Choices), consequently perpetuates
the trend in which increasing attention is devoted to the structural long-term effects of
party programmes.
1.2
Financing deficit, GDP and prosperity
It is self-evident that an assessment of election programmes does not focus solely upon
their effects on government finances. The electorate is also interested in the effects of the
proposed programmes on the GDP, and on prosperity in the Netherlands in a broader
sense, not least because a higher GDP will eventually contribute to sound government
finances. As is customary, we have used a broad concept of prosperity: we have taken
into consideration all factors which the public considers important, including e.g. the
environment, travelling time, noise pollution and leisure. However, we have been obliged
to limit ourselves in this study to effects of considerable importance, and to effects on
which there is sufficient information available to enable us to give a reliable assessment
of them. If the latest scientific and technical knowledge does not provide a sufficient
basis for a well-considered opinion, politicians and the electorate will have to make a
choice on other grounds. Therefore, if science is unable to give a reliable assessment of
the effects of prosperity, this does not mean that the relevant proposals made by a certain
political party are unable to withstand criticism; it only means that the available
information is insufficient to enable us to arrive at a balanced opinion.
of planning offices. In between elections, planning offices do continue working on the
further expansion of the relevant knowledge in order to ensure an improved response to
the existing need for information in subsequent editions. Incidentally, the political parties
themselves constitute a major driving force behind planning offices’ increasingly
far-reaching analysis of their election programmes, because they urge them to depict the
prosperity effects in an increasing number of areas.
Another disadvantage to the planning offices’ cautious approach is that political
parties have a tendency to refrain from allocating resources to policy areas in which it is
difficult to give a satisfactory assessment of the prosperity effects, because the parties
feel that it is more difficult to account for this kind of expenditure to the electorate. These
problems occur e.g. in the case of proposals for institutional reforms in the health care
sector. They also occur with respect to proposals for promoting research and
development. Although it is well-known that research and development have significant
external effects, there are few in-depth studies that give an insight into how the
government can effectively stimulate them. In all cases where we have refrained from
giving a balanced opinion because there is insufficient scientific evidence available for
such an opinion, we will explicitly state this.
Since the planning offices do not give any political opinions —which, after all, is
strictly the prerogative of political parties— this analysis can solely be based on a factual
analysis insofar as this relates to the budgetary effects, and solely on a widely-supported
scientific opinion if it relates to the social impact on the GDP and prosperity. This kind of
scientifically-substantiated assessment requires meticulous preparation, including
verification by external experts. It is the duty of the planning offices to ensure permanent
monitoring of those areas in which it is possible to give a scientific opinion of this kind.
Theoretically, as we have said, we have demonstrated the effects on prosperity.
Although this is sometimes too ambitious, it is nevertheless possible to chart the effects
on the GDP. For example, we are able to give a reasonable insight into the prosperity
effects
1with respect to the analysis of the housing market, whereas we are obliged to
limit ourselves to the effects on the GDP with respect to investments in knowledge.
Although prosperity and the GDP are related concepts, they are by no means identical.
21.3
Sustainability of government finances
This study examines in detail the effects of election platforms on the sustainability of
government finances in the long term. Roughly speaking, government finances are
1
CPB Housing market study. 2
See op.cit. for a comparison between these two concepts, and for an explanation of why it is often simpler to show the effects on the GDP than those on prosperity.
are maintained (“unchanged policy”). At the present moment, therefore, this is not the
case, as we indicated in paragraph 1.1. There is a sustainability deficit of 29 billion euros
a year, measured in 2015. There are many different ways of resolving this problem. For
example, a party may propose an immediate retrenchment of 29 billion euros. However, a
party may also decide to pursue a more gradual route by increasing the retrenchments by
one billion euros every year. Furthermore, a party may resolve to postpone part of this
choice, and only indicate ways in which the retrenchments can be achieved during
subsequent governments’ terms in office. From an economic point of view, the rate at
which retrenchments are implemented within stringent preconditions
3is primarily a
political choice, although there are a great many arguments in favour of already
specifying, at the present date, how and when the retrenchments will be implemented.
Since uncertainty has a deleterious effect on the investment climate, this study has
therefore adopted two ways of demonstrating the range of options for counterbalancing
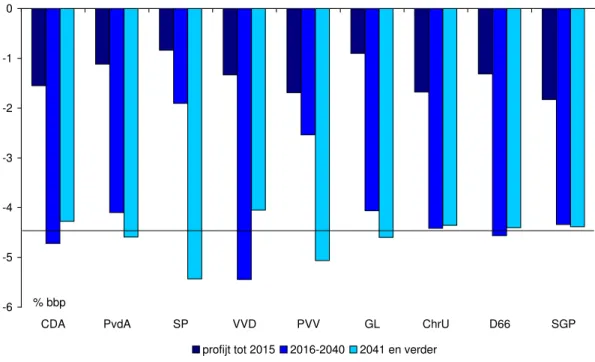
the sustainability deficit. Firstly, we indicate the part of the sustainability deficit for
which a party has already put forward specific proposals. This means that the party is
postponing making a choice for the remainder of the sustainability deficit. Secondly, we
give an approximate indication for each party of how this party intends to distribute the
tax burdens attached to the necessary adjustments among a number of generations, by
showing the course of the government’s financing deficit over time. The greater the
deficits during the first few years, the more tax burdens will be passed on to future
generations.
4With respect to the sustainability analysis, we have taken into consideration the
influence of changes in the population’s age structure on the effects of a proposed policy
measure. For example: although reducing additional allowances for senior citizens has a
favourable effect, even now, on the government’s financing deficit, this effect will be
even greater in the future, because more senior citizens will be entitled to such
allowances. In addition, some of the proposed measures will only be implemented at a
gradual rate. One instance of this is that a number of parties advocate raising the
retirement age in phases. Therefore, when making the sustainability analysis, we have
taken account of the impact of the measures after the end of the next government’s term
3
The precondition is that the financial markets remain confident that the debts will be repaid one day. In this respect, the Netherlands is now closer to the critical limit, due to the considerable increase in the financing deficit in 2009 and 2010.
4
In order to ensure a consistent picture, we are assuming in this respect that the sustainability deficit will have been eliminated by 2040 anyway, irrespective of whether the parties specify how they intend to achieve this. The pattern of the financing deficit over time merely gives an initial indication of the distribution of the tax burdens among the generations. After all, it does make a difference whether the
in office. However, the only measures that CPB has included in its calculations are those
that will actually affect individual citizens as early as the next government’s term in
office: either with respect to their incomes, or because their conduct during the coming
years will determine the rights they are building up for the future. This study does not
examine measures that will not have any actual impact until subsequent governments take
office. In addition, we have maintained consistency with respect to the institutions, in all
cases with effect from 2040. This means that measures that change institutions very
gradually over a long period of time, such as not indexing tax brackets, will be abolished
in 2040.
1.4
A threat to democracy?
As this is the seventh edition of Keuzes in Kaart, our analysis of party programmes has
now become an institution. The fact that there is a pressing social need for Keuzes in
Kaart
has emerged from the steadily-increasing number of political parties that have their
programmes analysed (nine in this edition), the increasingly comprehensive questions
they ask the planning offices, and the tremendous social interest in the outcome of this
analysis. Up till quite recently, the Netherlands was the only country in which this type of
analysis was carried out. However, the Institute of Fiscal Studies took the initiative to
conduct a similar analysis in connection with the recent elections in the United Kingdom,
and this analysis attracted a great deal of attention there as well. In the meantime,
therefore, it has become evident that this need is no longer unique to the Netherlands.
The fact that Keuzes in Kaart has meanwhile become an institution does not mean that
the analysis is undisputed. This edition of Keuzes in Kaart was already the subject of
public debate before publication, to an even greater extent than during previous elections.
One frequently-recurring point of criticism is that Keuzes in Kaart restricts the political
process: critics have claimed that the planning offices gave parties “report marks”, which
replaced the essential political debate, and the ultimate political choices that ought to
follow on from this debate. It is not in itself surprising that the political debate is more
vehement this time around than it was during previous elections. The credit crunch and
the magnitude of the sustainability deficit have ensured that budgetary policy will be a
major issue during the forthcoming elections, and for this reason, it would be beneficial
to focus more closely on the significance of Keuzes in Kaart with respect to the
democratic process.
First and foremost, we have conducted this analysis at the sole request of the relevant
parties themselves. The parties are entirely at liberty to participate in this analysis, and
are likewise entirely at liberty to draw their own conclusions from it. The only parties that
have participated are those that wish to do so. The analysis is not a “report mark” or a
the programmes are satisfactory, although they do contain divergent political choices. If
in this study we conclude that a certain political party does not do a great deal to limit
CO
2emissions, this is not a value assessment: it is a plain statement of fact. It is quite
possible that this party does not consider climate change to be a serious problem, and
therefore does not intend to spend money on limiting emissions. This is a legitimate
political choice. It is up to the party in question to defend its choice, and it is up to the
electorate to pronounce judgement on this choice.
What explanation can there be of this tremendous interest in Keuzes in Kaart? Are the
parties themselves unable to defend their priorities vis-à-vis the electorate? Why is there
a need for an independent and factual analysis of party programmes? Or, in other words,
what contribution can an independent analysis make to the political process? This added
value lies in the fact that political parties sometimes have a natural inclination to
propagate their message more favourably than is justified by the facts. If they subject
their programmes to an independent and factual analysis, they increase the credibility of
their message. Perhaps it sounds somewhat harsh to say so, but it is not fundamentally
any different to a salesman who incorporates an independent organisation’s opinion into
his sales talk. This is the salesman’s personal choice, and it is up to the customers to
decide which product they prefer, although they are able to consult an independent
institution’s opinion on the quality of the various alternatives when making their choice.
In the same way, Keuzes in Kaart therefore does not constitute a restriction of the
political process. An analysis based on scientific views does not serve to replace political
campaigns. It enables the parties to highlight their message in their campaigns in a more
credible manner, and it enables the electorate to make a more well-considered choice.
The political debate does not mean that facts and scientific views are irrelevant. Keuzes in
Kaart
actually reinforces the political debate by incorporating such facts and scientific
views into its analysis.
In addition to providing a service to the electorate, previous editions of Keuzes in
Kaart
have played a useful role in the formation of a new government after a general
election. The analysis gives an overview of the consequences of implementing the
various political parties’ proposals; this overview provides a starting point for
negotiations on a coalition agreement for the next government. In this way, CPB’s and
PBL’s analyses facilitate a satisfactory exchange of information between the parties on
the effects of their programmes with respect to all political differences of opinion which
naturally exist among the parties. However, it is also true here that it is up to the parties,
as well as to the politician who investigates on behalf of the Crown whether a proposed
1.5
Issues included in the analysis
First of all, this edition of Keuzes in Kaart gives an analysis of the effects of the various
election programmes on government finances, during the next government’s term in
office as well as in the long term. In addition, the planning offices also chart the average
income effects and employment effects in the long term, as well as analysing the effects
in a number of specific fields, i.e. accessibility; climate and energy; agriculture, nature
and countryside; education and innovation; the housing market; and the health care
sector.
Due to lack of time, we were unable to calculate the macro-economic effects for the
medium term, and for the same reason, it was not possible for us to calculate the
purchasing power effects in detail. However, these effects actually occupy a relatively
prominent place in the current programmes. Political parties’ programmes (considerably)
improve the EMU balance by implementing cutbacks in public-sector expenditure, and
also, in most cases, by increasing the tax burdens. This often has a (negative) effect on
disposable household incomes and/or corporate profits. Incidentally, CPB will be able to
calculate the macro-economic effects during the next government’s term in office, as well
as an analysis of the purchasing power effects, for the benefit of the cabinet formation.
In order to be able to comment on the consequences for purchasing power (and
profits), we have given an account of the policy-related effects on purchasing power and
profits (BKW) of the various programmes. This account (the BKW) is new and gives an
approximate insight into the effects on disposable income, and on profitability, of
measures relating to expenditure as well as to revenues. With respect to purchasing
power, the measures in question relate to subsidies and bonuses, tuition fees, student
finance and child benefit, the benefit income rate, and tax burden measures for families.
With respect to profits, the measures in question concern subsidies for companies
(including subsidies for companies in the areas of Energy/Environment and
Agriculture/Nature) and tax burden measures for companies.
This is the first time that the consequences of the programmes for accessibility and
mobility have been analysed and presented as a separate issue. We have used the
National Traffic and Transport Model System as a basis for this analysis.
5Since the previous elections, CPB has invested a great deal in an instrument for
demonstrating the effects of knowledge policy on (material) prosperity in a qualitative as
well as a quantitative sense. Unfortunately, the fall of the government has considerably
5
This is the ‘standard’ traffic and transport model at national scale level, and is used for calculating the effects of the Policy Document on Mobility (2004) and the Policy Document on Tackling Mobility (2008).
of a large part of the measures for education at long-term GDP level this time. This
means that we will be showing the revenues as well as the costs with respect to
expenditure for education. The measures relating to science and innovation are assessed
in a qualitative sense.
The analysis of the housing market effects is limited to measures which act directly on
the housing market. However, household incomes have a major impact on the housing
market as well. Higher incomes result in greater demand, higher house prices, and
ultimately a greater number of homes available on the market. Therefore, measures that
affect household incomes —and this applies to almost all measures —
will also affect the
housing market. However, this analysis does not take into consideration the effects via
household incomes; this is partly due to the absence of a macro-economic calculation.
With respect to the housing market, it is also true that planning offices can make
additional analyses for the cabinet formation, particularly in the field of capital gains
taxes levied on corporations, the prosperity costs of transfer tax, and a differentiation of
owner-occupied houses according to price level in the effects of measures relating to
mortgage interest relief.
1.6
Practical procedure
The planning offices have given as accurate an estimate as possible of the costs and
revenues of the measures, as well as the consequences of these measures. All
programmes have been assessed in the same manner. The purpose of the analysis is to
prevent a discussion on the facts from arising, so that the election debate can concentrate
on what it is supposed to be about: political choices. The analysis ensures that it is not
profitable to represent the advantages of parties’ own proposals as being greater (and the
costs as being lower) than is justifiable, on the basis of an unfounded optimism, since
parties do not have access to unlimited funds. Moreover, the analysis increases the degree
of comparability among the parties. If two parties propose exactly the same project, the
same costs and revenues are calculated as well. This study takes the measures that the
parties have submitted to the planning offices as a basis. We have not verified whether
these measures correspond with the proposals put forward by the parties in their election
platforms. In principle, readers can check these personally on the basis of the description
of the proposed measures given in this study.
proposals, and political parties were only too pleased to make use of these analyses. The
assessment agency was involved as an observer in the work carried out by most of these
committees. CPB contributed to the analyses, and in cases where the analyses were
conducted by others, CPB was able to form an opinion on their quality. For this reason,
we have fully reproduced the views of these committees in Keuzes in Kaart in the
majority of cases. CPB’s opinions deviate from those of one of the committees with
respect to a number of points. In such cases, CPB informed the political parties of this
immediately after the reviewing committees published their reports.
6This also
demonstrates that we endeavour to achieve the greatest possible degree of transparency
regarding the way in which we assess policy proposals; this is partly at the request of the
participating political parties.
To what extent is the outcome of this analysis susceptible to the strategic behaviour of
political parties
? Or, to put it more bluntly: could the parties misuse certain features of
the planning offices’ models? The quote at the beginning of this chapter is applicable
here, as is another of CPB’s mottoes: No pain, no gain. Politics is all about making
choices, and such choices almost invariably result in winners as well as losers. This is an
inherent part of politics. After all, if a measure only resulted in winners, this measure
would obviously have been implemented long since. Therefore, there are probably
disadvantages as well as advantages attached to each measure. Although a greater labour
market participation will increase economic growth, prosperity is more than growth
alone: for example, it takes its toll on people’s free time. Other considerations to be
weighed up include growth versus equality of income, or tax burdens for the present
generations versus tax burdens for future generations. The parties themselves determine
what choices they wish to make in this respect.
The planning offices always depict the advantages and disadvantages in all good faith.
If the analysis of a measure only shows its advantages in the first instance, this should be
viewed with suspicion. After all, if a free lunch is available, why has it not been
consumed by someone else long before now? And is such a measure feasible? Two
typical examples are ‘ensuring that civil servants work more efficiently’ and ‘cutting civil
servants’ salaries’. All political parties are in favour of a government that works as
efficiently as possible. If it were possible to make the government more efficient, why
has this not been done before now? This kind of retrenchment will only be credible if
extremely specific details are given on which activities will no longer be performed by
the government in the future. In that case, the proposed measure would not be a “free
6
government services) compensate for the benefits of fewer demands on the Treasury.
And if the government were able to find the right people to work for them even if lower
salaries were offered, why have they paid their staff too much during the past years? This
is why we should regard this kind of measure with scepticism. Since there was already a
great deal of debate on these two points prior to the publication of this study, we have
devoted considerable attention in Chapter 2 to the possibilities and impossibilities
concerning civil servants’ salaries and government efficiency. A similar attitude can be
applied to the Netherlands’ contributions to the EU. A reduction in these contributions is
a typical example of a “free lunch”, since who could possibly be opposed to it? Planning
offices are sceptical by nature with respect to all these points. Political parties are
naturally at liberty to advocate such measures, and these arguments may even contribute
to less expenditure with respect to the government and the EU, because they force these
organisations to implement more efficient management, but they could also result in
fewer government services, or in erosion of the EU budget due to a “race to the bottom”
among the EU member states. There is no objective basis for the planning offices to
assign revenues to this.
This study only includes measures that are essentially legally feasible. However, this
does not mean that we have conducted an extensive legal feasibility study on each
measure. That does not lie within our purview, and moreover, the legal framework is set
by politicians. Consequently, legal feasibility is also a question of political priorities to a
certain extent, although the legislation procedure and existing legal statuses do set limits
to what is actually possible; we have not included measures in cases where they exceed
these limits.
The above makes it clear that, besides a multiplicity of models for specific markets,
common sense
is an essential input for this analysis: each measure is assessed according
to its feasibility. Therefore, the aggregate of analytical instruments at the planning
offices’ disposal, as well as their experience, enable them to examine which analytical
instrument is the most suitable for analysing a certain specific policy measure in each
separate case.
1.7
Time restrictions resulting from the fall of the government
kind of analysis takes a longer time to prepare, because we first have to chart the
immediate effects before analysing the cyclical effects.
In this edition, moreover, CPB has not included any ‘purchasing power pictures’
containing the effects on various income groups’ purchasing power. A calculation of the
cyclical effects is required for this kind of analysis, but unfortunately we did not have
sufficient time for this. Moreover, compiling ‘purchasing power pictures’ takes a great
deal of time as well. In previous years, the draft report of purchasing power effects was
often an incentive for political parties to adjust their programmes in order to counteract
undesirable purchasing power effects. Although this is in itself an understandable aim, we
simply did not have the time for this kind of iteration.
2
Summary overview
2.1
Introduction and general overview
The purpose of this analysis of election platforms is to identify the choices made by political parties: if a party concentrates a great deal of policy on one category, this must have
consequences (relatively less favourable ones) for another field. Table 2.1 summarises the goals being pursued by parties and the outcomes in respect of various elements. The table shows the differences compared with the baseline. It is obviously not possible to sum up the ideas and measures of parties in respect of a certain field under a single indicator. The analysis covers numerous indicators for each subject and even then the analysis remains of a general nature. Parties can also achieve a similar result through completely different interventions. Two examples: accessibility can be improved by investing in roads, but also by introducing road pricing. Prosperity gains are attainable in the housing market by limiting tax relief on mortgage interest, but also by liberalising the rented homes market. Parties make completely different choices in this respect. The sections that follow therefore look in more depth at all elements. The indicators are also explained in the sections.
:ERROR!STYLE NOT DEFINED.
2
Tabel .1 Summary overview (changes relative to basis, unless otherwise mentioned)
CDA PvdA SP VVD PVV GL ChrU D66 SGP Improvement EMU-balance 2015 (euro
bn) 18 11 10 20 15¾ 10¼ 16 14¾ 18
Sustainability of public finances (euro bn) 33 31 16 39 17 35 35 37 32 Purchasing power of households (euro
bn) − 3½ + ¼ + 1¼ − 1½ − 2 0 − 2¾ − 3 − 8
Profits of companies (including housing
corporations) (euro bn) +1 − 1 − 4¼ − 1¼ − 2¾ − 4¼ − 4¾ − 1¾ − 1¼ Structural employment (% point) 4 2½ − 1 5¾ ¼ 4½ 1¼ 3¾ 2½ Accessability (welfare gain, bn euro) ¾ ¾ – ¼ ¼ ¼ – ½ ½ ¾ ½ Car usage(2020, in %) − 10 à − 15 −10 à-− 15 0 0 0 – 20 – 10 à –15 – 10 à-− 15 – 15 Public transport usage(2020, in %) +5 à
10 +5 à 10 + 5 0 0 + 15 +5 à 10 + 10 +5 à 10 Reduction of greenhouse gases (Mton
Co2) 36 44 21 2 2 63 38 31 28
Quality of nature (2020) 0 + + – – – ++ 0/+ 0/+ 0
Quantity of nature (2020) 0 + 0/– – – – + 0 0/+ –
GDP effect education (structural, %) 2¼ 4¾ ¼ 4 ¼ 4¼ 1¾ 3¼ 3¼ Science/innovation (budget, mld euro) − 0,07 − 0,2 − 0,06 − 0,1 − 1,2 + 0,4 − 0,33 + 0,2 + 0,22 Housing market (welfare gains % bbp) 0,1 0,5 0,4 0,3 − 0,1 0,8 0,5 0,9 0,7 Change in house prices (2015, %) − 1 − 7 − 6 − 2 0 − 6 − 5 − 10 − 6 Change in net rent (2015, %) 5 1 − 3 10 0 6 6 10 8 Health care, employment, 2015, thsnd ) – 10 – 15 +15 – 50 +10 +15 – 30 – 40 – 35 Own risk health insurance (2015, level,
euro) 230 200-600 0 300 210 150-300 200-600 210-400 150-500 More (+) or less (− ) market forces cure + 0/+ – – ++ 0 0/+ + ++ +
From section 2.2 there is for each category a more detailed examination of the outcomes and of the similarities and differences between parties. Chapters 3 to 11 provide a more detailed analysis of the proposed measures and their outcomes.
Economic effects of spending curbs and increased taxes and premiumsa
Due to the early general election the CPB is unable this time to present an analysis of the macro-economic effects of the different election manifestos. This sidebar looks at the macro-economic consequences of spending curbs and of raising taxes and premiums in general, i.e. unrelated to an election manifesto.
The reference marker for the effect of spending curbs is a structural austerity policy amounting to 15 billion euros, or 2½% of GDP, from 2011 to 2015. The package of measures has been broken down into six parts and the weighting of each part is equal to the weighting in public finances in 2011. The table below shows the relative significance of the six parts. The medium-term macro-economic consequences of the spending curbs were set against the Economic Forecast for 2011-2015 and are presented in the table on the next page.b
Composition of package of spending curbs, as % of total
Public sector employment 19
Volume of material government consumption 25
Price of income transfers (including unemployment benefits) 26
Development aid 1
Volume of healthcare expenditure (particularly under the Exceptional Medical Expenses Act) 25
Price of subsidies/grants 4
Most spending curbs in public sector expenditure will reduce domestic demand in the first instance. Lower domestic demand leads to less production and rising unemployment, which in turn lead to a lower rate of inflation and lower contractual wages in the private sector (see table on next page). The short-term effects on public finances are twofold. Firstly, the EMU balance will improve because of the actual spending curbs, and because public sector wages and social security benefits will rise less because of lower inflation and a lower increase in contractual wages in the private sector. Additionally, the lower wages and prices improve price competitiveness, so exports and production will increase with favourable effects on public finances. Secondly, the increase in the number of unemployment benefits and lower tax revenues from payroll tax and income-tax and VAT mean that the EMU balance will deteriorate. Most measures will cause a negative knock-on effect in the medium term, after approximately 5 years, in the sense that the improvement in the EMU balance will be less than the amount of the initial spending curb. The negative knock-on effect of the entire package will be more than 40%: the spending curbs of 15 billion euros improve the EMU balance by an estimated 8.6 billion euros.
The scale of the negative knock-on effect differs from measure to measure. Reducing public sector employment has a relatively large negative knock-on effect in the medium term. This measure immediately causes less employment and increases the number of unemployment benefits. In contrast, a lower level of, say, material government consumption or of transfers to families, such as child benefit have a smaller negative knock-on effect, because they are measures that have a relatively small effect on unemployment. With the relatively small item of development aid there is no negative knock-on effect, but a positive knock-on effect. This is because the declining demand falls entirely in other countries and thus has no domestic economic knock-on effect, while the interest charges on the national debt decrease, which means that the EMU balance improves by more than the amount of the actual spending curb.
In the long term, the spending effects on GDP are small. The structural effects of spending curbs on the supply of labour and on labour productivity will then predominate.
:ERROR!STYLE NOT DEFINED.
4
Another way of improving the EMU balance is by increasing the tax and premium burden. By definition an increase in taxes and premiums hits consumers or businesses and thus influences economic development. Higher taxes and premiums generally reduce purchasing power, increase costs and decrease profits for companies and/or increase prices. The resulting reduction of family consumption, exports and employment implies declining government revenues from VAT, payroll tax, income tax and corporation tax, while there is more expenditure on benefits. This usually negates part (sometimes a considerable part) of the initial improvement of public finances and thus produces negative knock-on effects.
This occurs, for example, when there is an increase in payroll tax and income tax. It is a measure that results in loss of purchasing power for families, which causes a decrease in family consumption and, by consequence, VAT revenues. To compensate for the higher taxes and premiums the contractual wages in the private sector will increase slightly. The higher labour costs lead to a reduction of employment. Although the supply of labour will also decrease now that on balance working is less worthwhile, this cannot stop unemployment from rising. The higher expenditure on unemployment benefits negates part of the EMU balance improvement.
The effects stated in this Keuzes in Kaart on the EMU balance are of an 'ex-ante' nature, i.e. no allowance was made for macro-economic knock-on effects. As explained above, however, the negative knock-on effects of spending curbs and increased taxes and premiums may be substantial. Moreover, the negative knock-on effects differ according to the type of spending curb and the type of tax or premium increase. The 'ex-post' effects on the EMU balance, i.e. including the economic knock-on, therefore differ according to the package of measures involved. This must be taken into account when interpreting the 'ex-ante' effects on the EMU balance.
a CPB Document 123 identifies the macro-economic effects of a few standard measures by means of ‘timetables’. The analysis
of the negative knock-on effects of lower government expenditure was published earlier in “Nadere informatie t.b.v.
doorrekening verkiezingsprogramma's”, CPB memorandum, 1 April 2010.
b See CPB Document 203.B
Macro-economic effects of package of spending curbs, 2011-2015 Economic Forecast
2011-2015
Effect of spending curbs Including spending curbs Growth per year in %
Volume GDP 1¾ − 0.4 1½ Contractual wages 2½ − 1.3 1 Consumption price 1¾ − 0.4 1¼ Year-end level Unemployment (% point) 5¼ 1.0 6¼ EMU balance (% GDP) − 2.9 1.2 − 1.7 EMU balance (bn) − 20 8.6 − 11¼
2.2
Budgetary effects
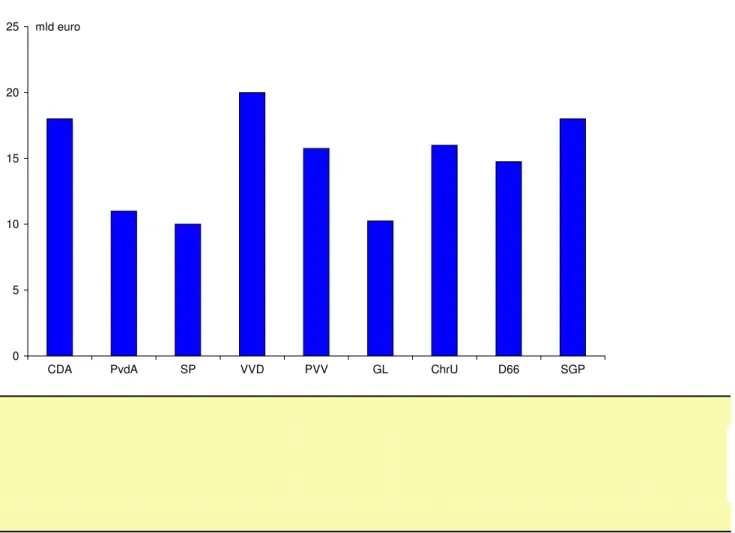
Figure 2.1 Ex-ante improvement of EMU-balance
0 5 10 15 20 25
CDA PvdA SP VVD PVV GL ChrU D66 SGP
mld euro
On balance all parties will make spending curbs and/or increase taxes and premiums, which will lead to an ex-ante improvement of the EMU balance. Ex-ante means that the effects of the measures on the economy and their knock-on effects on the balance have not been factored in (see sidebar). In this ex-ante approach, spending curbs and increased taxes and premiums improve the EMU balance one-to-one. The budgetary measures proposed by all parties contribute on balance to an ex-ante improvement of the EMU balance in 2015. VVD (People’s
Party for Freedom and Democracy) improves the EMU balance the most, namely by 20 billion
euros. In a historical perspective, the effect of the measures of the parties that are pursuing the smallest balance improvement in 2015 (Green Left and SP [Socialist Party], by approximately 10 billion euros), is already very large. Some proposed measures will not yet be completely effective in 2015 (for such reasons as an introductory path or legal obligations, or because the measure is related to the ageing of the population). If post-2015 measures yield or cost more (or less), however, it will be included in the calculation of the long-term sustainability of public finances. See section 2.5 for a further description of these sustainability measures and the
:ERROR!STYLE NOT DEFINED.
6
improvement of the sustained public deficit. The ex-ante improvement of the EMU balance in 2015 will be explained further in this section.
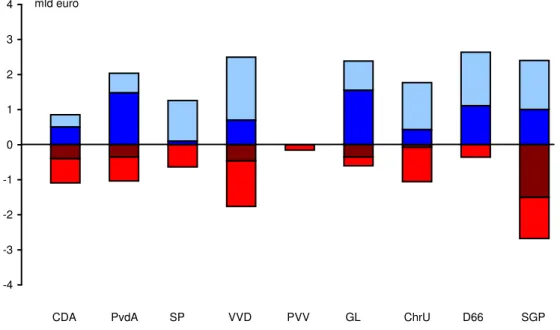
Figure Error! Style not defined..21 Budgetary choices: outlines (net expenditure and changes to taxes and premiums in euro bn) -12 -10 -8 -6 -4 -2 0 2 4 6
sociale zekerheid zorg onderwijs openbaar
bestuur
lasten huishoudens
lasten bedrijven mld euro
CDA PvdA SP VVD PVV GL ChrU D66 SGP
How will the improvement of the budgetary balance in 2015 be achieved? Figure 2.1 shows the largest items. The first four are net spending categories. A negative result means that on balance the party will reduce spending in the field concerned. For the final two items, a positive result means that on balance the party will increase taxes and premiums (for households or
companies)1. Seven parties have opted on balance to increase taxes and premiums by more than the baseline (in which taxes and premiums already rose by 10 billion euros). Only VVD and CDA (Christian Democratic Appeal) reduce taxes and premiums compared with the baseline. All parties improve the budgetary balance through spending cuts: VVD will on balance make the most spending cuts, SP the least.
Almost all parties will reform (retrench) elements of social security, often in line with options contained in reports of the review committees. SP is the only party that on balance will spend more money on social security, in particular through higher benefits. VVD makes the most cuts in social security - on balance more than 12 billion euros. Section 2.3 discusses the effects that social security and other measures have on household income, section 2.4 deals with the effects that the social security and other measures will have on employment. In these sections
1
On balance most parties will make spending cuts on healthcare. Only PVV and SP will on balance keep care expenditure roughly unchanged, while public spending on care will decrease most under VVD, D66 and SGP. These parties will achieve this reduction in several ways including a reduction of the package of insured care services. Behind the figures for public spending on care there are some significant differences: some parties will change little, while others will radically reform the system. See section 2.11 for a more extensive description of the plans of parties for the care sector.
Most parties will spend extra money on measures in education, with only PVV and CDA on balance making spending cuts in this category. It should be noted, however, that both parties make spending cuts on income measures such as free school books, the annual public transport pass for students, or higher education tuition fees - other parties also make cuts on these items. D66 will spend the most extra money. PvdA, VVD and Green Left will make cuts in spending on education by introducing (a form of) a student loan system. Section 2.9 examines in more detail the different measures for education and innovation. Figure Error! Style not defined..2
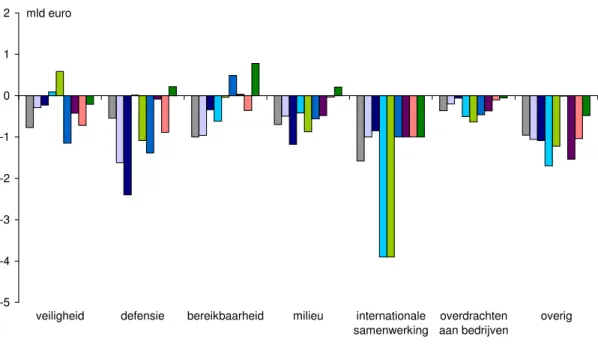
Net expenditure – other categories
-5 -4 -3 -2 -1 0 1 2
veiligheid defensie bereikbaarheid milieu internationale samenwerking
overdrachten aan bedrijven
overig mld euro
CDA PvdA SP VVD PVV GL ChrU D66 SGP
Figure 2.2 shows net intensifications (in most cases spending cuts) that parties propose to make in the other fields. Almost all amounts are negative, which means that, on balance, the parties will make mainly spending cuts.
All parties will make cuts in spending on public administration. In the base scenario, this expenditure will decrease as a percentage of GDP, as a result of targets introduced earlier and assumed spending cuts at central government, municipalities and provinces. This means
:ERROR!STYLE NOT DEFINED.
8
that in the baseline the number of civil servants is already set to decrease in the coming period, by about 10,000 at central government and almost 30,000 at municipalities and provinces. See table 2.3. All parties further want to make spending cuts on central government and municipal civil servants. However, it is questionable how feasible these intentions are. Past experience shows that substantial efficiency gains in the government apparatus are difficult to achieve in a single term of office of a cabinet. The same applies tofor a drastic reduction in jobs. Therefore, for the purpose of the analysis, CPB has applied maximums for what is deemed feasible in the way of savings in the term of office of the next cabinet. For central government and
autonomous administrative authorities the savings come to 2 billion euros in 2015 (excluding a 'savings loss' of 15 percent, as a result of the costs incurred for a reorganisation). This
maximum is a total for the various functions, including public administration. For local administration the maximum spending cut is also 2 billion euros in 2015 (excluding the savings loss). These maximums are in line with the proposals of the review committees, but ambitious and achievable only through far-reaching measures. Past experience shows that spending cuts on public administration are seldom achieved, not even when they are set down in a coalition agreement. SP is the only part that makes fewer spending cuts than the maximum applied by CPB. The reduction on local administration proposed by parties represents, together with the reduction in the baseline, a very significant challenge for municipal and provincial
governments.
For the purpose of this analysis CPB has disregarded proposals whereby civil service salaries lag behind the development of pay in the private sector. However, it is possible to make cuts on the wage bill. This leads to a reduction in jobs and a reduction in service provision, as described earlier. The structural, unilateral lowering of civil service salaries (compared with the private sector) is not realistic, however. CPB assumes that conditions of employment are determined in a free market economy by supply and demand. Past experience shows that it is not possible to reduce civil service salaries structurally compared with the private sector. In 1983, when contractual wages in the public sector were reduced by 4.2%, the incidental pay rise in the public sector came to 3.2% compared with 0.8% in the private sector. Although conditions of employment in the public sector did deteriorate, a substantial part of the reduction was
counterbalanced by extra incidental pay increases (extra incremental rises). In 1994-1996 and in 2004-2005, the increase in contractual wages in the public sector lagged behind the increase in the private sector after a policy-driven reduction on the budget for conditions of employment. In 2001-2002 and in 2006-2007, however, there was a catch-up and the arrears were wiped away again. In the baseline, the scope for a pay increase in the public sector during the term of office of the next cabinet will cumulatively remain 2% behind the private sector on account of the low budget for incidental pay rises. It is unrealistic to assume that conditions of employment in the public sector will lag behind those in the private sector by more than this.
In a balanced or tight labour market, more austere conditions of employment in the public sector compared with those in the private sector will discourage particularly young people to go and work in the public sector, or will provide them with an incentive to switch from the public sector to the private sector. Older people have lower job-to-job mobility, so older people in the public sector will be less inclined to switch. The reduction of the proportion of young people will exert an upward influence on average pay in the public sector (higher incidental
development of pay). Various parties (CDA, ChrU, SGP) nevertheless want to moderate the pay of civil servants, but in this analysis this does not lead to a further reduction in spending on public administration.
Table Error! Style not defined..2 Movements in public sector employment on top of the baseline movement (ex-ante, x1000 man-years) Positi on 2010 Movement 2011- 2015 baseline
CDA PvdA SP VVD PVV GL ChrU D66 SGP
Public administration, of which 577 − 37 − 32 − 32 − 13 − 37 − 33 − 6 − 25 − 29 − 33 central government, general
administration 74 − 6 − 7 − 9 − 7 − 11 − 11 − 6 − 6 − 7 − 7
Local administration 176 − 27 − 20 − 19 − 6 − 20 − 20 − 20 − 20 − 19 − 19 Other general administration 327 − 5 − 5 − 5 0 − 7 − 3 + 21 + 1 − 3 − 7
Security 89 − 2 − 8 − 3 − 3 1 8 − 8 − 3 − 6 − 2
Defence 61 − 2 − 4 − 9 − 20 0 − 5 − 7 − 1 − 7 2
Education 344 + 2 − 4 + 15 + 3 +5 0 + 20 + 11 + 19 0 Healthcare 926 + 150 − 10 − 15 + 13 − 50 + 10 + 15 − 30 − 39 − 33 Total public sector 1997 + 110 − 58 − 44 − 20 − 82 − 20 + 14 − 48 − 63 − 66 PM total employment NL 6577 110
On balance all parties make cuts on spending on security, particularly as a result of a general personnel target set for central government. Only PVV spends on balance (slightly) more on security, while VVD keeps spending constant in relation to the baseline. However, most parties do opt to a lesser or greater degree for more uniformed police officers on the streets. PVV does the most in this respect, with 10,000 extra police officers. Green Left has not opted for extra police officers, but does earmark extra money for city wardens. Under the proposals of D66, the number of police officers remains the same in relation to the baseline. PvdA, SP, D66 and Green Left save money on security spending by legalising soft drugs.
Except for VVD and SGP, all parties make cuts in spending on defence. For a number of parties, these cuts stem from the general target set for the government, while some parties additionally make extra cuts on defence, for example by discontinuing the JSF project (PvdA, PVV, Green Left), or by shedding battalions (CDA, D66, PvdA, SP, D66). SP makes the most
:ERROR!STYLE NOT DEFINED.
10
On balance Green Left and SGP earmark extra money for accessibility, although there is a great difference in the way they do this: whereas Green Left makes cuts on road-building, SGP intends to spend extra money on building roads. In the case of PVV ChrU the spending cuts and the intensifications keep each other in equilibrium, while on balance the remaining parties make spending cuts on accessibility – and here again some parties (PvdA, D66, ChrU, SP, D66) make spending cuts on the infrastructure, whereas others make cuts on public transport (CDA, VVD) - among other things by public calls for tenders (CDA, VVD, ChrU). See section 2.6 for a further description of the proposals in this field and their consequences for such matters as travelling times.
SGP is the only party that earmarks more money to be spent on the environment. In the case of VVD the spending cuts and the extra expenditure keep each other in equilibrium. The other parties on balance make cuts on environmental expenditure. It should be noted that most parties conduct their policy in this field mainly through tax and premium measures, so the difference in expenditure does not say everything about the total effort being made in terms of the
environmental. For more details see sections 2.7 and 2.8.
VVD and PVV make noticeably more cuts than the other parties on international cooperation, particularly by cutting spending on development cooperation. Up to and including 2015 there are pre-existing obligations, so the maximum achievable cut in the case of PVV will increase still further after the term of office of the next cabinet. CDA also reduces expenditure on development cooperation, while SP is the only party that increases this expenditure. It was not assumed in the baseline that the present cut of 1 billion euros per year on remittances to the EU will also be negotiated in the next budgetary period in Brussels. All parties want the
Netherlands to strive for continuation and this has been factored into the analysis, although only the negotiation effort (and not the result) will be determined by the new cabinet. CPB does not consider a further reduction of EU remittances to be feasible in the term of office of the next cabinet.
The other category includes numerous items. Seven parties make spending cuts on public broadcasting. PvdA and SP are the only ones that do not. On balance SP and Green Left will earmark extra money for culture, while D66 keeps expenditure on culture constant and all the other parties make cuts on cultural policy and/or grants. CDA, SP, VVD, PVV, ChrU and D66 all make spending cuts on integration, either by modifying policy or by letting integrators contribute more personally to the costs. None of the parties earmarks funding for the Economic Structure Strengthening Fund (FES), from which additional investments in infrastructure and the knowledge economy are financed.
The significant spending cuts on balance cause a reduction of employment in the public sector compared with the baseline. In the baseline, employment increases in the public sector, but this is due entirely to a planned increase in employment in healthcare. At central government and municipal and provincial governments there will already be a relatively substantial decrease in the number of civil servants in the term of office of the next cabinet, i.e. exclusive of the spending cuts proposed by the parties. In the case of municipal and provincial governments, the number of civil servants already decreases in the baseline by 15%. Under the plans of all parties, there will be an additional 10% on top of this figure so on balance the number of municipal civil servants will decrease by one quarter. This constitutes a substantial reduction in the services provided by municipalities and/or the quality of those services. For
Table Error! Style not defined..3 Movements in micro taxes and premiums, 2011-2015
Basis CDA PvdA SP VVD PVV GL ChrU D66 SGP Total movement in micro taxes and
premiums 10 − 2 ½ 3¾ − 5 3¼ 2 6 1¼ 5¼
Distribution across companies and families
Households 5¾ − ¾ − ¼ −¼ − 5¼ 1¼ − 1¾ 1¾ − ¼ 3½
Companies, of which 4¼ − 1¼ ¾ 4¼ ¼ 2 3¾ 4¼ 1½ 1¾
housing corporations 1½ ½ 1 1
Distribution across tax bases
Environment ¼ 2¼ 4 3 − ¼ ¾ 13 3 2¾ 1
Income and labour 7¾ − 3½ − 4¾ − 2 − 3¾ ½ − 15¼ ¾ − 2¼ 2
Capital and profit 2 − 1¼ − ¾ 2¾ ½ 2 2 2¼ 1 1¼
Other 0 ¼ 2 0 − 1¾ 0 2¼ ¼ − ¼ 1
Table 2.4 shows to what degree the parties raise or lower taxes and premiums for companies and families. In the baseline there was already a tax-and-premium increase of 10 billion euros, largely as a result of higher healthcare payments (premiums and personal payments). The proposals of VVD and CDA will on balance ease taxes and premiums, but even these parties compensate only in part for the increase in the baseline. All other parties increase taxes and premiums compared with the baseline - ChrU and SGP the most. PVV, ChrU and SGP increase taxes and premiums for households, while under the proposals of the other parties they will decrease, especially in the case of VVD. SP, ChrU and Green Left increase taxes and premiums for companies the most, while CDA is the only party that lowers taxes and premiums for companies (with housing corporations being placed into the 'companies' category – excluding housing corporations, VVD also eases taxes and premiums for companies).
Except for VVD, all parties increase environmental taxes and premiums, Green Left by far the most. This concerns numerous taxes and duties, for example road pricing for commercial vehicles (CDA, PvdA, Green Left, ChrU, D66, SGP). PvdA and Green Left
:ERROR!STYLE NOT DEFINED.
12
increase packaging taxes (and CDA increases taxes and premiums by converting the packaging tax into CO2 tax). In contrast, VVD will abolish the packaging tax. Green Left, ChrU and D66 will increase the VAT rate for meat (D66 does so only for non-biological meat). See also sections 2.6, 2.7 and 2.8.
PVV, ChrU and SGP increase taxes and premiums on income and labour. In the case of the other parties these taxes and premiums will decrease compared with the baseline. Green Left is the only party that achieves on balance a reduction of taxes and premiums on income and labour in the term of office of the next cabinet by means of a large reduction. See the next section for a few large measures.
Taxes and premiums on capital and profit will decrease compared with the baseline in the
case of CDA and PvdA. They will increase under the plans of the other parties. VVD, PvdA and CDA reduce corporation tax for companies, either by lowering the rate or by introducing capital relief. In contrast, SP increases the general rate of corporation tax, but raises the first tax bracket where a lower rate applies. Higher taxes and premiums also stem from measures like a levy on banks (PvdA, SP, VVD, GL, SGP and ChrU) and/or a levy on housing corporations (PVV, PvdA, D66). VVD and ChrU will transfer rent allowances to housing corporations, which also means an increase in taxes and premiums. Taxes and premiums will be eased for companies, among other things by enlarging the Research and Development (Promotion) Act (CDA, VVD, Green Left, ChrU, D66, SGP). The various tax and premium measures in the field of healthcare turn out to be neutral in most cases, i.e. they are mainly shifts in financing.
Other taxes and premiums include capital duty that VVD, Green Left and D66 will abolish in
due course, SP will lower and ChrU will abolish for starters. Parties that legalise soft drugs obtain revenue from the duties charged on them.
2.3
Effects of policy on purchasing power and profit
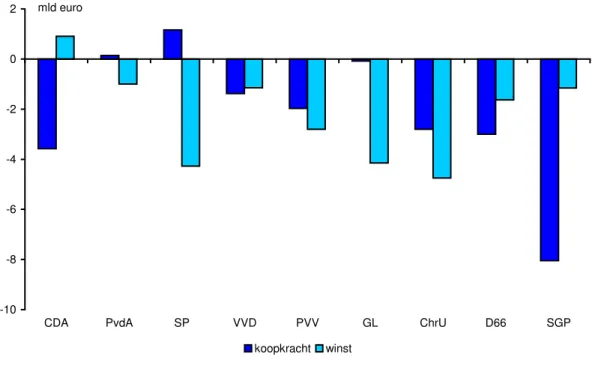
The parties clearly make different choices regarding the effects of policy on purchasing power and profit; see table 2.5. The effects of policy on purchasing power and profit concern the effects of measures collectively on the spending side and the taxation side. The figures in the tables are stated in billions of euros. A minus sign (-) indicates a deterioration of purchasing power/profit. SP and to a lesser extent PvdA improve purchasing power slightly, while under the measures of Green Left it will decrease slightly. In the case of all other parties, the
purchasing power of households will decrease more strongly, the most under the plans of SGP. CDA is the only party that with its proposals will increase the profits of companies – the profits will be pushed down most under the proposals of Green Left, SP and ChrU.
As CPB is not making any detailed purchasing power calculations this time, it is not possible to say anything quantitatively in this analysis about the consequences for the distribution of
income. However, there are some comments that can be made qualitatively. Some measures hit high incomes harder than low and middle incomes. This applies to the introduction of an extra top rate in box 1 of the tax returns form, proposed by two parties (PvdA, GreenLeft,SP). Similarly, limiting the fiscal exemption of pension contributions (PvdA, SP, Green Left, ChrU and SGP) will hit mainly higher incomes. Both high and middle incomes will incur a loss of purchasing power due to the various measures concerning tax relief on mortgages (PvdA, SP, Green Left, ChrU, and D66) and introduction of an income-linked insurance excess in
healthcare (PvdA, ChrU, D66, SGP). Low and middle incomes will be hit by the different types of limitation of the care allowance (CDA, VVD, D66, SGP). SP, Green Left and ChrU will completely abolish the care allowance, but this will be compensated by a reduction of the flat rate care contributions, so there will be no purchasing power effects. CDA and VVD link benefits to inflation, which compared with the baseline will result in a reduction (and thus a loss of purchasing power for the lowest incomes). Benefits will also lag behind in the case of SGP (including old age pension). In contrast, SP will increase the minimum wage and by
consequence also benefits. On balance, VVD and CDA spare particularly the higher incomes, whereas PvdA and SP tax lower incomes the least.
There are also a number of measures that will hit specific groups, such as households with children. A number of parties will, for example, change something in the child allowance: SP and Green Left will make it income-linked, whereas D66 will reduce the budget, PVV, D66 and VVD will limit the scheme to two children and, in contrast, SGP and ChrU will increase the budget for schemes such as the child allowance. VVD will abolish the child-linked budget.
Figure 2.4 Effects of policy on purchasing power and profits
-10 -8 -6 -4 -2 0 2
CDA PvdA SP VVD PVV GL ChrU D66 SGP
mld euro
:ERROR!STYLE NOT DEFINED.
14
There are also major differences between parties as regards the effects on company profits. The previous section described the differences concerning corporation tax. Different types of environmental/energy levies and taxes will depress the profits of companies. This applies to CDA, PvdA, Green Left and D66. In contrast, VVD will abolish the packaging tax, which is favourable for the profits of companies. The levies on banks and housing corporations (see section 2.2) will push down the profits of 'companies', as will the shift of the rent allowance to housing corporations (VVD, ChrU).
Table Error! Style not defined..4 Effects of policy on purchasing power and profits
CDA PvdA SP VVD PVV GL ChrU D66 SGP
Effects of policy on purchasing power and
profits − 2.67 − 1.28 − 3.11 – 2.53 − 4.78 – 4.23 − 7.55 – 4.63 – 9.21 of which: households − 3.58 – 0.28 1.16 – 1.38 – 1.97 – 0.08 – 2.80 – 3.00 – 8.05 tax and premium
measures 0.52 – 0.11 0.35 5.24 – 1.20 1.86 – 1.83 0.26 – 3.48 expenditure measures − 4.10 – 0.17 0.81 – 6.62 – 0.77 – 1.94 – 0.97 – 3.26 – 4.57 of which: companies 0.91 – 1.00 – 4.27 – 1.15 – 2.80 – 4.15 – 4.75 – 1.63 – 1.16 Tax and premium
measures 1.31 – 0.80 – 4.19 – 0.17 – 2.05 – 3.74 – 4.26 – 1.53 – 1.70 Expenditure measures − 0.40 – 0.20 – 0.08 – 0.98 – 0.75 – 0.41 – 0.48 – 0.10 0.55
2.4
Structural employment effects
Figure Error! Style not defined..3 Structural employment effects
-2 -1 0 1 2 3 4 5 6 7
CDA PvdA SP VVD PVV GL ChrU D66 SGP
%
The labour market will confront policymakers with a considerable challenge in the coming decades. On the one hand, unemployment has risen because of the crisis. On the other hand, there is an increase in demand for healthcare and other services due to the ageing of the population, whereby the labour force itself is also ageing. This section presents the structural employment effects (i.e. the effects calculated in 2040) of the measures of parties. The employment effects have been calculated partially, i.e. there was an examination of how each individual measure will influence long-term employment (and unemployment). Subsequently, these effects were added up. The increase in employment is, however, a policy field where there are typical declining additional revenues: a first percent of higher employment is easier to achieve than the next percent of increase. A consequence of the partial analysis (instead of an integral economic computation) is that the employment effect of a party that proposes a large number of measures simultaneously is somewhat overestimated.
The parties opt for different solutions. On balance, the measures of SP lead to a reduction of employment, while all other parties see employment increasing. The outlier is VVD, with an increase in employment of 5¾%. However, this does not mean that with unchanged
unemployment the labour force participation rate will also increase by 5¾%, because the measures also make the available labour force increase (denominator effect). As described in section 1.4, the employment effects have been factored into the calculation of the effects on the long-term sustainability of public finances.
CDA, D66, Green Left, SGP and VVD limit the maximum duration of unemployment benefits. The limitation means that the unemployed will try to find a job more quickly and will be more inclined to accept a less attractive offer of employment. Furthermore, the limitation will press down wages because the negotiating position of workers will deteriorate. The measure will reduce unemployment and increase employment.
D66, Green Left and VVD reduce protection against dismissal. The effect on employment and unemployment is minor. Companies will dismiss personnel more easily, but against this they will also be less reticent about taking on personnel. However, the limitation will create greater mobility and advancement in the labour market. This will offer older people
:ERROR!STYLE NOT DEFINED.
16
more opportunities in the labour market and lead to less long-term unemployment. There will also be savings on costs for proceedings brought before the Centre for Work and Income and the cantonal courts.
CDA and ChrU extend the period of continued payment of wages by employers. The effect on the job search behaviour of workers will be minor because the duration of income insurance will not be reduced. Employers will make greater efforts to ensure that dismissed employees quickly find a new job. But the scale of this effect is limited. When determining the effect it was assumed that a period of continued payment of wages does not count as
unemployment. Green Left and PvdA propose a differentiation in contributions for unemployment benefits, which means that the costs of the first months of unemployment benefits (in the case of dismissed employees) will be recovered from the employer. Employers will make greater efforts to ensure that dismissed employees quickly find a new job, but the scale of the effect is minor. As employees will be confronted immediately with the costs, they will, just as in the case of continued payment of wages, make greater allowance for the social costs that they cause through dismissal.
Except for PVV and SP, all parties propose changes to the state pension scheme. Raising the statutory retirement age will lead to an increase in the supply of labour and employment. Green Left will not immediately increase the statutory retirement age, but will make the entitlement to a state pension dependent upon labour force participation, and this will promote employment still more. The various state pension measures have a minor effect on unemployment. Older people who lose their job find a new job with difficulty, but because they often withdraw entirely from the labour market the unemployment rate among older people is not exceptionally high.
PVV and SP are the only parties that will not amend the Invalidity Insurance (Young Disabled Persons) Act. CDA, VVD, Green Left, ChrU, D66 and SGP will restrict the new influx of persons into the regime of this Act to the long-term unemployed and people completely unfit for work. It is estimated that 40% of the people covered by this Act are not lastingly unfit for work. The proportion of this group that does not seek recourse to social welfare benefits will have a strong incentive to look for a job. PvdA wants to introduce a partner income test for people covered by this Act who are less than 60% unfit for work. This too will increase employment.
PvdA, CDA, Green Left and D66 will replace the present system of sheltered workshops by a system of wage dispensation. People will no longer receive a sheltered workshop wage, but a top-up on the wage that they earn from a regular job. VVD will abolish sheltered workshops. In both cases, some of the people with limited earning capacity will have an incentive to look for a (regular) job).
CDA and VVD will scrap the double general tax relief in the social minimum, which will make working more attractive than social welfare benefits. CDA, VVD and SGP will additionally link benefits to prices (SGP will do this in part) instead of wages, which will also