Small decrease in the emission of greenhouse gases in 2007
Between 2006 and 2007, total greenhouse gas emissions (excluding LULUCF) dropped by about 0.4% (-1.0 Tg CO2 eq). CO2 emissions increased by 0.2 Tg. Major contributor to the decrease in greenhouse gas emission is the nitric acid production which decreased by approximately 1.3 Tg N2O in the period 2006-2007.
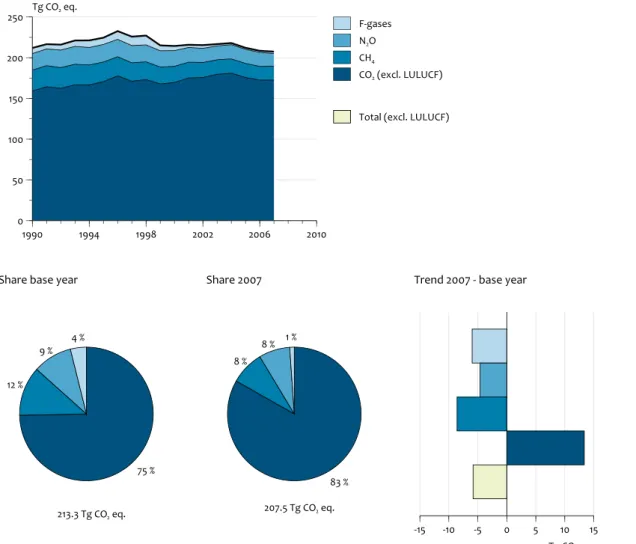
In 2007, total direct greenhouse gas emissions (excluding emissions from LULUCF) in the Netherlands are estimated at 207.5 Tg CO2 equivalents (CO2 eq). This is three percent below the emissions in the base year (213.3 Tg CO2 eq). This report documents the 2009 Netherlands’ annual submission of its greenhouse gas emission inventory in accordance with the guidelines provided by the United Nations Framework Convention on Climate Change (UNFCCC), the Kyoto Protocol and the European Union’s Greenhouse Gas Monitoring Mechanism.
The report comprises explanations of observed trends in emissions; a description of an assessment of key sources and their uncertainty; documentation of methods, data sources and emission factors applied; and a description of the quality assurance system and the verification activities performed on the data.
Greenhouse Gas
Emissions
in the Netherlands
1990-2007
National Inventory
Report 2009
Greenhouse Gas Emissions
in the Netherlands 1990-2007
National Inventory Report 2009
C.W.M. van der Maas
P.W.H.G. Coenen
1P.J. Zijlema
2L.J. Brandes
K. Baas
3G. van den Berghe
2G.J. van den Born
B. Guis
3G. Geilenkirchen
R. te Molder
D.S. Nijdam
J.G.J. Olivier
C.J. Peek
M.W. van Schijndel
S.M. van der Sluis
1
Netherlands Organization for Applied Scientific Research (TNO),
P.O. Box 80015, NL-3508-TA Utrecht
2
SenterNovem, P.O. Box 8242, NL-3503 RE Utrecht
Greenhouse Gas Emissions in the Netherlands 1990-2007
© Netherlands Environmental Assessment Agency (PBL), Bilthoven, April 2009 PBL report 500080012 / 2009
Contacts:
Wim van der Maas (PBL/IMP) (Wim.vanderMaas@pbl.nl) Peter Zijlema (NIE/SenterNovem) (p.zijlema@senternovem.nl)
This investigation has been performed by order and for the account of the Directorate-General for Environmental Protection, Climate Change and Industry Division, of the Netherlands Ministry of Spatial Planning, Housing and the Environment, within the framework of project Emissieregistratie M/500080/NIR, ‘Netherlands Pollutant Emission Register’.
Report prepared for submission in accordance with The UN Framework Convention on Climate Change (UNFCCC) and the European Union’s Greenhouse Gas Monitoring Mechanism [Including electronic Excel spreadsheet files containing the Common Reporting Format (CRF) data for 1990 to 2007]
Netherlands Environmental Assessment Agency (PBL) P.O. Box 303 3720 AH Bilthoven the Netherlands Tel: +31-30-274 274 5 Fax: +31-30-274 44 79 www.pbl.nl/en
Many colleagues from a number of organizations (CBS, EC-LNV, LEI, Alterra, SenterNovem, PBL and TNO) have been involved in the annual update of the Netherlands Pollutant Release & Transfer Register (PRTR), also called the Emission Registration (ER) system, which contains emissions data on about 350 pollutants. This annual project is led by the Netherlands Environmental Assessment Agency (PBL). The emission calculations, including those for greenhouse gas emissions, are performed by members of the ER ‘Task Forces’. This is a major task, since the Netherlands’ inventory contains many detailed emission sources.
Subsequently, the emissions and activity data of the Netherlands’ inventory is converted into the IPCC source categories contained in the CRF files, which form a supplement to this report.
The description of sources, analysis of trends and uncertainty estimates in emissions (see Chapters 3 to 8) of the various sources has been made in cooperation with the following emission experts: Mr Guus van den Berghe (SenterNovem) (waste), Mr Gert-Jan van der Born (land use), Mr Gerben Geilenkirchen (transport), Mr Romuald te Molder (trends, key sources), Mr Durk Nijdam (small combustion, solvent and product use), Mr Jos Olivier (energy), Mr Kees Peek (fugitive, industrial processes, other waste), Mr Kees Baas (CBS) (wastewater handling), Mrs Marian van Schijndel and Ms Sietske van der Sluis (agriculture). In addition, Mr Bas Guis of CBS has provided pivotal information on CO2 related
to energy use. This group has also provided activity data and additional information for the CRF files in cases where these were not included in the data sheets submitted by the ER Task Forces. We are particularly grateful to Mr Jack Pesik, Mr Dirk Wever and Mr Jeroen Peters, for their contribution to data processing and quality control.
We greatly appreciate the contributions of each of these groups and individuals to this National Inventory Report and supplemental CRF files, as well as the external reviewers that provided comments on the draft report.
Broeikasgasemissies in Nederland 1990-2007
Dit rapport over de Nederlandse inventarisatie van broeikasgasemissies is op verzoek van het Ministerie van VROM opgesteld om te voldoen aan de nationale rapportage verplichtingen in 2008 van het Klimaatverdrag van de Verenigde Naties (UNFCCC) en van hetBewakingsmechanisme Broeikasgassen van de Europese Unie. Dit rapport bevat de volgende informatie:
trendanalyses voor de emissies van broeikasgassen in de
periode 1990-2007;
een analyse van zogenaamde sleutelbronnen en de
onzekerheid in hun emissies volgens de ‘Tier 1’-methodiek van het IPCC-rapport over Good Practice guidance; documentatie van gebruikte berekeningsmethoden,
databronnen en toegepaste emissiefactoren;
een overzicht van het kwaliteitssysteem en de validatie van
de emissiecijfers voor de Nederlandse Emissieregistratie. Geconcludeerd wordt dat de emissies van de zes broeikasgas-sen, uitgedrukt in CO2 equivalenten, in 2007 in totaal met bijna
3% gedaald zijn ten opzichte van het basisjaar [1990 voor CO2 ,
CH4, N2O en 1995 voor HFK’s, PFK’s en SF6 (F-gassen); exclusief
de bos- en landgebruik (LULUCF)]. Emissie van CO2 exclusief
LULUCF is in de periode 1990-2007 met 8% gestegen, terwijl de emissies van CH4 en N2O met respectievelijk 34% en 23%
zijn gedaald over dezelfde periode. De emissies van F-gassen zijn in de periode 1995-2007 met gemiddeld 72% afgenomen. De emissies van HFK’s en PFK’s daalden in die periode met respectievelijk 71% en 83%. De SF6 emissies daalden met 29%.
Ten opzichte van 2006 zijn in 2007 zowel de CO2-emissies als
de totale broeikasgasemissies vrijwel gelijk gebleven (minder dan 0,5% gedaald).
Trefwoorden: broeikasgassen, emissies, trends, methodiek, klimaat
Inhoud
Samenvatting 11 Executive Summary 15 1 Introduction 211.1 Background information on greenhouse gas inventories and climate change 21 1.2 Institutional arrangements for inventory preparation 22
1.3 A brief description of how the inventory is prepared 23 1.4 Brief description of methodologies and data sources used 24 1.5 A brief description of the key categories 25
1.6 Information on the QA/QC plan 25 1.7 Evaluating general uncertainty 28
1.8 General assessment of the completeness 30
2 Trends in greenhouse gas emissions
31
2.1 Emission trends for aggregated greenhouse gas emissions 31 2.2 Emission trends by gas 32
2.3 Emission trends specified by source category 34
2.4 Emission trends for indirect greenhouse gases and SO2 34
3 Energy [CRF Sector 1]
37
3.1 Overview of sector 37
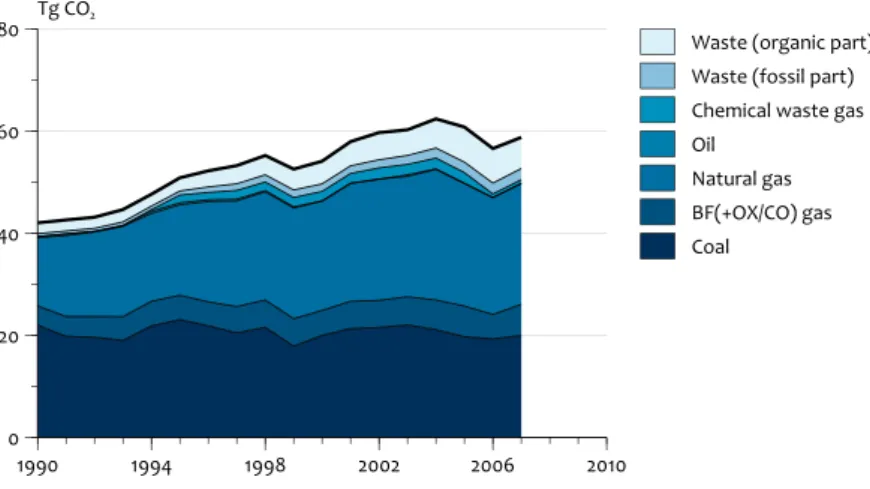
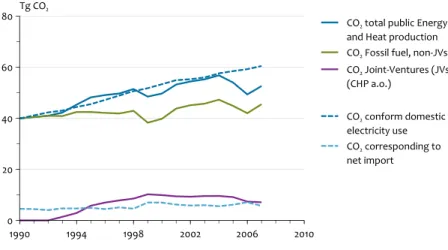
3.2 Fuel Combustion Activities [1A] 40 3.3 Energy industries [1A1] 42
3.4 Manufacturing industries and construction [1A2] 47 3.5 Transport [1A3] 53
3.6 Other sectors [1A4] 57 3.7 Others [1A5] 61
3.8 International bunker fuels 62 3.9 CO2 emissions from biomass 63
3.10 Comparison of the sectoral approach with the reference approach for CO2 64
3.11 Feedstocks and other non-energy use of fossil fuels 65 3.12 Fugitive emissions from fuels [1B] 68
3.13 Solid fuels [CRF category 1B1] 69 3.14 Oil and natural gas [CRF category 1B2] 69 4 Industrial processes [CRF Sector 2]
71
4.1 Overview of sector 71 4.2 Mineral products [2A] 72 4.3 Chemical industry [2B] 74 4.4 Metal production [2C] 77
4.5 Food and drink production [2D] 79 4.6 Production of halocarbons and SF6 [2E] 80
4.7 Consumption of halocarbons and SF6 [2F] 81
4.8 Other industrial processes [2G] 82 5
Solvent and other product use [CRF Sector 3] 85 5.1 Overview of sector 85
5.2 Indirect CO2 emissions from Solvents and product use (Paint application
[3A], Degreasing and dry cleaning [3B] and Other [3D]) 86
5.3 Miscellaneous N2O emissions from solvents and product use (use of N2O
6 Agriculture [CRF Sector 4]
89
6.1 Overview of the sector 89 6.2 Enteric fermentation [4A] 92 6.3 Manure management [4B] 94 6.4 Agricultural soils [4D] 99
7 Land use, land use change and forestry [CRF Sector 5]
103
7.1 Overview of sector 103 7.2 Methods 104
7.3 Forest Land [5A] 106 7.4 Cropland [5B] 109 7.5 Grassland [5C] 110 7.6 Wetland [5D] 112 7.7 Settlement [5E] 113 7.8 Other Land [5F] 114 7.9 Other [5G] 114 8 Waste [CRF Sector 6] 117 8.1 Overview of sector 117
8.2 Solid waste disposal on land [6A] 118 8.3 Wastewater handling [6B] 120 8.4 Waste incineration [6C] 122 8.5 Other waste handling [6D] 124 9 Other [CRF Sector 7]
127
10 Recalculations and improvements
129
10.1 Explanation and justification for the recalculations 129 10.2 Implications for emission levels 131
10.3 Implications for emission trends, including time-series consistency 131 10.4 Recalculations, response to the review process and planned improvements 131 References 135 Annex 1 Key sources 139 A
nnex 2 Detailed discussion of methodology and data for estimating CO2 emissions from fossil fuel combustion 152
Annex 3
Other detailed methodological descriptions for individual source or sink categories 159 Annex 4
CO2 Reference Approach and comparison with Sectoral Approach 160
Annex 5
Assessment of completeness and (potential) sources and sinks 164 Annex 6
Additional information to be considered as part of the NIR submission 166 Annex 7
Tables 6.1 and 6.2 of the IPCC Good Practice guidance 168 Annex 8
CRF Summary tables 170
Annex 9
Chemical compounds, global warming potentials, units and conversion factors 178 Annex 10
List of abbreviations 180
Annex 11
to the National Inventory Report 2009 of the Netherlands: 182 Annex 12
Inleiding
Het National Inventory Report (NIR) 2009 bevat de rapportage van broeikasgasemissies (CO2, N2O, CH4 en
de F-gassen) over de periode 1990 tot en met 2007. De emissiecijfers in de NIR 2009 zijn berekend volgens de protocollen behorend bij het ‘National System’ dat is voor-geschreven in het Kyoto Protocol. In de protocollen zijn de methoden vastgelegd voor zowel het basisjaar (1990 voor CO2, CH4 en N2O en 1995 voor de F-gassen) als voor de
emis-sies in de periode tot en met 2012. De protocollen staan op de website www.broeikasgassen.nl. Alle emissiecijfers en bijbe-horende documentatie worden ook, met een vertraging van enkele maanden, gepubliceerd op www.emissieregistratie.nl.
National Inventory Report (NIR)
Dit rapport over de Nederlandse inventarisatie van broei-kasgasemissies is op verzoek van het ministerie van VROM opgesteld om te voldoen aan de nationale rapportage-verplichtingen in 2009 van het Klimaatverdrag van de Verenigde Naties (UNFCCC) het Kyotoprotocol en het Bewakings mechanisme Broeikasgassen van de Europese Unie. Dit rapport bevat de volgende informatie:
trendanalyses voor de emissies van broeikasgassen in de
periode 1990-2007
een analyse van zogenaamde sleutelbronnen en de onze-
kerheid in hun emissies volgens de ‘Tier 1’-methodiek van het IPCC-rapport over Good Practice guidance;
documentatie van gebruikte berekeningsmethoden,
databronnen en toegepaste emissiefactoren;
een overzicht van het kwaliteitssysteem en de validatie van
de emissiecijfers voor de Nederlandse Emissieregistratie; de wijzigingen die in de methoden voor het berekenen van
broeikasgasemissies zijn aangebracht na de review van het Nationaal Systeem broeikasgassen vanuit het Klimaat-verdrag. Op basis van de methoden die in de NIR en de Nederlands protocollen broeikasgassen zijn vastgelegd is de basisjaaremissie bepaald, en de hoeveelheid broeikas-gassen die Nederland in de periode 2008 t/m 2012 (volgens het Kyoto Protocol) mag uitstoten.
Een aparte annex bij dit rapport bevat elektronische data over emissies en activiteitsdata in het zogenaamde Common Reporting Format (CRF), waar door het secretariaat van het VN-Klimaatverdrag om wordt verzocht. In de bijlagen bij dit rapport zijn de samenvattende emissie - en trendtabellen ‘7A’ en 10 op basis van het CRF opgenomen voor 1990-2007. Daarnaast bevatten de bijlagen ondermeer een overzicht van sleutelbronnen en onzekerheden.
De NIR gaat niet specifiek in op de invloed van het gevoerde overheidsbeleid met betrekking tot emissies van broeikas-gassen; meer informatie hierover is te vinden in de jaarlijkse Milieubalans en de vierde Nationale Communicatie onder het Klimaatverdrag, die eind 2005 is verschenen.
Ontwikkeling van de broeikasgasemissies
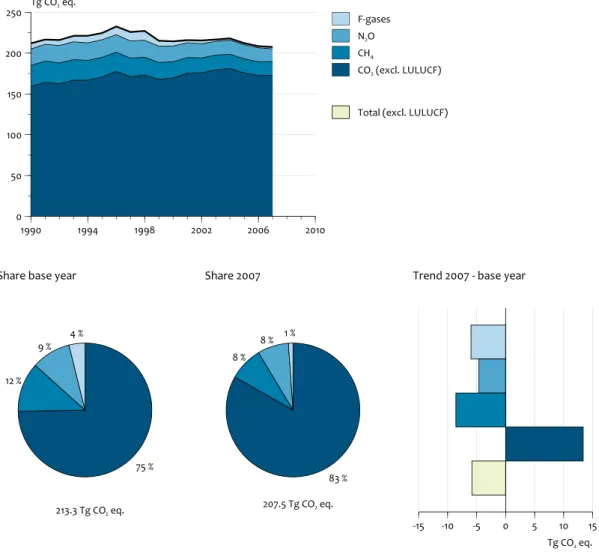
De emissieontwikkeling in Nederland wordt beschreven en toegelicht in dit National Inventory Report (NIR 2009). Figuur ES.1 geeft het emissieverloop over de periode 1990-2007 weer. De totale emissies bedroegen in 2007 circa 207,5 Tg (Mton ofwel miljard kg) CO2 equivalenten en waren daarmee
bijna drie procent lager (Box ES.1) dan de emissies in het basisjaar (213,3 Tg CO2 eq). De hier gepresenteerde
emis-sies zijn exclusief de emisemis-sies van landgebruik en bossen (LULUCF); deze emissies tellen pas mee vanaf het emissiejaar 2008 (waarover wordt gerapporteerd in 2010) onder het Kyoto Protocol. De emissie van CO2 is sinds 1990 met circa
8% toegenomen, terwijl de emissies van de andere broeikas-gassen met circa 36% zijn afgenomen ten opzichte van het basisjaar.
De daling in 2007 is vooral toe te schrijven aan de vermindering van de N2O emissie. In 2007 bedroeg de N2O
emissie 15,6 miljard kg. Dit is veel minder dan in 2006, toen de uitstoot 17,1 miljard kg bedroeg. De belangrijkste reden voor de daling is de emissiereductie bij de salpeterzuurproductie. De uitstoot van methaan nam toe in 2007 door de emissies van gasmotoren. In het afgelopen jaar zijn deze emissies opnieuw berekend voor de gehele tijdreeks op basis van voortschrijdende inzichten. De uitstoot van koolstofdioxide steeg beperkt en bleef op het niveau van 2006.
Methoden
De methoden die Nederland hanteert voor de berekening van de broeikasgasemissies zijn vastgelegd in protocollen, te vinden op www.broeikasgassen.nl. De protocollen zijn opgesteld door SenterNovem, in nauwe samenwerking met deskundigen van de Emissieregistratie (voor wat betreft de beschrijving en documentatie van de berekeningsmethoden). Na vaststelling van deze protocollen in de Stuurgroep ER (december 2005), zijn de protocollen vastgelegd in een wet-telijke regeling door het ministerie van VROM. De methoden
maken onderdeel uit van het Nationaal Systeem (artikel 5.1 van het Kyoto Protocol) en zijn bedoeld voor de vaststel-ling van de emissies in zowel het basisjaar als in de jaren in de budgetperiode. Naar aanleiding van de review van het zogenaamde ‘Initial Report’ zijn de methoden en protocollen aangepast. Deze zijn daarmee in overeenstemming met de IPCC Good Practice guidance and Uncertainty Management, dat als belangrijkste voorwaarde is gesteld aan de te hante-ren methoden voor de berekening van broeikasgassen. Deze methoden zullen de komende jaren (tot 2014) worden gehan-teerd; tenzij er grote veranderingen plaatsvinden in
bijvoor-Figure ES.1 1990 1994 1998 2002 2006 2010 0 50 100 150 200 250 Tg CO2 eq. F-gases N2O CH4 CO2 (excl. LULUCF) Greenhouse gas emissions (excl. LULUCF)
Total (excl. LULUCF)
-15 -10 -5 0 5 10 15 Tg CO2 eq.
Trend 2007 - base year
83 % 8 % 8 % 1 % Share 2007 207.5 Tg CO2 eq. 75 % 12 % 9 % 4 %
Share base year
213.3 Tg CO2 eq.
De emissies van broeikasgassen kunnen niet exact worden gemeten of berekend. Onzekerheden zijn daarom onvermij-delijk. Het PBL schat de onzekerheid in de jaarlijkse totale broeikasgasemissies op circa 5%. Dit is geschat op basis van informatie van emissie-experts in een eenvoudige analyse van de onzekerheid (volgens IPCC Tier 1). De totale uitstoot van broeikasgassen ligt daarmee met 95% betrouwbaarheid tussen de 197 en 218 Tg (Mton). De onzekerheid in de emissietrend
tussen het basisjaar (1990/1995) en 2007 is geschat op circa 3%-punt; dat wil zeggen dat de emissietrend in die periode met 95% betrouwbaarheid ligt tussen de -6 tot +0%.
In het verrekeningssysteem onder het Kyoto Protocol worden emissies bepaald op een van tevoren afgesproken wijze (vastgelegd in protocollen) en wordt een Partij daarop uiteindelijk ook afgerekend.
beeld de beschikbaarheid van basisdata of de implementatie van beleidsmaatregelen aanleiding geeft de methoden aan te passen.
Belangrijkste methodische wijzigingen
ten opzichte van de NIR 2008
In deze NIR zijn de volgende methodologische wijzigingen doorgevoerd:
Nieuwe methode voor de berekening van de methaan-
emissies uit gasmotoren voor de gehele tijdreeks
Herberekening van de emissies van landgebruik en bossen
(LULUCF) naar aanleiding van de UNFCCC review in 2007 Door toepassing van meer gedetailleerde basisdata kon de
kwaliteit van de emissiecijfers van CH4 en N2O uit de
land-bouw worden verbeterd. Het zelfde geldt voor de emissies van N2O uit de waterzuiveringen.
ES.1 Background information on greenhouse
gas inventories and climate change
This report documents the 2009 Netherlands’ annual submission of its greenhouse gas emission inventory in accordance with the guidelines provided by the United Nations Framework Convention on Climate Change (UNFCCC), the Kyoto Protocol and the European Union’s Greenhouse Gas Monitoring Mechanism. These guidelines, which also refer to Revised 1996 IPCC Guidelines and IPCC Good Practice guidance and Uncertainty Management reports, provide a format for the definition of source categories and for calculation, documentation and reporting of emissions. The guidelines aim at facilitating verification, technical assessment and expert review of the inventory information by independent Expert Review Teams of the UNFCCC. Therefore, the inventories should be transparent, consistent, comparable, complete and accurate as elaborated in the UNFCCC Guidelines for reporting and be prepared using good practice as described in the IPCC Good Practice Guidance. This National Inventory Report (NIR) 2009 therefore provides explanations of the trends in greenhouse gas emissions, activity data and (implied) emission factors for the period 1990-2007. It also summarises descriptions of methods and data sources of Tier 1 assessments of the uncertainty in annual emissions and in emission trends; it presents an assessment of key sources following the Tier 1 and Tier 2 approaches of the IPCC Good Practice Guidance; and describes Quality Assurance and Quality Control activities. This report provides no specific information on the effectiveness of government policies for reducing greenhouse gas emissions. This information can be found in the annual Environmental Balance (in Dutch: ‘Milieubalans’) prepared by the Netherlands Environmental Assessment Agency (PBL) and the 4th National Communication (NC4) prepared by the government of the Netherlands.So-called Common Reporting Format (CRF) spreadsheet files, containing data on emissions, activity data and implied emission factors, accompany this report. The complete set of CRF files as well as the NIR in pdf format can be found at the website www.greenhousegases.nl. From July 2009 the emissions and documentation can also be found on www.prtr.nl.
Climate Convention and Kyoto Protocol
Although this NIR 2009 is prepared as a commitment under the UNFCCC, it is also an important report in the context of the Kyoto Protocol. Because the Protocol has entered into force, ratifying Parties will have to start fulfilling commitments under the Protocol. One of the commitments is the development of a National System for greenhouse gas emissions (art. 5.1 of the Protocol). This National System shall comply with the IPCC guidelines as mentioned earlier. This NIR 2009 is based upon the methodologies included in the National System of the Netherlands under article 5.1 of the Protocol, as developed in the period 2000-2005 and was reviewed by an Expert Review Team of the UNFCCC in April 2007.
Key categories
For identification of so-called ‘key categories’ according to the IPCC Good Practice approach the national emissions are allocated according to the IPCC potential key category list wherever possible. The IPCC Tier 1 method consists of ranking this list of source category-gas combinations, for the contribution to both the national total annual emissions and the national total trend. The results of these listings are presented in Annex 1: the largest sources, the total of which ads up to 95% of the national total, are 32 sources for annual level assessment and 30 sources for the trend assessment, out of a total of 70 sources. Both lists can be combined to get an overview of sources, which meet any of these two criteria. Next, the IPCC Tier 2 method for identification of key sources is used, which requires the incorporation of the uncertainty to each of these sources before ordering the list of shares. The result is a list of 43 source categories out of a total of 70 that could be identified as ‘key sources’ according to the definition of the IPCC Good Practice Guidance report. Finally, four key categories are found in the LULUCF sector (Sector 5), after inclusion of 9 LULUCF subcategories in the key category analysis.
Institutional arrangements for inventory preparation The greenhouse gas inventory of the Netherlands is based on the national Pollutant Release & Transfer Register (PRTR). The general process of inventory preparation exists many years and is organised as a project with an annual cycle. In 2000, an improvement programme was initiated (under the lead of SenterNovem) to transform the general process of the greenhouse gas inventory of the PRTR into a National System,
according to the requirements under article 5.1 of the Kyoto Protocol.
The Netherlands Environmental Assessment Agency (PBL) has been contracted by the Ministry of Housing, Spatial Planning and the Environment (VROM) to compile and maintain the PRTR and to co-ordinate the preparation of the NIR and filling the CRF (see Figure ES.2). SenterNovem is designated by law as the National Inventory Entity (NIE). SenterNovem co-ordinates the overall QA/QC activities and the support/ response to the UNFCCC review process.
Monitoring protocols
As part of the improvement programme, the methodologies for calculating greenhouse gas emission in the Netherlands were reassessed and compared with UNFCCC and IPCC requirements. For the key sources and for sinks, the method-ologies and processes are elaborated, re-assessed and revised where needed. The final revision took place after review of the National System (including the protocols). The present CRF/NIR is based on methodologies approved during/after the review of the National System and the calculation of the Assigned Amount of the Netherlands. Monitoring protocols describing methodologies, data sources and the rationale for their selection are available at www.greenhousegases.nl.
Organisation of the report
This report is in line with the prescribed format for the NIR, starting with an introductory Chapter 1, containing background information on the Netherlands’ process of inventory preparation and reporting; key categories and their uncertainties; a description of methods, data sources and emission factors, and a description of the quality assurance system, along with verification activities applied to the data. Chapter 2 provides a summary of trends for aggregated greenhouse gas emissions by gas and by main source. Chapters 3 to 9 present detailed explanations for the emissions in different sectors. Chapter 10 presents information on recalculations, improvements and response to issues raised in external reviews on the NIR 2008 and on the draft version of the NIR 2009. In addition, the report provides more detailed information on key categories, methodologies, other relevant reports and summary emission tables selected from the CRF files (IPCC Tables 7A and 10) in 12 Annexes.
New this year is Annex 12, showing the Emission Factors and Activity Data from the Agricultural sector.
ES.2 Summary of national emission
and removal related trends
In 2007, total direct greenhouse gas emissions (excluding emissions from LULUCF) in the Netherlands are estimated at 207.5 Tg CO2 equivalents (CO2 eq). This is three percent
below the emissions in the base year (213.3 Tg CO2 eq). In the
Netherlands the base year emissions are 1990 for CO2, CH4 and
N2O and 1995 for fluorinated gases. CO2 emissions (excluding
LULUCF) increased by about 8% from 1990 to 2007, mainly due to the increase in the emissions in the 1A1a Public electric-ity sector and 1A3 Transport sector. CH4 emissions decreased
by 34% in 2007 compared to the 1990 level, mainly due to decrease in the waste sector, the agricultural sector and fugi-tive emissions in the energy sector. N2O emissions decreased
by about 23% in 2007 compared to 1990, mainly due to the decrease in the emissions from agriculture and from industrial processes, which partly compensated increases of emissions from fossil fuel combustion (mainly from transport). Of the fluorinated greenhouse gases, emissions of HFCs and PFCs decreased in 2007 by about 71% and 83%, respectively, while SF6 emissions decreased by 29%. Total emissions of all F-gases
decreased by about 72% compared to the 1995 level (chosen as the base year).
Between 2006 and 2007, total greenhouse gas emissions (excluding LULUCF) dropped by about 0.4% (-1.0 Tg CO2 eq).
CO2 emissions increased by 0.2 Tg. Major contributor to
the decrease in greenhouse gas emission is the nitric acid production which decreased by approximately 1.3 Tg N2O in
the period 2006-2007.
ES.3 Overview of source and sink category
emission estimates and trends
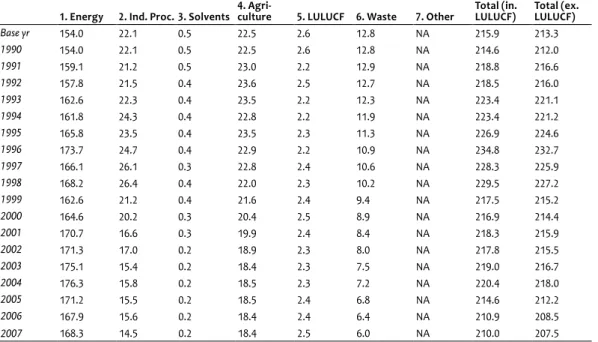
Tables ES.1 and ES.2 provide an overview of the emission trends (in CO2 equivalents) per gas and per IPCC source
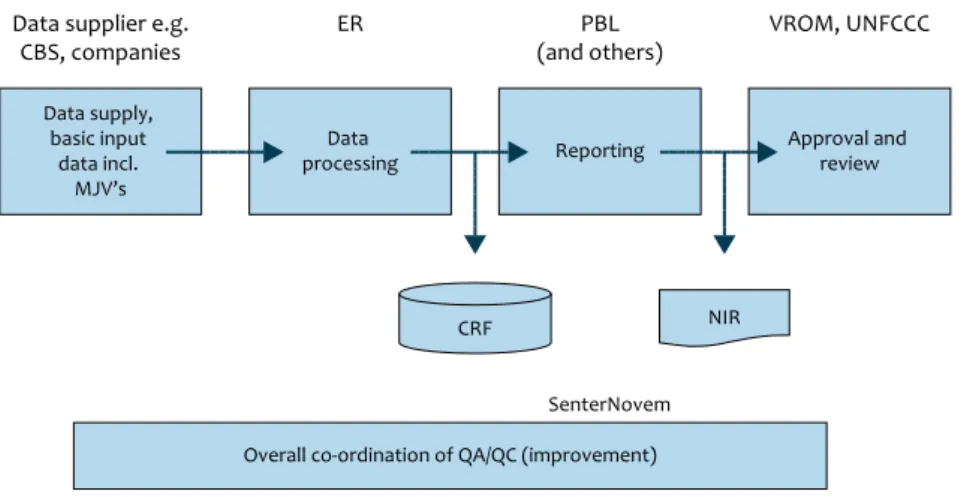
category. The Energy sector (category 1) is by far the largest contributor to national total greenhouse gas emissions. The Figure ES.1 The greenhouse gas inventory process
Data supplier e.g.
CBS, companies ER (and others)PBL VROM, UNFCCC
SenterNovem Reporting Data supply, basic input data incl. MJV’s Approval and review Data processing CRF NIR
Figure ES.2 1990 1994 1998 2002 2006 2010 0 50 100 150 200 250 Tg CO2 eq. F-gases N2O CH4 CO2 (excl. LULUCF) Greenhouse gas emissions (excl. LULUCF)
Total (excl. LULUCF)
-15 -10 -5 0 5 10 15 Tg CO2 eq.
Trend 2007 - base year
83 % 8 % 8 % 1 % Share 2007 207.5 Tg CO2 eq. 75 % 12 % 9 % 4 %
Share base year
213.3 Tg CO2 eq.
Summary of emission trend per gas (unit: Tg CO2 equivalents).
CO2 incl.
LULUCF COLULUCF2 excl. CH4 N2O HFCs PFCs SF6
Total (incl
LULUCF) Total (excl LULUCF) 1)
Base yr 161.9 159.3 25.5 20.2 6.0 1.9 0.3 215.9 213.3 1990 161.9 159.3 25.5 20.2 4.4 2.3 0.2 214.6 212.0 1991 166.5 164.3 25.9 20.6 3.5 2.2 0.1 218.8 216.6 1992 164.8 162.4 25.5 21.5 4.4 2.0 0.1 218.5 216.0 1993 169.0 166.8 25.2 21.9 5.0 2.1 0.1 223.4 221.1 1994 168.9 166.7 24.4 21.4 6.5 2.0 0.2 223.4 221.2 1995 172.9 170.6 24.2 21.5 6.0 1.9 0.3 226.9 224.6 1996 179.8 177.7 23.5 21.4 7.7 2.2 0.3 234.8 232.7 1997 173.5 171.1 22.6 21.1 8.3 2.3 0.3 228.3 225.9 1998 175.6 173.2 21.7 20.7 9.3 1.8 0.3 229.5 227.2 1999 170.1 167.8 20.7 20.0 4.9 1.5 0.3 217.5 215.2 2000 172.1 169.6 19.8 19.3 3.8 1.6 0.3 216.9 214.4 2001 177.6 175.2 19.3 18.1 1.5 1.5 0.3 218.3 215.9 2002 178.1 175.7 18.4 17.3 1.5 2.2 0.3 217.8 215.5 2003 182.0 179.6 17.9 16.9 1.4 0.6 0.2 219.0 216.7 2004 183.3 181.0 17.6 17.4 1.5 0.3 0.2 220.4 218.0 2005 178.2 175.8 17.2 17.3 1.4 0.3 0.2 214.6 212.2 2006 174.9 172.5 16.8 17.1 1.6 0.3 0.2 210.9 208.5 2007 175.2 172.7 17.0 15.6 1.7 0.3 0.2 210.0 207.5 Table ES.1
emissions of this sector increased substantially compared to 1990. In contrast, emissions of the other sectors decreased compared to the base year, the largest being those of Indus-trial Processes, Waste and Agriculture.Summary of emission trend per gas (unit: Tg CO2 equivalents).
Sectors showing the largest growth in CO2 equivalent
emissions since 1990 are Transport (1A3) and Energy industries (1A1) (+35% and +25%, respectively). Note that half of the marked increase in the Public electricity sector of almost 30% between 1990 and 1998 is caused by a shift of cogeneration plants from Manufacturing industries to the Public electricity and heat production sector due to a change of ownership (joint-ventures), simultaneously causing a 15% decrease in industry emissions in the early 1990’s (1A2).
ES.4 Other information
General uncertainty evaluation
The results of the uncertainty estimation according to the IPCC Tier 1 uncertainty approach are summarised in Annex 1 of this report. The Tier 1 estimation of annual uncertainty in CO2 eq emissions results in an overall uncertainty of 4%,
based on calculated uncertainties of 2%, 16%, 46% and 33% for CO2 (excluding LULUCF), CH4, N2O and F-gases,
respec-tively. However, these figures do not include the correlation between source categories (e.g. cattle numbers for enteric fermentation and animal manure production) or a correction for not-reported sources. Therefore, the actual uncertainty of total annual emissions per compound and of the total will be somewhat higher; it is currently estimated by PBL at:
Table A1.4 of Annex 1 summarises the estimate of the trend uncertainty 1990-2005 calculated according to the IPCC Tier 1 approach in the IPCC Good Practice Guidance (IPCC, 2001). The result is a trend uncertainty in the total CO2 eq emissions
(including LULUCF) for 1990 -2007 (1995 for F-gases) of ±3% points. This means that the decrease in total CO2 eq emissions
between 1990 and 2007 (including LULUCF), which is calcu-lated to be -3%, will be between -6% and 0%. Per individual gas, the trend uncertainty in total emissions of CO2 , CH4, N2O and
the total group of F-gases has been calculated at ±2%, ±10%, ±15% and ±9% points, respectively. More details on the level and trend uncertainty assessment can be found in Annex 7.
Completeness of the national inventory
The Netherlands’ greenhouse gas emission inventory includes all sources identified by the Revised Intergovernmental Panel on Climate Change (IPCC) Guidelines (IPCC, 1996) – with the exception of the following, very minor, sources:
oil transport (1B2a3), due to missing activity data
charcoal production (1B2) and use (1A4), due to missing
activity data CO
2 from lime production (2A2), due to missing activity
data CO
2 from asphalt roofing (2A5), due to missing activity data
CO
2 from road paving (2A6), due to missing activity data
CH
4 from enteric fermentation of poultry (4A9), due to
missing emission factors N
2O from industrial waste water (6B1), due to negligible
amounts
Precursor emissions (i.e. carbon monoxide (CO), nitrogen
oxide (NOx), non-methane volatile organic compounds (NMVOC) and sulphur dioxide (2)) from Memo item “International bunkers” (international transport) have not been included.
For more extended information on this issue, see annex 5. Table ES.1 Summary of emission trend per source category (unit: Tg CO2 equivalents).
1. Energy 2. Ind. Proc. 3. Solvents 4. Agri-culture 5. LULUCF 6. Waste 7. Other Total (in. LULUCF) Total (ex. LULUCF)
Base yr 154.0 22.1 0.5 22.5 2.6 12.8 NA 215.9 213.3 1990 154.0 22.1 0.5 22.5 2.6 12.8 NA 214.6 212.0 1991 159.1 21.2 0.5 23.0 2.2 12.9 NA 218.8 216.6 1992 157.8 21.5 0.4 23.6 2.5 12.7 NA 218.5 216.0 1993 162.6 22.3 0.4 23.5 2.2 12.3 NA 223.4 221.1 1994 161.8 24.3 0.4 22.8 2.2 11.9 NA 223.4 221.2 1995 165.8 23.5 0.4 23.5 2.3 11.3 NA 226.9 224.6 1996 173.7 24.7 0.4 22.9 2.2 10.9 NA 234.8 232.7 1997 166.1 26.1 0.3 22.8 2.4 10.6 NA 228.3 225.9 1998 168.2 26.4 0.4 22.0 2.3 10.2 NA 229.5 227.2 1999 162.6 21.2 0.4 21.6 2.4 9.4 NA 217.5 215.2 2000 164.6 20.2 0.3 20.4 2.5 8.9 NA 216.9 214.4 2001 170.7 16.6 0.3 19.9 2.4 8.4 NA 218.3 215.9 2002 171.3 17.0 0.2 18.9 2.3 8.0 NA 217.8 215.5 2003 175.1 15.4 0.2 18.4 2.3 7.5 NA 219.0 216.7 2004 176.3 15.8 0.2 18.5 2.3 7.2 NA 220.4 218.0 2005 171.2 15.5 0.2 18.5 2.4 6.8 NA 214.6 212.2 2006 167.9 15.6 0.2 18.4 2.4 6.4 NA 210.9 208.5 2007 168.3 14.5 0.2 18.4 2.5 6.0 NA 210.0 207.5 Table ES.2 CO2 ±3% HFCs ±50% CH4 ±25% PFCs ±50% N2O ±50% SF6 ±50%
Methodological changes, recalculations and improvements This NIR 2009 is based upon the envisaged National System of the Netherlands under article 5.1 of the Kyoto Protocol, as developed in the last decade and finalised by December 2005. In past years the results of various improvement actions have been implemented in the methodologies and processes of the preparation of the greenhouse gas inventory of the Netherlands. Compared to the NIR/CRF 2008 and based on the results of the review of the National System by an Expert Review Team of the UNFCCC, some recalculations were undertaken in the past year. The methodological changes are documented in Chapters 3-8.
Compared to the NIR/CRF 2008, the following methodological changes were made in the greenhouse gas inventory for the base year:
Recalculation of CH
4 emissions from smaller cogeneration
facilities, Category 1A1, +64 Gg CO2 eq in 1990
Recalculation of LULUCF as an result of the in country
review of 2007 Effect: -70.2Gg CO2 eq in the base year 1990
Use of improved feed-data in the emission calculations for
agriculture
Inclusion of horses and ponies in the emission calculations
for agriculture
Inclusion of information of different husbandry systems
and manure storage systems in the emission calculations for agriculture . The for mentioned changes resulted in an increase of 45.1 Gg CO2 eq from CH4 and 329 Gg CO2 eq
from N2O for agriculture in 1990
Use of more detailed data on purification efficiencies in
wastewater treatment plants resulted in a decrease of 48 Gg CO2 eq fron N2O in category 6B
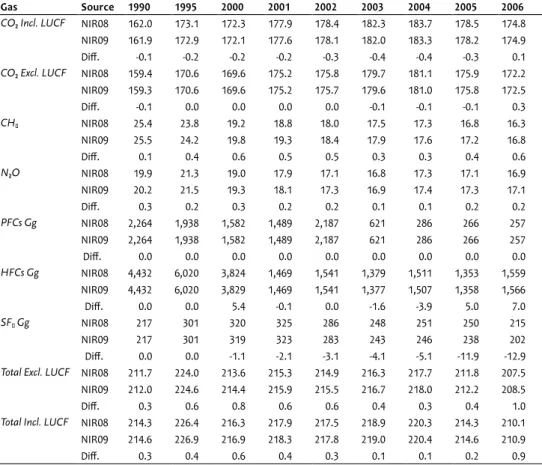
Table ES.3 provides the results of recalculations in the NIR 2009 compared to the NIR 2008.
Improving the QA/QC system
The QA/QC programme (quality assurance / quality control) is up to date and all procedures and processes are estab-lished to meet the National System requirements (as part of the annual activity programme of the Netherlands PRTR). QA/QC activities to be undertaken as part of the National System have been described in Chapter 1. Some actions which remained since the NIR 2007, are now implemented:
The update of the description of QA/QC of outside
agencies;
Results of a TIER 2 uncertainty analysis are taken into
account in the NIR, the QA/QC programme and included in the monitoring protocols.
Emission trends for indirect greenhouse gases and SO2
Compared to 1990, the CO and NMVOC emissions were reduced in 2007 by 50% and 66%, respectively. For SO2 this is
69%, and for NOx, the 2007 emissions are 47% lower than the 1990 level. Table ES.4 provides trend data.
In contrast with the direct greenhouse gases, emissions of precursors from road transport have not been corrected for fuel sales according to the national energy statistics but are Differences between NIR 2008 and NIR 2009 due to recalculations (Unit: Tg CO2 eq, F-gases: Gg CO2 eq).
Gas Source 1990 1995 2000 2001 2002 2003 2004 2005 2006
CO2 Incl. LUCF NIR08 162.0 173.1 172.3 177.9 178.4 182.3 183.7 178.5 174.8
NIR09 161.9 172.9 172.1 177.6 178.1 182.0 183.3 178.2 174.9 Diff. -0.1 -0.2 -0.2 -0.2 -0.3 -0.4 -0.4 -0.3 0.1
CO2 Excl. LUCF NIR08 159.4 170.6 169.6 175.2 175.8 179.7 181.1 175.9 172.2
NIR09 159.3 170.6 169.6 175.2 175.7 179.6 181.0 175.8 172.5 Diff. -0.1 0.0 0.0 0.0 0.0 -0.1 -0.1 -0.1 0.3 CH4 NIR08 25.4 23.8 19.2 18.8 18.0 17.5 17.3 16.8 16.3 NIR09 25.5 24.2 19.8 19.3 18.4 17.9 17.6 17.2 16.8 Diff. 0.1 0.4 0.6 0.5 0.5 0.3 0.3 0.4 0.6 N2O NIR08 19.9 21.3 19.0 17.9 17.1 16.8 17.3 17.1 16.9 NIR09 20.2 21.5 19.3 18.1 17.3 16.9 17.4 17.3 17.1 Diff. 0.3 0.2 0.3 0.2 0.2 0.1 0.1 0.2 0.2 PFCs Gg NIR08 2,264 1,938 1,582 1,489 2,187 621 286 266 257 NIR09 2,264 1,938 1,582 1,489 2,187 621 286 266 257 Diff. 0.0 0.0 0.0 0.0 0.0 0.0 0.0 0.0 0.0 HFCs Gg NIR08 4,432 6,020 3,824 1,469 1,541 1,379 1,511 1,353 1,559 NIR09 4,432 6,020 3,829 1,469 1,541 1,377 1,507 1,358 1,566 Diff. 0.0 0.0 5.4 -0.1 0.0 -1.6 -3.9 5.0 7.0 SF6 Gg NIR08 217 301 320 325 286 248 251 250 215 NIR09 217 301 319 323 283 243 246 238 202 Diff. 0.0 0.0 -1.1 -2.1 -3.1 -4.1 -5.1 -11.9 -12.9
Total Excl. LUCF NIR08 211.7 224.0 213.6 215.3 214.9 216.3 217.7 211.8 207.5
NIR09 212.0 224.6 214.4 215.9 215.5 216.7 218.0 212.2 208.5 Diff. 0.3 0.6 0.8 0.6 0.6 0.4 0.3 0.4 1.0
Total Incl. LUCF NIR08 214.3 226.4 216.3 217.9 217.5 218.9 220.3 214.3 210.1
NIR09 214.6 226.9 216.9 218.3 217.8 219.0 220.4 214.6 210.9 Diff. 0.3 0.4 0.6 0.4 0.3 0.1 0.1 0.2 0.9
directly related to transport statistics on vehicle-km, which differs to some extent from the IPCC approach.
Recalculations (due to changing methodologies), have only been performed for 1990, 1995, 2000, 2005, 2006 and 2007 for all sources. For that reason the precursor gas emissions in other years are interpolated (not the whole time series is presented in Table ES.4).
Emission trends for indirect greenhouse gases and SO2 (Unit: Gg).
1990 1995 2000 2001 2002 2003 2004 2005 2006 2007 Total NOx 545 449 386 376 369 366 346 330 317 290 Total CO 1,067 804 647 625 603 582 583 551 544 534 Total NMVOC 456 316 218 198 188 175 168 168 163 156 Total SO2 190 128 72 73 67 63 63 65 64 60 Table ES.4
Background information on greenhouse
1.1
gas inventories and climate change
General issues 1.1.1
The United Nations Framework Convention on Climate Change (UNFCCC) was ratified by the Netherlands in 1994 and entered into force in March of 1994. One of the commitments made by the ratifying Parties under the Convention is to develop, publish and regularly update national emission inventories of greenhouse gases.
This national inventory report documents the 2008 Green-house Gas Emission Inventory for the Netherlands under the UNFCCC and under the Kyoto Protocol. The estimates provided in the report are consistent with the Intergovern-mental Panel on Climate Change (IPCC) 1996 Guidelines for National Greenhouse Gas Inventories (IPCC, 1997) and the IPCC Good Practice Guidance and Uncertainty Management in National Greenhouse Gas Inventories (IPCC, 2001) and the IPCC Good Practice Guidance for Land Use, Land Use Change and Forestry (LULUCF). The methodologies applied for the Netherlands’ inventory are also consistent with the guidelines under the Kyoto Protocol and the European Union’s Green-house Gas Monitoring Mechanism.
For detailed assessments of the extent to which changes in emissions are due to the implementation of policy measures, the reader is referred to the annual Environmental Balance (PBL 2008, in Dutch), the Fourth Netherlands’ National Communication under the United Nations Framework Convention on Climate Change (VROM, 2005) and the Netherlands’ Report on Demonstrable Progress under Article 3.2 of the Kyoto Protocol (VROM, 2006b).
The Netherlands also reports emissions under other inter-national agreements, such as the United Nations Economic Commission for Europe (UNECE) Convention on Long Range Transboundary Air Pollutants (CLRTAP) and the European Union’s National Emission Ceilings (NEC) Directive. All these estimates are provided by the Netherlands’ Pollutant Release and Transfer Register, PRTR, which is compiled by the Environmental Assessment Agency. The greenhouse gas inventory and the PRTR share the same underlying data, which ensures consistency between the inventories and the internationally reported data. Several institutes are involved
in the process of compiling the greenhouse gas inventory (see also Section 1.3).
The National Inventory Report (NIR) covers the six direct greenhouse gases included in the Kyoto Protocol: carbon dioxide (CO2), methane (CH4), nitrous oxide (N2O),
hydrofluorocarbons (HFCs), perfluorocarbons (PFCs) and sulphur hexafluoride (SF6) (the F-gases). The emissions of
the following indirect greenhouse gases are also reported: nitrogen oxides (NOx), carbon monoxide (CO) and non-methane volatile organic compounds (NMVOC), as well as sulphur oxides (SOx).
This report provides explanations of the trends in greenhouse gas emissions per gas and per sector for the 1990–2007 period and summarizes descriptions of methods and data sources for: (a) Tier 1 assessments of the uncertainty in annual emissions and in emission trends; (b) key source assessments following the Tier 1 and Tier 2 approaches of the IPCC Good Practice Guidance (IPCC, 2001); (c) quality assurance and quality control (QA/QC) activities.
Under the National System under Article 5.1 of the Kyoto Protocol, methodologies were established (and documented) in monitoring protocols. These protocols are annually re-assessed and revised, if needed, e.g. based on recommendations of UN reviews. The monitoring protocols and the general description of the National System are available on the website www.greenhousegases.nl. The emissions reported in the NIR 2009 are based on these methodologies, which have been incorporated in the National System for greenhouse gases. The emissions and all the documentation are, with a delay of some months, available on the website www.prtr.nl.
In 2007 the UN performed an in-country review of the NIR 2006 and the initial review under the Kyoto Protocol. The review concluded that the Netherlands’ National System has been established in accordance with the guidelines and that it meets the requirements. The National System remained unchanged.
The structure of this report complies with the format
required by the UNFCCC (FCCC/SBSTA/2004/8). It also includes supplementary information under Article 7 of the Kyoto Protocol; Annex 11 gives an overview of this information.
Emissions of greenhouse gases presented in this report are given in gigagrammes (Gg) and teragrammes (Tg), and both the units and conversion factors used are given in Annex 9. Global warming potential (GWP) weighed emissions of the greenhouse gases are also provided (in CO2 equivalents). In accordance with the Kyoto Protocol, the IPCC GWP for a time horizon of 100 years is used. The GWP of each individual greenhouse gas is provided individually in Annex 9.
CRF files: greenhouse gas emissions 1.1.2
and background data
The Common Reporting Format (CRF) spreadsheet files accompany this report as electronic annexes (the CRF files are compressed into four zip files for this submission: 2009-v-1.2-90-93.zip; 2009-v-1.2-94-97.zip; CRF-NLD-2009-v-1.2-98-01.zip; CRF-NLD-2009-v-1.2-02-07.zip). The CRF files contain detailed information on greenhouse gas emis-sions, activity data and (implied) emission factors specified by sector, source category and greenhouse gas. Please note that the results of the key category analysis are included in the year 2004 instead of 2007 due to a minor bug in the CRF reporter. The complete set of CRF files as well as this report comprise the National Inventory Report (NIR) and are publis-hed on the website www.greenhousegases.nl.
In addition, trend tables and check tables compiled from CRF data as well as other information, such as protocols of the methods used to estimate emissions, are available on this website. Some summary tables are included in Annex 8 of this report:
IPCC summary Table 7A for 1990, 1995, 2000, 2005 and
2007 (CRF Summaries 1);
trend Table 10 for each gas individually, and for all gases
and sources in CO2 equivalents.
Section 10.4 provides details on the extent to which the
CRF data files for 1990–2007 have been completed.
Geographical coverage of the Netherlands’ inventory 1.1.3
The reported emissions have to be allocated to the legal territory of the Netherlands. This includes a 12-mile zone from the coastline and also inland water bodies. It excludes Aruba and the Netherlands Antilles, which are self-governing dependencies of the Royal Kingdom of the Netherlands. Emissions from offshore oil and gas production on the Dutch part of the continental shelf are included as are emissions from all electricity-generating activities in the Netherlands, including the electricity fraction that is exported. The Netherlands imported about 10% of its electricity up to 1999, but following the liberalization of the European electricity markets in that year, the net import in 2007 amounted to about 14% of the national electricity use. Emissions from the fishing fleet registered in the Netherlands, but sailing outside Dutch coastal waters for the most part, are included in the national total.
Institutional arrangements for inventory preparation
1.2
Overall responsibility 1.2.1
The Ministry of Housing, Spatial Planning and the
Environment (VROM) has overall responsibility for climate change policy issues.
Responsibility for “the National System” 1.2.2
In August 2004, the Ministry of VROM assigned SenterNovem executive tasks bearing on the National Inventory Entity (NIE), the single national entity required under the Kyoto Protocol. In December 2005, SenterNovem was designated by law as the NIE. In addition to coordinating the establishment of a National System, the tasks of SenterNovem include the overall coordination of (improved) QA/QC activities as part of the National System and coordination of the support/ response to the UNFCCC review process. The National System is described in more detail in SenterNovem et al. (2005c).
Responsibility for emission estimates 1.2.3
The Netherlands Environmental Assessment Agency (PBL, previously MNP) has been contracted by the Ministry of VROM to compile and maintain the pollutants emission regis-ter/inventory (PRTR system) and to coordinate the prepara-tion of the NIR and filling the CRF.
A Pollutant Emission Register (PRTR) has been in operation in the Netherlands since 1974. This system encompasses the process of data collection, data processing and the regis-tering and reporting of emission data for some 170 policy-relevant compounds and compound groups that are present in the air, water and soil. The emission data is produced in an annual (project) cycle (MNP, 2006). This system is also the basis for the national greenhouse gas inventory. In April 2004 full coordination of the PRTR was outsourced by the Ministry of VROM to the PBL (previously named MNP). This has resul-ted in a clearer definition and separation of responsibilities as well as a clustering of tasks.
The main objective of the PRTR is to produce an annual set of unequivocal emission data that is up-to-date, complete, transparent, comparable, consistent and accurate. In addition to PBL, various external agencies contribute to the PRTR by performing calculations or submitting activity data (see following Section), these include: CBS (Statistics Netherlands), TNO (Netherlands Organization for Applied Scientific Research), SenterNovem, Centre for Water Management, Deltares and several institutes related to the Wageningen University and Research Centre (WUR).
Responsibility for reporting 1.2.4
The NIR is prepared by PBL. Since mid-2005, the NIR has been part of the PRTR project. Most institutes involved in the PRTR also contribute to the NIR (including CBS and TNO, among others). In addition, SenterNovem is involved in its role as NIE.
A brief description of how the inventory is prepared
1.3
Introduction 1.3.1
The primary process of preparing the greenhouse gas inventory in the Netherlands is summarized in Figure 1.1. This process includes three major steps that are described in more detail in the following Sections.
Data supply and collection 1.3.2
Various data suppliers provide the basic input data needed for emission estimates. The most important data sources for greenhouse gas emissions include:
Statistical data
Statistical data are provided under various (i.e. not specifically greenhouse-gas related) obligations and legal arrangements. These include national statistics from Statistics Netherlands (CBS) and a number of other sources of data on sinks, water and waste. The provision of relevant data for greenhouse gases is guaranteed through covenants and an Order in Decree, the latter of which is under preparation by the Ministry of VROM. For greenhouse gases, relevant agreements with respect to waste management are in place with CBS and SenterNovem. An agreement with the Ministry of Agriculture, Nature and Food Quality (LNV) and related institutions was established in 2005.
Data from individual companies
Data from individual companies are provided in the form of annual environmental reports (MJVs). A large number of companies have a legal obligation to submit an MJV that includes – in addition to other pertinent information – emission data validated by the competent authorities (usually provincial and occasionally local authorities that also issue permits to these companies). A number of companies with large combustion plants are also required to report information under the so-called BEES/A regulation. Some companies provide data voluntarily, within the framework of environmental covenants. The data in these MJVs are used for verifying the calculated CO2 emissions from energy
statistics for industry, energy sector and refineries. If reports from major industries contain plant-specific information on activity data and emission factors of sufficient quality
and transparency, this data is used in the calculation of CO2
emission estimates for specific sectors.
The MJVs from individual companies provide essential information for calculating the emissions of substances other than CO2. The calculations of industrial process emissions
of non-CO2 greenhouse gases (e.g. N2O, HFC-23 and PFCs
released as by-products) are mainly based on information from these MJVs, as are the calculated emissions from precursor gases (CO, NOx, NMVOC) and SO2. As reported
in previous NIRs, only those MJVs with high-quality and transparent data are used as a basis for calculating total source emissions in the Netherlands.
Additional greenhouse-gas-related data
Additional greenhouse gas related data are provided by other institutes and consultants that are specifically contracted to provide information on sectors not sufficiently covered by the above-mentioned data sources. For greenhouse gases, contracts and financial arrangements are made (by PBL) with, for example, various agricultural institutes and TNO. In addition, SenterNovem contracts out various tasks to consultants (collecting information on F-gas emissions from cooling and product use, on improvement actions, etc.). During 2004, the Ministry of LNV also issued contracts to a number of agricultural institutes; these consisted of, in particular, contracts for developing a monitoring system and protocols for the LULUCF data set. Based on a written agreement between LNV and PBL, these activities are also part of the PRTR.
Data processing and storage 1.3.3
Data processing and storage are coordinated by PBL; these processes consist most notably of the elaboration of emission estimates and data preparation in the emissions data base and the CRF. The emission data are stored in a central database, thereby satisfying – in an efficient and effective manner – national and international criteria on emission reporting. This year PBL automated the process to fill the CRF with emissions from the central database.
The actual emission calculations and estimates that are made using the input data are implemented in five task forces, each dealing with specific sectors:
Figure 1.1 The greenhouse gas inventory process
Data supplier e.g.
CBS, companies ER (and others)PBL VROM, UNFCCC
SenterNovem Reporting Data supply, basic input data incl. MJV’s Approval and review Data processing CRF NIR
energy, industry and waste (combustion, process
emissions, waste handling) agriculture (agriculture, sinks)
consumers and services (non-industrial use of products)
transport (including bunker emissions)
water (less relevant for greenhouse gas emissions)
The task forces consist of experts from several institutes. In 2008, in addition to the PBL, these included TNO, CBS, Centre for Water Management, Deltares, FO-I (the Facilitating Organization for Industry, which co-ordinates annual
environmental reporting by companies), SenterNovem (Waste Management division) and various agricultural research institutes: Alterra (sinks) and LEI. The task forces are responsible for assessing emission estimates based on the input data and emission factors provided. PBL commissioned TNO to assist compiling the CRF.
Reporting, QA/QC, archiving and overall coordination 1.3.4
The NIR is prepared by PBL with input from the experts in the relevant PRTR task forces and from SenterNovem. This step includes documentation and archiving. The Ministry of VROM formally approves the NIR before it is submitted; in some cases approval follows consultation with other ministries. SenterNovem is responsible for coordinating QA/ QC and responses to the EU and for providing additional
information requested by the UNFCCC after the NIR and the CRF have been submitted. SenterNovem is also responsible (in collaboration with PBL) for coordinating the submission of supporting data to the UNFCCC review process.
Brief description of methodologies
1.4
and data sources used
Methodologies 1.4.1
Table 1.1 provides an overview of the methods used to estimate greenhouse gas emissions. Monitoring protocols documenting the methodologies and data sources used in the greenhouse gas inventory of the Netherlands as well as other key documents are listed in Annex 6. The protocols were elaborated, together with relevant experts and institutes, as part of the monitoring improvement program.
Explanation of notation keys used:
Method applied: D, IPCC default; RA, reference approach;
T, IPCC Tier; C, CORINAIR; CS, country-specific; M, model. Emission factor used: D, IPCC default; C, CORINAIR; CS,
country-specific; PS, plant-specific; M, model.
Other keys: NA, not applicable, NO, not occurring; NE, not
estimated; IE, included elsewhere.
All key documents are electronically available in PDF-format at www.greenhousegases.nl. The monitoring protocols describe methodologies, data sources and QA/QC procedures for estimating greenhouse gas emissions in the Netherlands. The sector-specific chapters provide a brief description per key source of the methodologies applied for estimating the emissions.
Data sources 1.4.2
The monitoring protocols provide detailed information on activity data used for the inventory. In general, the following primary data sources supply the annual activity data used in the emission calculations:
fossil fuel data: (1) national energy statistics from CBS
(National Energy Statistics; Energy Monitor); (2) natural gas and diesel consumption in the agricultural sector (Agricultural Economics Institute, LEI)
residential biofuel data: (1) annual survey of residential
woodstove and fireplace penetration from the Association for Comfortable Living (Vereniging Comfortabel Wonen); (2) a 1996 survey on wood consumption by owners of residential woodstoves and fireplaces from the Stove and Stack Association (Vereniging van Haard en Rookkanaal, VHR)
transport statistics: monthly statistics for traffic and
transportation
industrial production statistics: (1) annual inventory reports
from individual companies; (2) national statistics consumption of HFCs: annual reports from the
accountancy firm, PriceWaterhouseCoopers (only HFC data are used due to inconsistencies for PFCs and SF6 with
emissions reported elsewhere) consumption/emissions of PFCs and SF
6: reported by
individual firms
anesthetic gas: data provided by Hoekloos, the major
supplier of this gas
spray cans containing N2O: the Dutch Association of
Aerosol Producers (Nederlandse Aerosol Vereniging, NAV) animal numbers: from the CBS/LEI agricultural database,
plus data from the annual agricultural census manure production and handling: from the CBS/LEI
national statistics
fertilizer statistics: from the LEI agricultural statistics
forest and wood statistics: (1) harvest data: FAO harvest
statistics; (2) stem-volume, annual growth and fellings: Dirkse et al, (2003) (3) carbon balance: National Forestry Inventory data based on two inventories: HOSP (1988-1992) and MFV (2001-2005)
land use and land use change: based on digitized and
digital topographical maps of 1990and 2004 (Kramer et al, 2009, in preparation)
area of organic soils: De Vries (2004)
soil maps: De Groot et al. (2005)
waste production and handling: Working Group on Waste
Registration (WAR), SenterNovem and CBS CH
4 recovery from landfills: Association of Waste Handling
Companies (VVAV)
Many recent statistics are available on the internet at CBS’s statistical website Statline and in the CBS/PBL environmental data compendium. However, it should be noted that the
units and definitions used for domestic purposes on those websites occasionally differ from those used in this report (for instance: temperature corrected CO2 emissions versus
actual emissions in this report; in other cases, emissions are presented with or without the inclusion of organic CO2 and
with or without LULUCF sinks and sources).
A brief description of the key categories
1.5
The analysis of key sources is performed in accordance with the IPCC Good Practice Guidance (IPCC, 2001). To facilitate the identification of key sources, the contribution of source categories to emissions per gas are classified based on the IPCC potential key source list as presented in Table 7.1, Chapter 7 of the Good Practice Guidance.
A detailed description of the key source analysis is provided in Annex 1 of this report. Per sector, the key sources are also listed in the first Section of each of Chapters 3–8.
Compared to the key source analysis for the NIR 2008, the key categories have changed as follows:
N
2O emissions from 1A3 Mobile combustion: road vehicles:
now non-key; CO
2 emissions from 2A7 Other minerals: now non-key;
N
2O emissions from 2B5 Caprolactam production now
non-key; CO
2 emissions from 5C2 Land converted to Grassland now
key; CO
2 emissions from 5F2 Land converted to other land now
non-key; N
2O emissions from 6B waste water handling now key
Information on the QA/QC plan
1.6
As one of the results of a comprehensive inventory improvement program, a National System fully in line with the Kyoto requirements was finalized and established by the end of 2005. As part of this system also an Act on the Monitoring of Greenhouse Gases also became effective in December 2005. This Act determines the establishment of the National System for monitoring of greenhouse gases and empowers the Minister of Housing, Spatial Planning and the Environment (VROM) to appoint an authority responsible for the National System and the National Inventory. The Act also determines that the National Inventory be based on methodologies and processes as laid down in the monitoring protocols. In a subsequent regulation the Minister has appointed SenterNovem as NIE (National Inventory Entity) and published a list of the protocols. Adjustments to the protocols will require official publication of the new protocols and announcement of publication in the official Government Gazette (Staatscourant).
As part of its National System, the Netherlands has developed and implemented a QA/QC program. This program is yearly assessed and updated, if needed. The key elements of the current program (SenterNovem, 2008) are briefly summarized in this chapter, notably those related to the current NIR.
QA/QC activities for the CRF/NIR 2009 1.6.1
The Monitoring Protocols were elaborated and implemented in order to improve the transparency of the inventory (including methodologies, procedures, tasks, roles and responsibilities with regard to inventories of greenhouse gases). Transparent descriptions and procedures of these different aspects are described in the protocols for each gas and sector and in process descriptions for other relevant tasks in the National System. The protocols are assessed annually and updated if needed.
Various QC issues
Inconsistencies in the key category analysis between
–
CRF and NIR were analyzed and removed. The key cate-gory analysis is updated in the NIR (Annex 1) as well as the CRF files
The Expert Review Team (ERT) recommended providing
–
more information in the NIR report and protocols, that was until now only included in background information. The Netherlands is preparing an update of the protocols; for various sectors this implies that more information will be included in the protocols, as requested by the ERT. This update will be finalized before the NIR 2010 In 2008 a quantitative assessment was made of the
–
possible (in)consistencies in CO2 emissions between data
from ETS, NIR and National Energy Statistics. The figures that were analyse concerned about 40% of the CO2
emis-sions in the Netherlands in 2006 and 2007. The differen-ces could reasonably be explained (e.g. different scope) within the given time available for this action [Guis et al, 2009]. Recommendations were elaborated for future improvements. One of these implies an annual update comparison as a sectorspecific QA/QC action, when new annual data become available.
The ERT recommended providing more specific
–
information on sector specific QC activities. A start has been made; this will be further expanded in the NIR 2010 Finally, the Netherlands continues its efforts to include
–
the correct notation keys in the CRF files
For the NIR 2009 changes were incorporated to and
references were updated in the National System website (www.greenhousegases.nl), providing additional informa-tion on the protocols and relevant background documents; General
QC checks were performed. To facilitate these general QC checks, a checklist was developed and implemented. A number of general QC checks have been introduced as part of the annual work plan of the PRTR and are also mentioned in the monitoring protocols. The QC checks included in the work plan, aim at covering issues such as consistency, completeness and correctness of the CRF data, among others.
The general QC for the present inventory is largely performed in the PRTR, as an integrated part of the working processes. The PRTR task forces fill in a standard-format database with emission data for 1990–2007. After a first check of the emission files by PBL and TNO for completeness, the (corrected) data are available to the specific task force for checking consistency checks and trend analysis (comparability, accuracy). The task forces have access to information about the relevant emissions in the database. Several weeks before the dataset is fixed, a trend verification workshop is organized by PBL (see Box 1.1).
Quality Assurance for the current NIR includes the following activities:
A peer and public review on the basis of the draft NIR
–
in January/February 2009. Results of this review are summarised in Chapter 10 and have been dealt with as far as possible in the present NIR.
In preparing this NIR, the results of former UNFCCC
–
reviews, including the results of the initial review in 2007 and the review of the NIR 2007 and NIR 2008 in September 2008 have been taken into account in Chapters 3–8 whereever possible (see also Chapter 10.4.2 for an overview).
As part of the evaluation process of the previous cycle,
–
internal audits were carried out by SenterNovem on
Several weeks in advance of a trend analysis meeting, a snapshot from the database is made available by PBL in a webbased application (so-called Emission Explorer, EmEx) for checks by the involved institutes and experts (PRTR task forces). This allows the task forces can check for level errors and consistency in the algorithm/method used for calculations throughout the time series. The task forces perform checks for CO2, CH4 and N2O emissions, among others, from all sectors. The totals for the sectors are then compared with the previous year’s data set. Where significant differences are found, the task forces evaluate the emission data in more detail. The results of these checks are then subject to discussion at the trend analysis workshop and subsequently documented. Furthermore, the task forces were provided with the CRF Reporter software to check the time series of emissions per substance and the CRF. The task forces examine these time
series. During the trend analysis the greenhouse gas emissions for all years between 1990 and 2007 were checked in two ways: (1) emissions from 1990 – 2006 should (with some exceptions) be identical to those reported last year; (2) the data for 2007 were compared with the trend development for each gas since 1990. Checks of outliers were carried out at a more detailed level for the sub-sources of all sector background tables: • annual changes in emissions of all greenhouse gasses • annual changes in activity data
• annual changes in implied emission factors • level values of implied emission factors
Exceptional trend changes and observed outliers are noted and discussed at the trend analysis workshop, resulting in an action list. Items on this list must either be processed within 2 weeks or be dealt with in next year’s inventory.