GREENING THE COMMON
AGRICULTURAL POLICY:
IMPACTS ON FARMLAND
BIODIVERSITY ON AN EU
SCALE
This policy study is a publication by
PBL Netherlands Environmental Assessment Agency Mailing address PO Box 30314 2500 GH The Hague The Netherlands Visiting address Oranjebuitensingel 6 2511VE The Hague T +31 (0)70 3288700 www.pbl.nl/en August 2011
POLICY STUDIES
Agriculture not only produces food, but also provides a habitatfor various wild animal and plant species. However, intensifica-tion of farming practices endangers this habitat. Greening of the Common Agricultural Policy (CAP) offers opportunities to reduce the ongoing loss of biodiversity in agricultural areas. This report analyses the potential impacts of options for greening the CAP as proposed by the European Commission in late 2010. For this analysis, the PBL used a species richness indicator that was developed for EU farmlands. Trade-offs between biodiversity and agricultural production are presented and suggestions are made for increasing the efficiency of using the EU budget for greening the CAP.
Keywords:
agriculture, farmland biodiversity, greenhouse gases, Common Agricultural Policy
Greening the Common Agricultural
Policy: impacts on farmland
Greening the Common Agricultural Policy: impacts on farmland biodiversity on an EU scale
© PBL Netherlands Environmental Assessment Agency The Hague, 2011 ISBN: 978-90-78645-70-2 PBL publication number: 500136005 Corresponding author henk.vanzeijts@pbl.nl Authors
Henk van Zeijts, Koen Overmars, Willem van der Bilt, Nynke Schulp, Jos Notenboom, Henk Westhoek (PBL), John Helming, Ida Terluin (LEI - Wageningen UR), Sander Janssen (Alterra - Wageningen UR)
Supervisor Guus de Hollander
Acknowledgements
The extensive review by experts outside the PBL has been greatly appreciated. Special thanks to the Institute for European Environmental Policy for hosting an informal meeting with stakeholders in Brussels to discuss draft results.
English editing Annemieke Righart Graphics
Marian Abels, Jan de Ruiter, Filip de Blois, Arie den Boer Production co-ordination
PBL Publishers Layout
Martin Middelburg (Studio, RIVM)
This publication can be downloaded from: www.pbl.nl/en. A hard copy may be ordered from: reports@pbl.nl, citing the PBL publication number or ISBN.
Parts of this publication may be reproduced, providing the source is stated, in the form: Zeijts, H. van, et al. (2011), Greening the Common Agricultural Policy: impacts on farmland biodiversity on an EU scale, The Hague: PBL Netherlands Environmental Assessment Agency.
PBL Netherlands Environmental Assessment Agency is the national institute for strategic policy analysis in the field of environment, nature and spatial planning. We contribute to improving the quality of political and administrative decision-making by conducting outlook studies, analyses and evaluations in which an integrated approach is considered paramount. Policy relevance is the prime concern in all our studies. We conduct solicited and unsolicited research that is both independent and always scientifically sound.
Contents
FINDINGS 7
Greening the Common Agricultural Policy: impacts on farmland biodiversity on an EU scale 8 Summary 8
I Introduction 10
II Scenarios and models 10 III Results 13
IV Discussion 16 V Policy implications 18 FULL RESULTS 21
1 Policy context, scenarios and models 22 1.1 Common Agricultural Policy 22
1.2 Biodiversity policy 24
1.3 Description of Baseline and Greening Scenarios 27 1.4 Models 28
2 Impacts on farmland biodiversity 32 2.1 Agricultural land use 32
2.2 Species richness 34
2.3 Discussion of model results, on the basis of the literature 41 3 Impacts on greenhouse gas emissions 48
3.1 Carbon dioxide emissions from agricultural soils 48 3.2 Emissions from agricultural practices 49
4 Impacts on production, prices and income 52 4.1 Agricultural production 52
4.2 Farm incomes 54 References 58
Greening the Common
Agricultural Policy: impacts
on farmland biodiversity on
an EU scale
Summary
What are the potential gains in EU farmland biodiversity of greening the Common Agricultural Policy (CAP)? And what would be the trade-offs with agricultural production and farm incomes? These are the central questions of a modelling study carried out by the PBL Netherlands Environmental Assessment Agency, in cooperation with LEI and Alterra from Wageningen University & Research centre. An ex ante analysis of a set of five policy
components was carried out for the 2014–2020 period, based on the European Commission’s communication document The CAP towards 2020 of 18 November 2010.
Greening the Common Agricultural Policy reduces
the ongoing loss of farmland biodiversity
• According to this study, greening the CAP may result in approximately three per cent more species richness on EU farmland by 2020, compared with no greening of the CAP. This in itself does not mean that biodiversity would improve, as autonomous trends probably will decline by a larger percentage. Although greening the CAP would not halt biodiversity loss, it would substantially slow down the decline in farmland biodiversity over the 2014–2020 period. • This impact on species richness follows from a
calculation of five policy components, taken from the EC (2010) communication document The CAP towards 2020 (see Table 1 of Section II). Most of the impact can be attributed to an increase in extensively managed,
biodiversity-rich grassland, due to additional agri-environmental measures taken in the EU15 (old Member States), as well as greening payments conditional on ecological set-aside of an assumed five per cent of arable land throughout the EU.
• There would be a clear trade-off between biodiversity gains and production losses. According to model calculations, greening the CAP would lead to a decline in agricultural production, for example, of two per cent for grass and four per cent for cereals, by 2020, in the EU27. This is mainly due to the projected
extensification of grassland and ecological set-aside on arable land.
• Despite the observed decline in production because of this greening of the CAP, average agricultural income would not decrease – it would in fact increase, slightly. As EU food demand is not expected to change substantially, EU prices are projected to rise as a result of lower production, with only small changes in EU import and export.
• Income changes would differ considerably between regions. Linking CAP payments to biodiversity would improve incomes in extensive farming regions – in particular, in those with grazing systems – and would lead to a decrease in farm incomes in areas with intensive arable farming.
The effectiveness and efficiency of greening the
CAP could be improved by regional differentiation
and by alleviating negative trade-offs through
better targeting
• The regions with intensive and extensive farming vary substantially in current species richness and farm incomes, and also with regard to impacts of CAP measures. This would imply that a regionally differentiated policy may be more appropriate than a one-size-fits-all approach. For example, in regions with extensive farming systems, a policy that preserves all or at least part of the current biodiversity-rich agricultural land seems more adequate than mandatory ecological set-aside. This would imply a specialisation in intensively farmed areas focusing on input-efficient production, and extensively managed areas serving as source areas for agricultural biodiversity.
• There are several options to alleviate the trade-off between budget requirements, biodiversity and production. Examples are the targeting of CAP budget towards areas already rich in biodiversity, as well as the implementation of measures related to a regional ‘green infrastructure’ in agricultural areas, which would effectively facilitate the spread of source populations. At farm level, individual producers could reduce production losses by using the least-producing fields and field edges for agri-environmental measures and set-aside.
Greening the CAP would achieve multiple
objectives
• Results from our calculations demonstrate a decrease, but no halting of farmland biodiversity loss. It should be noted, however, that biodiversity is only one of many CAP objectives – the main objectives remain securing the availability of food supplies and ensuring a fair standard of living for farmers. Greening the CAP may yield a broad range of positive impacts if greening measures are combined with stimuli from adjacent policy areas. Retaining permanent grassland prevents the emission of carbon dioxide from agricultural soils. Set-aside could form a buffer for agricultural run-off before polluted water drains into ditches or streams, thus improving water quality. Greening measures also could benefit the recreational appeal of landscapes, for example, by the construction of green infrastructure. Such infrastructure could also deliver a number of ecosystem services, such as biological pest control.
I Introduction
Policy context: the CAP and EU biodiversity strategy
How to integrate biodiversity goals into agricultural policy? This question embraces two EU policy dossiers: the Common Agricultural Policy (CAP) and the recently published EU biodiversity strategy.Discussion on the reform of the CAP is ongoing. On 18 November 2010 the European Commission (EC) published its communication document The CAP towards 2020: Meeting the food, natural resources and territorial challenges of the future. This communication document outlines the challenges and future policy options for the period between 2014 and 2020. The future CAP aims at viable food production throughout the EU, to guarantee long-term food security, sustainable management of natural resources and a balanced territorial development. The EC (2010) states that agriculture plays a key role in the production of public goods, such as landscapes, farmland biodiversity and climate stability.
The EU biodiversity strategy to 2020 of 3 May 2011 states that the forthcoming reform of the CAP presents
opportunities to enhance synergies and maximise coherence with biodiversity objectives (EC 2011). With regard to agriculture, the target is to maximise areas that are covered by biodiversity-related measures under the CAP, to ensure and improve the conservation status of species and habitats that depend on or are affected by agriculture, and to provide ecosystem services, thus contributing to sustainable agricultural management. The CAP and the biodiversity strategy both aim at enhancing the provision of environmental public goods by farmers. The European Commission suggests improvement and simplification of the Good Agricultural and Environmental Conditions (GAEC) framework as well as cross-compliance standards. The Commission also proposes to reward the delivery of environmental public goods that go beyond cross-compliance (e.g. permanent grasslands, green cover, crop rotation, ecological set-aside, Natura 2000) (EC, 2010; EC, 2011). From the CAP perspective, the objective is not only to contribute to climate and environmental policy goals, but also to increase legitimacy for CAP payments by remunerating farmers for the collective services they provide to society (EC, 2010).
Focus and aim of this study
This study by the PBL Netherlands Environmental Assessment Agency – in close cooperation with LEI and Alterra from Wageningen University & Research centre – investigates the impacts of CAP measures, as outlined by the EC, on farmland biodiversity on an EU scale.
Although a vast amount of research has been carried out on the relationship between agricultural policy and biodiversity, quantifications of farmland biodiversity impacts on an EU-wide scale are scarce. The present study fills this gap by combining economic and land-use modelling with a recently developed farmland
biodiversity indicator (see Subsection 1.4.4 of the Full Results). Furthermore, literature was reviewed in order to verify and complement the modelled results.
The aim of this study is to quantify the effects that a number of suggested modifications of the CAP may have on farmland biodiversity in the EU. Impacts of these modifications have been compared with a reference scenario. In addition, effects on emission and
sequestration of greenhouse gases have been quantified, as well as trade-offs between greening measures, and food production and farm incomes. Suggestions are presented for increasing both the effectiveness of the proposed policy modifications and the synergies with other goals.
Whether greening the CAP is the most efficient strategy to conserve and improve farmland biodiversity was not investigated in this study, as no comparison was made with alternative strategies outside the CAP.
Approach and reading guide
The steps carried out in this study involved:
− constructing a reference scenario (Baseline Scenario) and a greening scenario (Section II of the Findings; Section 1.3 of the Full Results);
− modelling the scenarios – for a description of the applied models see Section II (Findings) and Section 1.4 of the Full Results;
− explaining the results and underlying mechanisms (Section III, Chapters 2 to 4 of the Full Results); − discussing, interpreting and complementing model
results, underscoring limitations and uncertainties, aided by references to the literature reviewed (Section IV, Section 2.3 of the Full Results);
− drawing of conclusions relevant to policymakers (Section V).
II Scenarios and models
This study explores the potential impacts of a greening scenario, compared to a reference scenario (Baseline Scenario). Under both scenarios, the current two-pillar structure of the CAP is retained – the first pillar involving direct income payments to farmers, as well as market measures, and the second pillar covering rural
development support. However, modifications to the first pillar are foreseen in the Greening Scenario. The total CAP
budget is the same in both scenarios and is assumed to average 59 billion euros per year (including phasing-in of subsidies for the new Member States), over the 2014– 2020 period.
Baseline Scenario
The Baseline Scenario describes the reference situation and extrapolates past and present trends towards 2020. Price developments were taken from outlook studies (e.g. (OECD and FAO, 2009). The CAP according to the
reference scenario beyond 2014 is similar to that of pre-2014, with the exception of policy changes described in the Health Check agreement (EC, 2009), which were implemented in this scenario. These changes involve the full decoupling of income support from farm production and the abolishment of the milk quota system by 2015. In addition, the introduction of a regional flat rate (premium per hectare) is considered to be part of the Baseline Scenario.
Greening Scenario
The Greening Scenario is based on Option 2 of the European Commission’s communication document on the CAP, which describes three broad policy options (EC, 2010). This second option concerns a transition towards an increased emphasis on sustainability, targeting multiple environmental goals, making the policy greener and more understandable to the general public. Our study concentrates on the impacts of this option, as this contains a rich mix of greening measures.
The Greening Scenario includes assumptions taken from the Baseline Scenario as well as additional elements from Option 2. It should be stressed that the Greening Scenario is our interpretation of the EC document, as the policy options have not been described in detail. Within the context of Option 2, policy elements were selected that have a known effect on biodiversity, which could be quantified with the available modelling instruments. Consequently, budget resources were attributed to the various elements in a plausible manner. This of course was done arbitrarily, as no political decision had been
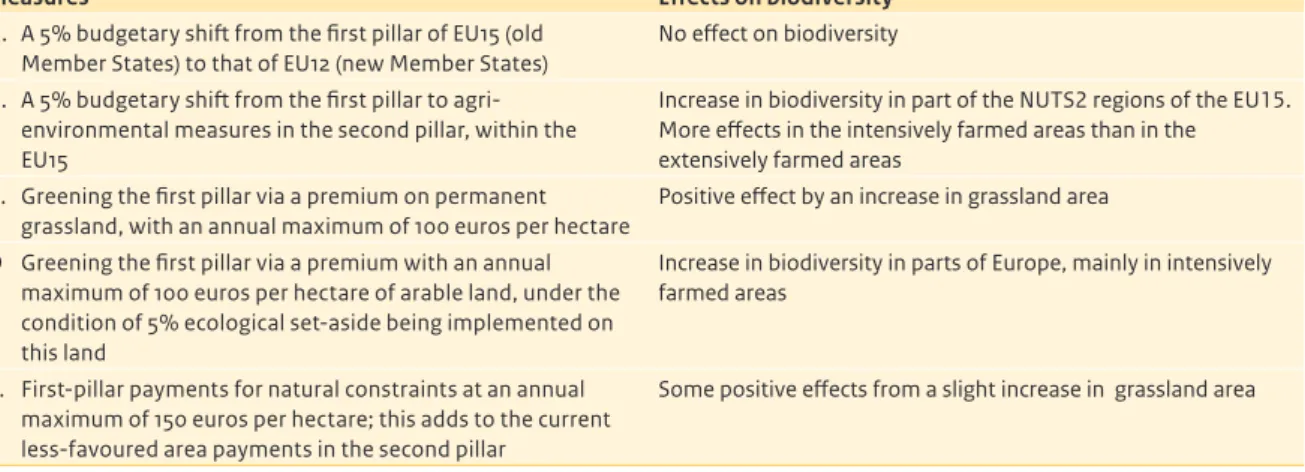
Table 1
Elements within the Greening Scenario, compared to Option 2 of the EU communication document on The CAP towards 2020
Elements from the description of Option 2
(EC, 2010: 14)
Stylised implementation of Option 2 in the
Greening Scenario (in this study)
Introduce more equity in the distribution of direct payments between Members States.
A. A 5% budgetary shift from the first pillar of EU15 (old MS) to the first pillar of EU12 (new MS).
Adjust and complement existing rural development instruments to be better aligned with EU priorities.
B. A 5% budgetary shift from the first pillar to agri-environmental measures in the second, within the EU15. Within direct payments: compulsory additional aid for specific
‘greening’ of public goods through simple, generalised, annual and non-contractual agri-environmental actions.
C. Greening the first pillar via a premium on permanent grassland, with an annual maximum of 100 euros per hectare. D. Greening the first pillar via a premium with an annual
maximum of 100 euros per hectare of arable land, on the condition of a 5% ecological set-aside being implemented on this land.
The greening payments are restricted to a ceiling of 30% of the first-pillar budget of each Member State.
Within direct payments: an additional payment to compensate for specific natural constraints.
E. First-pillar payments for natural constraints at an annual maximum of 150 euros per hectare; this adds to the current less-favoured area payments within the second pillar. The budget is restricted to a ceiling of 30% of the first-pillar budget of each Member State.
Within direct payments: basic rate serving as income support. F. Basic rate serving as income support.
At least 40% of direct payments per Member State are used for income support.
A voluntary coupled support component for specific sectors and regions.
A new scheme for small farms. A capping of the basic rate (large farms).
not included
Improve and simplify existing market instruments. not included
Strengthen risk management tools and introduce an income
stabilisation tool. not included
made yet at the start of our study; neither on the size of the total EU budget which includes the CAP budget (Multiannual Financial Framework 2014-2020) nor on the distribution to the various elements within the CAP. Table 1 gives an overview of the elements within the Greening Scenario, and Figure 1 shows the average budget allocation per policy component, following from the assumptions made. Under the Greening Scenario, half of the first-pillar budget is allocated to greening measures in the first pillar. Analysis of the scenario provides
information on the relative importance of the individual policy elements.
Models used
Calculations were made for the European Union (EU27). The following set of five models was applied:
− The Common Agricultural Policy Regionalised Impact Modelling System (CAPRI), a partial equilibrium model for the agricultural sector at NUTS2 level. This economic model uses an aggregated regional farm approach (see Subsection 1.4.1 of the Full Results). − Dyna-CLUE (Conversion of Land use and its Effects), a
dynamic, spatially explicit model on changes in land use and land cover (Subsection 1.4.2).
− Land-use intensity calculation model, processing results from CAPRI in order to obtain input for the farmland biodiversity model (Subsection 1.4.3). − A newly developed farmland biodiversity model for
species richness in EU agricultural areas (Subsection 1.4.4).
− A carbon budget model for calculating carbon dioxide emissions from land-use changes (Subsection 1.4.5).
Limitations
The strength of the methodology lies in the fact that impacts of policy instruments on performance of the agricultural sector can be linked with changes in land use and land-use intensity, and dominant drivers in farmland biodiversity. However, this approach has some
limitations, too. The economic calculation (CAPRI) was carried out on a regional scale (NUTS2), which could not capture specifics on local details and farm types. Likewise, the assumed biodiversity measures were applied at field or farm level, which excludes the level of the wider landscape.
In addition, species richness calculations were based on land-use intensity, which left out certain aspects, such as crop diversity and winter cover (see Section IV,
Discussion). Furthermore, areas classified as semi-natural lands often were excluded from our analysis, mainly due
Figure 1 0 20 40 60 80 100 % Second pillar Rural development First pillar
Payment natural constraints Greening measures Direct income support EU15 – Old Member States
EU12 – New Member States
EU15
Allocation of CAP budget in EU27, 2014 – 2020
0 20 40 60 80 100 % EU12
Baseline Scenario Greening Scenario Baseline Scenario Greening Scenario
to the fact that they were left out of the EU agricultural survey. Finally, our indicator consists of typical farmland species and is not intended for calculating effects on biodiversity in nature areas.
III Results
Agri-environmental measures and ecological
set-aside have positive effects on biodiversity
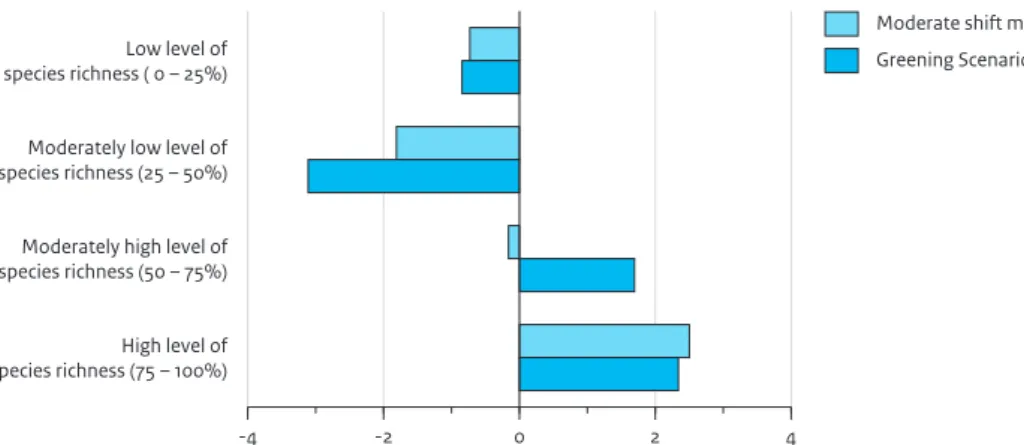
The Greening Scenario will result in approximately three per cent more species richness on EU farmland, by 2020, compared with the Baseline Scenario (Table 2). This would slow down the rate of decline in farmland biodiversity to half of the expected decline, over the 2014–2020 period, at least when recent trends of the European Farmland Bird Index (EFBI) are used as a proxy for future, autonomous trends. Note however, that our farmland biodiversity indicator measures species richness for all 145 selected animal and plant species, whereas the EFBI measures the abundance of farmland birds. Both are only comparable to a certain degree.For arable land, more than half the increase in species richness may be explained by ecological set-aside (measure D in Table 1), as a set-aside of five per cent of the arable area would facilitate colonisation and
recolonisation of these areas as well as migration of species across the landscape. With regard to grassland, increases in biodiversity mainly would be driven by an increase in agri-environmental measures, due to a five per cent budgetary shift from the first pillar towards these measures in the second pillar, in the EU15 (measure B). Under the Greening Scenario, the greening payment for permanent grassland (measure C) would have little effect on biodiversity, relative to the Baseline Scenario. Although this payment is a stimulus for not converting grassland into arable land, the premium related to arable land that is conditional on a five per cent ecological set-aside would have an opposite effect, caused by indirect land-use impacts, as arable set-aside in place X may lead to conversion of grassland into arable land in place Y. Also, ecological set-aside would lead to some
intensification of surrounding grassland, in order to compensate for decreased fodder production on arable land. Furthermore, species-rich semi-natural grasslands were excluded from both the Baseline and the Greening Scenarios. These areas could significantly contribute to agricultural biodiversity when preserved through CAP measures.
Greening measures increase farmland biodiversity
in intensive farming regions, less impact in
extensively farmed regions
The proposed greening measures appear to be mainly effective in intensively farmed regions (Figure 2) on the time horizon of our analysis. This is particularly the case for ecological arable set-aside; biodiversity would increase in north-western Europe, with its large share of intensive farming, whereas little change is foreseen for eastern and southern Europe for 2020. This mainly would be due to the fact that arable land in the last two areas is already under low or intermediate management. Consequently, set-aside would have only a limited effect on biodiversity here. Additionally, arable set-aside would lead to some conversion of grassland into arable land and intensification of the use of remaining grasslands. For grassland, the positive effects also would be most evident in the EU15 (Figure 2), due to the previously mentioned five per cent shift from the first pillar to agri-environmental measures in the second (Table 1). The Greening Scenario does not assume a similar shift in the EU12 because the rural development budget (including agri-environment schemes) is already relatively high for these new Member States. However, it should be noted that, compared to the Baseline Scenario, positive effects might be more profound in the EU12 over longer periods of time. The permanent grassland premium as well as payment for natural constraints would particularly protect high ecological values that might otherwise be at risk, for example, due to conversion, intensification or abandonment.
Table 2
Species richness relative to its potential occurrence on a 50 x 50 km grid, EU27 average by 2020
Baseline Scenario Greening Scenario
% % Change in
percentage points
Change %
Arable land 39.1 40.3 +1.2 +3.1
Grassland 66.4 69.0 +2.6 +3.9
All agricultural land 48.5 50.1 +1.6 +3.3
No clear-cut conclusion regarding the threats to
permanent grassland
Maintaining permanent grassland– at least the extensively managed grasslands – is important for biodiversity and for sequestration of carbon in soils. Additionally, grasslands also play a major part in limiting soil erosion. Given the vast quantities of carbon stored in European soils and the limited potential of soils to fix additional carbon, preventing soil carbon loss by limiting the conversion of grasslands and peatlands is crucial. The impacts of the greening measures on total grassland area are positive, but limited. Under the Baseline Scenario, the total grassland area in 2020 is 94% compared with the 2005 level, and under the Greening Scenario this is 95%. This leads to a 0.5 to 1 million tonnes lower carbon dioxide emissions from soils under the Greening Scenario, compared with that under the Baseline
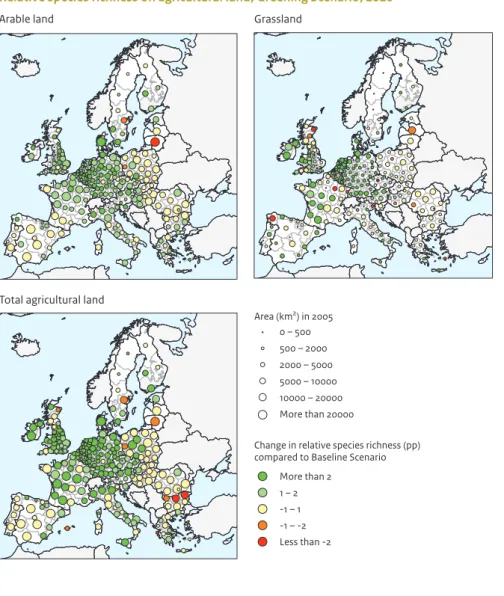
Scenario. This outcome, however, is also influenced by the fact that a stable share of permanent grassland in total grassland was assumed. Conversion from grassland to arable land (and vice versa) was included in the model calculations, but changes between permanent and temporary grassland were not included in the economic, carbon and biodiversity modelling. From a biodiversity perspective, the effects of the permanent grassland premium would be rather limited, as stated before. It also should be noted that a permanent grassland premium does not place any restrictions on management intensity, which makes intensively farmed, species-poor permanent grassland eligible, too. Meanwhile, many biodiversity rich, extensively managed grasslands are not eligible for CAP payments, because of the presence of non-herbaceous vegetation. Figure 2 Area (km2) in 2005 0 – 500 500 – 2000 2000 – 5000 5000 – 10000 10000 – 20000 More than 20000
Change in relative species richness (pp) compared to Baseline Scenario
More than 2 1 – 2 -1 – 1 -1 – -2 Less than -2
Relative species richness on agricultural land, Greening Scenario, 2020
Arable land Grassland
Total agricultural land
The contribution under the Greening Scenario to
the reduction in global greenhouse gas emissions
is close to zero
The measures implemented in the Greening Scenario lead to just a small reduction in greenhouse gas emissions from agricultural activities. Most pronounced is the 1.3% reduction in nitrous oxide emissions. This is explained by the 5% ecological set-aside, which results in a reduction in mineral fertiliser input. Methane emissions are reduced by 0.5%; in particular, due to a small reduction in the stock of beef cattle. As EU imports of, for example, oil seeds, cereals and beef, are slightly up in the Greening Scenario from those in the Baseline Scenario, leading to some increase in emissions outside the EU, it would be fair to say that overall emission reduction is close to zero.
The Greening Scenario leads to lower EU
production and a slight change in self-sufficiency
Agricultural production is lower under the Greening Scenario, compared with the Baseline Scenario, mainly because of extensification of grassland use (agri-environmental measures in the EU15) and ecological set-aside on arable land. As stated before, this could lead to intensification on some of the remaining agricultural area, extra imports (in particular of oil seeds) and fewer exports (in particular of cereals). All in all, in the EU cereal production will go down by 4% and grass production by 2% (Figure 3), the latter particularly affecting beef production. Effects on land use outside the EU – due to increasing EU imports – would be relatively small. For example, under the Greening Scenario, the 2020 production outside the EU would be higher by 0.2% forcereals and 0.65% for oil seeds, relative to the Baseline Scenario.
Price increases counteract the negative impact of
production losses on average farm incomes
The average farm income does not decrease under the Greening Scenario, compared with the situation under the Baseline Scenario. In fact, the Greening Scenario predicts an increase of 2% in average income, due to the fact that production loss is combined with producer price increases (Figure 4). The impact would be quite large, as food demand would barely change as a result of price changes (inelastic demand). However, the price impact should be interpreted with care, as interaction with world markets could diminish EU price increase more than is assumed in the CAPRI calculations. Moreover, supply effects could be overestimated as it is assumed that yield losses on ecological set-aside equal average yields, whereas, in actual practice, farmers may use the least-productive land on their farms as set-aside. All in all, the income increases resulting from price changes might be less than two per cent.Figure 3
Cereals
Effects on cereals and grass production, compared to Baseline Scenario in EU27, 2020
Grass
5% shift from first pillar EU15 to first pillar EU12 5% shift from first-pillar budget to agri-environmental measures in second pillar, in EU15 Greening first pillar: permanent grassland Greening first pillar: 5% ecological set-aside Payment for natural constraints
Greening Scenario
-8 -4 0 4 8
Change compared to Baseline Scenario (%)
-8 -4 0 4 8
Change compared to Baseline Scenario (%)
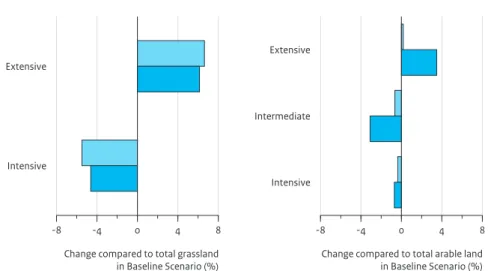
Linking CAP payments with biodiversity improves
incomes in extensive farming systems and regions,
and leads to a decrease in farm incomes in
intensive farming areas
With regard to direct payments, the CAP options aim for a ‘better targeting of support to add value and quality in spending. There is a widespread agreement that distribution of direct payments should be reviewed and made more understandable to the taxpayer. The criteria should be both economic, in order to fulfil the basic income function of direct payments, and environmental, so as to support for the provision of public goods’ (EC, 2010: 8). Biodiversity, which is considered an important public good, is one of these environmental criteria. Greening the CAP leads to a better link between CAP payments and the biodiversity performance of farming systems. Under the Greening Scenario, a shift in payments occurs from old to new Member States and from intensive to extensive farming regions (Figure 5). Most pronounced income losses will take place in regions with predominantly intensive arable farming systems with low biodiversity scores, whereas regions with more extensive livestock farming systems and high nature values show income gains (for a graphic representation of intensities, see Figure 2.1 of the Full Results).
IV Discussion
This study provides spatially explicit, quantitative results on the impact of the CAP greening options. Before
drawing conclusions on policy implications (Section V), results are discussed in this section.
Crop rotation, winter cover and payments to small
farms – not included in this study – may have
positive biodiversity impacts
Not all elements of the EC communication document on the CAP were incorporated in this study (Table 1), because of limitations of the applied modelling instruments. These elements include winter cover, crop rotation and extra payments for small farms. These measures could result in an additional biodiversity impact – probably smaller than those calculated for the five modelled policy components – although this is difficult to quantify. Winter cover or cover crops are known to activate an extensive set of agro-ecosystem processes, such as fixing nutrients and adding organic material, thereby facilitating the development of soil biota. Also, seed-producing cover crops could increase food availability for birds in winter. Crop rotation contributes to heterogeneity, a strong driver of biodiversity. Payment to small farms may have an indirect, positive effect on biodiversity. As, for example, these farms normally have smaller land parcels and thus more field edges, which are relatively
species-rich.
Trade-off between biodiversity and yields
The modelling results evidently demonstrate a trade-off between increasing biodiversity and decreasing yields. Less-intensive farming facilitates higher nature values but lowers average crop yields. Regarding the ecological
Figure 4
Changes in producer prices of cereals and milk, compared to Baseline Scenario in EU27, 2020
5% shift from first pillar EU15 to first pillar EU12 5% shift from first-pillar budget to agri-environmental measures in second pillar, in EU15 Greening first pillar: permanent grassland Greening first pillar: 5% ecological set-aside Payment for natural constraints
Greening Scenario
-2 0 2 4 6
Change compared to Baseline Scenario (%)
Cereals
-2 0 2 4 6
Change compared to Baseline Scenario (%)
Milk
set-aside measures, a number of ways exist to soften the effects of this trade-off. First of all, set-aside should preferably be implemented on field edges, as these areas are often less productive due to soil compaction and the amount of shade. Consequently, reduction in total agricultural production due to ecological set-aside could be lower than the 5% assumed in this study. Secondly, field strips used as set-aside could be used in such a way that they deliver so-called ecosystem services, such as providing habitats for pest control species and pollinators, which may raise production in the longer term. Finally, set-aside should not necessarily be left fallow; extensively managed, low-input strips also contribute to biodiversity, while limiting yield losses.
Valuation of results depends on policy perspective
How the various results that are presented in this study would be valued very much depends on the viewpoint from which they are considered:− From a perspective of legitimacy, greening the CAP would be an improvement. It would lead to payments that are more targeted to public goods, such as biodiversity, than is the case with current income support. The study shows income shifts from intensive farming systems to more extensive, biodiversity-rich systems. This could be perceived by the taxpayer as a fitting reward for these farmers’ efforts.
− From a biodiversity perspective, the three per cent higher species richness under the Greening Scenario (compared with the Baseline Scenario) would
contribute to halting losses of farmland biodiversity by
2020. However, this scenario would reduce only the rate of decline in agricultural biodiversity.
− From an efficiency point of view, the positive results for biodiversity could be interpreted as small in light of the vast amount of CAP money being spent on greening payments under the Greening Scenario. Payments for specific agri-environmental measures – associated with multi-annual contracts, targeted, on a regional basis, at locations with high biodiversity and involving robust monitoring and evaluation – could increase the efficiency of measures.
Greening the CAP’s first pillar or increasing the
second?
From the perspectives described above, no clear and decisive answer can be given to the question of whether to promote greening through the first or the second pillar. Greening the first CAP pillar seems an attractive option as it pairs simplicity with CAP legitimisation. However, it holds few possibilities for targeting specific biodiversity in specific areas (e.g. most-threatened red-list species). Agri-environmental measures from the second pillar would offer more possibilities in that respect, although transaction costs would be relatively high – at least under the current bureaucratic regime.
A clear answer is also not provided by this modelling study. In our study it is assumed that policies will succeed in stimulating farmers to take biodiversity measures and that these would lead to an increase in species richness – regardless of whether the policy belongs to the first or second pillar. The practical implementation may decide
Figure 5
Changes agricultural income EU27, Greening Scenario, 2020
More than 5 Decrease (%) 0 – 5 0 – 5 Increase (%) More than 5
whether to go for greening of the first pillar or increasing the budget for the second pillar.
Possible arguments are:
1. Farmer participation. Farmers may not always be inclined to participate, as measures often are not economically profitable. This would be particularly the case for second-pillar measures, as the terms of EU State Aid prohibit government bodies from paying farmers anything over the actually incurred costs. First-pillar payments, having income support as their primary goal, do not fall under this EU State Aid regime.
2. Continuity of measures. To yield a long-term effect on biodiversity, long-term contracts that span decades would be preferable. As first-pillar payments are annual and non-contractual, they score lower than agri-environmental payments in the second pillar, which have six-year contracting periods.
3. Optimal locations for implementing measures. Second-pillar measures can be better targeted than first-pillar measures, from a biodiversity point of view. Because of general implementation of first-pillar measures, some of the payments may not be effective if measures are implemented in ways and at locations that are not very effective for maintaining biodiversity.
4. Knowledge and skills. Merely imposing measures will not suffice; farmers require knowledge about how to influence the effectiveness of measures. On average, farmers who are faced with mandatory measures in the first pillar are expected to be less receptive to information than those who are implementing voluntary measures in the second pillar. At the very least, this will require a different communication strategy.
Increasing efficiency of biodiversity policy
The efficiency and effectiveness of CAP measures may be improved in various ways, with regard to agricultural contributions to nature values. For example, when agri-environmental measures are implemented at isolated locations in a region with predominantly intensive farming, the benefits will be relatively small, as species will be unable to migrate and establish sustainable populations. However, measures that increase landscape heterogeneity through the construction of green infrastructure could further increase farmland biodiversity. Source populations could be tapped by offering migratory routes through landscape elements, also increasing the resilience of agro-ecosystems to perturbations such as climate change. Instruments to improve biodiversity impacts could coordinate measures at a regional level, stimulating farmers in a specific area to adopt tailor-made measures, covering many years, through regional covenants. Evaluation of farmland
biodiversity measures is essential to continually improve the cost-effectiveness of greening the CAP. This is not an easy job to do. For example, the lack of a standardised approach hinders the comparability of results.
Positive impacts of greening measures for
objectives other than those of biodiversity
Measures aimed at improving conditions for biodiversity may also support ecosystem functioning and, therefore, the provision of ecosystem services, such as carbon sequestration, water purification, soil management and ecological pest control. Increasing species richness would lead to the preservation of resilient agro-ecosystems with a high degree of functional diversity. Multiple species would be able to deliver specific ecosystem services; their sheer numbers reducing the impact on ecosystem functioning if one or more of them would diminish, either permanently or temporarily. In addition to these environmental goals, biodiversity measures could also contribute to the recreational potential, character and attractiveness of landscapes. This would also apply to the aforementioned framework of regionally tailored green infrastructure located around areas of high ecological quality. This, in turn, could enhance both recreational and residential potential, thus contributing to the vitality of rural areas (EC, 2010). However, these positive side effects can only be obtained by finding synergies with adjacent policy areas and policies. A clear example is the case of ecological pest control that uses the strips of land along arable fields that have been designated as ecological set-aside. This measure could potentially lead to a decrease in the use of pesticides as well as to yield increases, in the long term. However, this ignores the incentive caused by the wide range of affordable pesticides that is currently available. Therefore, changes to the CAP will not yield much impact on ecosystem services while other policies, in this case the current EU pesticide authorisation regime, remain in place.
V Policy implications
− Greening the CAP would contribute to farmland biodiversity. In this study, an average three per cent increase in species richness, by 2020, was calculated for the Greening Scenario, relative to that of the Baseline scenario. This could halve the ongoing farmland biodiversity loss within the 2014–2020 period, albeit with a very large degree of uncertainty due to a lack of knowledge of autonomous trends in species richness. Although the result could be interpreted as being modest, it should be noted that the main purposes of the first pillar remain securing the availability of food supplies and ensuring a fair standard of living for
farmers, with increased biodiversity as one of many environmental side effects. From the perspective of the EU biodiversity strategy, the CAP is the most important – if not the only – instrument for improving biodiversity in agricultural areas.
− Substantial differences exist between the regions with intensive and extensive farming. Although extensive farming regions are richer in biodiversity, greening the first pillar of the CAP would lead to greater
improvement in EU farmland biodiversity in intensive farming regions within the 2014–2020 period. The consequences of greening the CAP are demonstrated in regional diversities not only regarding biodiversity but also in farm incomes. This implies that a regionally differentiated policy may be more appropriate than a one-size-fits-all approach. For example, in extensive farming regions, a policy that preserves all or at least part of the current biodiversity-rich, extensive agricultural land seems more adequate than mandatory ecological set-aside.
− A strategic policy choice could be a further specialisation of areas with intensive production systems focused at input-efficient production. In addition, areas with extensive farming would serve as source areas for agricultural biodiversity and have several other positive impacts. The proposed changes to the CAP seem not to include further specialisation, as the largest increase in species richness resulting from proposed measures would be in intensive, currently biodiversity-poor areas.
− A trade-off exists between budgets, biodiversity and agricultural production. Therefore, careful
consideration needs to be given to effective biodiversity measures. There are several options to alleviate the trade-off between biodiversity and production. Examples are the targeting of CAP budget towards areas already high in biodiversity, as well as the implementation of measures related to a regional ‘green infrastructure’ in agricultural areas, which would effectively facilitate the spread of source populations. The proposed greening payment for permanent grassland could be targeted at already biodiversity-rich grasslands. At farm level, individual producers could reduce production losses by using the least-producing fields and field edges as set-aside and for implementing other agri-environmental measures.
− Greening the CAP may yield a broad range of positive impacts if they are combined with stimuli from adjacent policy areas. Retaining permanent grassland would prevent the emission of carbon dioxide from agricultural soils. Set-aside could form a buffer for agricultural run-off, before polluted water drains into ditches or streams, thus improving water quality. Greening measures also could benefit the recreational appeal of landscapes; for example, by the construction
of green infrastructure. Furthermore, they may also favour a number of ecosystem services, such as biological pest control.
FULL RESUL
TS
FULL RESUL
ONE
Policy context, scenarios
and models
1.1 Common Agricultural Policy
1.1.1 General overview
The Common Agricultural Policy (CAP) is a policy with a long history. Many adaptations have been made since its establishment in 1962. The current CAP has a number of goals, ranging from contributing to farm incomes to the sustainable management of natural resources. CAP expenditures in 2009 were over 50 billion euros, which equals around 100 euros per EU citizen. Approximately 80% of the budget was used for income subsidies to farmers (decoupled direct payments); around 20% was spent in the second pillar (Rural Development Programmes). Implementation of the CAP has varied significantly between Member States. The current CAP ends in 2013. Therefore, a revised policy will be effective from 2014 onwards.
The current design of the CAP
At present, most EU farmers receive an annual payment (single farm payment), based on the number of hectares of farmed land. This is the main component of the first pillar of the CAP. The amount per hectare varies strongly per Member State or even per farm. In order to receive such a payment, farmers must comply with a number of requirements (cross-compliance), such as meeting a certain environmental standard and maintaining their land in a good agricultural condition. For a number of commodities, elements of price and market regulation are still in place, such as milk quotas for the dairy sector (to be abolished in 2015), intervention prices and import
tariffs. Through the rural development policy (second pillar) farmers may receive additional funds, often depending on the region where they are located. This can be in the form of additional payment per hectare in case of less-favoured areas, payment for the delivery of agri-environmental benefits, and non-recurring payments for the modernisation of their farms.
Evolution of the CAP
The CAP has evolved greatly since its introduction in 1962. The original purpose of the CAP was to encourage agricultural productivity in order to guarantee a stable food supply at affordable prices and to ensure a viable agricultural sector. The CAP replaced national agricultural policies, to facilitate an open, common EU market. At that time, the main policy instruments where price and market policies (guaranteeing high prices to farmers) and financial assistance for farm restructuring.
During the 1962–1992 period, the price and market policies were continually adapted to address changing conditions, such as increasing agricultural production and developments of the global market. In 1992, the price and market policies were transformed for cereals and some other crops into a system of income support on a hectare basis (MacSharry reform). This transformation occurred under the influence of pressures from non-EU countries in the World Trade Organization (WTO) and from within the EU, to slow down the rapid increase in the EU budget. During the mid-term review of 2003, income subsidies were almost completely decoupled from the actual production of most commodities.
ONE ONE
Creation of the second pillar of the CAP
The restructuring component of the CAP initially was aimed at individual farms and did not address the regional dimension of their problems. To rectify this, experiments with a more regional approach were set up in the 1970s, which after various steps finally resulted in the rural development programmes of the second pillar of the CAP.
Also included in the second pillar are agri-environmental measures. In the 1980s, a number of Member States started implementing agri-environmental measures at their own initiative. These were subsequently adopted by the European Community in 1985, but continued to have a voluntary character. Under the MacSharry reform of 1992 these measures were introduced as ‘accompanying measures’ for all Member States.
Enlargement of the EU
Over the last 50 years, the number of Member States has increased from 6 to 27. When the United Kingdom, Ireland, Denmark, Greece, Spain and Portugal joined the European Community they more or less fully adopted the CAP. Sweden, Finland and notably Austria, which joined the EC in 1995, did put more emphasis on the second pillar. The 12 countries that joined the EU between 2003 and 2008 also put more emphasis on the importance of the second pillar.
1.1.2 Communication document by the European
Commission The CAP towards 2020
Goals of the future CAP
In their 2010 communication document, The CAP towards 2020; Meeting the food, natural resources and territorial challenges of the future, the European Commission elaborates the ideas for post-2013 CAP reform. Basically, the future CAP should remain a strong common policy structured around the two-pillar structure, and address the three challenges of global food security,
environmental protection and climate change, maintaining a territorial balance between rural areas in the EU. Given these challenges, the three following goals of the future CAP are proposed:
− viable food production, in order to contribute to farm incomes and limit farm income variability, to improve the competitiveness of the agricultural sector and enhance its value share in the food chain, and to compensate for production difficulties in areas with specific natural constraints;
− sustainable management of natural resources and climate action, in order to guarantee sustainable production practices and secure the enhanced provision of environmental public goods, to foster green growth through innovation, and to pursue climate change mitigation and adaptation actions;
− balanced territorial development, in order to support rural employment and maintaining the social fabric of rural areas, to improve the rural economy and promote diversification, and to allow for structural diversity in the farming systems.
In order to address these goals, the European Commission, in its communication document, makes some suggestions about how the present CAP
instruments for direct payments, market measures and rural development could be adapted.
Adaptation of direct payments
According to the European Commission, redistribution of direct payments is a necessary adaptation, to make direct payments more understandable to the taxpayer, and to improve the targeting of payments, as both income support and remuneration for the provision of so-called public goods. The EC further states that major disruptive changes should be avoided in the process of moving towards a more equitable distribution of direct payments. According to the EC (2010), future direct payments could be based on the following elements: − basic income support through decoupled direct
payments;
− a mandatory ‘greening’ component for actions addressing climate and environmental goals in the form of simple, non-contractual and annual payments for, for example, permanent pasture, green cover, crop rotation and ecological set-aside;
− area-based payments to promote the sustainable development of agriculture in areas with specific natural constraints, which are complementary to the support for less-favoured areas (LFA) in the second pillar;
− voluntary coupled support to take account of specific problems in certain regions with particular types of farming;
− simplification of cross-compliance rules.
Adaptation of market measures
Despite the overall market orientation of the CAP, some intervention instruments that act as a safety net in cases of price crises or market disruptions are desirable. The EC refers to the upcoming legal proposals for the dairy sector, and reaffirms the abolishment of the dairy quotas by 2015. It also announces some future proposals for the sugar and isoglucose sectors, the current regime of which is set to expire in 2014/2015, and it refers to its intention to improve the functioning of the food supply chain, especially the problem of the steadily decreasing share of agricultural value added in the food supply chain.
ONE
Adaptation of rural development policy
The current rural development policy in the second pillar can be maintained, contributing to the competitiveness of agriculture, including innovation, sustainable management of natural resources and a balanced territorial development. Environment, climate change and innovation should be guiding principles. In addition to the current menu of rural development measures, a risk management toolkit should be included to deal more effectively with income uncertainties and market volatility (EC, 2010).
Three broad policy options
Finally, the EC presents three possible post-2013 directions for the CAP, reflecting the main orientations within public debate, which are not mutually exclusive and merit further consideration (Table 1.1).
After discussion of the main orientation of the CAP post-2013 with Council, Parliament and other stakeholders, the European Commission hopes to present legislative proposals in autumn 2011 for the future CAP that is ‘a
more sustainable, more balanced, better targeted, simpler and more effective policy, [and] more accountable to the needs and expectations of the EU citizens’ (EC, 2010: 13).
1.2 Biodiversity policy
1.2.1 General overview
EU biodiversity headline target and sector targets
In March 2010 the European Council endorsed the 2020 headline target for biodiversity: ‘Halting the loss of biodiversity and the degradation of ecosystem services in the EU by 2020, and restoring them in so far as feasible, while stepping up the EU contribution to averting global biodiversity loss’. The tenth Conference of the Parties (CoP10) to the Convention on Biological Diversity (CBD), held in 2010, adopted a global Strategic Plan for Biodiversity 2011 – 2020. In May 2011 the European Commission published an EU biodiversity strategy to 2020 that responds to both mandates (EC, 2011).
Table 1.1
Policy options for a future CAP
Option 1
Gradual change of the current policy framework and more equity in the distribution of direct payments between Member States
Direct payments Market measures Rural development
– no change of system
– more equity in direct payments between Member States
– strengthen risk management tools
– streamline and simplify existing market instruments
– maintain Health Check orientation with increased funding for new challenges of climate change, water, biodiversity and renewable energy, and innovation
Option 2
A shift towards a more sustainable CAP and a better balance between the different policy objectives, farmers and Member States, to be achieved by targeted payments
Direct payments Market measures Rural development
– change in the design of direct payments; new payments are composed of:
a. a basic rate serving as income support b. a compulsory additional aid for specific
‘greening’ of public goods
c. an additional payment to compensate for specific natural constraints
d. a voluntary, coupled support component for specific sectors and regions
– more equity in direct payments between Member States
– improve and simplify existing
market instruments – more focus on environment, climate change and/or restructuring, innovation, and regional/local initiatives
– strengthen existing risk management tools
– some redistribution of funds between Member States could be envisaged
Option 3
A far-reaching CAP reform with a strong focus on environmental and climate change objectives, moving away from income support and market measures
Direct payments Market measures Rural development
– phasing out of direct payments
– limited direct payments for environmental public goods and payments to compensate for specific natural constraints
– abolish all market measures, except for a safety net in times of severe crisis
– measures are mainly focused on climate change and environmental aspects
ONE ONE
The EU strategy provides the policy framework for achieving the headline target and global commitments. It contains six targets with corresponding actions. In addition to the full implementation of the EU Nature Directives, the strategy also contains a sector target for agriculture (Target 3a): ‘By 2020, maximise areas under agriculture across grasslands, arable land and permanent crops that are covered by biodiversity-related measures under the CAP so as to ensure the conservation of biodiversity and to bring about a measurable
improvement in the conservation status of species and habitats that depend on or are affected by agriculture and in the provision of ecosystem services as compared to the EU2010 Baseline, thus contributing to enhance
sustainable management’ (EC, 2011: 6; Baseline from EEA, 2010).
EU biodiversity baseline and actions
Improvement of biodiversity through the actions described in the EU strategy is to be measured by the European Commission, together with Member States, against the EU2010 Baseline (EEA, 2010), using a set of updated EU biodiversity indicators. For the major ecosystem types, the baseline provides information on status and trends, pressures and threats, and services. Relevant to areas covered by the CAP are the types: agro-ecosystems and grassland agro-ecosystems.
The EU biodiversity strategy to 2020 includes several actions related to agriculture (Table 1.2).
The achievement of the sector target for agriculture in the EU biodiversity strategy to 2020 is quantitatively
assessed against the criteria set out in Target 1 for species and habitats, and in Target 2 for ecosystem services. Target 1 speaks of a significant and measurable improvement of the status of habitats and species covered by EU nature legislation, so that, by 2020, compared to current assessments: (i) ‘100% more habitat assessments and 50% more species assessments under the Habitats Directive show an improved conservation status’; and (ii) ‘50% more species assessments under the Birds Directive show a secure or improved status’. Target 2 states that, by 2020, ecosystems and their services are maintained and enhanced, by establishing green infrastructure and restoring at least 15% of degraded ecosystems. For Target 1 limited baseline statistics are available, for Target 2 these are mostly still lacking. The improvements made by the agricultural sector regarding biodiversity measured over the Target-1 criteria apply to farmland designated as Natura 2000 areas, only. For the wider agricultural landscape, the criteria of Target 2 apply. These are ecosystem function criteria not yet clearly defined and quantified. Apart from the criteria mentioned under the targets of the 2020 strategy, the EU2010 Baseline (EEA, 2010) provides a common farmland bird indicator, consisting of monitoring information on 36 species.
Framework for action
Actions to be taken in agriculture, mentioned in the EU biodiversity strategy to 2020, have been formulated on a level of planning and policy output, while targets have been defined on the level of changes in the state of biodiversity. Although the desired policy effects have not yet been sharply defined, their direction is clear. As such,
Table 1.2
Actions in the EU biodiversity strategy dedicated to agriculture
Action 8 Enhance direct payments for environmental public goods in the EU Common Agricultural Policy
8a The Commission will propose that CAP direct payments will reward the delivery of environmental public goods that go beyond cross-compliance (e.g. permanent pasture, green cover, crop rotation, ecological set-aside, Natura 2000). 8b The Commission will propose to improve and simplify the GAEC (Good Agricultural and Environmental Conditions)
cross-compliance standards and consider including the Water Framework Directive within the scope of cross compliance once the Directive has been implemented and the operational obligations for farmers have been identified in order to improve the state of aquatic ecosystems in rural areas.
Action 9 Better target rural development to biodiversity conservation
9a The Commission and Member States will integrate quantified biodiversity targets into rural development strategies and programmes, tailoring action to regional and local needs.
9b The Commission and Member States will establish mechanisms to facilitate collaboration among farmers and foresters to achieve continuity of landscape features, protection of genetic resources and other cooperation mechanisms to protect biodiversity.
Action 10 Conserve Europe’s agricultural genetic diversity
The Commission and Member States will encourage the uptake of agri-environmental measures to support genetic diversity in agriculture and explore the scope for developing a strategy for the conservation of genetic diversity.
ONE
the EU biodiversity strategy to 2020 is above all a framework programme for further action that needs more detailing. As the European Commission mentions in the plan, this is the collaborative task of the EU, Member States and regional and local authorities. The greening of the CAP is one of the pathways mentioned in the strategy that should contribute to achieving the EU biodiversity headline target and underlying targets. Not the least of the policy pathways because of the key role the agricultural sector plays for biodiversity.
1.2.2 Interactions between agriculture and
farmland biodiversity
General trends
European agricultural landscapes developed over the course of centuries as a result of the interaction between farming and ecological as well as physical constraints imposed by the environment. Natural species and early agricultural crops imported from the Near East have adapted themselves to the open, semi-natural conditions prevailing in the extensively managed farmlands. Conservation of European biodiversity is partly dependent on farming and farmers, as approximately half of the EU currently is under agricultural management (BISE, 2010) and 55 of the 231 habitats under the Habitats Directive require agricultural management (EEA, 2010). Moreover, these landscapes are not only important from an environmental or agricultural perspective, but are also highly appreciated by the public for their recreational and cultural value.
The last decades, however, have shown a profound intensification of European agricultural practices. Nevertheless, biodiversity policy challenges for the agro-sector are large. This as a result of decreasing crop diversity, simplification of cropping methods, use of fertilisers and pesticides and homogenisation of landscapes, all of which have negative effects on biodiversity in agricultural areas (Le Roux et al., 2008). Biodiversity in agricultural areas has declined over the past decades (EEA, 2007; Cooper et al., 2010). For example, the European Union’s common farmland birds declined by 20% to 25%, between 1990 and 2007, whereas common bird populations decreased by about 10% during the same period (EEA, 2007). Trends differ between farming areas with intensive and extensive production. Species connected to farming systems are vulnerable to intensification of agriculture in intensively farmed regions as well as in situation where land is no longer being used for agriculture in extensively farmed areas (Bignal and McCracken, 1996; EEA, 2004b)
Intensively farmed regions
Generally, there is a trend of intensification in farmland areas with a high potential for agricultural production (EEA, 2005). The main reason for this is that agricultural production costs are generally lower in an efficiently organised landscape, while important natural values thrive more in traditionally farmed, cultural landscapes. As a result of a stronger intensification, the decline in farmland bird populations has been larger within the EU15 than in other EU Member States (Donald et al., 2002).
CAP price support has encouraged increases in yields, and in the use of inputs and marginal lands, as well as caused destruction of unfarmed habitats, loss of unfarmed features, and land-use changes, mostly from grassland to arable land (Donald et al., 2002). However, it is unclear how intensification would have developed without the CAP. Other important drivers are increasing labour costs in combination with the availability of labour-saving technologies, which are largely autonomous processes.
Extensively farmed regions
In areas with extensive production systems there is a tendency towards extensification and land no longer being used for agriculture (Strijker, 2005). Extensive or traditional agricultural management, with a mosaic of arable fields, landscape elements and extensive grazing, is both important for biodiversity and as a traditional agricultural landscape. However, over-extensification would lead to replacement of these systems with more monotonous scrubland or forest land. Awareness of this problem has increased since the concept of High Nature Value (HNV) farmlands was introduced in 1993. This concept recognises the causality between biodiversity and low intensity, low input farming systems. Often, semi-natural vegetation utilised by livestock, in combination with the presence of other semi-natural features, are main characteristics of these systems (IEEP, 2007). It is estimated that roughly 15% to 25% of the European countryside qualifies as High Nature Value farmland. These areas consist of semi-natural grasslands and are relatively abundant in mountainous regions. Almost one third of this type of farmland is located within Natura 2000 sites (EEA, 2004b). The concept of High Nature Value farmland is increasingly being used in international biodiversity strategies and statements. Areas of High Nature Value have not been officially assigned yet; Member States are working on identification of these areas.
So far, the CAP has not specifically focused on combating land abandonment in High Nature Value farmlands. Currently, conservation largely relies on measures under the second pillar of the CAP, notably in the support to