DOES STRESS INCREASE THE
AVERSIVENESS FOR
UNEXPECTEDNESS IN AUTISM?
Word count: 12 761Britt Mestdagh
Student number: 01504213Promotor: Prof. Dr. Senne Braem Co-promotor: Prof. Dr. Marcel Brass Supervisor: Judith Goris
A dissertation submitted to Ghent University in partial fulfilment of the requirements for the degree Master of Theoretical and Experimental Psychology
Preface
In September 2018 I began working on my thesis in the EXPLORA lab. Over the past two years, I acquired many new research skills, including writing a comprehensive literature study and working with R, as well as broadening my knowledge on autism. I really enjoyed spending time on this interesting project, and I would like to offer my gratitude to some people.
First of all, I would like to thank my promotor Prof. Dr. Senne Braem and co-promotor Prof. Dr. Marcel Brass for providing me this opportunity and for organising interesting and fruitful meetings that helped me gain more insight in the matter.
I am also very grateful for my supervisor, Judith Goris. I could not have reached the finish line without her help. Despite her own busy agenda, she still found the time and patience to help me with problems I encountered along the way. I faced challenges working in R, which in turn was met with her support and help that further allowed me to learn from the experience.
Finally, I would like to thank my parents for their endless support and belief, giving me the opportunity to study for five years and choose my own path. My friends and classmates, more specifically Hannah, who has experience with research involving autism and with whom I could discuss my thesis, and Pieter, who helped brainstorm how analyses could be tackled in R. My cousin who has reviewed all of my master projects over and over (including this short preface). No one can outdo her excellent English. Lastly, I would like to thank my significant other for supporting me and for being genuinely interested when I rambled on about my thesis.
I could not be happier graduating as an Experimental Psychologist having had this enriching thesis experience in such an interesting field.
Preambule concerning COVID-19
For the course Masterproef I previous academic year (2018-2019), I had already written a literature study and collected data from a sample of 150 participants. For me, the purpose of Masterproef II was to fine-tune my previous work, analyse the data and interpret the results. For the first six months of this academic year, I was on an internship abroad which required my full commitment. I returned to Belgium on March the 15th, two days before the lockdown. This did not give me the chance to meet and go through my previous work with my supervisors. Communication, naturally, went less smooth and was more time-consuming via e-mail. It would have been nice to sit together in person and discuss things over. However, I was not practically hindered by COVID-19. I was able to perform the required data analyses and complete my thesis, according to plan.
“This preambule was composed in consultation between student and supervisor, and was approved by both parties.”
Abstract (EN)
Autism Spectrum Disorder (ASD) is a neurobiological developmental disorder characterised by on the one hand social deficiencies, and on the other behavioural stereotypies, restricted interests and insistence on sameness. The latter can also be expressed as a preference for predictability. It has been suggested that preference for predictability can be an underlying mechanism in all ASD symptoms. Despite it being a widely known symptom of ASD, it has hardly been examined in an experimental setting. However, Goris and colleagues (2019) have established that also neurotypical individuals with higher autistic traits show a higher preference towards predicable stimuli in the lab. Moreover, it has been implied that this preference for predictability is enhanced and therefore more prominent in stressful environments. In this study (N = 140), we sought to relate preference for predictability to autism traits in a neurotypical population, and see whether this relationship is influenced by social stress. To answer the question whether stress would enhance this association, we compared our stress study to the previous study of Goris et al. (2019), without stress manipulation. The questionnaires included to measure the extent of autistic traits were the Autism Quotient (AQ), Social Responsiveness Scale Adult-version (SRS-A) and Adolescent/Adult Sensory Profile (SP). Social stress was induced by announcing one of the five participants would have to present for the audience of the remaining participants. Without knowing who would be presenting what, participants completed the preference for predictability task (a.k.a. music task). Hereafter, the presentation took place and the questionnaires were filled out. We expected to see the relationship between the level of autistic traits and preference for predictability, a finding supported by previous research, to be more pronounced in a stressful environment. However, no significant effect of study and therefore stress was found. Although, we did find a significant association between autism traits and preference for predictability across both studies. Only autism traits captured by the SRS-A correlated marginally significant with preference for predictable sequences. This raises the question whether there may be more social mechanisms playing a role in or underlying insistence on sameness. Future research could consider more relevant and social stimuli when studying this relationship as well as a possibly more effective social stress induction paradigm.
Abstract (NL)
Autisme Spectrum Stoornis (ASS) is een neurobiologische ontwikkelingsstoornis gekenmerkt door enerzijds sociale deficiëncies, en anderzijds gedragsmatige stereotiepen, restrictieve interesses, en gelijkheidsdrang. Deze laatste symptoom kan ook uitgedrukt worden als een voorkeur voor voorspelbaarheid. Er wordt gesuggereerd dat deze voorkeur voor voorspelbaarheid onderliggend kan zijn aan alle andere ASS symptomen. Hoe dan ook is deze welgekende kenmerk van ASS nauwelijks bestudeerd geweest in een experimentele setting. Wel, hebben Goris en colleagues (2019) een relatie gevonden tussen autistische trekken van een neurotypische populatie en een grotere voorkeur voor voorspelbare stimuli in het lab. Verder wordt er geïmpliceerd dat deze voorkeur voor voorspelbaarheid sterker wordt in stressvolle omgevingen. In de huidige studie (N = 140), wilden we voorkeur voor voorspelbaarheid associëren met autistische trekken in een neurotypische pouplatie, en zien of deze relatie beïnvloed wordt door sociale stress. Om op de vraag te beantwoorden of stress deze associatie zou vergroten, hebben we onze studie vergeleken met de voorgaande studie van Goris et al. (2019), zonder stress manipulatie. De vragenlijsten die werden opgenomen om het aantal autistische trekken vast te leggen, waren de Vragenlijst naar gedrag en persoonlijkheid (AQ), Screeningslijst voor autismespectrumstoornissen bij volwassenen (SRS-A) en de Adolescent/Adult Sensory Profile-NL (SP). Sociale stress werd geïnduceerd door aan te kondigen dat één van de vijf participatnen zou presenteren voor de groep. Zonder te weten wie wat zou presenteren, maakten de participanten de voorkeur voor voorspelbaarheid taak, ook wel de “muziek taak” genoemd. Hierna vond de presentatie plaats en werden de vragenlijsten ingevuld. We verwachtten dat de relatie tussen de mate van autistische trekken en voorkeur voor voorspelbaarheid, een bevinding gestaafd door voorgaand onderzoek, sterker zou zijn in een stressvolle omgeving. Daarentegen, vonden we geen significant effect van studie, en daarmee, stress. We vonden echter wel een significante associatie tussen autistische trekken en voorkeur voor voorspelbaarheid over beide studies heen. Alleen trekken van autisme gemeten door de SRS-A correleerden marginaal significant met de voorkeur voor voorspelbare toonsequenties. Dit doet ons de vraag stellen of er mogelijks eerder sociale mechanismen een rol spelen in of onderliggend zijn aan voorkeur voor voorspelbaarheid. Verder onderzoek kan overwegen om relevantere, sociale stimuli
aan te halen om deze relatie te bestuderen, alsook een effectievere sociale stress inductie te hanteren.
Corona preambule (NL)
Voor het vak Masterproef I vorig schooljaar (2018-2019), had ik al een literatuurstudie geschreven en data verzameld van 150 participanten. Voor mij draaide het bij Masterproef II vooral om het op punt stellen van mijn voorgaand werk, data analyse en het interpreteren van de resultaten. De eerste zes maanden van dit schooljaar deed ik mijn stage in het buitenland, wat mijn volledige toewijding vergde. Ik keerde terug naar België op 15 maart, twee dagen voor de lockdown. Hierdoor kreeg ik de kans niet om nog eens alles op te frissen en samen te zitten met mijn begeleiders. Communicatie verliep, zoals verwacht, iets stroever en nam wat meer tijd in beslag via e-mail. Het zou leuk geweest zijn als we in persoon nog eens konden samenzitten en alles overlopen. Hoe dan ook, was ik voor mijn praktisch werk niet gehinderd door COVID-19. Ik heb mijn data kunnen analyseren en thesis afwerken, zoals gepland.
“Deze preambule werd in overleg tussen de student en de promotor opgesteld en door beide goedgekeurd.”
Table of Contents
Introduction ... 1
Predictive Coding Theory ... 3
Previous Research on Insistence on Sameness ... 4
Stress and Aversiveness for Unpredictability ... 9
Present Study ... 11 Method ... 12 Participants ... 12 General procedure ... 12 Material ... 13 Music task ... 13 Manipulation check ... 14
Social stress induction ... 14
Questionnaires ... 15
Data analysis ... 17
PCA ... 17
Music task ... 17
Correlational and linear regression analyses ... 18
Results ... 18
Questionnaires ... 18
AQ ... 18
SRS-A... 19
Preference for predictability ... 19
Linear mixed model ... 19
Correlational analyses ... 20
Stress vs. non-stress ... 25
Discussion ... 26
Conclusion ... 30
1
Introduction
Insistence on sameness, or preference for predictability, is one of the main characteristics of the Autism Spectrum Disorder (ASD). Although it is a widely acknowledged symptom of ASD, insistence on sameness has not received much attention in experimental research (Cambier, 2018; Goris et al., 2017). The predictive coding theory has provided a framework in which insistence on sameness in autism can be understood in terms of disruptive predictive processing. According to this theory, preference for predictability can be seen as a core symptom, from which other symptoms of ASD may have arisen (Van de Cruys et al., 2014). This has stimulated several researchers to explore the relationship between preference for predictability and autism traits in the general population. These studies will be discussed extensively below. Although results have not always been unanimous, Goris and colleagues (2019) found a significant association between preference for predictable stimuli and level of autistic traits in a neurotypical population. The present study will build on these findings by adding the notion of social stress to the picture. ASD individuals have been found to cope with ambiguous social environments stressing them out, by sticking to what is predictable (Boulter et al., 2014). This way, we would expect the relationship between preference for predictability and autistic traits to be enhanced by social stress.
In what follows, we will discuss the clinical disorder of ASD and its symptoms. The symptom of interest, preference for predictability, will be explained and situated in the broader context of the predictive coding theory. An overview will be given of several previous experimental studies that chose to study preference for predictability. We will conclude this literature overview by explaining why stress may intensify the relationship between preference for predictability and autism, and introduce our present study. Autism Spectrum Disorder (ASD)
Autism Spectrum Disorder (ASD) is a neurobiological developmental disorder characterised by two main impairments. According to the DSM-V edition, the first would be deficiencies in social communication and interaction, while the second involves very focused, intensified and repetitive behavioural patterns, interests or activities (American Psychiatric Association, 2013; Lewis & Bodfish, 1998). Importantly, these symptoms
2
arise during early childhood and have an impact on daily functioning. ASD affects 1 % of the population, males more than females (American Psychiatric Association, 2013; Baird et al., 2006; Pinborough-Zimmerman et al., 2012). Comorbid disorders include epilepsy, tic disorders, anxiety disorders, attention-deficit hyperactivity disorder (ADHD), structural language disorder, and learning disabilities. Additionally, ASD has been significantly associated with intellectual disability (American Psychiatric Association, 2013; Elsabbagh et al., 2012; Matson & Nebel-Schwalm, 2007). Genetics have been found to play an important role in ASD, with a 70 % heritability rate. Multiple genes seem to contribute to the genetic risk for ASD, but it remains a challenge to pinpoint which genes are specifically and exclusively linked with ASD. Therefore, behavioural assessment is the prime way to diagnose ASD to this date (Geschwind, 2011).
Autism in the DSM-V is defined as a spectrum disorder, since there is a large individual variability when it comes to symptom severity and development of the disorder. Also, the term covers all autism-related disorders such as early infantile autism, atypical autism and Asperger’s disorder, as opposed to autism delineated in the previous DSM-IV edition. Before zooming in on the two focal points of impairment, thus criteria of ASD, it needs to be stressed that the manner of expressing symptoms of each criterion, can vary considerably across individuals (American Psychiatric Association, 2013).
The first criterion (A) of ASD regarding social interaction, covers social-emotional reciprocity: the observed inability for individuals with autism to share their thoughts and feelings or to process complex social cues. It also encompasses verbal and nonverbal communication: atypical social communication, such as restraining speech and or avoiding eye contact. Lastly, it depicts social relationships: difficulty building them up, holding onto them and most importantly, understanding them. These problems can be expressed as a difficulty adhering to social norms or having a hard time making friends (American Psychiatric Association, 2013).
The second criterion (B) of ASD concerning the rigid behavioural patterns, discusses motor stereotypies, such as a desire to neatly line up toys or using the same phrases repeatedly. In addition, individuals with ASD seem to hold very focused and intense interests (American Psychiatric Association, 2013), for example being completely preoccupied by football (e.g. knowing all the names of the football players, every little
3
detail regarding football transfers,…). Hyper- or hyporeactivity to sensory input is also cited. This includes being fascinated by lights or wanting to touch virtually everything in reach. Lastly, the symptom ‘insistence on sameness’ is mentioned (American Psychiatric Association, 2013). A grounded assumption accepted by both laymen and professionals implies that individuals with ASD strongly prefer structured, rigid information and contexts (Lawson et al., 2014; Pellicano & Burr, 2012; Van de Cruys et al., 2014). Preferences are not based on rational decisions, rather they act as implicit feelings. In general, people tend to prefer fluent, predictable stimuli since they seem to hold a positive disposition (Reber et al., 2004). Individuals with ASD are inclined to have an even more pronounced preference for these type of stimuli (Goris et al., 2019; Van de Cruys et al., 2014). Thus, this tendency is what the DSM describes as insistence on sameness (American Psychiatric Association, 2013; Goris et al., 2017; Stockman, 2018).
Predictive Coding Theory
According to the predictive coding framework, our brain constantly works on predicting the environment. Naturally, this process can lead to prediction errors when our predictions do not match the actual sensory input. To deal with this, we need to be flexible to some extent. Prediction errors are used to update our predictions through which we learn about the environment we are in. However, not every prediction error requires an update. Weights are supposedly assigned to each prediction error to assess their importance. On the one hand, when the assigned weight is large, this means the prediction error is important and requests an update of your model of the world. On the other hand, when the assigned weight is small, this tells us the prediction error reflects noise and can be ignored (Clark, 2013; Friston, 2005). Thus, it seems to be crucial to hold a right balance between what is important and what can be ignored.
Individuals with ASD, however, are assumed to tip this balance by overestimating the weights they assign to their prediction errors. Even for small, irrelevant changes in the environment, they would supposedly assign an oversized weight (Lawson et al., 2014; Van de Cruys et al., 2014). ASD individuals have a hard time distinguishing between relevant, important stimuli that deserve attention and other, irrelevant stimuli that they should ignore. Thus, the predictive coding account suggests the core deficit in autism is
4
the inflexible way prediction errors are processed, implying that deficits found in autism deemed to be core before, now become secondary symptoms (Van de Cruys et al., 2014).
Of importance, is that ASD individuals are comparable to typically developing individuals when in an unambiguous environment. They are able to correctly learn and process new associations. In rigid situations, when the environment exactly matches their predictions, they can even outshine typically developing individuals (Mottron et al., 2013; Van de Cruys et al., 2014). The problems arise in more unstable, unpredictable environments. Since individuals with ASD have difficulty appointing stimulus-relevancy, this may result in an overload of sensory input overwhelming them. To avoid such unpleasant arousal, ASD individuals tend to seek safe, well-organised environments and employ inflexible cognition and behavioural routines (Van de Cruys et al., 2014).
The neurocognitive predictive coding theory puts insistence on sameness forward as a central symptom of ASD, which in turn has encouraged several researchers to investigate this symptom more thoroughly in the lab.
Previous Research on Insistence on Sameness
Despite its clinical significance, research on insistence on sameness is still rather limited. There have been playroom studies (Kawa & Pisula, 2013), but these suffer from uncontrolled stimuli and conditions. The literature is especially lacking research from experimental labs (Cambier, 2018; Goris et al., 2017). Discussed below are experimental studies that do devote attention to this topic.
Goris et al. (2017) explored the relation between insistence on sameness (or preference for associative information) and level of autistic traits. They did this in a typically developing sample using a paradigm developed by Trapp et al., (2015). The paradigm consisted of shapes and there were two phases. The shapes could be presented in either fixed or random quadruplets. The shape with fixed quadruplets is always presented with the same other shapes, with those four shapes in the same position on the screen every time. Whereas the shape with random quadruplets is intermixed with different shapes. In the first learning phase, the participants were required to judge whether they had seen the shape before or not. In the second preference phase, participants were then asked to choose which shapes they preferred. Since Trapp et al.
5
(2015) found a higher preference for shapes within fixed configurations, the number of times the fixed quadruplet shapes were chosen, counted as a measure of preference for predictive, associative contexts. To examine autistic traits, the Autism-Spectrum Quotient (AQ), Social Responsiveness Scale – Adult version (SRS-A) and the Adolescent/adult Sensory Profile (SP) were conducted.
The results reproduced the finding of a general preference for fixed quadruplet shapes (Goris et al., 2017; Trapp et al., 2015). However, there was no correlation apparent between autistic traits and preference for associative information. Nevertheless, these results were not due to differences in recognising contextual regularities, since there were no differences in accuracy or learning rate. Furthermore, the population questioned in the study was variable regarding autistic traits. Therefore, lack of variability was most likely not an intervening factor either.
However, recent studies have found that individuals with ASD have trouble with relational binding of contextual information (Bowler et al., 2014; Gaigg et al., 2008). In this light, they were probably more likely to experience the second phase as an entirely new context compared to the first (Van de Cruys et al., 2014). Keeping these findings in mind, Goris et al. (2017) sought for a reversed relationship: if you are more likely to experience the phases as two distinct contexts (corresponding with higher autistic traits), you might show a weaker preference. However, a reversed effect wasn’t found either. This led the authors to conclude that preference for predictability might, in fact, be less widespread than accepted. Maybe this preference is only visible in more complex (social) conditions?
Necessary to point out, is that this does not imply that individuals with higher autistic traits do not have a higher preference for predictable information. Rather, this paradigm used may simply not be applicable for finding an association with autistic traits (Goris et al., 2017). Hereby, several new studies were published in search of more appropriate paradigms. Mentioned below are the perceptual fluency task, music task and gambling task. These tasks were specifically chosen to make no or at least less distinction between a first and second phase. Both the perceptual fluency task and the music task had been previously proposed for measuring preference for predictability in the neurotypical population. The gambling task, such as the configuration task postulated by Goris et al.
6
(2017), was specifically meant to explore the relationship between preference for predictability and ASD.
As established before, it has been found that in general people prefer predictable stimuli (Goris et al., 2017; Trapp et al., 2015), and thus favour them more. Forster et al. (2012) reason that this may be due to the fact that predictable encounters are easily processed, leading to a sense of fluency. This is called the fluency-liking hypothesis, introduced by Reber et al. (1998). When information feels fluent, it is also favoured more (Reber et al., 2004). According to this hypothesis, manipulating perceived fluency would be possible using a priming paradigm. Congruent priming would enhance the ease of target processing, and therefore also influence liking (Ansorge et al., 2010; Kiefer, 2002). Congruent primes are primes with the same image contours as the target image presented thereafter. Thus, in the first experiment, Forster et al. (2012) expected that targets presented after a congruent prime would be liked more by the participants, because it feels more fluent. Vice versa, incongruent prime-target combinations (unpredictable stimuli) would be preferred less, because incongruent primes have the contours of an image other than the target.
The perceptual fluency task consisted of masked primes followed by targets. When participants were asked whether they liked the stimulus or not (“How beautiful was this image according to you?”), their answer was indicated by a preference on a 7-point Likert scale. As expected, the authors found that congruent trials were favoured more.
Goris et al. (2019) used the same task to measure preference for predictability and wondered whether this would correlate with autistic traits. For determining the level of autistic traits, two questionnaires were used. They found a significant correlation between the incongruent versus congruent trial preference ratings with both the Autism Spectrum Quotient (AQ) and the Social Responsiveness Scale-Adult Version (SRS-A), indicating that individuals with higher autistic traits prefer more predictable stimuli.
Furthermore, Delplanque and colleagues (2019) also explored why certain stimuli are preferred above others. How do we experience beauty? And what influences this liking? For music or simplified tones, stimulus complexity seems to play an important role. This complexity can also be understood as predictability. Complex stimuli can be seen as difficult to predict, leading to more prediction errors. Investigating the
7
relationship between stimulus predictability and stimulus preference lead to the proposal of a curvilinear relationship, specifically an inverted U-pattern (Berlyne, 1971 as found in Delplanque et al., 2019). This means that participants portray a higher preference towards stimuli with intermediate predictability, than towards stimuli that are either highly predictable or highly unpredictable.
A recent study by Braem & Trapp (2017) showed that participants preferred predictive stimuli, and thus non-complex ones, over non-predictive (random) stimuli. In this case, however, Delplanque and colleagues (2019) expected participants to prefer an intermediate level of complexity. They hypothesised this in light of the exploration-exploitation trade-off, referring to the constant search for correct balance between exploring possibly rewarding situations and exploiting a fruitful one (Sutton & Barto, 1998 as found in Delplanque et al., 2019). When your prediction error is too small compared to what you expect, you are not exploring enough. On the other hand, when your prediction error is too large, you have made the incorrect decision to explore. In the latter case, you should have exploited because it would have been more rewarding. As a result, choosing for an intermediate level of prediction error should provide the optimal balance.
Delplanque et al. (2019) tested their predictions using a forced-choice task. They chose not to use Likert scales, since forced-choice items have been found beneficial in terms of construct validity (Brown et al., 2017). By playing on a grand piano, sequences of seven tones were created. The sequences could vary in terms of predictability, and thus complexity, ranging from highly predictable to less predictable. The amount of complexity of the tone sequences was measured using entropy, which considers the degree of disruptiveness of a stimulus (Shannon, 1948 as found in Delplanque et al., 2019). In this case, disruptiveness is understood as the degree of deviation from a predictable baseline. Entropy is expressed as the following formula:
𝐸𝑛𝑡𝑟𝑜𝑝𝑦 = − ∑ 𝑝(𝑥𝑖) log 𝑝(𝑥𝑖)
𝑛
𝑖=1
Two types of entropy were taken into account: the first-order entropy and the second-order entropy. The first-order entropy (also called same-entropy) counts the number of unique tones in the sequence. So, the more identical tones presented in a
8
sequence, the lower the entropy. When the whole sequence consists of identical tones, the sequence has an entropy of 0. Vice versa, when it is a sequence with seven unique tones, entropy is maximal (1). In second-order entropy (next-entropy), the transitions matter. It is counted how much a tone is higher or lower on the tonal scale than the previous one. For example, when the tone sequence is “do re mi fa sol la si”, which consists of perfectly predictable transitions, entropy is 0. Each following tone is predictable, so every transition has a probability of 1. Finally, entropy of a sequence is defined as the average of the first and second-order entropy. This whole was incorporated in what they called the ‘music task’. Participants were presented with two auditory subsequent sequences. First, they were asked to choose if they preferred the first or the second sequence, and then decide if the sequences differed.
Indeed, participants did not seem to prefer either the very or less predictable sequences, but preferred the ones in between. These findings are in line with earlier studies that used subjective measures (Aitken, 1974; Hekkert & van Wieringen, 1990; Messinger, 1998) or objective measures (Spehar et al., 2015; Spehar et al., 2016; Street et al. 2016) of complexity.
As it happens, this task has recently been used by Goris and colleagues (2019) to associate preference for predictability with level of autistic traits in a neurotypical population. Choosing predictable tone sequences correlated significantly with scores on autism questionnaires: Autism-Spectrum Quotient (AQ) and the Social Responsiveness Scale-Adult version (SRS-A).
Cambier (2018) decided to face the same challenge as her predecessors by investigating insistence on sameness using a variant of the Iowa Gambling Task this time, by Bechara and colleagues (2005). The aim was to verify whether insistence on sameness related to the extent of autistic traits. The task consisted of four card decks. The participants were instructed to choose a card from one of four decks each trial and their goal was to earn as much money as possible. One deck of cards implied a fixed gain of 250 euros. The other three resulted in random gains, with an average set at 250 euros. So, it was possible for the gain to vary either 0 (fixed deck), 10, 30 or 70 standard deviations from the mean. In these random cases, participants could either win quite a lot of money, or lose money. Autistic traits were measured using the Autism-Spectrum Quotient (AQ)
9
and the Social Responsiveness Scale-Adult version (SRS-A). Preference for predictability was defined as the amount of fixed gain decks chosen. However, no significant correlations were found between the percentage of fixed decks chosen and the presence of autistic traits. These null findings were replicated in a later study by Goris et al. (2019). This tells us that either preference for predictability should be measured differently, more explicitly for example. Or, there might be some underlying mechanisms of insistence on sameness we are not aware of yet, that influences these results (Cambier, 2018). However, Goris and colleagues (2019) did find a significant correlation between AQ scores and reaction time. Individuals scoring higher on the AQ responded faster when choosing fixed decks. The SRS-A also correlated marginally significant with this measure (Goris et al., 2019).
Stress and Aversiveness for Unpredictability
The experimental studies we discussed above explored how preference for predictability varies depending on the amount of autistic traits. However, in the present study, we add the notion of social stress. Will the relationship between preference for predictability and autistic traits be enhanced when participants are stressed out?
Social impairment is one of the key features of ASD. These difficulties include problems with social-emotional reciprocity, non-verbal communication and developing, maintaining and understanding social relationships (American Psychiatric Association, 2013). As a result, social situations are perceived as ambiguous and unpredictable (Gahagan, 1984 as found in Stockman, 2018). This, in turn, can cause feelings of anxiety and stress (Van de Cruys et al., 2014).
At the same time, individuals with ASD are subject to sensory overload, a result of erroneous predictive error generation. Therefore, ASD individuals can eventually find themselves in a state of chronic unpredictability, characterised by both hyper- and hyposensitivity (Tomchek & Dunn, 2007). Hypersensitivity is an increased or even oversensitivity to (unexpected) stimuli across virtually all sensory modalities (Grandin, 1992). Therefore, it is not surprising that several studies have found increased levels of stress and anxiety in individuals with ASD (e.g., Groden et al. 1994 as mentioned in Bitsika et al., 2015; Corbett et al., 2009; Gillott et al., 2001; Lanni et al., 2012; Muris et al., 1998). Repeatedly failing at predicting correctly can be incredibly frustrating.
10
As a result, these negative feelings are dealt with by avoiding social situations and sticking to predictable environments (Van de Cruys et al., 2014). This avoidance can also be interpreted as hyposensitivity (Ben-Sasson et al., 2009; Tomchek & Dunn, 2007) and is characterised by issues such as lack of motivation and exploration (Koegel & Mentis, 1985 as found in Van de Cruys et al., 2014). In this light, insistence on sameness can function as a potential coping mechanism for dealing with anxiety and stress arising from unpredictable environments (Boulter et al., 2014).
Stockman (2018) tested the assumption that the association between insistence on sameness and ASD traits may be increased by stress. In an attempt to accurately measure implicit preference for predictability, another task was proposed: an audiovisual dot motion task. The participants were presented with fast moving dots on the computer screen. The dots could move in the same direction either altogether (in a very obvious direction) or just a proportion of them (in a less obvious direction), or the dots moved completely at random (no direction). In the latter case, solving the task was more or less at chance level. There was no definite right or wrong answer. The task entailed to indicate whether the larger proportion of dots moved left (press left) or right (press right). In addition, one key was constantly accompanied by a predictive tone, which stayed the same every time the key was pressed. The other key led to a different tone each time it was pressed. The predictive key press was either left or right and this was counterbalanced across participants. Autistic traits were measured using the Autism-Spectrum Quotient (AQ) and the Social Responsiveness Scale – Adult version (SRS-A) again.
This whole task was set up to mask the actual intention of the researchers. The only trails that sparked their interest, were those in the random dot condition. Would individuals with higher ASD traits show a higher preference towards the predictive key presses compared to the unpredictive ones? Again it was assumed that individuals with more autistic traits would exhibit this insistence on sameness. Moreover, it was speculated that a social stress induction might increase this preference and need for predictability. For this, a public speaking task was introduced. The participants were not informed of this prior to the experiment. Before commencing the third block of the dot motion task, participants were given a closed envelope. Both previous blocks, 1 and 2, served as control conditions. The third, final block was the stress condition. After this final block, one of the participants was required to give a presentation, supported by a pre-made
11
PowerPoint. The subject of the presentation was “the cat”. When the presentation had been held, the participants filled in the autism questionnaires and the Liebowitz Social Anxiety Scale – Self report version (LSAS-SR).
However, no correlations were observed between the amount of predictive key presses in the random dot trials and ASD traits. This finding was established in both control conditions (block 1 and 2 of the task) and the stress condition (block 3) (Stockman, 2018).
Present Study
It appears to be quite difficult to measure insistence on sameness using an experimental task (Cambier, 2018). Previous studies showed inconsistent findings, although Goris and colleagues (2019) did find a significant relationship between insistence on sameness and autistic traits.
Although it has been assumed that people with ASD would strongly adhere to predictability in response to stressful or overstimulating (social) environments, this has not yet been successfully tested. We were interested in verifying this assumption using a different paradigm to measure preference for predictability. Concretely, we hypothesised that the previously established association between preference for predictability and autism traits would be enhanced in a stressful environment.
To investigate this, we worked with the ‘music task’ created by Delplanque and colleagues (2019) previously mentioned. This task was chosen, since preference for predictable music sequences had been significantly related to insistence on sameness in the previous study by Goris et al. (2019) and the task can be embedded in the broader predictive coding perspective (Delplanque et al., 2019). Here, predictability is impersonated by sequences consisting of many identical, non-deviating tones or expressed as predictable transitions.
We adopted Stockman’s social stress induction by unexpectedly announcing that one of the participants would have to present for the group after completing the music task. The PowerPoint the chosen participants were asked to orally guide, was pre-made by Stockman (2018). Afterwards, all of them completed three questionnaires measuring the level of autistic traits. Moreover, to check the influence of social stress on the
12
relationship between preference for predictability and autism scores, we compared our stress-study to that of Goris et al.’s (2019) without a stress manipulation. Compatible with our hypothesis, we sought to replicate the association between scores on autism questionnaires and preference for predictable tone sequences and expected this to be stronger under social stress.
Method
Participants
150 first bachelor students of the Faculty of Psychology and Pedagogical Science in Ghent were recruited for this credit experiment. Eight subjects were removed due to participant no-shows and minor issues whilst obtaining data. Prior to data-analysis, we removed two subjects that showed consistent response patterns, always choosing the first sequence. This resulted in the total inclusion of 140 students submitted for data-analysis, ranging from the age of 18 to 27 (M = 18.76, SD = 1.36). Of this student population, 84 % was female whereas the remaining 16 % was male. 11 % was left-handed. No specific requirements were designated to include participants, except for normal hearing capacities. Prior to the experiment, all participants filled in an informed consent.
General procedure
The experiment allowed for five subjects to participate per turn. Each participant received an envelope, in which they would be informed who would present. These envelopes remained sealed until further notice. Since participants were not informed about this presentation before taking part, we anticipated this unexpected information would cause stress. Participants commenced with the music task and, after they had finished, were required to indicate their mood (manipulation check). Subsequently, participants were told to open their envelopes to reveal who would be presenting for the group. The presentation was held and thereafter participants filled in the three autism questionnaires. Once completed, the experiment ended.
13
Material
Music task
In the previous section, the basic design of the music task was explained. However, in this version of the two-interval forced choice paradigm programmed in Tscope5, participants were not required to differentiate between tone sequences. Here, only preference was of interest. They had to indicate whether they preferred the first tone sequence they heard or the second. This music task implementation corresponded to that of Goris and colleagues (2019). Each trial started off with a fixation cross presented in the center of the screen for 1000 ms. Then, the first tone sequence played through headphones (Sennheiser HD 215) at a fixed volume. While the sequence was playing, the number (in this case “1”) was visible on the screen. The seven tones of the sequence each lasted 350 ms and were separated by a 150 ms break. After hearing the 3350 ms lasting sequence, a brief notice (1000 ms) appeared informing the participants that the first sequence had ended, so the participants knew the second sequence would start playing. After listening to the second sequence of tones, participants had to indicate their preference. By pressing left (“A”1) on a QWERTY keyboard, the participants chose
sequence 1 over 2. When they pressed right (“P”), sequence 2 was chosen. The question of preference remained on the screen until the participants responded with a keypress. A schematic overview of one trial is pictured in Figure 1 (as found in Goris et al., 2019). Two sequences were chosen for each participant. The seven tones used to compose the sequences were F3, G3, A3, B3, C4, D4 and E4 (respectively “fa sol la si do re mi”). Combinations of these different tones led to sequences varying in terms of predictability. Sequences were divided into eleven entropy classes, ranging from sequences with minimal entropies of 0.3, indicating them to be very predictable and less complex, to unpredictable sequences with entropies larger than 1.8. The participants were presented with a randomly generated set of 220 sequences over 110 trials (Goris et al., 2019).
1 Please note that on one of the computers the participant was required to press “Q” instead of “A” to choose for sequence 1.
14
Fig. 1. Trial of the music task displayed. The trial starts with the presentation of a fixation cross
(1000 ms), followed by the first tone sequence that lasts 3350 ms in total. The second auditory stimulus (3350 ms) starts after a 1000 ms interval. At the end, the preference of the participant is asked. If the participant presses left (“A”), he/she chooses for the first sequence or vice versa
(right, “P”) for the second sequence (Goris et al., 2019)
Manipulation check
After completing the music task, the participants notified the experimenter, who then set up the manipulation check programmed in PsychoPy2 (v1. 85. 2), titled ‘Questionnaire’ (Vragenlijst) so its purpose would remain vague. Here, participants indicated how happy, angry, stressed, tense and sad they felt on a percentage scale (0 to 100 %). Especially the stress rating was of interest.
Social stress induction
By handing out closed envelopes, participants were unsure whether they would have to present or not. We expected that participants would feel stressed knowing there was a chance of presenting.
All five participants were simultaneously invited to take place in the room and fill in the informed consents. Once a participant had completed filling this in, they notified the experimenter and received a closed envelope. In this way, the envelopes were dealt out randomly. The participants were told not to touch the envelope until further notice. After everyone had received an envelope, they were informed that green notepapers were enclosed in the envelopes, except for one envelope containing a pink one. The participant ending up with the pink post-it would have to present in front of the group. So, prior to the music task, participants had no idea who would have to present. The dealing out of envelopes happened in a double-blind fashion. Neither the experimenter nor the
15
participants had any idea who received the ‘unlucky’ envelope. Every participant had an equal chance of being presenter. We hoped this unexpected information to have caused a sufficient amount of stress. After the explanation, participants started with the music task which lasted about 25 minutes. When the participants were finished, a manipulation check was held to see whether the participants truly felt stressed. When all participants had completed this, they were asked to open the envelopes. The presenter, the participant with the pink note, was asked to sit or stand behind the experimenter’s desk and start presenting. The other participants, with a green note, were asked to sit in a semicircle around the presenter. The presenter was required to give a brief presentation about the domestic animal “the cat”. The pre-made PowerPoint consisted of several images and keywords to assist the presenter, but the main intention was to orally guide the listeners as it were an actual presentation. The PowerPoint consisted of five slides, each covering a topic related to the cat: its history, life expectancy, anatomy and behaviour. The image below gives an idea how the slides looked like (Figure 2). After the five-minute presentation, all participants returned to their computers and filled in the three questionnaires. When this was completed, in approximately 15 minutes, the experiment ended by handing out a debriefing letter as each participant left the room. In total, the experiment took about 45 to 50 minutes.
Fig. 2. Slide 1 and 4 of the pre-made PowerPoint by Stockman (2018). Participants were
required to present about the subject ‘the cat’ using key words and images as pictured here on slide 4.
Questionnaires
After the presentation, participants completed three consecutive questionnaires measuring the extent of autistic traits. All questionnaires were programmed in PsychoPy2 (v1. 85. 2) for ease of data collection.
16
Autism-Spectrum Quotient (AQ) (Baron-Cohen, S., Wheelwright, S., Skinner, R., Martin, J., & Clubley, E. (2001). The Autism-Spectrum Quotient (AQ): Evidence from Asperger Syndrome / High-Functioning Autism , Males and Females , Scientists and Mathematicians. Journal of Autism and Developmental Disorders, 31(1), 5–17; Hoekstra, Bartels, Cath, & Boomsma, 2008). This well-known, general questionnaire has been proven valid for measuring autistic traits in a neurotypical population. It consists of 50 items and five subscales: ‘communication’, ‘social skills’, ‘imagination’, ‘attention to details’ and ‘attention switching’. Each item can be answered by choosing one of the four options on a 4-point Likert scale. Originally, the first option stands for “definitely agree” and the last for “definitely disagree”, but since this is rather counterintuitive, as well as opposite to the SRS-A and SP scale, we swapped them to 1 = “definitely disagree”, to 4 = “definitely agree”.
Social Responsiveness Scale-Adult version (SRS-A) (Constantino, J. N., Davis, S. A., Todd, R. D., Schindler, M. K., Gross, M. M., Brophy, S. L., … Reich, W. (2003). Validation of a Brief Quantitative Measure of Autistic Traits : Comparison of the Social Responsiveness Scale with the Autism Diagnostic Interview-Revised. Journal of Autism
and Developmental Disorders, 33(4), 427–433; Dutch version: Noens, De la Marche, &
Scholte, 2012). This questionnaire focuses mainly on the social aspect of ASD and the social behavioural difficulties they experience. It has 65 items that can be ranked on a 4-point Likert scale (1 = “never true”, to 4 = “always true”). These items are divided into four subscales: ‘social awareness, ‘social communication’, ‘social motivation’ and ‘rigidity repetitiveness’.
Adolescent/Adult Sensory Profile (SP) (Brown, & Dunn, W. (2002).
Adolescent/adult sensory profile. San Antonio, TX: Harcourt Assessment; Dutch version:
Rietman, 2007). This entails a survey of sensory processing. Since it has been widely reported that ASD individuals suffer from unusual sensory processing (Crane et al., 2009; Hilton et al., 2010; Lundqvist, 2015), this may serve as a favourable complementary questionnaire. It contains 60 items with a 5-point Likert scale (1 = “almost never”, to 5 = “almost always”). Its four subscales: ‘sensory registration’, ‘sensory seeking’, ‘sensory sensitivity’ and ‘sensory avoiding’.
17
Data analysis
All analyses were performed using R-Studio (R v. 4.0.0). PCA
An unrotated principal component analysis was performed on the total scores of the AQ and SRS-A. We expected the same outcome for both questionnaires and this way we can extract a single factor reflecting autism traits (Goris et al., 2019). The resulting factor explained 87 % of the total variance of the AQ and SRS-A scores.
Music task
Prior to data-analysis, subjects showing consistent response patterns and reaction times that deviated more than three standard deviations from the mean, were removed.
We defined the measure of preference for predictability by calculating how many times on average participants preferred sequences with a lower entropy, thus most predictable stimuli. Specifically, when participants preferred a more predictable tone sequence, this was translated into a “1”, or “0” when they preferred a less predictable sequence. This was done for every trial of each participant to calculate the mean preference for predictability per participant.
As an additional measure for preference for predictability, we calculated the weighted sum score of preferences in each entropy class. The sum of preferences per class were multiplied with a weight factor, which was higher or lower depending on the predictability of each class. Higher outcomes reflect a stronger preference for predictable tone sequences. We implemented the following formula to do this:
𝑊𝑒𝑖𝑔ℎ𝑡𝑒𝑑 𝑠𝑢𝑚 = ∑(12 − 𝑖)𝑝𝑟𝑒𝑓𝑒𝑟𝑒𝑛𝑐𝑒𝑐𝑙𝑎𝑠𝑠 𝑖
11
𝑖=1
For testing overall preference in the music task, we ran a linear mixed-effects model, testing both the linear and quadratic effects of entropy for the first versus second sequence of tones. Entropy values were standardised for calculating both linear and quadratic effects. The quadratic effects were used to test the inverted U-relationship previously found by Delplanque et al. (2019) and Goris et al. (2019). This was done by squaring the standardised entropy values. Results were reported using a type III Wald
chi-18
square (F) test.
Correlational and linear regression analyses
As in the previous paper by Goris et al. (2019), we will report correlations with preference for predictability for the PCA factor scores first, followed by the AQ total score and the SRS-A total score. Both Pearson correlation coefficients (r) and Spearman rank-ordered coefficients (ρ) are reported. Spearman coefficients are included, since these have been found to be less sensitive to outliers. Uncorrected p-values are reported to allow for an easier interpretation. Furthermore, subscale correlational analyses were performed to explore which particular aspects of the questionnaires may be leading predictors of preference for predictability. Correlations between preference for predictability and moods ratings, including stress, will also be reported.
These results will be compared to that of Goris and colleagues’ study in 2019 that did not include a prior stress manipulation. This is the crucial analysis of our study, because we were interested to see whether stress would be of influence. We ran a linear regression analysis to detect whether social stress influenced the relationship between individuals’ predictable sequence choice and their PCA autism factor score. In this case, PCA factor scores were calculated across both studies.
Results
Questionnaires
Total raw scores of the AQ and SRS-A correlated strongly (Pearson’s r = 0.74,
P < 0.001), indicating that both questionnaires measure what they claim to measure (high
construct validity).
AQ
Due to a programming mistake, item 12 of the AQ was equal to that of item 13. Therefore, we replaced scores on item 12 (‘attention to detail’ scale) with the average score for item 12 (2.96) found in the previous non-stress study by Goris and colleagues (2019). The total scores ranged from 85.96 to 140.96 (M = 109.40, SD = 10.60) using dimensional scoring, and from 5 to 35 (M = 16.71, SD = 5.75) with binary scoring. Five out of 140 participants (3.57 %) had binary scores between 26 and 32, which could hint
19
at mild ASD (Woodbury-Smith et al., 2005). Two participants (1.43 %) scored above 32, which may possibly reflect clinical ASD (Baron-Cohen et al., 2001). Cronbach’s alpha of 0.75 represents a good internal consistency of the AQ. For the remaining analyses, dimensional scores were used since this considers variability in the dataset more than binary scores (e.g. Goris et al., 2017, 2019).
SRS-A
Total raw scores ranged from 8 to 107 (M = 47.31, SD = 18.02). 20 out of 140 participants (14.29 %) scored between 61 and 75, which suggests mild to moderate deficiency in social responsiveness. Ten participants (7.14 %) scored above 75, which may reflect a severe disruption in social responsiveness (Constantino et al., 2003; Noens et al., 2012). Cronbach’s alpha of 0.91 was found, reflecting an excellent internal consistency.
Preference for predictability
Linear mixed model
We were able to replicate both linear, b = 0.23, χ2(1) = 70.91, P < 0.001, and
quadratic effects, b = -0.19, χ2(1) = 96.49, P < 0.001, of entropy for the first sequence.
The same significant linear, b = -0.34, χ2(1) = 109.15, P < 0.001, and quadratic effects, b = 0.21, χ2(1) = 116.53, P < 0.001, were found for the second sequence. These findings correspond to the previously established inverted U-relationship, by Delplanque et al. (2019) and Goris et al. (2019). Indeed, participants show a general preference towards intermediate entropy sequences (see Figure 3).
20
Fig. 3. Percentage of sequences chosen according to entropy class (1 to 11). Lower entropy
classes consist of predictable tone sequences. Higher entropy classes, in turn, represent less predictable sequences. Participants prefer sequences with medium(-high) entropy, as seen in
Delplanque et al. and Goris et al. (2019).
Correlational analyses
No significant correlations were found between the mean preference for predictability measure and PCA factor (r = 0.11, P = 0.18; ρ = 0.08, P = 0.35) or AQ total scores (r = 0.04, P = 0.61; ρ = 0.01, P = 0.87). An indication for a positive correlation was found between mean preference for predictability and the SRS-A total scores (r = 0.17, P = 0.05; ρ = 0.15, P = 0.08). Nevertheless, since the PCA factor, considered to be our main measure for autism traits, showed no significant results, there seems to be no evident relationship between autistic traits and preference for predictability as measured in this study (see Figure 4).
No significant correlations were found between the alternative measure of preference for predictability, weighted sum of entropy class preferences, and the PCA factor (r = 0.10, P = 0.24; ρ = 0.06, P = 0.49), AQ total scores (r = 0.04, P = 0.68; ρ = -0.01, P = 0.95) or SRS-A total scores (r = 0.15, P = 0.09; ρ = 0.13, P = 0.14).
Furthermore, exploratory correlational analyses were performed to see whether there was an existent relationship between the subscales of the questionnaires and preference for predictability. ‘Social skills’, ‘attention switching/tolerance of change’,
21
‘communication skills’, ‘imagination’ and ‘attentional to detail’, the five subscales of AQ, did not significantly correlate with preference for predictability. Subscales of SRS-A ‘social awareness’, ‘social communication’, and ‘restricted interests and repetitive behaviour’ did not significantly correlate with preference for predictability either. However, a marginally significant relationship was found between subscale ‘social motivation’ and preference for predictability (r = 0.17, P = 0.05; ρ = 0.16, P = 0.07). Although this correlation did not hold after a Holm-Bonferroni correction for multiple testing (P < 0.004). Furthermore, we included the SP as a complementary questionnaire, which does not formulate a total score. Subscales ‘low registration’, ‘sensation seeking’ and ‘sensation sensitivity’ did not significantly correlate with preference for predictability. Notably, a significant relationship between the remaining subscale ‘sensation avoidance’ and preference for predictability was established (r = 0.25, P = 0.003; ρ = 0.21, P = 0.01). The Pearson correlation p-value did survive the Holm-Bonferroni correction (see Table 2, Figure 5).
Stress ratings on the stress manipulation check rated from 0 to 87 % (M = 36.86,
SD = 26.47). No significant relationship was found between preference for predictability
and rated level of stress (r = 0.12, P = 0.15; ρ = 0.14, P = 0.10). In line with previous studies (e.g., Groden et al. 1994 as mentioned in Bitsika et al., 2015), we did find a significant positive correlation between stress level and autism factor scores (r = 0.22, P = 0.008; ρ = 0.21, P = 0.013). This Pearson correlation coefficient remained steady after a Holm-Bonferroni correction (P < 0.01). Furthermore, ratings for happiness ranged from 10 to 100 % (M = 60.79, SD = 16.89). We found a significant negative relationship between preference for predictability and happiness indications (r = -0.18, P = 0.03; ρ = -0.17, P = 0.05), which did not survive the Holm-Bonferroni correction. No significant correlations were found with level of anger, tension or sadness (see Table 1).
22
Fig. 4. Plotted (Pearson) correlations between the mean preference for predictability and the PCA factor, AQ, and SRS-A. No significant correlations have
been established, although a trend can be seen between SRS-A total scores and preference for predictable sequences. Higher mean preference values on the Y-axis reflect choosing more predictable sequences on average.
Table 1. Pearson’s correlation coefficients r and Spearman’s rank-ordered correlation coefficients ρ between mean preference for predictability (Music task) and mood indications in the manipulation check.
% Happy % Angry % Stressed % Tense % Sadness
Preference for predictability
r -0.18 * -0.02 0.12 0.11 0.06
ρ -0.17 -0.04 0.13 0.12 0.02
Significant correlations are presented in bold: *P < 0.05, **P < 0.01. Please note that these correlations are uncorrected for multiple comparisons.
23
Table 2. Pearson’s correlation coefficients r and Spearman’s rank-ordered correlation coefficients ρ between mean preference for predictability (Music task) and the subscales of the AQ, SRS-A and SP.
AQ
Social skills Attention switching Communication skills Imagination Attention to detail
Preference for predictability r 0.10 0.10 0.08 -0.06 -0.09
ρ 0.09 0.06 0.05 -0.09 -0.07
SRS-A
Social awareness Social communication Social motivation Repetitive behaviour
Preference for predictability r 0.12 0.13 0.17 0.14
ρ 0.11 0.11 0.16 0.16
SP
Low registration Sensation seeking Sensation sensitivity Sensation avoidance
Preference for predictability r 0.09 -0.07 0.06 0.25 **
ρ 0.08 -0.08 0.00 0.21 *
24
Fig. 5. Plotted significant (Pearson) correlations for exploratory subscale analyses. Mean preference for predictability correlated with the social motivation subscale of SRS-A (left) and the SP scale of sensation avoidance (right). Higher mean preference values on the Y-axis reflect choosing more predictable
25
Stress vs. non-stress
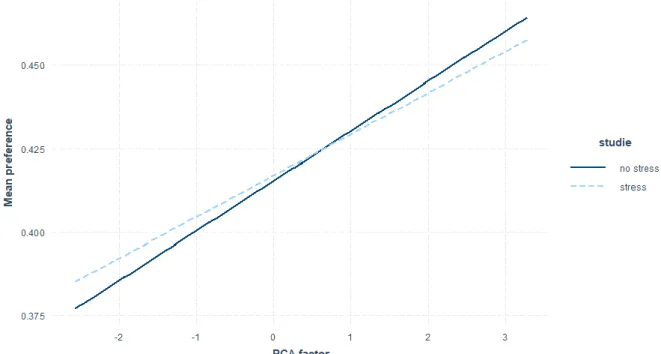
The key analysis, linear regression, was performed to compare the relation between mean preference for predictability and autism PCA factor scores across both studies: the first non-stress study by Goris and colleagues (2019) and this stress study. We expected higher levels of stress and autism traits to be associated with an increased preference for choosing predictable sequences in the music task. However, no significant interaction was found between PCA scores and study when looking at subjects’ mean preference for predictability (R2 = 0.024, P = 0.82). This means, that the positive
relationship between preference for predictability and PCA factor scores is not significantly influenced by social stress (see Figure 6). Nonetheless, we do see that preference for predictability significantly varies depending on factor scores (b = 0.014, P = 0.02). Combining studies, preference for predictability was significantly correlated with PCA scores (r = 0.15, P = 0.009; ρ = 0.16, P = 0.005) (see Figure 7).
Fig. 6. Non-significant interaction effect between autism factor scores and study predicting
preference for predictability. The relationship between mean preference for predictability and autism scores does not significantly differ from the association found in our study with stress manipulation. Higher mean preference values on the Y-axis reflect choosing more predictable
26
Fig. 7. Plotted significant (Pearson) correlation between mean preference for predictability and
PCA factor scores for both studies taken together (N = 291). Higher mean preference values on the Y-axis reflect choosing more predictable sequences on average.
Discussion
The aim of the present study was to link preference for predictable tone sequences to autistic traits and examine whether this relationship was influenced by (social) stress. In our study, only a positive trend between autistic traits as measured by the SRS-A and preference for predictable tone sequences was established. In comparison with the previous non-stress study by Goris and colleagues (2019), no significant effect of social stress was found. However, we did find a significant relationship between preference for predictability and autism factor scores across both studies.
Previously, it has been shown that the general population shows a preference for predictable stimuli (Chetverikov & Kristjánsson, 2016; Forster et al., 2012; Ogawa & Watanabe, 2011; Trapp et al., 2015; Westerman et al., 2015). Delplanque et al. (2019) report a preference towards stimuli that are of intermediate complexity, instead of those that are too (un)predictable. This general inverted U-relationship is also what we found in our study. The association between ASD and preference for predictability, on the other hand, remains indistinct in terms of underlying mechanisms and has been rather unacknowledged in research. Previous studies that have tried to gain insight on this matter
27
are contradictory. Goris et al. (2017) found no significant relationship between insistence on sameness and autism traits. This raised the question whether preference for predictability as seen in a clinical ASD population can be retrieved in a neurotypical population or simply in experimental settings in the first place. However, the fixed versus random quadruplet shapes paradigm may not have been the right fit for accurately measuring insistence on sameness. It involved contextual binding, which has been proven to be difficult for ASD individuals (Bowler et al., 2014; Gaigg et al., 2008; Van de Cruys et al., 2014), such that an effect of preference for predictability may have been ruled out. A study by Goris et al. (2019), on the contrary, did find a significant association between preference for predictability, measured using the perceptual fluency paradigm and music task, and level of autistic traits. This suggests that we can in fact find a relationship between autistic traits in a neurotypical population and preference for predictability in a standardised lab setting.
A significant association between preference for predictability, as measured by the music task, and autism traits were found across both studies (including that of Goris et al., 2019). But, this association was not found looking solely at the present study. This may be due to the fact that there was less variability in AQ total scores gathered in this study, compared to previous studies by Goris et al. (2017, 2019). The ratio female:male in our study was higher and younger participants took part (with less variance in age). This is not particularly surprising, since we recruited first-year Psychology and Pedagogy students, subjects taken by mainly (young) women. Previous studies have shown that scores on autism questionnaires may partly be subject to gender bias. Females have been found to be less likely to meet the diagnostic criteria as depicted in autism questionnaires compared to males, even though they show equally high autistic-like traits (Dworzynski et al., 2012; Gould & Ashton-Smith, 2011 as found in Goris et al., 2017; Kopp & Gillberg, 2011). Autistic traits expressed by males may be more in line with the symptoms captured by existing autism questionnaires (Kopp & Gillberg, 2011; Van Wijngaarden-Cremers et al., 2014). Furthermore, males show more autistic traits than females in the general population, measured by the AQ (Baron-Cohen et al., 2001). Therefore, lack of autistic traits as measured by the AQ, may, in part, explain our study’s non-significant findings for PCA factor and AQ total scores.
28
No significant effect of study was found, only that of PCA factor scores, which indicates an insignificant influence of stress. The post-hoc manipulation check correlational analysis did not reveal a significant correlation between the stress manipulation ratings and preference for predictability either. Although it did correlate significantly with autism factor scores, indicating that individuals with higher autistic traits were presumably more affected by the stress manipulation (e.g. Corbett et al., 2009). For these individuals, the stress manipulation may have left its mark. However, both the reported average stress rating (36.86 %) and maximum stress rating (87 %) do cast doubt on the overall effectivity of our stress manipulation. It seems as though not enough stress was evoked. Note that level of stress here was based on a mere mood indication, not elaborately questioned, to avoid uncovering the actual intent of the experiment. After the unexpected announcement of the presentation, participants took approximately 25 minutes to complete the music task, whereafter the manipulation check was filled in and the presenter was revealed. Perhaps the routine-like, automaticitiy of completing the music task may have distracted them from the off-chance of presenting, making them less stressed. Or, presenting in front of five people in a close setting did not succeed in stressing them out in the first place. Ideas for a more socially stressful manipulation may be to increase the number of presentation spectators by including ten participants at a time instead of five (if practically feasible) or by misleading particpants to think more staff members would join to watch. Other tools of deception to consider, could be to make the presentation topic seem more difficult than it is (instead of not mentioning it at all), or state that fellow participants will rate how well the presentation was given. Of course, ideas like this need to be in accordance with the ethical guidelines to be subsequently approved by the ethical committee. Furthermore, since Goris et al. (2019) also found a significant relation between preference for predictability as measured by a perceptual fluency task and autism traits, it might be interesting to test the same hypotheses using this task instead, as well as inducing stress in a more impactful manner.
Despite lack of significant correlations with PCA factor scores and AQ total scores, we did establish a marginally significant correlation between preference for predictability and SRS-A total scores in our study. Since this questionnaire emphasises the social difficulties in ASD, it may well be that more social mechanisms underlie the preference for predictability. Additionally, Goris and colleagues (2019) found a stronger