Master’s dissertation submitted to obtain the degree of Master of Science in Biology
Biology Department
Research Group Terrestrial Ecology
_______________________________________________________________________________________________
Academic year: 2019 – 2020
EARLY TERRITORY SELECTION BY THE THREATENED YELLOWHAMMER
EMBERIZA CITRINELLA IN WEST FLANDERS
Bram Catfolis
Supervisor:
Prof. Dr. Luc Lens, Ghent University
Co-supervisor:
Prof. Dr. Luc De Bruyn, Research Institute for Nature and Forest (INBO)
Scientific tutor:
Olivier Dochy, Province of West Flanders
Photo on front page: © Rini Lamboo
© Faculty of Sciences – research group Terrestrial Ecology
All rights reserved. This thesis contains confidential information and confidential research results that are property to the UGent. The contents of this master thesis may under no circumstances be made public, nor complete or partial, without the explicit and preceding permission of the UGent representative, i.e. the supervisor. The thesis may under no circumstances be copied or duplicated in any form, unless permission granted in written form. Any violation of the confidential nature of this thesis may impose irreparable damage to the UGent. In case of a dispute that may arise within the context of this declaration, the Judicial Court of Gent only is competent to be notified.
Table of contents
1 INTRODUCTION 3
1.1 HISTORY OF THE EUROPEAN LOWLAND FARMLAND 3
1.1.1 COLLAPSE OF EUROPE’S FARMLAND BIRD POPULATIONS 3
1.1.2 EUROPEAN POLICIES AND LEGISLATION CONCERNING AGRICULTURAL INTENSIFICATION 4
1.2 CHANGES IN MANAGEMENT AND IMPLICATIONS FOR FARMLAND BIRDS 4
1.2.1 LOSS OF MIXED FARMING 4
1.2.2 MECHANIZATION AND CHANGE OF CROPS 5
1.2.3 LOSS OF FIELD BOUNDARIES AND MARGINS 5
1.2.4 THE USE OF PESTICIDES 6
1.3 THE STRUGGLE OF OVERWINTER SURVIVAL 7
1.3.1 ‘WINTER BIRD CROPS’ TO THE RESCUE 7
1.4 YELLOWHAMMER PROJECT & THESIS FRAMEWORK 8
1.4.1 THE SPECIES ACTION PLAN 8
1.5 ENTERING THE BREEDING PERIOD 9
1.5.1 NEST SITE SELECTION 9
1.5.2 SURROUNDING HABITAT SPECIFICITY 10
1.5.3 CONSPECIFIC ATTRACTION 11
1.5.4 BEARING IN MIND: COUNTRY SPECIFIC ASPECTS 12
1.6 THE YELLOWHAMMER AS A STUDY SPECIES 12
1.6.1 CHARACTERISTICS 12
1.6.2 HABITAT 13
1.6.3 DIET 13
1.6.4 BEHAVIOUR 13
1.6.5 POPULATION TREND AND DISTRIBUTION 14
2 OBJECTIVES 15
2.1 OBJECTIVE 1:WHICH HABITAT FEATURES DETERMINE A PREFERRED YELLOWHAMMER TERRITORY? 15
2.2 OBJECTIVE 2:DO WINTER FOOD PLOTS HAVE AN INFLUENCE ON EARLY TERRITORY SETTLEMENT BY THE
YELLOWHAMMER? 15
2.3 OBJECTIVE 3:ARE YELLOWHAMMER TERRITORIES SPATIALLY CLUSTERED? 16
3 MATERIAL & METHODS 17
3.1 STUDY SITE 17
3.2 DATA COLLECTION 17
3.2.1 COLOUR-RINGING 17
3.2.2 BIRD SURVEYS AND TERRITORY MAPPING 19
3.3 STATISTICAL ANALYSIS 22
3.3.1 TERRITORY SETTLEMENT AND THE RELATION WITH SURROUNDING HABITAT FEATURES 22 3.3.2 INFLUENCE OF WINTER FOOD PLOTS ON EARLY TERRITORY SETTLEMENT 23
3.3.3 PATTERNS OF TERRITORY DISTRIBUTION 23
4 RESULTS 25
4.1 YELLOWHAMMER TERRITORIES 25
4.2 DATA EXPLORATION 25
4.3 TERRITORY SETTLEMENT IN RELATION TO HABITAT VARIABLES 27
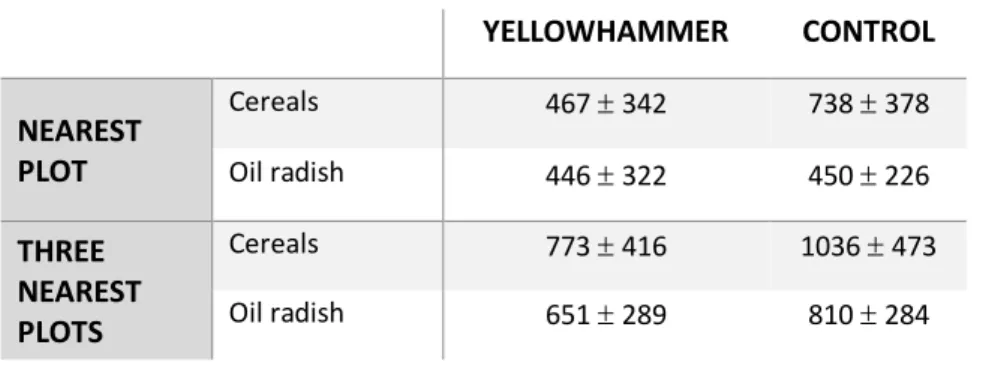
4.4 INFLUENCE OF WINTER FOOD PLOTS ON EARLY TERRITORY SETTLEMENT 29
4.4.1 NEAREST WINTER FOOD PLOT 30
4.4.2 THREE NEAREST WINTER FOOD PLOTS 30
4.5 TERRITORY DISTRIBUTION 30
5 DISCUSSION 32
5.1 GENERAL 32
5.2 HABITAT FEATURES DETERMINING TERRITORY SELECTION 32
5.2.1 HEDGES 33
5.2.2 FIELD MARGINS 34
5.2.3 DITCHES 35
5.2.4 METHODOLOGICAL REMARKS ON DETERMINING HABITAT PREFERENCES 35
5.3 INFLUENCE OF WINTER FOOD PLOTS ON EARLY TERRITORY SETTLEMENT 36
5.4 CLUSTERED TERRITORY DISTRIBUTION 37
5.4.1 METHODOLOGICAL REMARKS ON CLUSTER ANALYSIS 39
5.5 IMPLICATIONS FOR MANAGEMENT 39
5.6 GENERAL PROPOSAL FOR FUTURE RESEARCH 40
6 CONCLUSION 41 7 SUMMARY 42 7.1 ENGLISH SUMMARY 42 7.2 NEDERLANDSTALIGE SAMENVATTING 44 8 ACKNOWLEDGEMENTS 46 9 REFERENCES 47 10 APPENDIX 57
1
Introduction
1.1 History of the European lowland farmland
1.1.1 Collapse of Europe’s farmland bird populations
Traditionally, land use throughout much of western Europe is dominated by agriculture. Until the 60s of the twentieth century, farmland birds had no problems getting food all year round (Shrubb 2003). Countless fields with overwintered stubbles and spilled grain used to provide a seed source over the early and mid-winter periods (Potts 2003, Evans et al. 2004). Once the field was ploughed, new seeds from crops and weeds come to the surface. In the late winter, farmland birds were presumably dependent on these ploughing activities (Shrubb 2003). Sowing during spring, periods of fallow and varied crop rotation made it possible for every species to find suitable habitat at any time.
But due to post-war changes in European agriculture, the availability of all of these has fallen dramatically (Shrubb 2003). Governmental policies and technological advances rapidly changed this sustainable and balanced land use (Robinson & Sutherland 2002). The changes caused by this agricultural intensification were of that nature that most farmland species, especially farmland birds, could not adapt (Chamberlain et al. 2000, Anderson et al. 2001, Donald et al. 2001).
In the mid-1970s, many farmland species started to decline markedly (Siriwardena et al. 1998a). The suite of changes in the agricultural environment around that time adversely affected many species’ populations. Species, such as Wren (Troglodytes troglodytes), Pied wagtail (Motacilla alba yarrellii) and Treecreeper (Certhia familiaris) showed a similar trend in abundance decline, despite their different ecological requirements (Siriwardena et al. 1998a). Such coincidences in population trend are more likely to indicate that a large number of components of agricultural intensification changed at the same time, but the actual individual factors affecting population change differed from species to species (Chamberlain et al. 2000). However, some species like Stock dove (Columba oenas), Jackdaw (Corvus monedula) and Chaffinch (Fringella coelebs) showed increased abundances, indicating that certain agricultural changes can be beneficial for some species (Chamberlain et al. 2000). Usually, the species that benefit or experience little effect of this intensification are generalists which have more catholic habitat preferences in comparison with farmland specialists (Robinson & Sutherland 2002). These specialist species can thrive only in a narrow range of environmental conditions or have a limited diet, which makes them vulnerable to rapid and drastic habitat changes. If we want to avoid a biological impoverishment of our lowland farmland, we must counteract the negative consequences of intensified farming.
For nearly 120 bird Species of European Conservation Concern, lowland farmland provides a breeding or wintering habitat. This is the largest number of such species supported by any habitat (Donald et al. 2001). In Flanders, 10% of the birds listed in the Red List of Flemish Breeding Birds are farmland birds (Devos et al. 2016). Granivorous species, those with a substantial seed component in the diet, experience the strongest decline compared to other farmland bird species (Wilson et al. 1999). Endangered species from agricultural landscape and farmland birds in particular hardly benefit from the traditional, reserve-oriented nature policy in Flanders (Devos et al. 2004).
Even though the rate of change in agriculture has slowed, the majority of farmland specialists have continued to decline since the late 1980s (Fuller et al. 2000). A population recovery on a larger scale requires a thorough reform of the Flemish and European agricultural policy. Because farmland birds depend on a wide variety of landscape and nature factors for their survival, they are good indicators of landscape quality in general.
1.1.2 European policies and legislation concerning agricultural intensification
In 1962, the Common Agricultural Policy (CAP) came into force and serves as the main agricultural policy tool of the European Union (Butler et al. 2010). It implements a system of agricultural subsidies and other programs to support farmers and improve agricultural productivity. The most important measure taken by CAP in 1992 are the so-called agri-environment schemes (AES). They are designed to encourage farmers to protect and enhance the environment on their farmland by paying them for the provision of environmental services. Farmers commit themselves, for a minimum period of at least five years, to adopt environmentally-friendly farming techniques that go beyond legal obligations and that try to support biodiversity, enhance the landscape, mitigate climate change, and improve the quality of water, air and soil. AES are a financially attractive form of environmental protection because at least 50% of the costs of approved agri-environment schemes flows from the European Union Common Agricultural Policy. The rest of the money is funded by the Member States themselves (Batáry et al. 2015).
However, the effectiveness and efficiency of the AES are still heavily debated. While several studies have found positive effects on the biodiversity in response to changed agricultural practices under AES programs (MacDonald et al. 2012, Evans et al. 2019), others have shown mixed or limited benefits (Kleijn et al. 2001, Feehan et al. 2005, Princé et al. 2012), and even negative biodiversity outcomes (Besnard & Secondi 2014, Fuentes-Montemayor et al. 2011). Despite their mixed success, AES now represent the dominant policy instrument for conserving biodiversity in agricultural landscapes (Ansell et al. 2016). To improve the effectiveness of the AES, a continuous multidisciplinary evaluation of conservation programs is needed.
1.2 Changes in management and implications for farmland birds
For more than 50 years, agricultural intensification leads to a population decline of bird species associated with agriculture on a European scale. This applies both to farmland birds and meadow birds. But intensification is not an unambiguous process. It consists of several components, which often occur simultaneously and are interlinked. The following components of intensification with a negative effect on farmland birds have been described in the literature.
1.2.1 Loss of mixed farming
Before the intensification, livestock and arable production often occurred on the same farm. This offers habitat diversity which is the key to a large diversity of species (Whispear & Davies 2005). The arable component serves as a rich source of seeds for granivorous birds, while the grass component is home to a large number of invertebrates, providing food to insectivorous birds.
Since the new agricultural developments, farms increasingly tend to specialize in either livestock or arable crops (Robinson & Sutherland 2002). With farm amalgamation, farm size has increased and the surface area of peripheral and transition zones of interest for birds has decreased (Stoate et al. 2001). These loss of mosaics in space and time has reduced the number of different habitats on smaller spatial scales. To guarantee a sufficiently high reproduction, a varied range of habitats within a short flight distance is of great importance during the breeding season (Batáry et al. 2010). The province of West Flanders kept his high number of small-scale farms, so that the effect of the loss of mixed farming is
1.2.2 Mechanization and change of crops
New techniques and mechanization of agriculture have led to bigger farms with an increased on average arable field size. Sowing the same crop over several fields is more efficient but decreases the habitat diversity. Also, the flying distance between the habitats becomes too large during the breeding season (Batáry et al. 2010).
A change in crop choice and consequently harvesting times also had a great impact on farmland species. The less productive spring cereals were replaced by winter cereals, sown in the autumn instead of early spring, or by maize (Eggers et al. 2011, Glemnitz et al. 2015). This change led to fewer stubbles and annual weeds throughout the winter which are crucial as seed food for birds (Newton 2004, Glemnitz et al. 2015). In addition, sophisticated harvesters with high yields leave little grain on the stubbles. However, spillage of seeds was one of the most important food sources for granivorous species (Bos & Schröder 2009). Spring cereals also provide a more suitable breeding habitat for many species than winter cereals and maize. The latter crops achieve a dense and high crop structure early in the breeding season, making them unsuitable as a breeding habitat (Bos & Schröder 2009).
In addition to arable management, grassland management has also been intensified. Herb-rich meadows and half-open haylofts were replaced by grasslands that do not run to seed. Multiple cuts per year to ensile the grass occur during the breeding season and destroy the nests of ground-breeding birds (Benton et al. 2003, Tscharntke et al. 2005). Increased fertilizer application, regular ploughing, reseeding and drainage lead to dense and homogeneous swards that do not provide bare open ground for foraging or nesting sites for ground-breeding birds (Perkins et al. 2000, Batáry et al. 2010).
1.2.3 Loss of field boundaries and margins
As mentioned before, the sizes of field generally increased, especially on arable land. The loss of field boundaries and margins is the price to be paid for this. To allow a more efficient use of the new machinery, hedgerows have to be removed. Those that remain are often managed to keep them ‘tidy’ (Manson & Macdonald 2000). Another consequence of larger parcels is the relatively smaller proportion of weed-rich edges which are popular foraging areas with farmland birds.
Because of the loss of hedges, wooded banks and channels alongside the farmlands and grasslands, a valuable source of nesting habitat for many of the declining farmland birds decreased (Morris et al. 2001). But more important is the loss of a rich source of insect life (Glemnitz et al. 2015, Robinson & Sutherland 2002). The field boundaries act as foraging areas and overwintering habitats for many insects (Perkins et al. 2002, Whispear & Davies 2005). A varied, food-rich environment is crucial for farmland specialists, like Yellowhammer (Emberiza citrinella), to maintain a stable population size.
1.2.4 The use of pesticides
In the 1940s, the first hormonal herbicide was introduced. Thirty years later, 136 different compounds had been approved for agricultural use, and by 1997 344 pesticide compounds were available on the market (Robinson & Sutherland 2002). Nowadays, pesticide usage is widespread and closely linked to modern agriculture. Modern pesticides are more efficient and less persistent, thus require smaller amounts of active ingredient. However, the number and extent of applications has increased (Robinson & Sutherland 2002) and keeps increasing all over the world (Sharma et al. 2019). So, it is not surprising that pesticides have caused a tremendous change in the environment. The use of pesticides has both a direct and indirect impact on farmland species.
The main effects of most pesticides for farmland birds are indirectly manifested. Three mechanisms have been identified through which pesticides may affect food availability for birds.
Firstly, the direct removal of arthropods by insecticides. Arthropods are exploited by adults and their dependent young during the breeding season. Morris et al. (2005) found a negative relationship between insecticide use and nestling body condition of the Yellowhammer. Insecticide use did not lead to a brood reduction from starvation, but nestlings leaving the nest with poor body condition are less likely to survive to reproductive age which has an impact at the population level. They also found that insecticide applications changed the foraging behaviour of Yellowhammers. Fields with breeding season applications of insecticide were used less by early broods, which have a wholly insectivorous diet, than fields without such applications. Later on, treated fields were visited more frequently, but birds were mostly taking semi-ripe grain rather than insects.
Secondly, herbicides reduce the abundance of non-crop plants from which arthropods live. A reduced abundance of invertebrate food during the breeding season significantly reduces the avian reproductive success (Richmond et al. 2011).
Thirdly, herbicides deplete or eliminate the plants, which provide food for both herbivorous and granivorous bird species, thereby reducing their chance of survival. Reduced weed growth and seed production not only leads to loss of immediate food supply, but also to long-term depletion of the seed bank in the soil (Vickery et al. 2001, Boatman et al. 2004, Newton 2004, Buckingham et al. 2006, Kleijn et al. 2009).
Besides their indirect impact, pesticides can also directly cause failed reproduction and mortality (Burn 2000, Newton 2004). Neurotoxic pesticides have the potential to cause behavioural disturbances in birds (Walker 2003, Eng et al. 2019). The fastest-growing class of neurotoxic insecticides are
neonicotinoids. They kill insects by targeting their nervous system (Matsuda et al. 2001). Because neonicotinoids disrupt specific neural circuits of insects, they are considered to be less harmful to vertebrates (Tomizawa & Casida 2005). However, neonicotinoid use has been linked in a range of studies to adverse ecological effects, including the death of non-target invertebrate species (Henry et al. 2012, Van Dijk et al. 2013) and declines of terrestrial and aquatic vertebrate wildlife due its direct and indirect toxicity (Gibbons et al. 2015). A study of Hallmann et al. (2014) showed that imidacloprid, the most widely used neonicotinoid insecticide, has a negative impact on insectivorous bird populations in the Netherlands. Local population trends were significantly more negative in areas with higher surface-water concentrations of imidacloprid. Birds are affected both directly by the consumption of poisoned insects or coated seeds and indirectly by the reduction in insect populations.
1.3 The struggle of overwinter survival
The widespread decline in population sizes of granivorous farmland birds cannot be allocated only to the changes in several components of the annual breeding performance (e.g. clutch size, brood size, chick:egg ratio and daily nest failure rates). The winter also serves as a critical period and changes in the overwinter period might be of equal, or even higher, concern in saving farmland bird species (Siriwardena et al. 1998b). According to Siriwardena et al. (2000), the periods during which most mortality occurs, are likely to happen outside the breeding season, and, at least for resident species, in harsh late winter conditions when metabolic demands are high and food supplies have been depleted. The most important factor in these population declines is the reduction in food availability during winter (Siriwardena et al. 2000, Newton 2004, Kleijn et al. 2014). Bird species like Common Linnet (Carduelis cannabina), Tree sparrow (Passer montanus) and several bunting species, rely on seeds during winter and seem to be affected by the shortage (Robinson & Sutherland 2002). A lot of granivorous passerines are tied to stubble field as a winter foraging habitat. The highest mortality rate occurs in the late winter, between the end of February and beginning of March. During this so-called ‘hungry gap’ (Siriwardena et al. 2008), finding food becomes hard because seeds have become scarce and arthropods are hardly to be found yet (Kleijn et al. 2014). To tackle this problem, different conservation measures that enhance winter food resources are more and more implemented in agri-environment schemes. If seed food is supplied effectively throughout the winter, these measures may stop or even reverse the declining population trends (Siriwardena et al. 2007). Positive effects of supplementary winter seed food on several species of farmland birds are shown in a study from Siriwardena et al. (2007). Providing food at several feeding sites during winter resulted in less steep decreases in breeding abundance of several species such as Yellowhammer (Emberiza citrinella) Goldfinch (Carduelis carduelis) or Reed bunting (Emberiza schoeniclus), but also non-granivorous species like Robin (Erithacus rubecula) and Dunnock (Prunella modularis).
1.3.1 ‘Winter Bird Crops’ to the rescue
As mentioned before, there has been a large reduction in the area and quality of overwintered stubble fields due to the switch from spring to autumn-sown cereals coupled with improved weed control and harvesting techniques (Robinson & Sutherland 2002). Enhancing the winter food resources for farmland birds can be done either through the retention of overwinter stubbles or by planting seed-rich crops, also called winter bird crops (WBCs) (Henderson et al. 2004). These WBCs are a mixture of plants that are sown with the sole purpose to provide extra winter food and/or cover for farmland birds. Despite the fact that the perfect crop mixture does not exist because of different ecological requirements between species, researchers try to select appropriate seed mixtures that meet the needs of species of particular conservation concern as much as possible (Henderson et al. 2004). Kleijn et al. (2014) experimented with several seed mixtures to look for preferences. It turned out that most bird species, except for Reed Bunting (Emberiza schoeniclus) and Common Linnet (Carduelis cannabina), are not very fussy when it comes to seed mixtures. Whether your field is sown with a specially designed crop mixture or it is fallow and overgrown by weeds, anything that increases the supply of seed during the winter period attracts seed-eating songbirds. Even buntings, which are known to have a strong preference for cereals (Perkins et al. 2007), also make use of a wide range of species from other plant families. A possible exception is Yellowhammer (Emberiza citrinella) which seems to be more of a picky eater selecting almost exclusively cereal grains (Kleijn et al. 2014).
availability leads to a proportional increase in wintering farmland birds. Since WBCs provide a concentrated seed source, even small areas can be attractive as a valuable resource (Henderson et al. 2004). The importance of seed-rich winter habitats highlights the potential benefit of WBCs as an option within agri-environment schemes.
The province of West Flanders already anticipates on this matter by setting aside cereal strips and patches during winter for several years in Heuvelland and around Beveren aan de IJzer (Fig. 1). One of their target species is Yellowhammer, one of the most threatened farmland birds in Flanders. In order to bridge the hungry gap, they investigated the potential of bristle oat (Avena strigosa) as a winter food crop. Bristle oat is a type of cereal crop that is native to the Mediterranean region. It is used as cover crop and, if sown before the 1st of August, it seems to be a good seed source for farmland birds up to the end of winter (Coelembier et al. 2015).
1.4 Yellowhammer project & thesis framework
1.4.1 The Species Action Plan
This thesis is part of the larger Species Action Plan, commissioned and financed by the province of West Flanders, in collaboration with the Research Institute for Nature and Forest (INBO) and the University of Ghent. The Species Action Plan is covered within the provincial biodiversity policy on species protection and aims to maintain and enhance the biodiversity in West Flanders in order to regain resilient populations (Dochy 2015).
Biodiversity is a broad concept and is used as an indicator of ecosystem health. Because farmland birds depend on a wide variety of landscape and nature factors for their survival, they are good indicators of landscape quality in general (Dochy & Hens 2005). We distinguish two types: (1) those that rely on an open landscape and (2) those that prefer a more small-scale landscape, characterized by landscape elements such as hedgerows, bushes, orchards, scrubs, field margins, … (Dochy & Hens 2005). This type of landscape is still present in West Flanders, but its existence suffers from the increasing degree of intensification. To create support, you have to reach the general public and make them enthusiastic about the protection of our farmland biodiversity. Species are often more appealing to the imagination than habitats do and are therefore widely used as a stepping stone for conservation projects (Dochy et al. 2007). The perfect mascot of the small-scale landscape is the Yellowhammer (Emberiza citrinella). This species is protected according to "het Soortenbesluit", a decision of the Flemish Government on 15 May 2009 regarding species protection and species management. It switched from "endangered" to “Least concern” according to the Red List of Flemish Breeding Birds (Devos et al. 2004, Devos et al. 2016), but this is mainly due to its increase in the east of Flanders. West Flanders, on the other hand, barely enjoys the population increase. Its high cuddibility factor and bright yellow colour make from the Yellowhammer a symbolic and recognizable bird species (Dochy et al. 2007). It is important to note that the Yellowhammer’s habitat is also home to many other rare and threatened species
Figure 1: Winter food plot in Heuvelland, sown with
By improving the habitat conditions of the Yellowhammer, many other species may experience indirect positive effects.
The overall goal of the Species Action Plan is to preserve the Yellowhammer population. To achieve this, most measures are focusing on conservation and improvement of their current habitats. Only if the current local population increases, expansion to lost areas is possible (Dochy 2018b). The following five goals are explained by the Species Action Plan:
1) The improvement of the breeding habitat with a focus on the construction and management of Yellowhammer-friendly hedges.
2) Providing winter food in the form of large starchy seeds (wheat, barley or bristle oat).
3) Creating insect-rich zones. They harbour many insects and seeds and are therefore important all year round.
4) Refinement of the knowledge, which allows us to improve the efficiency of the current measures and to better evaluate them.
5) Raising awareness to create a large support base.
The first three measures for the Yellowhammer focus on providing food and protection. They are known as the “Big Three”, according to Dochy & Hens (2005).
My thesis will focus on the fourth goal and will more specifically investigate the territory selection by the Yellowhammer in Heuvelland, located in the Province of West Flanders. Which type of habitat do they prefer? What influence do the winter food plots have on their territory selection? What is the distribution of the settled territories?
1.5 Entering the breeding period
1.5.1 Nest site selection
In February, male Yellowhammers leave the winter flock in the morning and evening to search for a suitable breeding territory. Territories must include a nest site, be close to song perches and be in close proximity to food resources, because most foraging trips to collect food for the young are made within 100 m of the nest site (Morris et al. 2001).
Trees or shrubs that clearly stand out above the other vegetation are valued as singing or observation post. Electrical wires and fence poles also fulfil this function. Only one tree may be required per territory, and hence territories need at least one boundary possessing a tree (Whittingham et al. 2005). Yellowhammers typically build their nests among herbaceous vegetation in ditches or in the shrubby vegetation of hedgerows (Stoate et al. 1998, Bradbury et al. 2000). The optimal hedges are rather low (1.40 m) and wide (1.20 m) and are not too neatly shaved (Lack, 1992). A closed bottom is preferred since Yellowhammers mostly breed either on or close to the ground. Pasture and silage leys are avoided. These preferences tie the Yellowhammer to a small-scale agricultural landscape in Europe, which is typically full of small landscape elements such as shrubs, trees, hedges, wood edges, groves, orchards and bramble stems, in combination with herb-rich verges or plots. Winter set-aside fields have a strong influence on Yellowhammer distribution (Whittingham et al. 2005).This is due to the temporal persistence of set-aside fields into the spring, in contrast to stubble fields which are often ploughed earlier in the year.
A regional study along both sides of the border between France and West Flanders discovered that both pollard willows and ponds occurred more than average in Yellowhammer territories (Dochy 2014). Ponds are often surrounded by bare trampled soil, the preferred foraging ground by Yellowhammers. Pollard willows act as suitable singing posts and are rich in insects from early spring. In addition, these old truncated trees often point to less intensively worked farmland.
In our area, the species is largely sedentary, wintering in the same general areas as occupied in the breeding season (Whittingham et al. 2005). In West Flanders, Yellowhammers rarely roam more than 2 km outside their local breeding area during winter (Dochy 2018a). It is assumed that the overwintering individuals are local or originating from neighbouring breeding areas in northern France, although hard evidence is still lacking.
During the breeding season the socially monogamous couples are strongly territorial. The male establishes and defends its breeding territory by singing and fighting with other males from February (Andrew 1956). Linear features such as hedges or ditches are more strongly defended than the corresponding area in the field. The size of Yellowhammer territory decreases with increasing population density (Andrew 1956).
1.5.2 Surrounding habitat specificity
Yellowhammer territories must contain a nest site and be close to song perches and food resources (Fig. 2). The chicks are fed with invertebrates and later unripe grain is added to their diet. So, during the breeding season, field margins, un-cropped land and cereal crops are important sources of chick-food arthropods and seeds (Douglas et al. 2009, Henderson et al. 2012). Grass margins and other non-crop field boundary habitats, such as
hedgerows and ditches, are selected relative to cropped areas by Yellowhammers (Perkins et al. 2002). However, in cereal fields, tractor tramlines with sparser vegetation than cropped areas are also a preferred foraging site. The accessibility and detectability of arthropod prey is likely to be higher in these tramlines compared to in the adjacent crop. The selection of sparsely vegetated tramlines suggests that vegetation structure is an important determinant of patch selection within cereal fields (Douglas et al. 2010), but also in the uncultivated field margins (Morris et al. 2001).
Yellowhammers initially select foraging microhabitats according to the vegetation structure and later according to food availability (Dunn et al. 2010). Lower vegetation cover provides a greater visibility of predators and thus a lower perceived predation risk (Whittingham et al. 2004). Invertebrate abundance is lower, but the lower vegetation density allows easier access to their prey. While increased vegetation cover leads to a higher perceived predation risk to the foraging bird, higher invertebrate abundances associated with increased cover can lead to birds selecting such sites for foraging. This happens in areas where the invertebrate abundance tends to be low and where a higher
Figure 2: Yellowhammer territory with hedgerow and grass
risk (Butler et al. 2005). A valuable measure to improve foraging sites is cutting patches within field margins to create a mosaic of cut patches where accessibility is improved, adjacent to uncut patches where invertebrate abundance remains high (Douglas et al. 2009, Perkins et al. 2002, Morris et al. 2001, Vickery et al. 2001). These enhanced arable margins, created either by sowing or through natural regeneration, have a strong influence on the Yellowhammer’s territory selection (Burgess et al. 2015).
1.5.3 Conspecific attraction
Conspecific attraction is the tendency of individuals of the same species to settle close to each other, which leads to a territorial clustering. This phenomenon is well described in colonial species, especially birds. Although this behaviour may occur in territorial birds, like the Yellowhammer, evidence has been scarce. If territorial birds do exhibit this behaviour, it would have major conservation implications (Ward & Schlossberg 2004). The theory of conspecific attraction seems contra-intuitive, because you would expect that an increase in conspecific density leads to an increased intraspecific competition resulting in a reduced individual fitness. If a clustered distribution is observed, there has to be a profound reason why a species chooses to breed close to its conspecifics instead of living in a randomly distributed population. Several mechanisms can declare conspecific attraction. First of all, conspecifics can act as cues to habitat quality. In many species, territory quality is determined by the distribution of habitat and vital resources, but accurate assessment of the patch quality or availability is often difficult or time-consuming (Stamps 1988, Herremans 1993, Muller et al. 1997, Ward & Schlossberg 2004). Secondly it can be a result from an increased predator and competitor protection. Territory owners may warn their neighbours about the presence of predators by producing specific alarm calls. Neighbours can cooperate to defend themselves against predators and interspecific competitors. Working together reducesthe overall defence costs for individuals living within groups of territories (Stamps 1988, Muller et al. 1997). Furthermore, aggregations can be caused by social attraction. Males in territorial clusters might attract more females and thus have an increased chance to find a mate or to achieve extra pair copulations. "Social stimulation" provided by neighbours can result in synchronous reproduction and decreased juvenile predation rates (Stamps 1988, Herremans 1993, Reed & Dobson 1993, Muller et al. 1997).
No literature was found about possible conspecific attraction by the Yellowhammer. However, aggregated territories were found at a member of the Emberiza genus, more specifically the Ortolan Bunting (Emberiza hortulana) (Vepsäläinen et al. 2007, Dale & Steifetten 2011). This bunting is among the species with the most severe population declines in Europe during recent decades. It suffers from the same habitat degrading forces as the Yellowhammer. In Belgium, the Ortolan Bunting is extinct
since the beginning of the 21th century.
Berg (2008) surveyed the habitat selection and reproductive success of Ortolan Buntings on farmland in central Sweden. He found that Ortolan Buntings were strongly aggregated with many territories in a few areas. At the 1-km2 scale, territories occupied by pairs aggregated strongly in areas with high proportions of preferred habitats. The number of territories with single males correlated positively with the number of pairs, which suggests that conspecific attraction may influence territory distribution. Dale et al. (2006) investigated the search for breeding areas at the landscape level by the whole Norwegian population of the Ortolan Bunting. They stated that young Ortolan Bunting males searching for new breeding areas should take advantage of conspecifics to locate breeding areas and perhaps assess the quality of these.
1.5.4 Bearing in mind: country specific aspects
It is important to note that a lot of studies concerning the relationship between farmland bird abundances and food provisioning or habitat features is conducted in Great Britain (Kleijn et al. 2014). Agriculture in Great Britain happens on a much larger scale compared to our regions and is characterized by extensive plots and a crop rotation that is mostly dominated by winter wheat and oilseed rape. The loss of mixed farming led to a geographical separation between arable (eastern Britain) and livestock farming (western Britain) (Stoate et al. 2001, Robinson & Sutherland 2002). The Flemish landscape, on the other hand, is still characterized by a more small-scale agriculture. The larger English farm companies also allow an easier integration of conservational measures. The results and solutions from British studies cannot always be directly translated to the situation in Flanders. We have to interpret them with care. Therefore, it is important to conduct supplementary research that takes our Flemish situation into account.
1.6 The Yellowhammer as a study species
1.6.1 Characteristics
The Yellowhammer is a rather large bunting with a fairly long, slightly forked tail, belonging to the bunting family Emberizidae. The males have a bright yellow head and breast, and a darkly streaked back. The females, on the other hand, are less brightly coloured and more streaked on the crown, breast, and flanks (Fig. 3). There is a lot of individual variation in the amount of yellow in both sexes. Their reddish-brown rump and white outer tail feathers are a striking and species-specific characteristic during take-off and landing. The bill is grey and the legs are flesh-brown. The juvenile is much duller and less yellow than the adults, and often has a paler rump. Both sexes are less strongly marked outside the breeding season, when the dark fringes on new feathers obscure the yellow plumage.
Figure 3: Yellowhammer in its different plumages.
Source: Dochy, O. (2014). Actieprogramma soortbescherming Geelgors [Actieplan]: Provincie West-Vlaanderen.
Kingdom Animalia Phylum Chordata Class Aves Order Passeriformes Family Emberizidae Genus Emberiza
1.6.2 Habitat
The Yellowhammer occupies a wide range of vegetation types across Europe. Originally, it is an inhabitant of semi-open areas where it prefers transition zones between short herb-rich vegetation and shrubs or forest edges from which the male likes to sing. Across Europe, the Yellowhammer has been able to adapt well to a small-scale arable and mixed farmland full of small landscape elements such as shrubs, solitary trees, hedges, wood edges, groves, stubble fields and herb-rich margins or parcels (Dochy, 2014). However, this type of landscape is dramatically disappearing due to the agricultural intensification.
1.6.3 Diet
During winter, Yellowhammers feed themselves almost exclusively with starchy cereal grains (Robinson 2004). Wheat (Triticum spp.) is the most preferred grain type, due to its ease of handling and consumption, followed by oats (Avena spp.) and, if nothing else is available, barley (Hordeum vulgare) (Perkins et al. 2007). Their diet can be supplemented with some weed seeds, especially from genera like Polygonum, Centaurea, Stellaria and Poa (Robinson 2004). In contrast to other farmland birds, Yellowhammers are quite picky. Maize seeds are too big to swallow and oily seeds, such as those of brassicas, are ignored in favour of more starchy items (Dochy & Hens 2005).
During the breeding season, Yellowhammers add invertebrates to their diet, particularly as food for their growing chicks. A wide range of species is taken including grasshoppers, flies, beetles, caterpillars, earthworms and spiders. During the first few days, chicks are exclusively fed invertebrate prey, but later on, unripe grain is added to their diet (Stoate et al. 1998, Morris et al. 2005). Adult birds eat 3/4 invertebrates and 1/4 plant seeds in the breeding season. Nestlings receive 2/3 invertebrates and 1/3 seeds (Dochy 2014).
1.6.4 Behaviour
Most European Yellowhammers winter within their breeding range, only the northern populations move southwards. During late summer, the young birds start to form winter flocks. Adults join later during autumn (Clarysse 2003). These groups can greatly differ in size and often consist of other seed-eating birds. They exploit seed-rich places, such as (grain) stubble fields, set-aside areas or manure heaps. Yellowhammers prefer a nearby bramble or thorn bush to rest or hide in. In February, the males leave the flock in the morning and evening to search for a suitable breeding territory. They search a noticeable song post and show their presence by their striking singing. It sounds like the swelling tune from Beethoven's fifth symphony, with a series of short notes, gradually increasing in volume and followed by one protracted note. The omission of the long final strophe happens regularly. Yellowhammer males learn their songs from their fathers, and over time, many local and individual variations have developed (Diblíková et al. 2019).
Females leave the winter flock later. The entire process, from winter group to the occupation of a breeding habitat, takes two months. It can be interrupted by cold or rainy weather, causing the birds to return to the winter groups (Clarysse 2003).
During the breeding season, couples are strongly territorial. The female builds the nest low against the ground in high grass, often along shrubs and hedges, usually close to arable land. She lays 3-5 eggs around mid-April. After 12 – 14 days, the eggs are hatched. The young remain in the nest for 11-13 days and are cared for by both parents. After fledging they are fed for another 8 days before becoming fully independent. A second brood during the summer is certainly no exception (Dochy 2014).
1.6.5 Population trend and distribution
The Yellowhammer is the most common and widespread European bunting (Snow & Perrins 1998). They are mostly sedentary birds, living from Spain up to Scandinavia and from Ireland up to Central-Siberia. In the Mediterranean it occurs only as a winter visitor, while in the far north they are migratory birds. They are absent from high mountains, arctic regions and places with very intensive agriculture, like large parts of Flanders and the Netherlands. Yellowhammers have also been successfully introduced in New Zealand in the 19th century (Tietze et al. 2012). Three subspecies occur throughout Europe: E. citrinella citrinella (Northern Spain – Scandinavia), E. citrinella caliginosa (western Great-Britain) and E. citrinella erythrogenys (Eastern-Europa, Russia and the Baltic states).
The Yellowhammer used to be common and widespread as well in our Flanders. Since the eighties, their distribution area dramatically decreased. Nowadays, there are only 3400 – 4000 breeding pairs left from the 10 000 – 11 000 estimated pairs in the period of 1973 – 1977 (Devos et al. 2004). Only in Limburg and Flemish Brabant, we still find some core populations. In West Flanders we find some relict populations along the French border. According to Dochy (2014), about 100-120 couples remain between Beveren-aan-de-IJzer and Nieuwkerke.
Population numbers of Yellowhammers in Flanders are slightly rising recently (+50%, 2007-2016), especially in the east, but the high level of more than 50 years ago is still a long way off. Together with the fact that its breeding area seems to be expanding in a westerly direction (Vermeersch et al. 2004), the species has been included in the new Red List in the category ‘Least Concern' (Devos et al. 2016). However, the recent increase in the Flemish population is contrary to the European trend, which shows a lasting decline both in the long term (-45%, 1980-2015) and in the short term (-11%, 2006-2015).
Red List category of the Yellowhammer:
Europe: Least Concern (IUCN List of Threatended Species, www.iucnredlist.org, 2020) United Kingdom: Threatened (RSPB, www.rspb.org.uk, 2020)
France: Vulnerable (UICN, List Rouge des espèces menaces en France, 2016) Netherlands: Least Concern (Rode Lijst, www.sovon.nl, 2017)
Belgium (Wallonia): Least Concern (Liste Rouge des oiseaux nicheurs, biodiversite.wallonie.be, 2010) Belgium (Flanders): Least Concern (Red List of Flemish Breeding Birds, www.inbo.be, 2016)
2
Objectives
Improving our knowledge about the habitat preferences and territorial behaviour of Yellowhammers is one of the key instruments to adjust the current conservation measures. By improving the quality of their habitat, local populations get the chance to increase and to become more resistant to natural population fluctuations. Only if the current local population grows, expansion to lost areas is possible again. This study will be performed in the West Flemish Heuvelland, characterized by the increasingly rare small-scale landscape harbouring some relict populations of the Yellowhammer.
2.1 Objective 1:
Which habitat features determine a preferred Yellowhammer territory?
The first part of this master thesis will focus on the relative importance of habitat and boundary features during the early settlement process. Habitat associations have been studied by several researchers (Bradbury et al. 2000, Whittingham et al. 2009, Burgess et al. 2015, McHugh et al. 2016), but their results may not be directly translated to the situation in West Flanders. Therefore, it is important to investigate our local populations and adjust conservation measures to their specific needs. We did an effort to gain extra knowledge about the preferences of surrounding small landscape elements and land-use that define territory selection.We will develop a model in which we try to predict which habitat features have an influence on the territory choice. Yellowhammer territories will be compared to a set of random points inside the survey area. Do Yellowhammers build their nest in close proximity of AES-options? Which type of surrounding crops do they prefer? We hypothesize that nearby invertebrate food resources are the main driver of habitat choice (Dunn et al. 2010, Douglas et al. 2012). We expect the presence of a hedgerow to be important as both song perch and nesting site (Bradbury et al. 2000, Stoate et al. 2001, Batáry et al. 2010). Tree lines are also expected to be an important source of song posts (Bradbury et al. 2000).
2.2 Objective 2:
Do winter food plots have an influence on early territory settlement by the
Yellowhammer?
Fields sown with winter bird crops are an effective conservation measure to help Yellowhammers and other bird species survive the winter. On the first spring-like days at the end of the winter male Yellowhammers leave these winter food crops to search for a suitable breeding territory. But do Yellowhammers settle in closer proximity to the food plots than expected by chance? Are proper territories closest to the plots taken first? Is the difference in distance related to the crop type of the winter food plot? We expect male Yellowhammers to mark their territory near the winter food plots where they mainly reside during winter.
2.3 Objective 3:
Are Yellowhammer territories spatially clustered?
We will investigate if the distribution of Yellowhammer territories deviates from spatial homogeneity. Does conspecific attraction play a significant role in the distribution of the Yellowhammer? Or does the observed distribution merely reflect a patchy distribution of suitable habitat? The hypothesis is that a Yellowhammer likes to nest at an audible distance from its neighbour (Clarysse 2003). Based on my own observations, we estimate that when the weather is calm, Yellowhammers can hear each other up to 400 meters away.
3
Material & methods
3.1 Study site
The study was carried out between the end of February and mid-April 2020 in a region centred around Heuvelland, situated in the Province of West Flanders (Fig. 4). The total study area is approximately 47 square kilometres and ranges from the French border in the west to Dikkebus and Kemmel in the east, and from Reningelst in the north to Dranouter in the south. The region is characterized by mixed agriculture, with fields bounded by ditches, hedges, tree lines, fences or grass margins. Land use consisted of a combination of arable crops (spring- and autumn-sown cereals, legumes, maize Zea mays, beets Beta vulgaris and linseed Linum usitatissimum), hay and silage for winter forage, and pasture grazed by cattle or horses. Spread out, we also find farmsteads, private houses with their gardens, small villages and small woodlands. Different AES options are present, delivering winter food plots as well as enhanced field margins and hedges. Winter food plots are under management of Natuurpunt, ANB (Agency for Nature and Forests), the Province of West Flanders, RLW (Regional Landscape Westhoek) or local farmers on contract. They were sown with seed-supplying crops like spring or winter wheat (Triticum spp.), bristle oat (Avena strigosa), oil radish (Raphanus sativus subsp. oleiferus) or a seed mixture. Unfortunately, bristle oat failed to set seed this winter and was therefore unable to bridge the hungry gap. The wheat quality was unusually good luckily, and filled that gap.
3.2 Data collection
3.2.1 Colour-ringing
As a first technique to investigate if the early settlement of Yellowhammers is related to the presence of winter food plots, we used colour-ringing. Resightings of colour-ringed individuals allow us to investigate if the Yellowhammers that make use of the food plot during winter, also breed in the nearby area.
Local bird ringers ensured the ringing of Yellowhammers and chose the right ringing sites. They were selected based on the number of Yellowhammers occurring on the site and their practicality for catching birds. Birds were captured by using mist-nets, which are commonly used to capture passerines. The effectiveness of this technique is highly dependent on weather conditions. Rain and wind increase the visibility of the nets, thus making them useless. Only when the conditions were optimal, the mist-nets could be installed. They are best placed against a dark background, e.g. dense, high hedges. Mist-nets are designed in such a way that when a bird flies against the net, it becomes entangled in a loose, baggy pocket of netting created by horizontally strung lines (Sutherland & Green
Figure 4: Map op West Flanders with a frame
2004). To catch Yellowhammers, we used 9 m and 12 m wide mist nets with 4 shelves and a mesh size of 16.
At each capture, birds were (1) sexed, (2) aged, (3) measured for wing length, (4) measured for weight and (5) given a fat score (according to Svensson, 1992). Aging was done by distinguishing between “young birds” (hatched during 2019) and “adult birds” (hatched prior to 2019) (Table 1).
Each individual was marked with 4 different rings: three colour rings and one metal ring (2.8mm). Two colour-rings were attached on the right tarsus and one colour-ring on top of a metal ring were attached on the left tarsus. This combination of colour-ringing was opposite to the one used in the master script of Ostyn (2016), so we could avoid conflicts. The colour rings had an inner diameter of 2.8 mm and a height of 9 mm. In this project, six different colours were used: yellow, orange, red, white, blue and dark green (Fig. 5). Colour combinations that are hard to identify in the field (e.g. white-yellow, red-orange) were excluded.
The colour-ring on the left tarsus is indicative to the food plot where the bird was captured and ringed. The two colour-rings on the right tarsus allows us to identify each Yellowhammer individually (Fig. 6).
Figure 6: Colour-ringed Yellowhammer Figure 5: Scheme of possible colour combinations with "M" referring to the metal ring
Due to turbulent weather conditions in February and March, only two ringing events could take place (14 February 2020 and 4 March 2020). A total of 21 individuals have been caught and colour-ringed (Table 1). Volunteers of the monthly simultaneous counts of farmland birds were called on watching out for colour-ringed birds. Nevertheless, resightings of colour-ringed Yellowhammers were scarce. Only two resightings were recorded, each time of the same individual. They are therefore excluded from the statistical analysis.
3.2.2 Bird surveys and territory mapping
Fields were surveyed between the end of February and mid-April, following Breeding Bird Monitoring Project (BMP) methodology (Vergeer et al. 2016). Bird surveys were carried out once or twice a week between 8:00 AM and 3:00 PM. Periods of heavy rain, strong wind or poor visibility were avoided, as birds are harder to locate by sight and sound in these conditions. In addition, these adverse conditions will reduce bird activity in general. Routes were reversed between surveys to minimize any effects of time of day. When behaviour indicative of territoriality, typically singing males, was spotted, the Yellowhammer’s exact location was digitally mapped on the mobile app Maps.me. Each possible territory location was at least four times visited. Repeated visits are necessary to distinguish between true and false absences and thus to reduce the likelihood of double-counting territories. To define the locations of breeding territories, observations of Yellowhammers showing territorial behaviour and being less than 150 m apart were aggregated into one territory. If a territory was made up of more than one observation, the centroid of that cluster was calculated using GIS software (QGIS 3.12.0-București) and defined as the core territory. Finally, a circular buffer had to be drawn around each territory centroid. Yellowhammers can forage up to 400 m from the nest, although trips are typically shorter in high quality habitat and take place within 100 m from the nest (Morris et al. 2001, Perkins et al. 2002). Therefore, we chose to generate a 150 m buffer around each territory centre. With the use of GIS, random points with a minimum distance of 300 m between each other were generated inside the study area. Each random point was given a 150 m buffer zone. When the buffer of a random point overlapped with the buffer of a territory, it was excluded and a new random point was added. Using random points, we can statistically compare the characteristics of occupied territories with characteristics expected under random territory selection (null model).
Table 1: Overview of the Yellowhammers colour-ringed,
3.2.3 Surrounding habitat features
3.2.3.1 Habitat mapping and data extraction
Habitats within 150 m of a territorial Yellowhammer were identified and recorded during the field surveys. Surrounding crop types, boundary features and type of song post were noted. This data was merged with existing data about land-use, AES-options and watercourses, contained in GIS-layers which were derived from Research Institute for Nature and Forest (INBO), the Vlaamse Landmaatschappij (VLM) and the Province of West Flanders. If necessary data was missing, like small landscape elements and margins that are not under AES management, additional habitat surveys were performed and the lacking habitat features were digitally mapped in GIS based on orthophotos and own field observations. Afterwards, surface area and lengths were calculated in GIS. Habitat and boundary features inside the 150 m buffer of each territory and control point were selected in R (R Core Team 2020) using the ‘sf’ package (Pebesma 2018).
3.2.3.2 Selection of habitat predictor variables
The extracted data was aggregated into different categories for analysis using the ‘tidyverse’ package (Wickham et al. 2019). Pooling the data is necessary as some variables were too rare to allow statistical analysis. Collinearity between covariates was evaluated using Pearson correlations coefficients displayed in a correlogram, combined with their significance.
1) Crop types
Information about the type of agriculture in our study area was derived from the Vlaamse Landmaatschappij (VLM). It consisted of a digital map containing all crop types sown in 2019 and harvested that same year. Since 48 different crop types were found inside the territory buffers, they were first grouped in 9 more general crop groups (Table 2). Annex 1 in the Appendix shows all selected crop types and their classification into general crop groups, as well as percentages indicating how much of the total study area (47 ha) is covered by each habitat variable.
Starchy crops like wheat, barley and triticale were merged into the crop group ‘CEREALS’, since their overwinter stubbles provide an important winter habitat (Gillings et al. 2005, Bright et al. 2014). Under ‘GRASSLAND’ we grouped (1) temporary grass, primarily cut for fodder, (2) pasture, often grazed by livestock and (3) cover crops, used to manage soil erosion or as green manure to increase soil fertility for subsequent crops. Grasslands provide less invertebrate food than the more natural and flower-rich field margins (Perkins et al. 2002, Buckingham et al. 2006) and lack bare open ground due to their denser sward structure (McCracken & Tallowin 2004). Cover crops with leguminous plants may provide an additional benefit by attracting pollinators and natural enemies of crop pests (Lee-Mader 2015), but the most preferred insects like Syrphid and Lepidoptera larvae and Coleoptera are scarce or absent in the dense vegetation structure (Moreby & Stoate 2001, Dunn et al. 2010). Farm buildings and surrounding stables were combined into ‘FARM’, because also non-crop land-uses may have an influence on the abundance of farmland birds (Sirwardena et al. 2012). Lacking information about farms was completed using a GIS-layer derived from INBO and containing all types of buildings. Crop types occurring in less than 10% of the territory buffers were grouped into the variable ‘OTHER’. Since most spring sown fields were fallow during the bird surveys, we regrouped the crop groups for a second time. Crop groups sown in spring (maize, potatoes, legumes, cabbage crops and root crops) were merged in the variable ‘S_FALLOW’ since they serve as a predictor for likely presence of fallow or stubbles. This summarizes the 48 different crop types into five groups which could be used for
Table 2: Description of the different crop groups and their total area present inside the territory buffers
Crop group Description Total area (ha)
Potato Potato seed and propagating material 78.62
Maize Grain and silage maize 107.81
Legumes Peas and bean 17.68
Cabbage crops All brassicas 21.30
Root crops Beets, carrots, onions 45.86
Cereals Wheat, barley, triticale 131.02
Grassland Temporary grass, pasture and cover crops (including bristle oat)
Farm Isolated farm buildings and stables 7.14
Other Variables with <10% occurrence 10.33
2) Agri-environment scheme options
Maps with agri-environment scheme options were obtained from the VLM and the Province of West Flanders. A total of nine AES options belonging to four different management objectives were present inside the territory buffers. In order to convert this into workable units, the various AES options were grouped into three units, indicating the effects they may have on Yellowhammers (Table 3). As mentioned before, bristle oat failed to set seed this year. Therefore, it could no longer serve as a winter bird crop, so we added it to the variable ‘GRASSLAND’ (Table 2). Oil radish produces oily seeds which are not preferred by Yellowhammers (Perkins et al. 2007). However, regular observations of a few Yellowhammers on oil radish plots were reported during the monthly simultaneous counts of farmland birds. We decided to include oil radish for the analysis
Table 3: Description of the different AES options and their total area present inside the territory buffers
AES option Description Total area (ha)
AES hedge Hedges, shrubs and wood edges with restricted cutting timing. Provides shelter and nesting sites.
0.57 AES margin Field margins including all non-cropped margins under any AES
management; no fertilizers or pesticides. Includes grass buffer strips (mainly constructed to prevent erosion), nectar flower mixture, floristically ‘enhanced’ grass buffer strips.
Provides shelter and food.
2.69
Winter food plot Fields sown with seed-rich crops, including wild bird seed mixtures, oil radish, autumn cereals and spring cereals. Provides food during winter.
4.93
3) Boundary units
Yellowhammers typically locate their nest along field boundaries (Bradbury et al. 2000). Small landscape elements, ditches and field margins serve as important foraging and breeding sites. Nesting occurs either on the ground in grassy margins or ditches, or in hedges (Stoate & Szczur 2001, McHugh et al. 2013). A territory site is often chosen in close proximity of the male’s favourite song post, like a tree or solitary hedge (Ferguson-Lees et al. 2011, Dochy 2018b). Therefore, all suitable boundary features that are not under AES management were digitally mapped during habitat surveys. Grassy margins between 2 and 6 meters wide were mapped and classified under ‘Non-AES-Margin’. Their area (in hectares) was calculated in GIS. Hedgerows, shrubs and wood edges were summarized under the
under ‘TREES’. Information about all types of watercourses was extracted from the Grootschalig Referentiebestand (GRB) derived from INBO. Unnavigable watercourses and ditches were merged into the variable ‘All_Ditch’ (Annex 1 in Appendix). The length (m) of ‘Non-AES-Hedge’, ‘TREES’ and ‘All_Ditch’ was calculated in GIS.
3.3 Statistical analysis
Model constructions were performed in the statistical program R version 3.6.3 (R Core Team 2020). Visualizations were done using the R package ggplot2 (Wickham 2009).
3.3.1 Territory settlement and the relation with surrounding habitat features
3.3.1.1 Exploratory analysis
In an exploratory analysis, the relationships between the various variables were visualized using Pearson’s correlation coefficients with multipanel scatter plots displaying both linear and non-linear relationships between the variables. Multicollinearity between the independent variables is also tested by calculating the Variance Inflation Factor (VIF). If the VIF of a predictor variable is higher than 4, we have to be cautious and probably adjust the model.
The distribution of each habitat category per treatment is graphically presented using boxplots. However, these visualizations are not sufficient to draw conclusions. Therefore, a multiple regression model which considers the possible effects of all potentially important variables was constructed. 3.3.1.2 Model building
We used a Generalized Linear Model (GLM) to develop a model in which we try to determine which habitat features influence the early territory settlement by Yellowhammers. The presence/absence of a territory is the dependent variable and the independent variables are the set of 10 habitat features (Table 4). Since our data is spatially autocorrelated, i.e. values of a variable sampled at locations close to each other are more similar than values taken from more distant locations, we have to correct for this to avoid increasing type I error rates. This correction was done by adding a spatial autocovariate, which is a distance-weighted function of neighbouring response values (Dormann et al. 2007). It will be included as an additional predictor variable in the original model. The autocovariate is calculated with the use of the ’autocov_dist’ function from the ‘spdep’ package (Bivand 2019). Seven variables were in hectares and three were meter, so we rescaled the explanatory variables using the ‘rescale’ function from the ‘arm’ package (Gelman et al. 2016). This function subtracts the mean and divides each numeric variable by two times its standard deviation (Gelman 2008). Since the presence of a territory is either false or true, we used a binomial distribution and logit-link for the binary data. We applied Likelihood ratio tests (LRT), comparing the model with and without the least significant term. The LRT-test follows a c2- distribution under the null hypothesis.
3.3.2 Influence of winter food plots on early territory settlement
In order to test whether Yellowhammer territories are situated close to winter food plots, we created distance matrices in GIS. Information of the winter food plots is obtained from a GIS layer derived from the Province of West Flanders. Two different distance matrices were generated, one with the distance of each territory point to its nearest plot and one with distances to the three nearest plots of each territory. Distances to the nearest plot are the smallest distance between the centroid of the winter food plot and the territory. Winter food plots were sown with seed-supplying crops for a variety of farmland birds. Each crop type used for analysis was defined based on its main component. We distinguish the two following crop types: (1) cereal grain (spring or winter wheat and barley) and (2) oil radish (oily seeds, not favoured by Yellowhammers).
For analysis of the influence of the nearest winter food plot on territory settlement, we used a Generalized Linear Model (GLM) with distance as dependent variable and treatment (Yellowhammer or control), crop type and an interaction between them as independent variables. A spatial autocovariate was added to control for spatial autocorrelation.
A Linear Mixed Model (LMM) was used to analyse the influence of the three nearest plots. LMMs were constructed using the ‘lmer’ function within the ‘lme4’ package (Bates et al. 2015). Fixed effects are treatment, crop type and an interaction between them. Territory identity is included as a random effect. A spatial autocovariate was also included. To calculate the significance levels of fixed effects, we used the Satterthwaite procedure, which immediately corrects the degrees of freedom in an F-test. Both models followed a Gaussian distribution and used Likelihood ratio tests (LRT) during model selection. Distances were log transformed to meet the normality assumptions.
3.3.3 Patterns of territory distribution
We want to determine whether or not Yellowhammer territories are randomly distributed throughout our study area. To obtain an estimation of the degree of clustering behaviour, we want to test whether the observed population distribution significantly deviates from complete spatial randomness. Besides our collected data, we used historical inventory data on distributions of Yellowhammers from 2003, 2004, 2005 and 2016. If the population is randomly distributed, each subregion of the study area (Fig. 7a) will have the same amount of territories, which can be estimated as the mean territory density multiplied by the subregion area. We call this a homogeneous Poisson process and this will act as the null model in our statistical analysis (Kingman 2005).
Using Ripley's K function1 (Ripley 1977), you can determine whether points have a random, dispersed or clustered distribution pattern at a certain scale. This method is based on the average number of points (here: territories) that can be found within a distance r of a randomly chosen point. The results are plotted in function of the distance r. Besides this, Monte Carlo simulations of the same amount of points under complete spatial randomness2 are plotted and serve as a significance envelope (Besag & Diggle 1977). The more simulations performed, the narrower this significance band becomes. The null
1 The formula of Ripley’s K function is !(#) = '()* , with r = distance, l = density (number of observations divided by study area), and E = number of extra events within distance r of a randomly chosen event.
hypothesis of complete spatial randomness is rejected as soon as the Ripley’s K function of our point patterns lies outside the significance envelope.
For our analyses we used the closely related L-function3, in which the variance is stabilized and therefore allows more reliable inferences. Under complete spatial randomness, L(r) = r for all r. Values of L(r) < r indicate a regular point pattern, whereas values of L(r) > r point to a spatially clustered distribution pattern. Significance bands are plotted using global envelopes (Myllymäki et al. 2017). Just like the Ripley’s K function, any excursion of the observed L-function outside the significance bands can be interpreted as rejection of the null hypothesis at the 0.01-significance level.
To draw correct conclusions, we have to remove unsuitable breeding habitat from our study area. If not, the observed clustering could be caused by the clustered distribution of suitable habitat. Yellowhammers are adapted to a small-scaled farmland full of small landscape elements (Dochy 2014) and thus avoid residential areas and broad-leaved woodland as breeding locations. They were excluded using GIS, leaving 4100 hectares (41 km2) of not trivially unsuitable breeding habitat in our study area (Fig. 7b).
In addition, we conducted a nearest neighbour analysis (Clark & Evans 1954) of the significant habitat variables in GIS to infer their distribution pattern inside our study area. A nearest neighbour analysis is part of the analysis tools in QGIS (QGIS 3.12.0-București). The mean of the distance observed between each point and its nearest neighbour is compared with the expected mean distance that would occur if the distribution were random. The nearest neighbour formula4 will produce a result between 0 (clustered) and 2.15 (regular). A value of 1 indicates a random distribution.
For each inventory year as well as all years together, we plotted L-functions using the ‘spatstat’ package of R (Baddeley & Turner 2005). We tested the outcome of the observed L-function against a model of complete spatial randomness that incorporated the irregular form of our study area.
3 The L-function is calculated as -(#) = .!(#)/+
4 The nearest neighbour formula is 0 =23(456) where 0 = nearest neighbour value, =3(>?@) = mean observed
Figure 7: Schematic representation of the study area with indication of unsuitable habitat types for
Yellowhammers. 7a: With indication of the occupied territories ranked per year and the division in subregions. 7b: The study area with exclusion of unsuitable habitat as it was imported for the statistical analysis.