FINANCIAL
IMPACTS
ON
SME
FINANCING
EMPIRICAL RESEARCH ON ACCESS TO FINANCE OF SMALL
AND MEDIUM-SIZED ENTERPRISES
Word count: 12192
Emma Leyn
Student number: 01506943
Nick Matthys
Student number: 01301710
Promotor: prof. dr. Martien Lamers
Master thesis to obtain the degree of:
Master in business administration: finance and risk management
Confidentiality agreement
PERMISSION
I declare that the content of this Master’s Dissertation may be consulted and/or reproduced, provided that the source is referenced.
Student’s name: Emma Leyn
Signature:
PERMISSION
I declare that the content of this Master’s Dissertation may be consulted and/or reproduced, provided that the source is referenced.
Student’s name: Nick Matthys
Preamble corona
The consequences of the coronavirus did not have an impact on the cooperation between our thesis promotor, prof. dr. Martien Lamers and us. Physical meetings were simply replaced via communication by e-mail.
Samenvatting
In deze paper wordt onderzoek gedaan naar de relatie tussen kredietverlening van banken aan kmo’s en de concurrentie tussen de banken. We beschrijven eerst wat er wordt verstaan onder het begrip kmo in Europa. Daarna, kijken we naar de moeilijkheden die een kmo ondervindt om krediet te verkrijgen. Als eerste zien we dat kmo’s minder voorspelbaar zijn. Er is niet veel informatie beschikbaar over hun activiteiten en kredietgeschiedenis. Verder beschikt een kmo over een hoog risicoprofiel, mede door het voorgaande. Doordat kmo’s risicovoller zijn dan grote bedrijven om leningen te verstrekken, zullen banken minder geneigd zijn om te lenen aan deze bedrijven. Door dit risico zal lenen duurder worden voor een kmo (de interestvoet ligt hoger dan bij leningen aan mature bedrijven) en zal de bank meer risico gewogen reserves moeten aanhouden. Kmo’s worden echter wel gesteund om leningen te verkrijgen. De standaard maatregelen worden gezien als reductie van de interestvoet. Onder de niet-standaard maatregelen, ook gekend als niet-conventionele maatregelen, vallen onder andere herfinancieringstransacties, verlenging van de looptijd, vaste rente, etc.
Als volgende bespreken we het verband tussen de concurrentie in de bankensector en marktmacht enerzijds en consolidatie van de bankensector anderzijds. De relatie tussen de concurrentie en de marktmacht wordt uitgelegd aan de hand van twee hypotheses. De market power hypothesis stelt dat wanneer de bankenconcurrentie stijgt, de toegang tot krediet stijgt. Voor de information hypothesis geldt het tegenovergestelde, namelijk wanneer de bankenconcurrentie stijgt, is er een daling van de toegang tot krediet.
Een algemene bevinding over de relatie tussen de consolidatie van de bankensector en de concurrentie in de sector is dat meer fusies een stijging van de bankenconcentratie weergeeft en dus een daling van de concurrentie in de bankensector als gevolg heeft. Dit heeft als gevolg dat er meer toegang tot kredieten zal zijn voor kmo’s.
Als toevoeging aan de bestaande literatuur onderzoeken we het effect van het aantal nonresident leningen op de toegang tot krediet voor een kmo. Uit bestaande literatuur vinden we dat grote, buitenlandse banken problemen ondervinden bij het verstrekken van een lening aan kmo’s. Deze instellingen kunnen namelijk minder snel een vertrouwensrelatie opbouwen met lokale bedrijven.
In dit onderzoek maken we gebruik van een dataset omvattende alle 28-EU landen (exclusief Malta). Deze data heeft betrekking tot de periode van 2013 tot en met 2017.
Onze resultaten stellen een positieve relatie tussen bankenconcentratie en toegang tot kredieten voor kmo’s. Dit impliceert dat minder bankenconcurrentie meer toegang biedt tot kredieten voor kmo’s. Onze resultaten geven een negatieve relatie tussen de niet-residentiële banken en toegang tot kredieten voor kmo’s. Dit wil zeggen dat hoe meer niet-residentiële banken er in een land zijn, hoe minder kmo’s toegang tot financiering krijgen van banken.
Foreword
To complete our Master of Science is business administration with a specification in finance and risk management at the university of Ghent, we had the opportunity to write a thesis in a subject of our interest. Courses like bank management and financial management gave us more insight and interest in the connection between SMEs and financial institutions. The topic bank competition and SME financing presented by prof. dr. Martien Lamers caught our interest. This paper gave us meaningful insights in the relation between banks and small and medium-sized enterprises in a more theoretical and international way compared to the understandings we found in the previously mentioned courses at the University of Ghent. We started this thesis as an individual paper. As we found it more interesting to make this report with two, we asked prof. dr. Martien Lamers if we could merge our work together during the beginning of the second semester. We would like to thank prof. dr. Martien Lamer once more for giving us the opportunity to make this thesis in a group of two. This way, we could provide a more in-depth report. During the corona crisis, physical meetings were not allowed to discuss problems or to receive feedback. We would like to thank prof. dr. Martien Lamers to help us obtain the necessary databases as well as providing us very helpful feedback via e-mail. Secondly, would like to thank the University of Ghent, and especially the professors, for this instructive course. Thirdly, a special thanks to our parents who gave us the opportunity to study and develop ourselves.
Table of contents
Confidentiality agreement ... i Preamble corona ... ii Samenvatting ... iii Foreword... iv Table of contents ... v Introduction ... 11 Part 1: Literature study ... 2
1.1 What is an SME in Europe? ... 2
1.2 Access to finance ... 3
1.2.1 Difficulties ... 3
1.2.2 Statistical evidence ... 7
1.2.3 Support lending to SMEs ... 9
1.3 Market power and banking competition ... 9
1.4 Consolidation and banking competition ... 12
2 Part 2: Data, variables and model specification ... 17
2.1 Description of the dataset ... 17
2.2 Variables ... 19 2.2.1 Dependent variables ... 19 2.2.2 Independent variables ... 20 2.2.3 Correlation matrix ... 25 2.3 Regressions ... 28 3 Part 3: Results ... 30 4 Part 4: Conclusion ... 34
List of tables
Table 1 SME Defenition ... 2
Table 2: Summary statistics: averages per country for the period 2013-2017 ... 22
Table 3: The averages, minima and maxima per country for period 2013-2017 ... 23
Table 4: Correlation matrix ... 26
Table 5: Regression outcomes ... 33
List of figures Figure 1 The most important problems (in the past six months) faced by euro area enterprises ... 7
Figure 2 The use of internal and external funds (in the past six months) by euro area enterprises by firm size. ... 8
Introduction
Financial institutions play a big role in the way small and medium-sized enterprises access finance. With 99% of the enterprises in Europe being an SME, it is important to understand the relationship between banks and these firms. This paper studies the relation between banking competition and the access to finance for small and medium-sized enterprises, for a EU28 (excluding Malta) panel study sample.
Our main findings contribute to existing literature in several ways. We find that low competition boosts access to finance for SMEs. aOur results also show that the presence of nonresident banks have a negative effect on the access to finance for SMEs.
Our study contributes to existing literature such as the information hypothesis, that states that banks with more market power have more incentives to invest in information acquisition and build long-term relationships with their customers because they can better internalize the costs of these activities (Petersen & Rajan, 1995). This paper also supports the efficient structure hypothesis, which states that the size of banks has a positive effect on the profits of a bank due to scale-dependent advantages. Our finding about nonresident banks are in line with Berger, Klapper, & Udell (2001), who find that foreign owned banks are less likely to lend to small firms than domestic banks.
The paper proceeds as follows. First, we sketch a picture of what an SME is. Thereafter we look at how SMEs experience lending. We show where difficulties lie, what support they receive and provide statistical evidence from Europe. We also discuss the relationship between banking competition and market power. Once a clear picture has been given, we continue to explain the relationship between banking competition and consolidation of the banking sector. Further in the paper, we look at the dataset we use and the method of research. Next, we discuss our results and finally draw our conclusions compared to the existing literature.
1 Part 1: Literature study
We divide this literature research into two main parts. First, we discuss the access to finance to SMEs. We explain what an SME is and outline the situation in Europe. We also discuss difficulties that SMEs face in obtaining credit, statistical evidence and the support SMEs receive. Subsequently, we look at the relation between market power and competition between banks. In this section, we also discuss the relationship between competition and consolidation. We finally bring these two together and we look at the effect of competition in the banking world on access to finance. We discuss the two main theories to explain the link between competition and access to finance, namely the market power hypothesis and the information hypothesis.
1.1 What is an SME in Europe?
According to the European Central Bank, and medium-sized enterprises account for 99% of the businesses in Europe. The European commission considers two main factors that need to be taken into account to define the type of business, namely the staff headcount and either turnover or balance sheet total (ECB, 2020).
Table 1 SME Definition
Company category
Staff headcount Turnover or Balance sheet total
Medium-sized <250 ≤ € 50 m ≤ € 43 m
Small <50 ≤ € 10 m ≤ € 10 m
Micro <10 ≤ € 2 m ≤ € 2 m
In 2018, the EU-28 reported more than 25 million active SMEs. An enormous amount of these SMEs were micro-SMEs (93%). In Europe, 67% of all employment is provided by SMEs, and almost 60% of all the value added in the EU. This makes SMEs the main engine of the European economy (ESPON European Union, 2020) . SMEs are responsible for reducing regional imbalances. More specifically, SMEs enjoy the flexibility of location compared to large industries. Small and medium-sized enterprises can easily move to a specific location. The
spread of SMEs increases by the creation from national or regional policy (Papadopoulos & Galloui, 2012). Thus, it is very important that SMEs are not restricted in their credit loans.
1.2 Access to finance
1.2.1 Difficulties
SMEs rely more on banks for their external financing than large companies, and SMEs are more likely to encounter difficulties in obtaining funds. This is partly due to lack of transparency and that their business activities are more difficult to estimate because their annual accounts are less informative. They also show less credit history to banks compared to big companies. This identification is reinforced by the fixed costs for external assessment and monitoring. This in turn leads to higher transaction costs for SMEs, in particular those arising from asymmetric information. The creditworthiness and financial health of the SME sector experienced a stronger downward movement than large companies during the crisis of 2008, but also in noncrisis times (Cœuré B. , 2013).
Since 2010, the sovereign debt crisis has exacerbated the financing conditions of euro area firms, in particular SMEs, both by damaging their growth prospects and by forcing banks exposed to the sovereign debt of some euro area countries to rebalance their credit portfolios (Cœuré B. , 2012).
Small and medium-sized businesses make creative investments to expand their business by financing and securing their competitiveness by obtaining advanced technologies. Despite their benefits, such as their contribution to employment, SMEs face difficulties in securing the financing of large companies. The causes of these obstacles are partly due to the high-risk profile of SMEs (Ganbold, 2008). The first obstacle is high interest rates. Government enforcement of high interest rates discourages banks from lending to high-risk borrowers. Secondly, large state-owned enterprises and government infrastructure projects have access to bank credit. Investments in the government less risky than investments in unknown SMEs. Thirdly, the growth of mandatory reserves for banks when holding high-risk loans is increasing. Currently Basel III rules have been imposed. Basel III implies an increase in the risk weightings for trading portfolios and securities. In the first instance, it seems positive for SME financing, as the risk weighting for private and corporate loans remain untouched and the so-called risky positions are covered by higher capital requirements, thus giving way to regulatory risk capital such as SME loans. The valuation losses in the profit and loss account could lead to aversions to these regulations. Independently of a risk adjusted picture we also investigate the leverage ratio. This involves the ratio of core capital to balance sheet assets, including off-balance sheet
items. As there is no risk weighting underlying indicator, it should be noted that this is incentive to favour high yielding assets over less yielding transactions. This regulation can have a negative impact on SME financing. Capital can be a bottleneck. However, this does not mean that higher capital requirements are holding funds that could otherwise be used for lending. Capital is a limiting factor in lending transactions. Without attracting further equity or securities, the growth potential of lending has been squeezed. In addition, stricter capital requirements may ultimately lead to higher financing costs (Angelkort & Stuwe, 2011).
When a company turns to external financing, banks need to be sure that their investment is profitable. To be sure of this, banks need all possible information about the company. The lack of knowledge of the activities and the effectiveness of an SME in general is actually an obstacle to securing these funds. SMEs face two basic risks. First, SMEs are considered by creditors to be high-risk borrowers for large enterprises because they are more sensitive to market fluctuations and, due to their lack of size, they often have insufficient management capacities. The second basic risk are shortcomings in management. The implementation for credit is limited by a weak position in business management. Due to the above risks, banks are less eager to grant credit to SMEs (Ganbold, 2008).
The main obstacle of an SME to efficiency in credit markets is due to information asymmetries. A lack of complete information can lead to an incorrect allocation of capital or costs for the agencies (Lopez-Gracia & Mestre-Barbera, 2015). Banks use a number of borrowing techniques to protect themselves against potential losses such as financial statements, credit scores, etc. In order to meet the requirements of the lenders, the availability of resources is determined by the profile of the company. The characteristics of the company are therefore a determining factor for financing (European central bank, 2017).
Older companies have a relationship with one or more banks and these reputation effects are reflected in easier access to bank debt because of the reduced opacity over time (Freel, Carter, Tagg, & Mason, 2010). A company's external financing needs to depend on internal capital to finance positive net present value (NPV) investment projects (Kumar & Ranjani, 2016). Companies with sufficient financial reserves and / or accumulating retained earnings may not need external financing or can be relatively confident that they can attract external investments.
The supply of financing to small businesses is also determined by the yield on the government bond and the level of outstanding private credit in the economy. An increase in government bond yields has a direct effect on capital markets (Blundwell-Wignall, Atkinson, & Roulet, 2012).
The yield on government bonds influences the supply of bank financing via three channels, namely price, liquidity and bank balance sheet channels. An increase in government bond yields may lead to a greater rejection of applications for bank loans, from which can be concluded that the real economy is significantly affected by this turbulence in the bond market (Holton , Lawless , & McCann, 2013).
The outstanding level of credit in the private sector has a significant effect on lending. According to Holton et al. (2013), small businesses are experiencing higher rejection rates when applying for loans in the private sector. When companies lack access to external finance, they cannot get enough funding for their projects, leading to slower economic growth for a region.
SMEs report that it faces more financing barriers in all major euro countries than large companies (except Ireland). When the information about the financial health of SMEs is linked to the financing barriers they encounter, it appears that companies in countries with a higher leverage effect and a lower interest burden and a lower profit often suffer more from financing barriers than SMEs in other eurozone countries (Cœuré B. , 2013). The leverage effect stands for the difference between Return on Equity and Return on Capital employed. Leverage effect explains how it is possible for a company to deliver a Return on Equity exceeding the Rate of return on all the Capital invested in the business, i.e. its Return on Capital employed (Vernimmen, 2017). Interest burden is the ratio of earnings before taxes (EBT) to earnings before interest and taxes (EBIT). It shows the percentage of EBIT left over after deduction of interest expense. In order to achieve a high ROE, a company must reduce its interest expense such that the EBT/EBIT ratio is high (XPLAIND, 2019).
Not all barriers are due to banks or regulation. There are also factors that the Eurosystem cannot influence because they vary from country to country, namely that some SMEs suffer from downward trends in the economy and structural rigidity, i.e. a lack of demand for their products, high input prices, unsuspecting regulations, heavy administration charges etc. (Cœuré B. , 2013).
Hakenes, Hasan, & Molyneux (2015) discuss the effects of small banks on economic growth. They first theoretically demonstrate that small banks operating at a regional level can boost local economic growth. Compared to large interregional banks, small regional banks are more effective in promoting local economic growth, especially in regions with lower initial grants and strict credit rations. The model predictions are then tested based on a sample of German banks and the associated regional statistics. In total, the bank-specific data covers 457 savings banks and the regional and bank market share information of 440 administrative
districts from 1995 to 2004. They find that small regional banks are more important financiers in regions with low access to finance. Hakenes et al. (2015) also show that funding constraints are negatively correlated with regional economic growth, especially in regions with weak financial development.
1.2.2 Statistical evidence
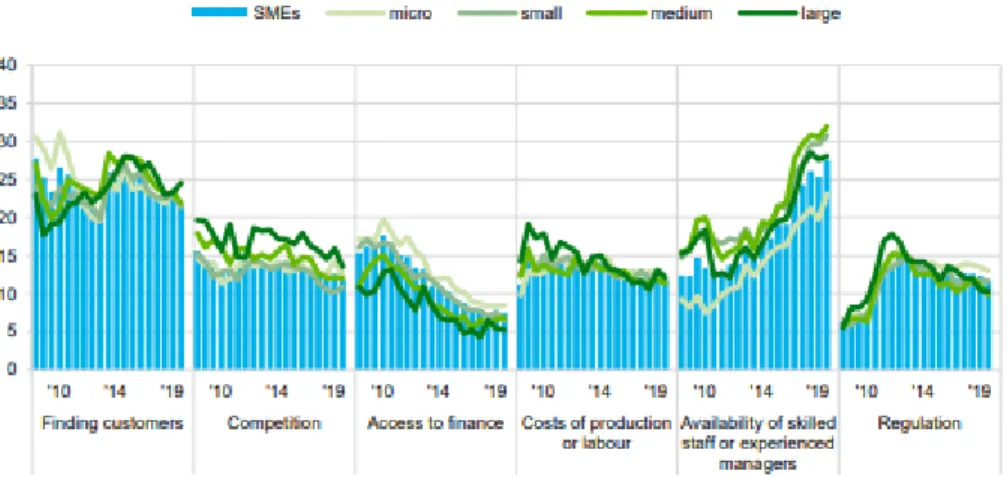
The 2019 survey on access to finance of enterprises in the euro area states that getting access to finance is not the biggest problem SMEs are facing. In figure 1 from the SAFE, we can see that finding skilled staff (28%) and the difficulty of finding customers (22%) is much harder than getting access to finance (7%) (European Central Bank, 2019).
Figure 1 The most important problems (in the past six months) faced by euro area enterprises
The most important problems faced by euro area enterprises
The external financing gap, which represents the difference between the change in demand and availability of external financing, continued to be negative in the period from April to September 2019. The percentage European SMEs reporting difficulties in finding access to finance diminished across countries. SMEs reported for the first time since the crisis (2009) a decrease in profit (-1%) due to the raise of costs such as labour and other costs. These profit dynamics vary remarkably from country to country.
Smaller firms remain to have a more vulnerable financial situation in comparison to larger companies, but the gap is closing. The percentage of distressed SMEs remained high in companies such as Italy, Spain and France.
The difficulty of finding access to finance is higher for SMEs than for larger companies. 9% and 6% for both micro and small and 7% of medium-sized companies signalled that access to finance was their first concern. In contrast, only 5% of the large companies signalled that this was their first concern (ECB, 2019).
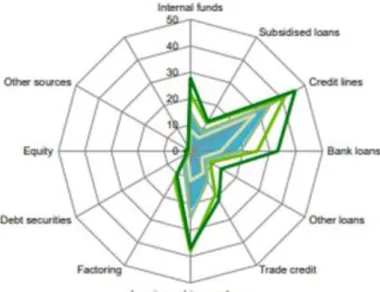
Figure 2 from the Survey on the Access to Finance of Enterprises in the euro area − April to September 2019 visualizes that bank loans and credit lines remain the most important source
of funding for SMEs. The third biggest source of funding is leasing or hire-purchase (European Central Bank, 2019).
Figure 2 The use of internal and external funds (in the past six months) by euro area enterprises by firm size.
Internal and external funds by euro area enterprises by firm size
Distressed or vulnerable firms resort to credit lines (53%) and bank loans (25%) as their main source of external financing to a much larger extent than profitable firms (26% and 12% respectively). In turn, profitable firms relied more on their internal funds, but also chose leasing or hire-purchases more frequently than vulnerable firms. The external funding availability seems to rise faster than the needs of funding which results in a negative financing gap, as mentioned before. In Europe, the average gap lays at –3%. The majority of the European countries have a negative gap, with exception to Greece (3%).
7,4% SMEs in Europe faced obstacles obtaining a bank loan. Obstacles are that costs were too high, rejected loans, only a limited amount was granted, or companies being discouraged taking on a loan. In Europe, 26% of SMEs applied for a loan, while 43% of SMEs did not apply for a loan because of insufficient internal funds. 72% of the European companies received the full loan they applied for. 48% of the SMEs interviewed stated that bank loans are not a relevant source of financing for them. In most of these cases, SMEs had no need for financing via bank loans (76%) (ECB, 2019).
1.2.3 Support lending to SMEs
During the financial crisis, the ECB took exceptional monetary policy measures, namely standard and non-standard measures. The first group includes a reduction in interest rates. The second group, also non-conventional measures, consisted of a fixed-rate full allocation for refinancing operations, extension of the duration of such refinancing operations to 36 months, reduction of reserve requirements from 2% to 1%, extension of the list of eligible collateral, direct liquidity provision in foreign currencies, covered bond purchase programs, securities market program, and finally the announcement of direct monetary transactions. These measures were effective in reducing the financing constraints of banks, limiting the risks of a disorderly reduction of bank debt leverage and supporting effective transmission in the euro area. If one looks at the effect of these measures on the credit channels to SMEs, the following can be concluded. Most governments have extended SME credit guarantees to encourage banks to reopen their credit facilities for SMEs, thereby reducing the risk of banks having to be on their balance sheets when granting new loans. Other measures stimulate the chronic shortage of capital for new companies in the sowing and starting phase. Venture capital funds are managed through public-private co-financing funds by fund managers from the private sector. However, many of these measures have a structural long-term perspective rather than addressing the cyclical weakness of SMEs (ECB, 2013).
1.3 Market power and banking competition
Existing studies provide mixed results and forecasts of the consequences of competition between banks on the access to finance. Previous empirical literature mainly consists out results confirming the market power hypothesis or the information hypothesis.
The hypothesis of bank market power holds that competition in the banking world reduces financing costs and increases the availability of credit. In contrast, the information hypothesis states that in the case of information asymmetries and agency costs, competition between banks can reduce access to finance by making it more difficult for banks to internap the costs of investing in building customer relationships (Petersen & Rajan, 1995).
Vives (2001) argues that the contribution of competition to the allocative, productive and dynamic efficiency in banking is no different than in any other sector. Competitive pressures allow innovation and the expansion of services, which should increase the availability of finance for businesses. Competition is also pushing banks towards riskier borrowers, especially SMEs, which are once again expanding access to a wider variety of businesses. The market power hypothesis thus predicts that low competition (i.e. high market power) will limit access and vice versa.
The structure-conduct-performance hypothesis (SCP) states that the setting of prices (lower deposit rates, higher loan rates) are less favourable to customers in more concentrated markets due to imperfect competition. This means that higher concentration implies less competition. The SCP is in line with the market power hypothesis, which states that higher banking concentration implies less access to finance.
Love and Peria (2014) use World Bank Enterprises Survey data from 2002 to 2010 to show that a low level of competition declines SME’s access to finance. They find that non-structural bank competition variables give significant effect to the access to finance, while structural measures are non-significant estimates. Mudd (2013), who studies whether competition helps or hinders small firm access to finance, draws comparable results for the structural and non-structural measures. Beck, Demirguc-Kunt, & Maksimovic (2004) measure the effect of the banking market structure on access to bank finance, using data for 74 countries of SMEs. They find that obstacles to obtain finance increase when bank concentration increases, but only in countries with low levels of economic and institutional development.
Léon (2015) shows that in emerging countries, reduced lending standards and discouragement, which are seen as SME financing constraints, dropped in countries with a more competitive banking market. These results are only valid when non-structural measures are used and are not valid for concentration measures. Han, Fraser, & Storey (2009) find similar findings using a larger U.S dataset. They conclude that discouragement is more efficient in concentrated markets, than in competitive markets. Rice and Strahan (2010) study the same U.S. dataset and find that small firms rely more heavily on bank financing in states with more banking competition. Also, a lower level of credit constraints is associated with states who have more banking competition.
Chong, Lu, & Ongena (2013) reported that banks who have less market power in non-U.S. single countries have a higher credit supply in comparison to banks who have more market power. Ryan, O’Toole, & McCann (2014) examined the extent to which bank market power alleviates SME credit constraints using a panel dataset of 118,000 SMEs across 20 European countries over the period 2005-2008. Their results firmly support the market power hypothesis, that increased market power results in increased financing constraints.
Wang, Han, & Huang (2019) state that bank competition boost credit availability for small and medium-sized enterprises. The firms experience higher levels of financing constraints, lack of access to finance, application rejection, discouragement, credit rationing and relatively high
dependence on internal funds for investment, in less competitive banking markets. This supports the market power hypothesis as well as the Structure-Conduct performance hypothesis, which represents an inverse relation between concentration and competition.
There are also negative effects of bank competition on SME credit availability. Ratti, Lee, & Seol (2008) find that highly concentrated banking sector give firms fewer financial constraints. Their study examines the effect of bank concentration on financing constraints of non-financial firms in 14 European countries between 1992 and 2005. They use firm-level data to analyse financial constraints with the Euler equation derived from the dynamic investment model. Their result is based on consideration of firm opacity, business cycle and firm size. These findings are consistent with the information-based hypothesis, which suggests that more market power boosts banks’ motivation to gather information on potential borrowers. Alvarez and Bertin (2016) also find evidence that banking competition increases financial constraints. This was studied using a sample of listed firms for six countries in Latin America.
Abubakr and Esposito (2012) also investigate the impact of bank concentration on firm financial constraints for a UK dataset over 2001-2009. They find that bank concentration relaxes financial constraints for firm level investments. These findings support the information-based hypothesis.
Because of the negative selection and moral hazard problem created by information asymmetries between banks and their borrowers, banks are encouraged to invest in monitoring and the acquisition of private information. Banks with more market power (i.e. lower competitive pressure) have more incentives to invest in information acquisition and build long-term relationships with their borrowers because they can better internalize the costs of these activities and because they are less likely to move borrowers to another bank (Petersen & Rajan, 1995). The information hypothesis therefore predicts that low competition (i.e. high market power) will increase access to credit, especially for opaque companies (SMEs) (Love & Peria, 2014). Reliable credit information can therefore serve as a substitute for bank-business relationships. Well-developed credit information sharing schemes reduce financing costs by making it less expensive for banks to obtain information about their borrowers. Credit information thus allows for better screening of borrowers and less negative selection (Petersen & Rajan, 1995).
Besides the information hypothesis, there are also other hypotheses that find a positive relation between bank concentration and access to finance. The efficient structure hypothesis claims that size matters for profits because they are scale dependent. The efficient structure
permits higher profits because banks are able to produce at a lower cost in comparison to their competitors (Berger A. N., 1995). This implies that banks became big because they are efficient due to scale advantages.
The two sides of studies provide contrasting conclusions. Some suggest that the relationship between bank market power and credit availability does not hold together, and others say that two contrasting hypotheses could coexist (Wang et al., 2019). Carbo-Valverde, Rodriguez-Fernandez, & Udell (2009) provide evidence that market power is negatively related to credit availability, but only when the Lerner Index is used. If the concentration ratio is used, an opposite conclusion is found.
1.4 Consolidation and banking competition
According to Love and Peria (2014), bank mergers generally reduce competition. Although bank mergers may generally be beneficial to borrowers because of lower interest rates, geographic overlap between the merging banks is large enough to significantly increase the concentration in banking markets.
Despite the high degree of integration of the banking sector between Eurozone countries, SMEs continue to rely heavily on domestic banks for their lending. SMEs tend to be very locally oriented and depend on loans from local banks, since most SMEs do not have access to debt financing from outside their region or outside their country (Hoffmann & Sorensen, 2015).
Small and medium-sized businesses also depend on local debt issuance. Most SMEs are often too small and transparent to borrow directly from the bond market or even borrow from banks in other countries or regions. Integrated banks operating in different countries operate internal capital markets, allowing them to allocate loans to the places where the demand for loans is greatest. This ensures that local businesses are able to obtain credit even when the national financial sector is in distress. Because integrated banks have a portfolio of loans that diversify across national borders, they are likely more willing to continue lending to companies in a recessionary country than banks with nationally concentrated portfolios (Hoffmann & Sorensen, 2015).
According to research by the European Commission, cross-border lending appears not to depend on mega-banks. Cross-border consolidation in the banking sector is needed to achieve true banking integration in Europe but is facing significant political headwind. Even though it has political headwind, cross-border consolidation still benefits over political pressure (Hoffmann & Sorensen, 2015).
We observe two trends in the consolidation wave of banks in Europe. This was predicted with the transition to the banking union. The first trend is cyclical, the European economy is recovering and the bank balance sheets in most EU countries are back in order. As a result, bankers are starting to plan again for the future. The second trend is structural, which consists out of an excessive dependence on the European banking system. A shift from the banking system to the capital markets is taking place. The share of financial intermediaries in the euro zone continues to rise (Langfield & Pagano, 2016).
Banks are consolidating to reduce overcapacity. Provided that withdrawal in the regulated and protected banking sector is virtually impossible, mergers and acquisitions are the most important mechanism for consolidating banks.
Craig and Hardee (2007) investigate how consolidation of the banking sector in large institutions is likely to lead to less credit for small businesses. As mentioned earlier, small businesses are the most likely to generate employment growth in the country. This is caused by financial resources, and since most of the lending to SMEs comes mainly from banks, institutional changes leading to less lending to SMEs are a potentially major economic problem. Using the Survey of Small businesses Finance (SSBF), they investigate how small businesses respond to loans from larger banks and non-bank lending. Using an empirical model to correct for random selection, large banks have been shown to lower the likelihood of obtaining credit for SMEs, this lower chance is not offset by an increase in total loans. Non-banking institutions seem to make up for part of this decline, but Craig and Hardee (2007) therefore conclude that large banks are lowering access to finance for SMEs. An important feature of their work is that they investigate the full spectrum of debts of alternative types of financial institutions. If small banks are absorbed by large institutions, the amount of credit availability to small businesses may decrease as a result of the consolidation (Craig & Hardee, 2007).
One of the reasons big banks are less likely to lend to small businesses, especially those in need of relationship credit, is that the big banks tend to rely on formulas to determine whether or not to lend the amount (Cole, Goldberg, & White, 2004).
Cole et al. (2004) investigated banks' credit practices and procedures. Small business lenders are generally more opaque than their larger brethren and are a major challenge for lenders. They used data from a survey among small businesses to analyse the micro-level differences in the credit acceptance processes of large and small banks. They believe that large banks (banks with $ 1 billion or more in assets) use stand-by criteria obtained from financial statements in the credit decision process, while small banks rely more on information about
the character of the borrower. These approaches are compatible with the incentives and the environment faced by large and small banks. The empirical study is based largely on data collected in response to concerns about the availability of credit to SMEs. It has been established that larger banks allocate smaller percentages of their assets to small businesses. Anecdotal evidence suggests that large banks use standardized quantitative criteria to assess small business loan applications, while smaller banks prefer qualitative criteria based on the personal interaction of their lenders with loan applicants (Cole, Goldberg, & White, 2004).
To the extent that small businesses are less able to comply with standardized quantitative criteria, they are less likely to receive credit from large banks. On the other hand, the reason for bank consolidation is cost savings, both through technological advancement and potential through greater risk differentiation. As these savings are passed on to the bubbling companies, small businesses may find themselves under bank consolidation (Mester, 1997).
Large banks have been able to compete effectively with smaller loans to small businesses, because the smaller loans are more subject to the credit score models that contribute to the cost savings of the consolidation (Berger, Frame, & Miller, 2005).
Smaller bank borrowers are more likely to lose a relationship with the consolidated bank. In addition, small borrowers find it more difficult to enter into a new credit relationship with consolidated banks. On the other hand, existing borrowers benefit from mergers in the form of lower loan rates. Small businesses are enjoying the highest drop-in interest rates. The most advantageous mergers from the borrower's point of view are those involving two major banks, although the fall in interest rates is more pronounced when the buyer and target overlap slightly on the market and thus have more opportunities to cut costs (Montoriol-Garriga, 2008).
The question still remains, however, whether such large bank strategies are sufficient to maintain the amount of total credit available to small businesses. Craig and Hardee (2007) interpret the evidence from their empirical model as suggesting that banking consolidation which results in a large share of banking assets held by the largest banks is likely to result in less access to credit by small business (Craig & Hardee, 2007).
What we have not yet come across in the literature is the effect of loans from nonresident banks on the access to finance in European countries. We examine whether or not access to finance changes when nonresident banks are active in a country. We try to discuss this using the effect of cross border mergers on the access to finance. Berger et al. (2001) tries to shed light on the impact of foreign banks by testing hypotheses about the effects of bank size, foreign bank ownership and bank distress in lending to informally opaque small businesses.
They use a new dataset on Argentine banks, companies and loans. Their results suggest that large and foreign institutions may have problems providing relational loans to opaque small businesses. Banking distress does not appear to have a greater effect on small borrowers than on larger borrowers, although even small businesses can respond to banking distress by borrowing from multiple banks. This increases costs, which results in relationship benefits that may be destroyed.
Consolidation of the banking sector creates larger banks that may be oriented towards lending transactions and capital market services to large corporate clients. International consolidation may exacerbate the problem of fewer customer relationships with SMEs by creating a distant owner operating from a completely different banking environment. These factors give rise to concerns about the impact of bank mergers and acquisitions, foreign entry and prudential supervision and regulation of the provision of relationship credit.
According to Berger et al. (2001), foreign owned banks are less likely to lend to informally opaque small businesses than domestic banks. Foreign banks are often large and almost always headquartered at a significant distance from local small businesses and may therefore experience size and distance-related disadvantages in providing services for relationships similar to those of large domestic owners. In addition, a foreign bank may be located in a headquartered office different market environment, with a different language, culture, supervision/regulation structure, and so on. These market differences can make it costly to collect and process locally based relationship information and aggregated information problems related to size and distance (Berger et al., 2001).
By doing cross-border mergers, diversification of the credit risk is promoted. Duijm & Schoenmaker (2017) state that cross-border mergers do not lead to a higher return, but to a reduction in credit risk for banks. This effect can be explained by a limited synchronization of
the business cycles in the EU.
Banks cannot fully reap the benefits of cross-border integration, since national regulators are still shielding liquidity and capital at national level, thereby limiting the benefits of the banking union (Darvas , Schoenmaker, & Veron, 2016).
A second synergy of cross-border mergers is the scaling up of technological innovation. Large banks invest heavily in new technologies, these are developed within the bank and can then be rolled out in their national and international activities (Duij & Schoenmaker, 2018).
Montoriol-Garriga (2008) find that after the peak in 1999, the value of European domestic banking transactions declined. Here we see that the value of European cross-border
transactions has increased year after year since 2003. There are some reasons why cross-border banking consolidation in Europe will increase in the coming years. The major players in some countries are unlikely to grow due to further domestic mergers and acquisitions as markets become increasingly concentrated. The European Commission has been focusing for some time on removing obstacles to cross-border banking consolidation in Europe. The enlargement of the European Union also increased these cross-border mergers and acquisitions. Mergers outside the market (cross-border) yield some efficiency gains, probably in the form of more risk spreading, which is passed on to borrowers. SMEs can be expected to benefit from more cross-border mergers and acquisitions (Montoriol-Garriga, 2008).
2 Part 2: Data, variables and model specification
2.1 Description of the dataset
Panel data is formed based on data from SMEs and banks in Europe. Our data is obtained from the Survey on the Access to Finance of Enterprises (SAFE) from the European commission for SME-based variables and data from the World Bank Global Financial Development Database (GFDD) for bank-based variables. From the SAFE we obtain measures of access to finance and from the World Bank GFDD we obtain our mean measure of bank competition, namely bank concentration and other bank related variables.
Our sample period covers 2013-2017. The sample is restricted to EU28 data, excluding Malta (Austria, Belgium, Bulgaria, Croatia, Cyprus, Czech Republic, Denmark, Germany, Estonia, Finland, France, Greece, Hungary, Ireland, Italy, Latvia, Lithuania, Luxemburg, The Netherlands, Poland, Portugal, Romania, Slovenia, Slovakia, Spain and Sweden, United Kingdom).
SAFE
To obtain the variables that measure access to finance, we took yearly surveys (SAFE) from 2013 through 2017 from the European commission and merged them to one dataset. The survey on access to finance provides evidence on changes in the financial situation of SMEs for EU countries. We pick out four meaningful responses from different difficulties that SMEs have to provide us a way to quantify access to finance. We use the following measures of access to finance: ‘the willingness to provide a bank loan improved’, ‘availability of bank loan (new or renewal; excluding overdraft and credit lines) improved’, ‘level of interest rates was increased by the bank’ and ‘access to finance as most pressing problem the firm is facing’ as dependent variables.
The variable ‘willingness to provide a bank loan improved’ shows the improvement SMEs experience in the willingness of banks to provide a loan over the past 6 months. The same question is asked in the survey for the availability of bank loans (new or renewal; excluding overdraft and credit lines) improved’ and ‘the level of interest rates improved’, which provides us with two more variables to measure access to finance. The last dependent variable, access to finance as the most pressing problem the firm is facing, comes from the question that asks what the most pressing problem the firm is currently facing.
GFDD
We use World Bank GFDD data to obtain independent variables to measure which bank variables effect access to finance. The Global Financial Development Database is a broad dataset of financial system characteristics for 214 economies. It consists of yearly data starting from 1960 and measures depth, access, efficiency and stability of financial systems. In this database we only consider data for our sample period and sample dataset. We take 5 independent variables from this dataset to measure these effects on the access to finance.
Our main interested independent variable bank concentration is used to proxy bank competition. Simplicity and limited data requirements make the concentration ratio one of the most frequently used measures of concentration in the empirical literature (Leon, 2014). Leon (2014), states that the literature on the measurement of competition is generally categorized in two major categories, namely the structural and non-structural approaches. The structural approach has three different measures; the number of firms, the concentration ratio and the Herfindahl-Hirschman index (HHI). Non-structural measures in banking that can be used are the Lerner index, the conjectural variation model, the Panzar-Rosse model and the Boone Indicator. Ergungor (2004) states that the use of the concentration ratio may proxy market condition rather than market power and according to Leon (2015) bank concentration is not a robust predictor of a firm’s access to finance. While some researchers may prefer one measure over another, there is no accord regarding the best way to measure competition. The different indicators of banking market competition do not provide the same inferences about competition (Carbo-Valverde, Rodriguez-Fernandez, & Udell, 2009). Even though the concentration ratio receives criticism from Ergungor (2004), we use the concentration ratio because the GFDD provides a complete dataset for our sample.
Other independent variables were obtained from the World Bank GFDD such as ‘loans from nonresident banks to GDP’. This variable represents the ratio of outstanding offshore bank loans to GDP. An offshore bank is a bank located outside the country of residence of the depositor, typically in a low tax jurisdiction that provides financial and legal advantages. We want to test whether this has an effect on the access to finance of SMEs.
In the database we found three other independent variables that we use as control variables. The ‘bank net interest margin’ is the ratio between the book value of the bank's net interest income and the average retaining assets. The second control variable is ‘bank z-score’ which represents the buffer of the commercial banking system compared to the volatility of that return. The last control variable is ‘bank regulatory capital to risk-weighted assets’, which is a ratio of total regulatory capital to its assets held, weighted according to risk of those assets.
We include these control variables in our research because they influence the dependent variables. These variables are also related to the independent variables. Omitting the control variables from the research would result in less accurate research.
2.2 Variables
To provide quantitative and qualitative insight in the used variables, the variables are explained in the next section. The overall averages, minima and maxima are found in the summary statistics in table 2. The averages, minima and maxima per country over the period 2013-2017 are found in table 3. First, the dependent variables are explained and secondly the independent variables.
2.2.1 Dependent variables
Willingness to provide a loan improved
This variable measures the experience that SMEs perceive about the improvement of willingness of banks to provide a loan. It is used to measure access to finance. In the SAFE questionnaire, 23,74% SMEs answered that they find that the willingness to provide loans improved in the last 6 months. In table 3, we find that Greece experiences the least improvement (12,6%), while 38,60% of Bulgarian SMEs find that the willingness to provide loans to firms improved.
Availability of Bank loan (new or renewal; excluding overdraft and credit lines) improved
The second variable that measures access to finance is ‘the availability of bank loans improved’. This dependent variable represents the percentage of SMEs that find that the availability of bank loans improved for the past 6 months. The summary statistics in table 2 show that 16,81% of the firms in our dataset over the period 2013-2017 find that the availability of the bank loans improved over the past 6 months. Table 3 shows that Greece has the least favourable experience in improvement of the availability of bank loans (8,8%), while 27,4% of SMEs in Spain find that the availability improved over the period 2013-2017.
Level of interest rates was increased by the bank
The third measure of access to finance is ‘the level of interest rates was increased by the bank’. This variable shows the percentage of SMEs that think the level of interest rate was increased by the bank the past 6 months. On average, 18,45% of the firms in our dataset find that the interest rates were increased. In Bulgaria, only 6,6% of the firms experienced an
increase in the interest rate the past half year over the period 2031-2017. In contrast, a high percentage is perceived in Greece and Italy, 33,60% and 33,80% respectively.
Access to finance as most pressing problem the firm is facing
Our last dependent variable that measures access to finance is the percentage of SMEs that experience access to finance the most pressing problem they are facing. On average, from 2013-2017, 12,26% of the SMEs in our dataset find that access to finance is the most pressing problem in their firm. 6,60% of the SMEs in Luxembourg find that access to finance is the most pressing problem, while in Cyprus 30,00% of the SMEs experience this as the most pressing problem.
2.2.2 Independent variables
Bank concentration
Bank concentration is seen as the ratio between the assets of the 3 largest commercial banks and the total commercial banking assets. In our sample, Luxembourg finds the lowest average of 36,53%, which is intuitively normal since Luxembourg has a very active banking market. In contrast, Sweden averages at 91,60%, which represents a very concentrated banking market. The studied sample averages the concentration ratio at 67,67% over the period 2013-2017.
Loans from nonresident banks (amount outstanding) to GDP
Loans from nonresident banks (amounts outstanding) to GDP (%) is the ratio of net offshore bank loans to GDP. An offshore bank is a bank located outside the country of residence of the depositor, typically in a low tax jurisdiction (or tax haven) that provides financial and legal advantages. Estonia has the lowest percentage loans from nonresident banks to GDP (6,27%) over the period 2013-2017. On the other hand, Luxembourg indicates to have 252,79% loans from nonresident banks to GDP percentage. The high sample average of 57,48% is partly due to the high percentage in Luxembourg, the Netherlands (153,01%) and Ireland (119,61%).
Bank net interest margin
Our first control variable is the ratio between the book value of the bank's net interest income
and the average retaining assets.
Delis and Kouretas (2010) investigate 18000 annual observations in the euro banking area, over the period 2001-2008. They find that low interest margins lead to higher bank risk-taking. In our sample, we find an average bank net interest margin of 2,05%. Finland has the lowest bank net interest margin in our 2013-2017 sample at 0,72%. On the other hand, Cyprus has the highest bank net interest margin in the dataset (3,72%).
Bank z-score
The second control variable is reflected in the probability of default of a country's commercial banking system. The z-score is a widely used accounting-based measure of bank distance to default. A high value of z-score represents greater banking stability, while a lower score indicates instability. Chiaramonte, Liu, Poli, & Zhou (2016) find that using the U.S commercial banks’ data from the period 2004-2014, the Z-score can predict 76% of bank failure. Z-score compares the buffer of a country's banking system (capitalization and returns) with the volatility of those returns. It is estimated as (ROA+(equity/assets))/sd(ROA). sd(ROA) is the standard deviation of ROA.
Luxembourg represents banking stability with a percentage of 41,85. In contrary, Slovenia had the lowest z-score of the sample (3,88%) from 2013 through 2017. The average score of banking stability lays at 13,22%.
Bank regulatory capital to risk-weighted assets
The last control variable we use is the ratio of the total regulatory capital to the assets held by the bank, weighted by the risk of those assets. It represents a capital buffer to counter risks. Portugal has the lowest regulatory capital to risk-weighted assets ratio (12,93%), while Estonia stands out with the highest buffer of 28,94%. The average of the studied sample lays at 18,95%.
Table 2: Summary statistics: averages per country for the period 2013-2017
Variables Mean Median S.D. Min Max Obs.
Dependent Variables Willingness to provide a
loan improved 0,2374 0,23 0,0944 0 0,46 135
Availability of Bank loan (new or renewal; excluding overdraft and credit lines) improved
0,1681 0,17 0,0728 0,01 0,38 135
Level of interest rates was
increased by the bank 0,1845 0,15 0,1263 0 0,67 134
Access to finance as most pressing problem the firm is facing
0,1226 0,1 0,0679 0,05 0,45 135
Independent variables
Bank concentration 0,6767 0,6653 0,1553 0,3211 0,9417 135
Loans from nonresident
banks (amount
outstanding) to GDP
0,5748 0,4741 0,5407 0,0482 3,685 135
Control variables
Bank net interest margin 0,0205 0,0185 0,0105 0,0033 0,0456 135
Bank z-score 0,1322 0,1051 0,0821 0,0341 0,4757 134
Bank regulatory capital to
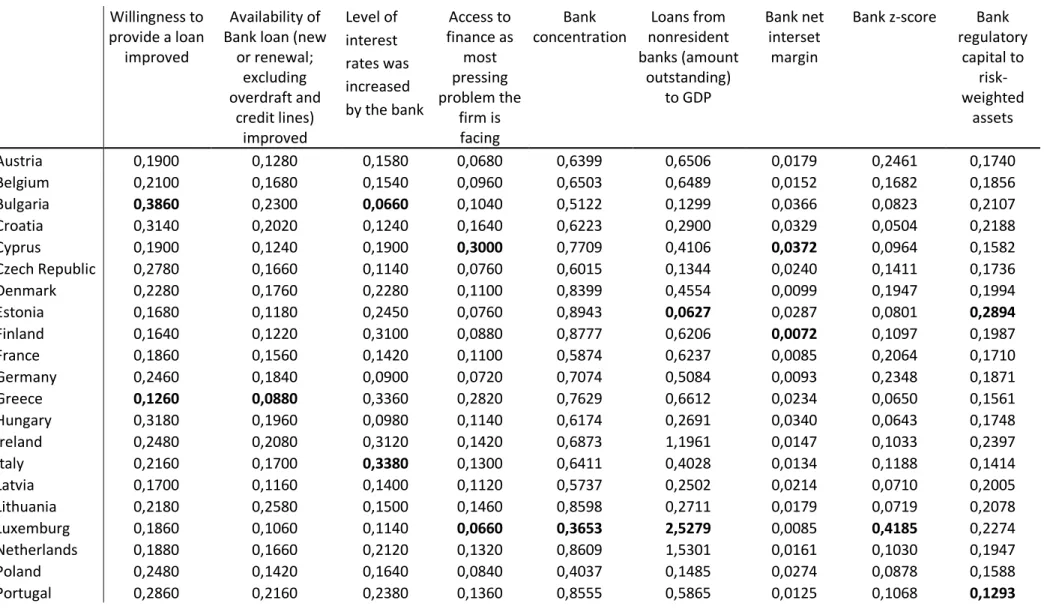
Table 3: The averages, minima and maxima per country for period 2013-2017 Willingness to provide a loan improved Availability of Bank loan (new
or renewal; excluding overdraft and credit lines) improved Level of interest rates was increased by the bank Access to finance as most pressing problem the firm is facing Bank concentration Loans from nonresident banks (amount outstanding) to GDP Bank net interset margin
Bank z-score Bank regulatory capital to risk-weighted assets Austria 0,1900 0,1280 0,1580 0,0680 0,6399 0,6506 0,0179 0,2461 0,1740 Belgium 0,2100 0,1680 0,1540 0,0960 0,6503 0,6489 0,0152 0,1682 0,1856 Bulgaria 0,3860 0,2300 0,0660 0,1040 0,5122 0,1299 0,0366 0,0823 0,2107 Croatia 0,3140 0,2020 0,1240 0,1640 0,6223 0,2900 0,0329 0,0504 0,2188 Cyprus 0,1900 0,1240 0,1900 0,3000 0,7709 0,4106 0,0372 0,0964 0,1582 Czech Republic 0,2780 0,1660 0,1140 0,0760 0,6015 0,1344 0,0240 0,1411 0,1736 Denmark 0,2280 0,1760 0,2280 0,1100 0,8399 0,4554 0,0099 0,1947 0,1994 Estonia 0,1680 0,1180 0,2450 0,0760 0,8943 0,0627 0,0287 0,0801 0,2894 Finland 0,1640 0,1220 0,3100 0,0880 0,8777 0,6206 0,0072 0,1097 0,1987 France 0,1860 0,1560 0,1420 0,1100 0,5874 0,6237 0,0085 0,2064 0,1710 Germany 0,2460 0,1840 0,0900 0,0720 0,7074 0,5084 0,0093 0,2348 0,1871 Greece 0,1260 0,0880 0,3360 0,2820 0,7629 0,6612 0,0234 0,0650 0,1561 Hungary 0,3180 0,1960 0,0980 0,1140 0,6174 0,2691 0,0340 0,0643 0,1748 Ireland 0,2480 0,2080 0,3120 0,1420 0,6873 1,1961 0,0147 0,1033 0,2397 Italy 0,2160 0,1700 0,3380 0,1300 0,6411 0,4028 0,0134 0,1188 0,1414 Latvia 0,1700 0,1160 0,1400 0,1120 0,5737 0,2502 0,0214 0,0710 0,2005 Lithuania 0,2180 0,2580 0,1500 0,1460 0,8598 0,2711 0,0179 0,0719 0,2078 Luxemburg 0,1860 0,1060 0,1140 0,0660 0,3653 2,5279 0,0085 0,4185 0,2274 Netherlands 0,1880 0,1660 0,2120 0,1320 0,8609 1,5301 0,0161 0,1030 0,1947 Poland 0,2480 0,1420 0,1640 0,0840 0,4037 0,1485 0,0274 0,0878 0,1588 Portugal 0,2860 0,2160 0,2380 0,1360 0,8555 0,5865 0,0125 0,1068 0,1293
Romania 0,3060 0,1560 0,1040 0,1160 0,5868 0,0992 0,0363 0,0597 0,1837 Slovak Rep. 0,2960 0,1840 0,1020 0,0900 0,7402 0,1837 0,0311 0,1805 0,1768 Slovenia 0,2620 0,1720 0,2620 0,1620 0,5631 0,3156 0,0224 0,0388 0,1752 Spain 0,3620 0,2740 0,2960 0,1340 0,6186 0,7485 0,0156 0,2053 0,1440 Sweden 0,2020 0,1660 0,1240 0,1040 0,9160 0,8700 0,0136 0,1399 0,2238 UK 0,2180 0,1480 0,1820 0,0960 0,5151 0,9242 0,0184 0,1051 0,1934 Minimum 0,1260 0,0880 0,0660 0,0660 0,3653 0,0627 0,0072 0,0388 0,1293 Maximum 0,3860 0,2740 0,3380 0,3000 0,9160 2,5279 0,0372 0,4185 0,2894
2.2.3
Correlation matrix
The correlation matrix in table 4 shows us that there is no multicollinearity in our sample. From this table, we can already outline our first expectations. Later on in the paper, we will examine the effects of the different independent variables on the dependent variables.
First, we can expect that there will be a positive relationship between the independent variable ‘bank concentration’ and the dependent variable ‘access to finance’, ‘availability to provide a loan improved’ and ‘level of interest rate increased’. We expect a negative effect on the dependent variable ‘willingness to provide a loan increased’.
Secondly, we expect a negative relation between the independent variable ‘loans from nonresident banks to GDP’ and the dependent variables ‘access to finance as the most pressing problem’, ‘the willingness to provide a loan improved’ and ‘the availability of a bank loan improved’. On the other hand, it has a positive effect on the dependent variable ‘level of interest rate increased’.
Furthermore, we expect a positive effect of the independent variable ‘interest margin’ on all dependent variables, except for the dependent variable ‘level of interest rate increased’.
The correlation matrix also shows that the bank z-score has a negative effect on all dependent variables. In other words, when the bank z-score falls, we expect an increase in access to finance.
Finally, the matrix shows a positive effect between the independent variable ‘regulatory capital’ and ‘the willingness to provide a loan improved’ and ‘the availability of a bank loan improved’. On the other hand, we expect a negative relation on the independent variables ‘access to finance’ and ‘the level of interest rates increased’.
Table 4: Correlation matrix Access to finance Willingness to provide a loan improved Availability of a bank loan improved Level of interest rate increased Bank concentrati on Loan from nonresident banks to GDP Interest margin Bank z-score Regulatory capital 1,00 -0,39 -0,35 0,49 0,13 -0,04 0,17 -0,37 -0,34 Access to finance as
the most pressing problem 1,00 0,83 -0,54 -0,15 -0,22 0,30 -0,03 0,05 Willingness to provide a loan improved 1,00 -0,46 0,09 -0,14 0,04 -0,03 0,11 Availability of a bank loan improved
1,00 0,18 0,14 -0,24 -0,16 -0,23 Level of interest rate
increased 1,00 -0,11 -0,15 -0,25 0,15 Bank concentration 1,00 -0,48 0,61 0,15 Loans from nonresident banks 1,00 -0,47 0,03 Interest margin 1,00 0,04 Bank z-score
2.3
Regressions
Y = 𝞪 + 𝞫1* Bank concentration + 𝞫2* Loans from nonresident banks + 𝞫3* Interest margin + 𝞫4* Bank z-score + 𝞫5 * Regulatory capital
We use a simple multiple regression to identify the relations. Our dataset consists panel data, so we use specific tests to see which model gives us the most correct results. For the 4 regressions we check which model is the best.
We look at whether or not the regression has a common intercept. We do this as follows:
H0: µ1 = . . . = µN H1: µ1 ≠ . . . ≠ µN
When we accept the null hypothesis, it means that the regression has a common intercept (p-value is greater than 0.05). When there is a common intercept, we assume that a pooled model is more correct than a fixed effects model, and vice versa. When a pooled model is better than a fixed effects model, it means the different alphas have the same regression lines. If one does not have a common intercept and ignores this problem, we obtain biased alphas and betas.
Secondly, we check whether we prefer pooled model over random fixed model. For this we use the Breusch-Pagan test:
H0: σ²e = 0 H1: σ²e ≠ 0
If we do not reject the null hypothesis (p-value greater than 0.05), we can conclude that the individual effects in a random effect model show no dispersion, i.e. they are all the same. When this is the case, we prefer the pooled model to the random effects model. The reverse is also true when we don't accept the null hypothesis, i.e. the p-value is smaller than 0.05, we prefer the random effects model to the pooled model and thus the individual effects show dispersion.
Finally (if necessary) we look at whether the fixed effects model is the most correct or the random effects model. We do this using the Hausman test:
H0: Cov(xit, ωit) = 0 → We prefer the random effects model H1: Cov(xit, ωit) ≠ 0 → We prefer the fixed effects model
Model 1: Fixed effect
Willingness to provide a loan = -0.37 + 0.36* Bank concentration - 0.08*Loans from nonresident banks + 1.52*Interest margin + 2.03*Bank z-score + 0.59* Regulatory capital
Model 2: Fixed effect
Availability of bank loan improved = -0.26 + 0.24* Bank concentration - 0.08*Loans from nonresident banks + 0.41*Interest margin + 1.31*Bank z-score + 0.68* Regulatory capital
Model 3: Fixed effect
Level of interest rates was increased by the bank = 0.64 - 0.14* Bank concentration + 0.21*Loans from nonresident banks + 0.22*Interest margin - 2.08*Bank z-score - 1.21* Regulatory capital
Model 4: Fixed effect
Access to finance as most pressing problem the firm is facing = 0.43 - 0.16* Bank concentration + 0.05*Loans from nonresident banks - 1.64*Interest margin - 0.79*Bank z-score - 0.47* Regulatory capital
3 Part 3: Results
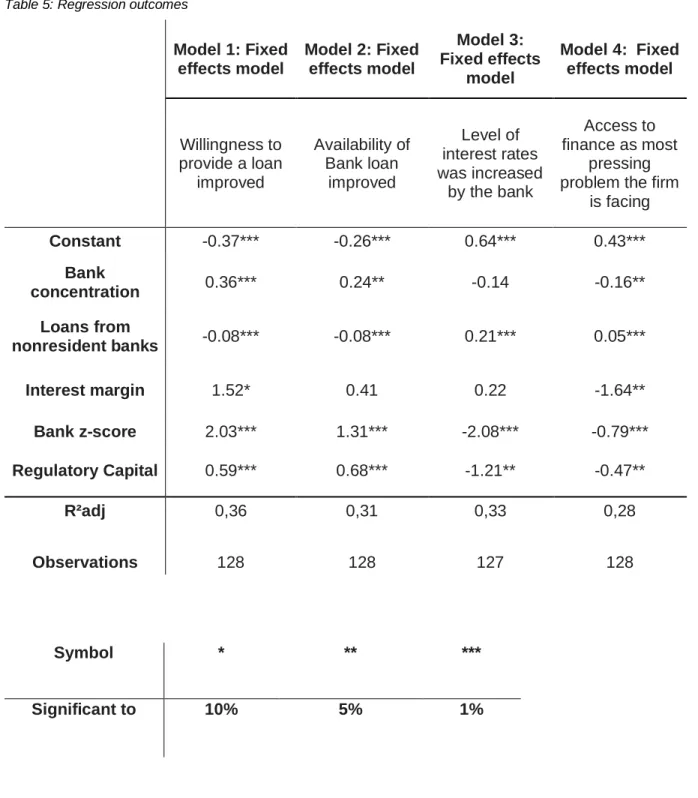
To study the financial impact on access to finance, four models are examined that represent a way of access to finance. We present our baseline results in table 5.
Our main interested variable bank concentration, which we use as a proxy of bank competition confirms a positive relation to access to finance. This intuitively concludes that the less competitive banks are, the more access to finance SMEs find. We find a strong significant relationship between bank concentration and the willingness to provide a loan (model 1). A 1% increase in bank concentration leads to an increase in the willingness to provide a loan by 0,36%. There is a less significant relationship (at a significance level of 5%) between the bank concentration and the availability of a loan improved (model 2). When bank concentration increases with 1%, we see an increase of 0.24% in the availability of a loan. We find a negative significant effect on the variable access to finance as most pressing problem (model 4). An increase in bank concentration by 1% reduces the access to finance as most pressing problem by 0.16%. Furthermore, we see no significant effect of bank concentration on the level of interest rate (model 3).
Above results conclude that a large concentration of banks increases the willingness to provide a loan and the availability of a bank loan. It is important to note that fewer SMEs see access to finance as the biggest problem when bank concentration increases. Since more bank concentration means less banking competition, we find that more concentration, and thus less competition, will improve the situation for SMEs to obtain credit as a way of access to finance. Petersen and Rajan (1995) find a similar conclusion with the concentration ratio as a measure of competition. The result is also in line with the information hypothesis, which argues that in the presence of information asymmetries and agency costs, bank competition can reduce access to finance by making it more difficult for banks to internalize the costs of investing in building customer lending relationships. Research by Carbo-Valverde et al. (2009) proved that market power is negatively related to credit availability, but only when the Lerner Index is used. When the concentration ratio is used, an opposite conclusion is found.
We find a significant relation between loans from nonresident banks and access to finance. An increase in loans from nonresident banks by 1% is associated with a decrease in the willingness of a bank to provide a loan and the availability to provide a loan by both 0.8%. This means that competing nonresident banks are a negative factor for the access to finance of SMEs. A positive significant effect is found in model 3 and 4. When the amount of loans from nonresident banks increase by 1%, the level of interest rate and access to finance as the most pressing problem the firm is facing increase by 0.21% and 0.05% respectively, which also results in a negative outcome for the access to finance.