Limits to warming
This evaluation has been prepared by BertJan Heij, with contributions from Bart Stren-gers, Bas Eickhout, Jelle van Minnen and Marcel Berk. Thanks go out to Bert Metz, Joop Oude Lohuis, Jan Verhagen (WUR), Gerbrand Komen (KNMI) and Rob van Dorland (KNMI) for their comments on the contents.
Original title: Hoeveel warmer mag het worden? (April 2005) English translation: Ian Priestnall (¶aragraph Services)
Editorial advisor: Baud Schoenmaeckers (Synergos Communications) Language editing: Ruth de Wijs (MNP)
Layout: Studio RIVM August 2005
Contents
Synthesis 5I Introduction 9
II Effects of climate change 13
1 Introduction 13
2 Effects of gradual temperature change 13 2.1 Global and European effects 13
2.2 Changes in extreme temperatures as a result of gradual climate change 19 2.3 Sea level rise 21
3 Changes in the climate system initiated by gradual climate change 23 3.1 Amplified effect on the Arctic 23
3.2 Melting of the great ice sheets 25 3.3 The thermohaline circulation 27 4 Effects on the Netherlands 30 References 32
Synthesis
The choice of a temperature target in the context of Article 2 of the UN Climate Conven-tion requires scientific informaConven-tion on the consequences and risks of a variety of opConven-tions to achieve this target, as well as consideration of the interests involved, as set out in Chapter 1. The evaluation presented here is limited to the scientific information on the effects of climate change important to such a consideration. Furthermore, this evalu-ation deals solely with the effects of climate change as such, and not with the related costs, neither of damage, nor mitigation or adaptation measures.
As far as ecosystems are concerned, the effects increase with increasing warming, and there seems to be no threshold effect. If the gradual temperature increase remains limi-ted to 1ºCelsius (C) since the end of the pre-industrial era, the effects on ecosystems will remain limited, but serious effects on highly vulnerable ecosystems (such as coral reefs) cannot be ruled out. An increase in the global mean temperature of around 1ºC would probably lead to large-scale bleaching of coral reefs. If it is decided that no valuable ecosystems of substantial size may be lost, we will arrive at a gradual increase in the range of 1–2ºC. If warming increases beyond 2ºC, the risks will increase further. This means that a large number of species would become threatened with extinction, that biodiversity in protected areas would decline or that entire ecosystems would dis-integrate.
In terms of food production, a global temperature increase of 3–4ºC would not be expected to lead to a global loss of food production, but there is a significant regional risk of pro-ductivity losses from as little as a 1ºC increase. This could lead to an increase in the number of people suffering from food shortages. The effects of climate change on food produc-tion will highly depend on the ability to adapt, by means of crop selecproduc-tion, (bio )techno-logy, possible relocation of the agricultural infrastructure etc. It is uncertain whether sufficient possibilities exist to do so. If the political will is to have no significant regional risks of (additional) food shortages, we will arrive at a figure that must stay below 2ºC. The slow response of the oceans to the increasing surface temperature as a result of increasing concentrations of greenhouse gases means that part of the sea level rise can no longer be avoided either in this century or thereafter. Scientific uncertainties about the relationship between increasing temperature and the magnitude of future sea level rise mean that this is still difficult to quantify. The possibly larger contributions to sea level rise from the melting of the Greenland and West-Antarctic ice sheets, both this century and in the very long term (post-2100), increase this uncertainty. Still, very little is known about these melting processes.
If it is decided to limit the risks of sea-level rise over the very long term (after 2100) by preventing the irreversible melting of the Greenland ice sheet, it would be desirable to limit the mean temperature rise to 1–2ºC.
If it is decided to limit the effect of global average warming over the Arctic to prevent the loss of sea ice in summer, global mean warming of, at most, 2ºC must be main-tained. This degree of warming would translate to an increase of 4–8ºC in the Arctic. It is currently difficult to indicate the global mean temperature ranges above which the risk of a shutdown of the thermohaline circulation will be high. Provisionally, it appears that this will only happen with a temperature increase of more than 4–5ºC. However, present measurements already reveal a weakening of the North Atlantic Circulation, while a number of scenarios arrive at this temperature rise at the end of the present century. So, this is a point of particular attention.
Compared with the last IPCC report (2001), more is now known about a number of effects of climate change and several risks are now assessed as being more serious, as outlined below.
• The latest literature studies reveal that a number of vulnerable ecosystems, such as coral reefs and marine ecosystems, are already experiencing the influence of climate change.
• The IPCC report had already pointed out the risks associated with the melting of the Greenland ice sheet if the local temperature were to rise by more than 2.7ºC, stating that this would probably be irreversible. Since then there have been indications that the West-Antarctic and Greenland ice sheets may melt faster than had originally been supposed and may contribute considerably to global sea level rise even in the present century.
• The effect of global mean temperature rise appears to be amplified in the Arctic, which has consequences – not just for the local population, but also globally – due to the higher contribution to sea level rise (by melting of the Greenland ice sheet) and the possible release of methane caused by melting permafrost.
• The 2001 IPCC report stated that global warming may play a role in weakening or possibly even a shutdown of the thermohaline circulation. More certainty about this risk has now been obtained, as revealed by the fact that recent literature contains statements about the risk.
LIMITS TO WARMING
The results set out above are based on an extensive analysis of the literature since the last IPCC report (2001). It is striking to note that few of these studies pay attention to the consequences of an accumulation of stress factors. Moreover, many studies take little or no notice of adaptive capacity, which might lessen the adverse impact of climate change. This implies that the risks of climate change may be either underestimated or overestimated. The IPCC’s Fourth Assessment Report, due to appear in 2007, will present current knowledge on all the effects of climate change. The present evaluation should be regarded as an interim balance in this context, responding to the need of the Dutch Parliamentary Committee for Housing, Spatial Planning and the Environment for up to date information on climate impacts in the context of the 2º target discussions.
IIa IIb I III IV V 5 4 3 2 1 G lo ba la ve ra ge te m pe ra tu re ris e (º C )
Green: positive effects Yellow: limited negative effects Red: large negative effects Risk categories:
I ecosystems
II food production (IIa: global; IIb: regional)
III sea level rise (especially irreversible melting of the Greenland ice sheet)
IV loss of Arctic sea ice
V collapse of the thermohaline circulation
I.
Introduction
Article 2 of the UN Framework Convention on Climate Change (UNFCCC) states that dangerous anthropogenic interference with the climate system must be prevented by stabilising the concentration of greenhouse gases in the atmosphere. The stabilisation level and the time-frame required to achieve it must fulfil the following conditions: • ecosystems must be able to adapt naturally;
• food production may not be threatened and
• the economy must be able to develop in a sustainable manner.
Both the scientific and the political aspects of these objectives are still under debate. Ful-filling the Climate Convention objectives requires insight into the way the climate sys-tem works and the consequences of climate change, but also demands that choices be made. Decisions about what constitute acceptable risks are inherently normative. They therefore require political assessments and choices, involving the following:
• Whether human activities result in dangerous interference is determined by the nature and degree of the impacts of climate change and what is thought to be accep-table in that context. Relevant here is the present adaptability of ecosystems and sec-tors of society, as well as how and at what cost this adaptability can be increased. The question of how climate change may be reduced by limiting emissions, and at what cost, is also relevant.
• The consequences of climate change are evident on all scales, including national and local ones. Furthermore, the global nature of the problem demands international decision making. Any assessment of national, short-term interests must take account of the risks to other countries and regions, as well as to future generations. However, it is not the role of science to make such judgements. For this reason, these risks will not be dealt with further in this evaluation, which is limited to presenting the impor-tant scientific information needed in making such judgements. It is imporimpor-tant to note, here, that scientific insights can change, too.
In 1991 the Government of the Netherlands already presented the following normative
basis for its climate policy in response to Article 2 of the UN Climate Convention
(re-confirmed in a follow-up document: ‘Uitvoeringsnota Klimaatbeleid, 1999’): • the global mean temperature may rise by, at most, 2ºC above the pre-industrial level; • the rate of temperature increase must remain at less than 0.1ºC per decade;
• the world mean sea level rise may ultimately be no more than 50 cm.
In 1996 the EU also opted for the 2ºC target. This choice was re-confirmed at the council meeting of EU environment ministers in December 2004 in the light of the most recent scientific knowledge. At the same time scientific uncertainty was observed with respect to the translation of the 2ºC temperature rise into greenhouse gas concentrations and the options for necessary emission reductions (emission pathways).
On 8 November 2004, during the round table talks with the Dutch Parliamentary Com-mittee for Housing, Spatial Planning and the Environment, questions arose about the 2º target. Is it too ambitious, is it sufficient, or is it inadequate to realise the basic princip-les of Article 2 of the Climate Convention? The Netherlands Environmental Assessment Agency (MNP) took the initiative in evaluating the status of scientific knowledge on the effects of climate change in the light of this 2º target, with the goal of supporting the political process in setting an objective that is in accordance with the principles of Article 2. The effects of climate change were examined in this context, using as indicator the global mean temperature increase since the pre-industrial era.
This evaluation is not just concerned with the effects of gradual warming due to in-creasing greenhouse gas concentrations in the atmosphere but also with a number of risk factors in the climate system that may disturb the pattern of gradual warming and their possible effects. Important are risks related to natural variability (which are not dealt with further here). The last IPCC Report (Third Assessment Report – TAR) dates from 2001. Since then, a great deal of research has been done and greater insight has been obtained into a number of effects of climate change.
The goal of the evaluation then is to briefly outline the current scientific status of a number of major impacts of global warming. The evaluation thus represents an update of the knowledge contained in the last IPCC Report, which can serve as the context for an evaluation of the 2º target. It should be regarded as an interim balance in this context, responding to the need of the Dutch Parliamentary Committee for Housing, Spatial Planning and the Environment for up to date information on climate impacts in the context of the 2º target discussions.
The translation of temperature increase into concentration targets is not dealt with in detail, nor is the relationship between emissions and concentrations. Recent knowledge on this topic is summarised in Box 1.
LIMITS TO WARMING
The climate’s sensitivity is expressed in terms of the global mean increase of (surface) temperature (in degrees Celsius) resulting from a doubling of CO2(equivalent) concentration in the atmosphere compared to the pre-industrial level, i.e. approximately 550 ppmv. The actual climate sensitivity value is uncertain. The most significant reasons for this uncertainty have to do with our current poor understanding of the effect of increasing greenhouse gas concentrations on cloud formation. An increase in the concentration of greenhouse gases also leads to more water vapour in the atmosphere, which in itself also has a greenhouse effect. However, this effect highly depends on the level of water vapour increase, and whether this increase occurs in the clouds or outside them. Furthermore, the effect of clouds on the climate can change due to changes in the geographic distribution; the effect depends on the type of cloud cover, the amount of water that the clouds contain, the mean size of droplets and ice crystals, etc. Lastly, it is not really possible to use historical temperature observations to give a statistical indication of the range of the climate’s sensitivity, partly because of the ‘global dimming’ effect (the tempering influence of aerosols on past tempera-tures (Stainforth et al., 2005)).
The IPCC has adopted a probability range for the climate’s sensitivity between 1.5 and 4.5, with 2.5 as the median estimate. Based on this median estimate, a stabilisation of greenhouse gas concentrations at 550 ppmv would lead to an ultimate temperature increase of nearly 2.5ºC. If we are to stay under 2ºC, the concentration must be stabilised at a level below 550 ppmv. Since the last IPCC Report (2001a), a number of new studies have appeared that have used a variety of approaches to construct pro-bability density functions for the climate sensitivity value. Murphy et al., 2004, for example, assumes a 90% proba-bility that the sensitivity value is found between 2 and 4,
with 3 being the most likely value. There are other estimates, however, as the accompanying figure shows. The functions show the range of possible climate sensi-tivity values to be greater than the IPCC range and, moreover, that higher climate sensitivity values are more probable. The probability that the climate sensitivity has a maximum value of 2.5 is therefore reduced. The Wigley and Raper log-normal distribution corresponds to the IPCC range of 1.5–4.5 (90% confidence interval) with a most likely value of 2.5.
These new estimates led Hare and Meinshausen (2004) and Den Elzen and Meinshausen (2005) to explore the implications of the limitation of global temperature rise to 2ºC, which is the EU target value. They came to the following conclusions:
• It is improbable that emission pathways leading to a stabilisation at 550 ppmv CO2equivalent are sufficient to achieve the 2ºC target.
• If this target is to be achieved with a greater than 50% confidence level, the greenhouse gas concentrations must be stabilised at 450 ppmv CO2equivalent or less. • This requires the global emissions to reach their
maximum level before 2020, followed by reductions in 2050 in the order of 30–50%, compared with the 1990 level.
If it is not assumed that greenhouse gas concentrations remain stable, but that the maximum concentrations are followed by a progressive decline, we can avoid some of the warming that would ultimately have occurred. This implies that the levels at which concentrations reach their maximum can temporarily be higher than the indicated stabilisation values.
Box 1. New insights into climate sensitivity: implications for the concentrations and emissions of greenhouse gases
Probability density functions for climate sensitivity
Scope of the evaluation
The main theme of this evaluation centres on the effects and possible risks of a range of temperature increases based on the IPCC’s 2001 report, and represents an assess-ment of the most recent publications in this area. The information is presented in the form of possible developments, in other words, what may be expected, given a certain global temperature rise above the pre-industrial level (1750). This is based on current climate conditions and is independent of other factors, such as wars or natural disasters.
The evaluation has been delimited as such
• Global mean temperature has been chosen as the general climate indicator, in the knowledge that climate change embraces more than temperature change alone. Precipitation patterns, for example, will also change. The models that produ-ced the results used in this study take account of all significant climate parameters. Viewed from the perspective of climate policy, greenhouse gas concentrations and global mean temperature rise are the common factors around which world-wide agreements could be made. Temperature increase is closer to the effects of climate change than concentration. Since the political goals make specific mention of tem-perature, the considerations in this evaluation are also linked to temperature.
• Only the consequences of temperature change are treated here, and not the consequences of the rate of temperature increase. This rate may well be important in achieving the 2º objective in 2100, but too few relevant studies are available. • The evaluation looks at the risks of a global mean temperature increase from 0.7
(pre-industrial level up to the present, according to the UK Met Office, 2004) to 5.8ºC (the upper limit of the range given by the IPCC for the year 2100). The emphasis is on the range of 2–3ºC, since most information is available for this range.
• No specific attention is paid to the uncertainties attached to the expected tempera-ture rises. The material available is used in the context of the uncertainties stated per publication.
• No specific attention is devoted to the intrinsic adaptability of ecosystems or sectors. • This evaluation does not deal with the economic aspects of the issue. An example
here is the costs of stabilisation efforts through mitigation (countering the causes of climate change) and adaptation (adapting to climate change) in association with the costs of climate effects. Basic information on this can be found in the most recent IPCC report (IPCC, 2001c).
LIMITS TO WARMING
12
A great deal of this new knowledge is incorporated in current policy. The conclusions of the EU Environment Council, December 2004, for instance, include the following statement:
‘…RECOGNISES that recent scientific research and work under the IPCC indicates that it is unlikely that stabilization of greenhouse gas concentrations above 550 ppmv CO2equivalent would be consistent with meeting the 2 degrees Celsius long-term objective and
that in order to have a reasonable chance to limit global warming to no more than 2 degrees Celsius stabilization of concentrations well below 550 ppmv CO2equivalent may be needed; NOTES that keeping this long-term objective within reach will require global greenhouse gas emissions to peak within two decades, followed by substantial reductions in the order of at least 15% and perhaps by as much as 50% by 2050 compared to 1990 levels.’ (Council of the European Union, 2004)
II.
Effects of climate change
1. Introduction
There are two ways of looking at the formulation of threshold values for the effects of climate change in the context of avoiding ‘dangerous interference’. The first type of threshold value is related to the risks of a gradual climate change, including changes in extreme weather events or variability, which, if violated, lead to damage that policy makers would regard as unacceptable. This type of threshold value is the result of a pro-cess in which the relative risks to different sectors and regions are weighed against the costs of avoiding those risks.
Another type of threshold value is related to the risks of structural, often abrupt and irreversible, changes within the climate system itself. These changes may be set in train by gradual climate change and occur in addition to the effects associated with such change. Examples of this sort of risks are processes that accelerate climate change (cal-led runaway processes), such as a decline in the reflection of sunlight and an increase of soil emissions (melting of permafrost) as the Arctic warms up; abrupt, irreversible chan-ges such as the halting of the thermohaline circulation, and the crumbling and melting of the ice sheets. The influence of these processes can be felt on a regional and often glo-bal scale. Even though the dynamics are often complex, the probability that such a non-linear process will be initiated can be related to the mean temperature increase. It is reasonable to suppose that violation of a threshold value associated with large-scale, irreversible effects would be generally regarded as unacceptable and therefore as a ‘dangerous interference’.
2.
Effects of gradual climate change
This section reports on the assessment of the literature along three axes: geographic scale, temperature increase and sectors / systems. The scales studied are global and European. The temperature increase is examined in a range of 0.7 ºC to 5.8 ºC. The areas considered are ecosystems, biodiversity, food production and health. Finally, extremes of weather are also examined.
2.1
Global and European effects
Ecosystems – global
A great deal of new scientific literature on the influence of climate change on eco-systems has appeared since 2001. Generally speaking, greater temperature changes are associated with accelerated ecosystem change. At certain rates of change, eco-systems will no longer be able to adapt.
Vulnerable ecosystems can already be severely impacted by rises in the global mean
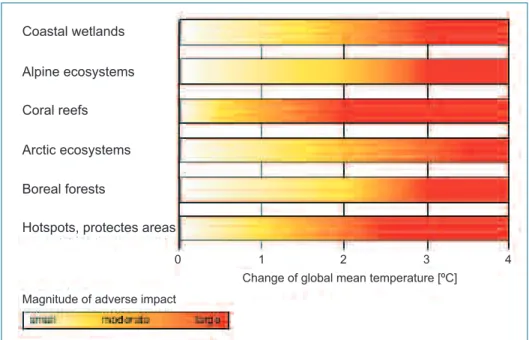
tem-perature between 0.7ºC above pre-industrial level (the current situation) and 1ºC above the pre-industrial level. Figure 1 shows that especially coral reefs enter the danger zone at a
warming of 1ºC (Hoegh-Guldberg, 1999; Sheppard, 2003). A number of specific studies have also appeared, dealing with such vulnerable ecosystems as the high tropical forests in Queensland, Australia (Hilbert et al., 2001; Hilbert et al., 2003; Williams et al., 2003) and the Succulent Karoo in South Africa (Rutherford et al., 1999; Hannah et al., 2002; Midgley et al., 2002). These studies reveal adverse effects from climate change on these vulnerable ecosystems, with a temperature increase of as little as 1ºC. Moreover, forests in boreal (and other) regions may be influenced since forest fires may occur more frequently (Ni, 2001).
Between 1ºC and 2ºC the damage to the above ecosystems will increase and many other
ecosystems will start to experience change. Some Arctic and alpine ecosystems will pro-bably suffer great damage (Hare, 2003; Busby, 1988; Burgmann, 1997; Theurillat and Guisan, 2001; Derocher et al., 2002).
Between 2ºC and 3ºC global temperature increase, the effects will increase. The upper
limit of this range is associated with the very serious risk that the Succulent Karoo will disappear, together with its 2800 plant species. There is a risk that this temperature range will result in potentially irreversible damage to the Amazon Forest, principally due to drought in the area. This can also lead to reduced CO2uptake, or even turn into CO2 emission (Cowling et al., 2003; Cox et al., 2004).
Above 3ºC the effects on ecosystems increase further. Major impacts may be expected on
the waterfowl populations in the Prairie Pothole Region in the USA (Sorenson et al., 1998). The Arctic sea ice area will also decline sharply, especially in summer, leading to further threats to the polar bear population. Furthermore, approximately half of the world’s nature reserves will no longer be able to adapt (Leemans and Eickhout, 2004). A survey of the impacts of increasing global mean temperature on specific ecosystems is presented in Figure 1.
The coral reefs appear to be one of the most vulnerable ecosystems (O’Neill and Oppenheimer, 2002). Coral reefs are characterised by great biodiversity and also have economic value (tourism, fish catch). Even now, many coral reefs are showing major changes, partly caused by the observed temperature change. Excessive sea water temperatures lead to bleaching due to the dieback of the unicellular micro-organisms with which the coral has a symbiotic relationship. The bleaching effect will increase mar-kedly if the global temperature increase continues beyond 1ºC. If bleaching occurs too often, there is a great risk that the coral reefs will disappear.
Another new phenomenon is the acidification of the oceans due to the increase in dissolved CO2concentration (The Royal Society, 2005). The oceans are absorbing CO2 from the atmosphere and this is causing chemical changes by making them more acidic (that is, decreasing the pH), which can bring about several adverse effects (see Box 2) LIMITS TO WARMING
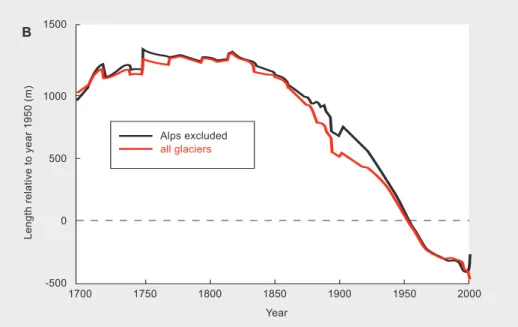
With regard to glaciers, both the surface and volume of 300 glaciers throughout the world are said to have shown a decline between 1961 and 1998, and accelerated mel-ting since 1980 (Dyurgerov, 2003). Oerlemans (2005) looked at records of the length of 169 glaciers in different parts of the world. He related changes in glacier length to changes in temperature (Figure 2). Firstly, he observed that the mean glacier retreat started around 1800 and then accelerated gradually. From 1900 to 1980, 142 of the recorded 144 glaciers retreated. Glacier retreat on the century time scale seems to be fairly uniform around the globe. There are strong indications that glacier fluctuations on a continental scale are, over decades to centuries, primarily driven by temperature. This enables the recon-struction of temperatures from these fluctuations fully independent of other sources (proxy or instrumental). Oerlemans found that most regions show a temperature in-crease from 1860 onwards. In the first half of the 20thcentury the temperature rise is
Coastal wetlands Alpine ecosystems Coral reefs Arctic ecosystems Boreal forests
Hotspots, protectes areas
Magnitude of adverse impact
Change of global mean temperature [ºC]
0 1 2 3 4
Figure 1: Effects on ecosystems (source: Hare, 2003)
In the past 200 years the oceans have absorbed approxi-mately half the CO2emitted through human activities. Calculations based on measurements indicate that this uptake of CO2over the past 200 years has led to a reduction in the average pH of surface sea water of 0.1 units and could fall by 0.5 units by the year 2100. This pH is probably lower than has been experienced for hundreds of millennia and, critically, at a rate of change probably 100 times greater than at any time over this period. The acidic water could interrupt the process of shell and coral formation, and adversely affect other organisms dependent on corals and shellfish. The acidity could also negatively impact other calcifying organisms,
such as phytoplankton and zooplankton. This may reduce the ocean’s ability to absorb CO2from the atmosphere, which in turn will accelerate the rate of global warming. The entire marine food chain may also be harmed. Ocean acidification is essentially irreversible during our lifetime. It will take tens of thousands of years for ocean chemistry to return to a condition similar to that occurring in pre-industrial times. CO2-induced acidification of the marine system has only recently emerged as a serious issue, backed up by experimental studies. Research into the impacts of high concentrations of CO2 in the oceans is in its infancy and needs to be developed rapidly, given the gravity of this problem.
notably similar for all regions in the world: about 0.5 K in 40 years. After 1945, the global mean temperature drops slightly up to 1970, when it starts to rise again. This result pro-vides additional evidence about the magnitude of the current global warming, the time that this warming started, and the notion that in the lower troposphere the warming appears to be independent of elevation.
Ecosystems – European scale
The most sensitive ecosystems in Europe are the wetlands, alpine vegetation and ecosystems in the European Arctic. Even with a global temperature increase of 1ºC, several plant species on mountain tops will come under threat (Gitay et al., 2002), just as ecosystems in sensitive wetland areas of the European Mediterranean and the Baltic (Hare, 2003). An increase between 2ºC and 3ºC (global) will threaten Arctic ecosystems (e.g. large areas of tundra will disappear), and large-scale effects will be observed in wetland ecosystems throughout Europe (Kundzewicz et al., 2001; Hare, 2003; ACIA, 2004).
Biodiversity
Biodiversity is the biological richness of life on earth at the level of genes, species and ecosystems. Biodiversity represents the intrinsic value of nature. Biodiversity is also important for human health and plays a role in food provision and as a source of raw materials. Very little is yet known about these functions.
LIMITS TO WARMING 16 L e n g th re la tiv e to ye a r 1 9 5 0 (m ) Alps excluded all glaciers Year 1700 -500 0 500 1000 1500 B 1750 1800 1850 1900 1950 2000
Fig. 2. Stacked records of glacier length (source: Oerlemans, 2005).
(Irregularities occur when a glacier with a large length change is added. However, this does not necessarily involve a large change in climatic conditions because glaciers exhibiting large changes are normally those that have a large climate sensitivity (and thus respond in a more pronounced way to, for instance, a temperature change). After 1900, the irregularities disappear, because the number of glaciers in the sample shows a strong increase).
Many publications are now available that describe the close correlation between climate change and changes in the areas in which species are distributed. Model research has also been done on the effects of climate change on biodiversity. This involves defining a ‘climate space’ within which the species can flourish. Climate models are used to investigate how this space moves. Migration of species is sometimes difficult or impossible as a result of natural (water, mountains) or human bar-riers (agricultural land) because of a lack of physical space. For example, Williams et al. (2003) investigated the Australian tropical rainforest, the richest area in Australia, biologically speaking. They looked at the effects of local temperature increases between 1ºC and 7ºC on species distribution, using bio-climate models based on 220,000 obser-vations. They estimated the changes in the distribution area of each species under diffe-rent climate scenarios. Model calculations for 62 native species that occur at altitudes higher than 600 m indicated that a 1ºC temperature increase would result in an average 40% loss of potential distribution area. The figure for 3.5ºC is 90% and for 5ºC, 97%. A temperature increase of 7ºC results in a loss of the entire potential distribution area for all species.
Bakkenes et al. (2005) did a comparable analysis for 856 European plant species for which the present distribution area is clearly correlated with climate patterns. Here it was concluded that a warming of 3ºC above the pre-industrial would result in the disappearance of, on average, 10% of European species from several European countries. At 2ºC, the goal of maintaining species was concluded to be within reach on the European continent, even though certain plant species would disappear in a number of countries.
Conclusions
To summarise, sensitivities would seem to vary between different ecosystems and regions. In broad terms, the risks increase with increasing temperature (see Figure 1). If the increase is limited to less than 1ºC, the ecosystem effects will be limited, but they cannot be ruled out, as the coral reefs are now showing us. A further increase above 1ºC leads to increased risk. Between 1ºC and 2ºC warming will lead to changes and even dis-appearance of a number of ecosystems in many locations around the world. Further warming is associated with increased risks, resulting in very many cases in species beco-ming threatened with extinction or even the disintegration of ecosystems.
Ecosystems in Europe are generally less sensitive than in other parts of the world. But here, too, temperature increase will have an effect, first of all, in some wetland areas, alpine regions and the European Arctic.
Food production
The effect of climate change on food production is governed by a variety of factors, such as temperature, water availability and CO2 fertilisation (by atmospheric CO2). This last factor generally leads to increased yields. The vulnerability of food production varies sharply from region to region: regions where food production is already limited by climatic conditions, such as arid areas, and poor regions where there is
little possibility for (technological) adaptation are most sensitive. When considering food production it is also important to distinguish between the global and the regional scale: on the global scale, losses in a certain region can be compensated by increased production in another. Global vulnerability is thus lower than regional or local vulner-ability. Viewed in terms of risks of starvation and/or malnutrition and social effects, the regional scale is more relevant than the global one. Smith et al., (2001) sketch a world-wide picture in which a warming of around 1ºC is favourable for world-world-wide food pro-duction, while it will cause relatively little damage on the regional scale. Nearly all deve-loped countries will be at an advantage, while many developing countries in the tropics will probably be confronted with small but significant yield losses, compared with an unchanged climate.
Between 2ºC and 3ºC warming will not endanger world-wide food production, but the risk
on the regional scale will increase significantly (Parry et al., 1999; Parry et al., 2001; Arnell et al., 2002; Parry et al., 2004). The crop yields in developing countries will then seem to suffer greatly under higher temperatures. At a temperature increase of 3ºC, for example, the grain yields in current and potential future agricultural areas in South Africa will decline by approximately 40%. The grain yields of the present agricultural areas will decline even more at such temperatures (Fischer et al., 2001). The associated effects of cli-mate change on water supply play an important role here.
If grain yields are to be maintained at high temperatures, many areas will have to shift, so that northern regions can expect increases in crop yields (Canada, USA, Russia and Northern Europe).
Warming from 3ºC to 4ºC will have an adverse effect on global food production.
One study (Parry et al., 2001) states that 80 to 125 million people will then run an additional risk of starvation, depending on the climate model used. In Australia, a warming of around 4ºC will probably remove entire regions from food production (Pittock et al., 2001).
The outcomes of the European Climate Forum Symposium in Beijing (ECF, 2004) confirm this picture: warming between 2ºC and 2.5ºC (above the pre-industrial level) will bring significant regional, more or less serious, risks to food production (South Asia, Southern Africa and parts of Russia). Above this range there is an increasing risk to China, Africa, South Asia and Russia, but there are uncertainties, such as the CO2fertilisation
mentioned above.
At all levels of warming, a large group of poor, highly vulnerable developing countries are expected to suffer from increasing food shortages, leading to greater uncertainty in the food supply and to starvation. An increase in extremes and changes in climate variability will also have consequences for agriculture in arid and semi-arid regions, but this is not yet possible to quantify.
LIMITS TO WARMING
Human health
It is difficult to determine the impact of climate change on human health because it is influenced by a great many factors, such as levels of prosperity and education, nat-ural resistance and/or susceptibility, quality of and access to health care, etc. A great problem, too, is that many effects are linked to extreme weather situations. Human influence, in the sense of climate change, can certainly be recognised here, but cannot be quantified yet (see Section 2.2).
Weather extremes can have a great influence on health, as the extremely dry European summer of 2003 demonstrated. Temperature increase can be associated with a great risk of contagion from pathogens via (drinking) water. The spread of such dis-eases as malaria and Dengue Fever is also temperature-related. Further risks are the increase in food and water shortages and an increase in natural disasters, such as flood-ing. Actually, only studies on malaria are available at global coverage and over a certain time-frame (Hitz and Smith, 2004).
Broadly speaking, Hitz and Smith come to the conclusion that morbidity and morta-lity figures resulting from an increased global temperature will more probably increase than decline. They characterise the relationship between human health and climate change as one of increasingly adverse effects. No indication can be given yet of a range of temperature increases and the related effects for this topic.
2.2
Changes in extreme temperatures as a result
of gradual climate change
The global mean temperature has risen in the past century by more than 0.7ºC above the pre-industrial level. In the last quarter of the 20th century, the warming of the earth was more than three times that of the past 100 years. The 1990s were the hottest years in the Northern Hemisphere (source: WMO).
Until recently, the human impact on the climate could only be demonstrated in terms of global warming or the rise in mean temperatures above the major continents. Klein Tank (2004) has shown that the warming of the earth can also be visible in the extremes: during the past half-century there have been fewer cold extremes and more warm extremes in Europe. The degree to which the extremes change does not correspond exactly with the climbing average temperatures. For example, in recent decades the increase in the number of relatively hot days contributed more to warming than the decline in the number of relatively cold days. This unequal change in relatively cold and warm daytime temperatures could be seen as a fingerprint of human influence on the climate (see also Box 3).
In conclusion, it can be stated that there is a statistical relationship between the increase
in extreme temperatures and anthropogenic global warming. A better understanding and quantification of the observed changes in extremes requires a closer analysis of the
underlying physical mechanisms that cause the trends. Such an analysis may confirm that human influence is not only visible in the average warming, but also in the changes in extreme temperatures. It will also afford insight into how weather extremes might change in Europe in the coming century.
In advance of this, some scientists have made statements about the effects of an increase in weather extremes (Leemans and Van Vliet, 2004). The observed ecological changes occur more frequently and are more pronounced than might be expected on the basis of a mean temperature increase of 0.7ºC. They seem to correlate far better with changes in weather extremes than with average warming. On the basis of observed and expected effects, Leemans and Van Vliet believe that the threshold of a 2ºC global mean tempera-ture increase is too high: even small changes in global mean temperatempera-ture will be associ-ated with disproportionately large changes in the frequency and magnitude of weather extremes and thus with unpredictable and undesirable effects on species and eco-systems. They therefore recommend limiting the global mean temperature increase to 1.5ºC above the pre-industrial level, at a rate of less than 0.05ºC per decade.
While the effects of increasing weather extremes on nature (as well as on agriculture LIMITS TO WARMING
20
The probability of a heat wave occurring changes as the mean temperature rises. Anthropogenic warming shifts the statistical distribution (probability density function) of summer temperatures towards warmer conditions. This has a great effect on the probability that the temperature will exceed some selected thres-hold value on the right-hand side of the probability
function: the likelihood of extreme summers will pro-bably increase as the mean of the function shifts due to gradual warming (see accompanying figure). The shape of the probability density function (the variability) may also change due to human influence, but the underlying physical causes are currently only known in part (see Schär et al., 2004, for example).
Box 3. Changes in mean and extreme values under the influence of gradual temperature change
P ro b a b ili ty d e n si ty
•
Mean summer temperature Threshold value Increase in probability of occurrence of a threshold value Changing variability due to gradual warming Shift of mean due to gradual warmingFigure. Example of a probability density function of mean summer temperatures and the changes resulting from gradual warming
and public health) should not be underestimated, recommending a (revised) tempera-ture target, as suggested by Leemans and Van Vliet is still speculative. Generally speak-ing, many effects are set in train by weather extremes, but we do not yet know how those weather extremes will change. Insight in this area will contribute greatly to an estimation of the risks of climate change.
2.3
Sea level rise
Natural changes in sea level can be very large. For example, during the last glacial era, which ended about 10,000 years ago, the ocean was 120 metres lower than it is now (Rapley, 2005).
Global mean sea level rises can occur due to an increase in the volume of water in
the oceans. During the 20thand 21stcenturies this is likely to be the result of thermal
expansion of sea water and the melting of glaciers and changes in the mass of the Antarctic and Greenland ice sheets (Church, 2001). The process of thermal expansion is characterised by a long delay after a temperature increase, meaning that it is necessary to look several centuries ahead. Church (2001) suggests that the most important contri-bution to 20thand 21stcentury sea level rise is likely to be thermal expension of the oceans. However, Thomas et. al., (2004) state that half of the recent sea level rise is due to the melting of ice from Greenland, West Antarctica’s Amundsen Sea and mountain glaciers (Thomas et al., 2004).
The sea level change at a given locality, also termed the relative sea level change, depends on yet more factors:
• regional variations, including those caused by non-uniform patterns of temperature and salinity changes in the ocean. These can cause deviations (up to 100%) from the world mean sea level rise (Gregory and Lowe, 2000).
• vertical movements of the land surface caused, for example, by tectonics, and land subsidence due to large-scale water extraction or compaction of peatlands.
The relative sea level rise is thus the sum of the global mean sea level rise, the regional component and the local, vertical component.
Global mean sea level rise during the 20thcentury was 10–20 cm (Church and Gregory,
2001). This figure is derived from measurements that have been corrected for vertical land movements. Rapley (2005) estimates the current rate of sea level rise at ca. 1,8 mm/year.
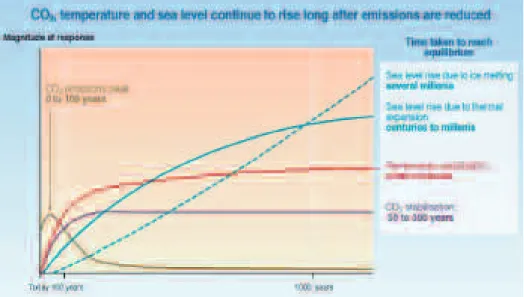
With regard to the future, one must take account of the response to future emissions as well as the continuing response to past ones – the delayed effect of past greenhouse emissions (see Figure 3). This last factor, which is largely governed by the thermal expan-sion, will continue to play a part for many centuries to come, due to the long-term process by which surface heat mixes with the deeper layers of the ocean.
In its 2001 Report, based on a number of emission scenarios, the Intergovernmental Panel on Climate Change (IPCC) expected the global mean sea level to rise in 2100 by 9–88 cm. This broad range can be ascribed to scientific uncertainties and different assumptions about population growth and economic development, which also translate into the temperature projection range. Furthermore, a part is also played by uncertainties about the growth of the ice sheets due to precipitation and calving, and the degree to which the temperature increase is distributed over the ocean. The increase can principally be ascribed to thermal expansion. The range of 9–88 cm does not incorporate the major uncertainties attached to possible large changes in the West Antarctic Ice Sheet (WAIS) and the Greenland Ice Sheet, see Section 3.2.
Model calculations indicate a future global mean sea level rise that is practically independent of future emissions until ca. 2050 (Mitchell et al., 2000). However, after 2050, future emissions assume increasing importance in managing the sea level rise over a period of centuries. A global mean sea level rise is thus unavoidable during the 21st century and thereafter. But we can influence the (rate of) sea level rise in the 22nd
centu-ry and thereafter by cutting greenhouse gas emissions in the current centucentu-ry.
Stabilisation of the concentration of greenhouse gases in the atmosphere, via certain emission pathways (in association with certain mitigation measures), will limit the tem-perature increase and therefore also the thermal expansion of sea water that leads to sea level rise. Nevertheless, the delayed effect of past emissions means that adaptive mea-sures will have to be taken in any case. MNP used its IMAGE model to compute a stabili-sation scenario of 650 ppmv CO2equivalent, arriving at the global mean temperature
rise in 2100 presented in the table below (Eickhout et al., 2003). Global mean sea level increases have been computed using a comparable stabilisation scenario (S550, 550 ppmv CO2), which gave roughly the same temperature increases in 2100 for the same
cli-mate sensitivity values but using a different method (Nicholls and Lowe (2004; Nicholls, 2005).
LIMITS TO WARMING
22
Combining these results gives a relationship between temperature increase and sea level rise in 2100, as illustrated, for example in the table below. Incidentally, the sea level will continue to rise for many centuries after 2100 due to the delay effect: the thermal expan-sion will be higher by a factor of 4 to 9, 500 years after stabilisation at 550 ppmv. Even then, only half of the ultimate rise might have taken place.. Model results show ranges of 0.5 m to 2 m at 550 ppmv CO2and 1 m to 4 m at 1100 ppmv CO2(IPCC, 2001a)
Finally, this table shows an estimate of the additional number of people who will be hit every year by floods as a consequence of sea level rise due to global warming. This esti-mate is based on specific population and GDP scenarios (Nicholls and Lowe, 2004).
3.
Changes in the climate system triggered
by gradual climate change
This chapter is devoted to the non-linear changes in the climate system initiated by gradual climate change. These can exert their effects on all scales: global, regional and local. These change mechanisms are great risk factors, since they commonly involve abrupt, irreversible processes. Important ‘weak links’ here are:
1. amplified effect of global mean temperature rise on the Arctic. 2. melting of the great ice sheets and the related sea level rise. 3. risk of a substantial reduction in the thermohaline circulation (THC)
3.1
Amplified effect on the Arctic
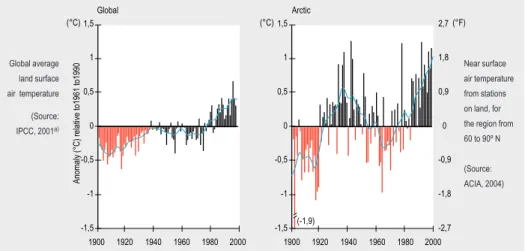
During the past few decades the average temperature in the Arctic has risen nearly twice as fast as in the rest of the world. There are certainly regional variations caused by wind patterns and ocean waves, which means that some areas have warmed up more than others, while a few areas show a slight cooling. However, the Arctic as a whole dis-plays a clear trend of amplified warming over the global mean (see Figure 4).
A number of mechanisms are responsible for this (see Box 4). The Arctic Climate Assess-ment (ACIA 2004) reports on the consequences for humans and the environAssess-ment (ACIA being a four-year study, completed in 2004 and conducted by more than 250 scientists and members of indigenous populations.)
Warming during the past few decades was found to be accompanied by melting glaciers Selected Calculated Calculated Additional people climate temperature sea level rise in hit by flooding sensitivity increase in 2100( cm. above (millions per annum)
(See Box 1) 2100 (°C) 1990 level) in 2100
1,5 1,5 13 Several
2,5 2,3 28 ca. 25
and sea ice, as well as higher permafrost temperatures. There are indications that a large area, stretching for a million square kilometres across the permafrost of western Siberia, is turning into a mass of shallow lakes as the ground melts (New Scientist.com news service, 11 August 2005). Melting permafrost is a major source of feedback that could accelerate climate change by releasing either CH4into the atmosphere (in wet
conditions) or CO2(from dry soils). Larry Smith of the University of California, Los Angeles,
estimates the west Siberian bog alone to contain some 70 billion tonnes of methane, a quarter of all the methane stored on land surfaces worldwide.
Associated effects of melting glaciers and sea ice are loss of albedo, sea level rise and a decrease in salinity of the northern seas as a result of melting ice, and an increase in the inflow of river water from melting glaciers. The last-mentioned two processes may lead to a slowdown of the THC (see Section 3.3).
Some of the consequences for the Arctic itself involve a retreat of sea ice (with adverse consequences for many mammal species), changed shipping routes (a beneficial effect), shifting zones of vegetation, disintegration of the permafrost, and economic and cultur-al consequences for the indigenous people. Disintegration of the permafrost leads to damage to buildings, roads, oil/gas plants and pipelines, and could result in serious environmental problems.
A global average warming of 2ºC corresponds to an increase of 4–8ºC in the Arctic. Calculations with various computer models predict that this sort of warming will result in almost the entire disappearance of Arctic sea ice in the summer towards the end of the present century (Johannesen et al., 2004). This will threaten the survival of the polar bear, ice-dependent seals, walruses and a number of seabirds. The tundra forms a breed-ing area for more than 20 million geese and wadbreed-ing birds. Many of these species will experience the adverse effects on tundra ecosystems, which are predicted to occur when the warming climbs to 2ºC.
LIMITS TO WARMING
24
Figure 4: Anomalies of observed global average and Arctic temperatures (1900 to present), rela-tive to the average for 1961-1990.
1900 -1,5 -1 (-1,9) -0,5 0 0,5 1 1,5 -1,5 -1 -0,5 0 0,5 1 1,5 (°C) (°C) An om al y (° C )r el at iv e to 19 61 to 19 90 Global Arctic (°F) -2,7 -1,8 -0,9 0 0,9 1,8 2,7 1920 1940 1960 1980 2000 1900 1920 1940 1960 1980 2000 Global average land surface air temperature (Source: IPCC, 2001a) Near surface air temperature from stations on land, for the region from 60 to 90º N (Source: ACIA, 2004)
According to the Hadley Centre (2005), the quantity of Arctic ice was constant until the 1960s. From 1970 it has declined by 7.5%, which corresponds to about one million square kilometres. This cannot be explained solely in terms of natural causes. If human activities are included in the Hadley Centre model, the model simulations agree with the observa-tions. Human interference can thus be concluded to cause the Arctic ice to melt.
3.2
Melting of the great ice sheets
If the Greenland and Antarctic ice sheets start to melt as global warming continues, they may add significantly to the global mean sea level rise. The potential effect of these ice sheets on the sea level as a result of global warming is great. Projections indicate that there is enough water in these ice sheets taken together for a sea level rise of up to 13 metres over the next 1000 years (Mercer, 1978; Lowe et al., 2005).
The last IPCC report expected only a very minor contribution from the melting of ice on Greenland to the sea level rise this century. Nor was it thought that instability in the WAIS would contribute significantly to sea level rise this century (IPCC, 2001a).
In some places the Greenland ice sheet is more than 3 km thick. It contains nearly 3 million cubic kilometres of ice. If this enormous quantity were to melt, the global sea level would rise by 7 metres, resulting in the submergence of many coastal regions and most of the world’s largest cities. (‘Stabilising climate to avoid dangerous climate change’, Hadley Centre, January 2005) In recent decades the Greenland ice sheet seems to have been melting with increasing rapidity (Abdalati and Steffen, 2001). The accom-panying figure shows that between 1992 and 2002 increasingly large areas of Greenland melted away in the summer. The reduction or growth of ice sheets depends on melting (temperature) and precipitation (snow). At annual mean local warming of more than 2.7ºC, the precipitation in Greenland is exceeded by the melting, which leads on balance to shrinkage of the ice sheet (Huybrechts et al., 1999; IPCC, 2001a). Recent research also suggests that a local temperature increase of a little less than 3ºC (which is asso-ciated with a global mean warming of ca. 1.5ºC) may start a process of irreversible melting of the Greenland ice sheet over a period of 1000 years or more (Gregory et al., 2004; Lowe et al., 2005). The main reason for Greenland warming up more in the future than the global mean is a positive or self-amplifying feedback, which may even result
in a runaway effect (an uncontrollable feedback). Snow and ice reflect more than approximately 85% of incident solar radiation, which is much more than sea and land. If snow and ice were to decline in Greenland due to warming, a greater area of land and sea will be exposed to the sun, meaning that less solar radiation will be reflec-ted and more absorbed. This will lead to extra warming, leading in turn to the melting of more snow and ice and yet more warming. An additional effect is the possible significant warming impact on the Arctic by black carbon (soot), generated through the process of in-complete combustion and transported from, for instance, south Asia. It is thought that soot causes Arctic melting because as it settles on ice and snow the surface is darkened, absorbing more sunlight and causing faster melting (Koch and Hansen, 2005). Airborne soot also warms the air and affects weather patterns and clouds. Finally, the atmospheric layer that has to warm in order to warm the surface is shallower in the Arctic. Not much is currently known about the process by which ice sheets disintegrate. The dynamics (and thus the final outflow into the sea) are gene-rally governed by the ice thickness, and its slope and the friction at the base of the glacier. Glacio-logists have observed in Greenland that the melt water trickles through the ice sheet to flow out
The last IPCC report characterised Antarctica as a sleeping giant with regard to climate change. Some scientists suggested the process of ice sheet disintegration to be non-linear and that it would therefore probably proceed far faster than has hitherto been supposed (faster than an ice sheet can grow), see Box 4.
In the meantime there have been clear indications of the non-linear course of the process by which these ice sheets disintegrate. Greenland has been observed to be melt-LIMITS TO WARMING
26
underneath it. This acts as a lubricant: parts of the ice sheet therefore shift faster into the sea (Zwal-ly et al., 2002; Corell, interview in Trouw, a Dutch newspaper, 19-2-’05). Researchers at the Climate Change Institute in Maine have, in their recent measurements (July 2005), seen that the Kangerd-lugssuaq glacier in southeast Greenland is moving at a speed of ca.38 m per day towards the ocean. This speed is nearly three times greater than in the late 1990s.This seems to be one of the fastest moving glaciers in the world.
A complication here is that the ice sheets bordering the coast of Greenland (and Antarctica), and closing off the mouths of the glaciers flowing from the mainland, are thinning or even breaking up, which accelerates the flow of the glaciers into the sea (Alley, Penn State University, Washington).
The contribution of Greenland and Antarctica to sea level rise this century is expected to be possibly far greater than was hitherto supposed by the IPCC (2001a). It is not yet clear whether the acce-lerated melting should be ascribed to global war-ming or natural causes (such as changes in the atmospheric circulation patterns in the northern hemisphere).
The climate in Greenland will be far milder without an ice sheet because the land surface will then be far lower than the top surface of an ice sheet and will reflect less sunlight. Even if the values for global climate and the composition of the atmosphere were to return to their pre-industrial levels, the ice sheet would probably not return. This means that the sea level rise will very probably be irreversible.
1980 1985 1990 1995 2000 2x10⁵ 3x10⁵ 4x10⁵ 5x10⁵ 6x10⁵ 7x10⁵ M ax im um m el te xt en t( km 2) Trend: 0.7% / year
1992 M elt E xtent 2002 M elt E xtent
Greenland ice sheet melt area increased on average by 16%from 1979 to 2002. The smallest melt extent was observed after the Mt. Pinatubo eru ption in 1992
Data from Konrad Steffen and Russell Huff, University of Colorado Observations of the summer melting regions on the Greenland ice sheet. The melting zone, where the summer warmth changes the snow and ice around the edges of the ice sheet into a slushy mixture of snow and melt water, has extended into the interior, reaching record heights in recent years (ACIA, 2004).
ing harder and faster, with an acceleration in the shifting of glaciers after breaking up, and after the thinning of the floating ice sheets bordering the Greenland coast and some parts of Antarctica (West Antarctic Ice Sheet and peninsula). Recently, the spectac-ular collapse of Antarctica’s Larsen B Ice Shelf has been blamed on effects of global warming in the Antarctic Peninsula, which is more pronounced in this region than elsewhere in Antarctica or the rest of the world (Domack et al., 2005). There are thus indications that the giant is starting to awaken, even though the Eastern Antarctica shows little sign of change at the moment (Rapley, 2005).
These new observations lead one to expect a considerably greater contribution from the ice sheets to sea level rise this century than expected by the IPCC (2001a). (See also Box 4)
If the global temperature continues to increase, a significant additional contribution is expected from both Greenland and the WAIS to the sea level rise over the very long term (after the 21st century), even in the absence of accelerated melting.
The conclusion is that, while there are still many uncertainties about the longer term (after 2100), it is nevertheless probable that a global temperature rise of more than 1–2ºC will cause irreversible melting of the Greenland ice sheet, resulting ultimately in a sea level rise of 7 metres. This process may well take 1000 years or more (unless the pos-itive feedbacks are stronger than expected), but it can start in the course of this century. New observations lead us to expect a far greater contribution from the ice sheets to sea level rise in the present century than the IPCC (2001a) had supposed.
3.3
The thermohaline circulation
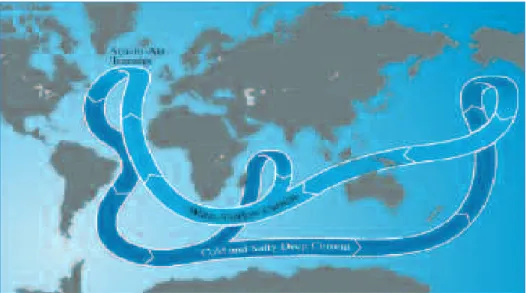
Three factors play a role in ocean currents: tides, wind and differences in the water den-sity. The density of ocean water is determined by temperature and salinity. The ocean currents that are driven by density differences are called the thermohaline circulation (THC).
Together with wind-driven currents, the THC forms the Gulf Stream, of which the North Atlantic Ocean Current is a part (see Figure 5). This is a major factor influencing the climate in Western Europe as it transports heat from the tropics to higher latitudes.
If the density of the North Atlantic sea water is reduced due to more freshwater input and/or reduced cooling, this may result in a slowdown of the THC. The freshening of the water may be the result of more precipitation or the melting of sea and land ice. Pooling and sudden release of glacial meltwater, disintegration of shelf ice followed by a surge in glacier movement, and lubrication of the glacier base by increased melting are all possible mechanisms that could inject large amounts of fresh water from Greenland’s ice sheet into the upper layers of the Nordic Seas (Currey and Mauritzen, 2005).
There are two risks associated with a weakened THC: a threshold effect and a hysteresis effect. (The latter is an irreversibility effect: i.e. the strength of the ocean current does not return along the same path to the old level if the temperature falls). We do not know the precise form of the hysteresis curve, nor where we are on the curve at the present time.
A significant reduction in the thermohaline circulation will have major consequences for the North Atlantic region. There are strong indications of a THC shutdown in the past – within a few tens of decades. It has been found, for instance, that the coldest interval in the last 20,000 years occurred when the Atlantic Ocean circulation collapsed after icebergs entered the North Atlantic about 17,500 years ago. This regional extreme climate event started suddenly and lasted for about 2000 years. This cold interval was followed by an acceleration of the ocean circulation and a considerably warmer climate above North America and the North Atlantic region (McManus et al., 2004). NASA satellite observations have revealed that the North Atlantic Ocean circulation was con-siderably weaker at the end of the 1990s compared with the circulation in the 1970s and ’80s (Häkkinen and Rhines, 2004). The tropical ocean water has become far more saline in the last 40 years, while the oceans have become fresher closer to the poles (Curry et al., 2003). If the northern part of the Atlantic Ocean becomes too fresh, it could happen that the water no longer sinks to the abyss and that the THC will weaken.
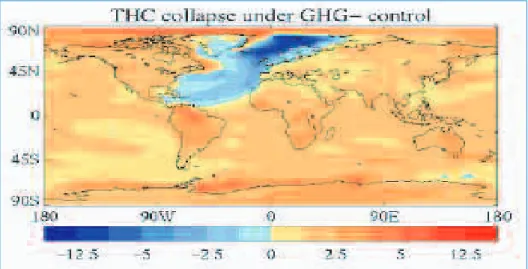
How the THC will develop this century highly depends on how the exchange of warm and freshwater responds to the increasing concentration of greenhouse gases (Clark et al., 2002). The 2001 IPCC report states that a slowdown of the THC may occur this century in connection with the increasing greenhouse gas concentrations. Some of the models used even suggest that the THC may collapse. Figure 6, based on a model calculation, shows what the collapse of the THC may imply for northwestern Europe.
LIMITS TO WARMING
28
Currently, experts estimate that there is at least a 5% probability that the THC will collapse if the global mean temperature rises by 2ºC above the pre-industrial level, and that the probability is even greater than 50% if the temperature rises by more than 4ºC –5ºC. The experts further expect a slowdown of the North Atlantic ocean current by 10–50% this century under a doubled CO2scenario. A recent publication (Schlesinger
et al., 2005) states that in the absence of any climate policy, the probability of a THC collapse between now and roughly 2200 is greater than 50%.
For a risk assessment of a THC collapse we will need knowledge of the probability of its occurrence and the associated consequences. Estimations of the probability that such an event will occur are rendered more difficult by the high degree of uncertainty in the models used (Wood et al., 2005). The figures given above related to the THC collapse must therefore also be regarded as speculative. A more reliable answer will need further observations and model experiments.
The ultimate consequences of the slowdown or even shutdown of the THC depend on a number of aspects: regional cooling in Western Europe as a result of the THC collapse, regional warming due to the continuing greenhouse effect, and the magnitude of heat transport through the ocean to the North Atlantic region (the warm Gulf Stream will never, because it is mainly wind-driven). There are also great differences in the rate of change: slowdown / shutdown of the THC, if it happens, will probably occur over a period of one to a few decades, while global warming will manifest itself over periods in the order of a hundred years. Apart from that, even if the THC were to collapse, global warming will continue and may thus lead to increased warming in other regions.
Figure 6: Model calculation showing collapse of the thermohaline circulation (Wood et al., 2005).
4.
Effects on the Netherlands
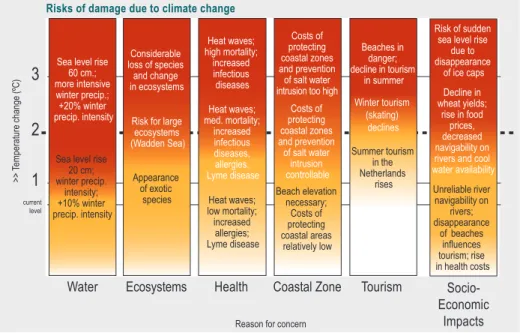
A recent study looked at the consequences for the Netherlands of a warming range of up to 4ºC in relation to pre-industrial levels, for water, ecosystems, health, the coastal zone, tourism and socioeconomic impacts. The study was led by the Institute for Environ-mental Studies, Vrije Universiteit, Amsterdam, within the sub-programme for Scientific Assessment and Policy Analysis of the Netherlands Research Programme on Climate Change. The findings of this study, obtained by means of Participative Integrated Assess-ment with interested parties, are depicted in Figure 7 (Gupta and Van Asselt, 2004).
A conclusion of the study as a whole then is that water is one of the most important per-ceived reasons for concern for the Netherlands. This country will be seriously influenced by climate change via changes in the water system. For example, it is expect-ed that the winter discharge from the Rhine and Meuse will increase, while the summer discharge will decrease. An increasing sea level will impede the discharge of water to the sea. A local sea level rise of more than 3 mm per annum (or 30 cm per century) will result in the loss of part of the Wadden area. The seepage of saline water in areas around the IJsselmeer is expected to increase. The flooding of polders and salt water intrusion will become common and there will be water shortages in summer. As a result of salination, and damage by droughts and water excess due to more and more intensive occurrence of weather extremes, effects on food production may occur (Kok et al., 2002).
LIMITS TO WARMING
30
Water Ecosystems Health Coastal Zone Tourism Reason for concern
3
2
1
>> Te m pe ra tu re ch an ge (º C )Risks of damage due to climate change
Socio-Economic
Impacts current
level
Sea level rise 60 cm.; more intensive
winter precip.; +20% winter precip. intensity
Sea level rise 20 cm; winter precip. intensity; +10% winter precip. intensity Considerable loss of species and change in ecosystems Appearance of exotic species Heat waves; high mortality; increased infectious diseases Heat waves; low mortality; increased allergies; Lyme disease Costs of protecting coastal zones and prevention of salt water intrusion too high
Beach elevation necessary; Costs of protecting coastal areas relatively low Beaches in danger; decline in tourism in summer Summer tourism in the Netherlands rises Risk of sudden sea level rise
due to disappearance of ice caps Unreliable river navigability on rivers; disappearance of beaches influences tourism; rise in health costs
Risk for large ecosystems (Wadden Sea) Heat waves; med. mortality; increased infectious diseases, allergies, Lyme disease Costs of protecting coastal zones and prevention of salt water intrusion controllable Winter tourism (skating) declines Decline in wheat yields; rise in food prices, decreased navigability on rivers and cool water availability
Finally, the increasing temperature and the reduced availability of water will lead to a reduced availability of cooling water to industry and power stations. This problem can be solved by investing in adaptation measures. With regard to water management, these measures involve, inter alia, improvements to retention, storage and discharge systems. The necessary additional yearly costs up to the year 2050, which are needed for adaptation measures, are estimated at M5225 yearly, based on a climate scenario of +2ºC for 2100.
The scientists and interested parties involved in the research have agreed that on the basis of the current state of knowledge, a target of 2ºC global mean temperature increase would seem to be the most reasonable long-term target for the Netherlands, mainly to rule out the risks of irreversible effects. It should be mentioned, however, that the choice of target be reserved for the political process.