1 RIVM, Center for Infectious Disease Control 2 HIV Monitoring Foundation
3 Currently: ECDC Stockholm
Contact: I.M. de Boer
Center for Infectious Disease Control
Soahiv@rivm.nl
RIVM report 441100024/2006
HIV and Sexually Transmitted Infections in the Netherlands in 2005
IM de Boer1, ELM Op de Coul1, FDH Koedijk1, MG van Veen1, AI van Sighem2, MJW van de Laar1,3
This investigation has been performed by order and for the account of Ministry of Health, Welfare and Sports, within the framework of the project Epidemiology and surveillance of HIV and STI.
Report prepared by:
Center for Infectious Disease Control, National Institute for Public Health and the Environment, with special thanks to Michel Wagemans.
In collaboration with:
HIV Monitoring Foundation & HIV treatment centres STI sentinel surveillance network
ISIS laboratory surveillance at the National Institute for Public Health and the Environment ISIS/Osiris – General Health Inspectorate
Rapport in het kort
Hiv en seksueel overdraagbare aandoeningen in Nederland in 2005
De stijgende trend van enkele seksueel overdraagbare aandoeningen (soa) lijkt in 2005 te zijn gestabiliseerd in het soa-peilstation. Bij mannen die seks hebben met mannen (MSM) is het aantal soa in 2005 echter onverminderd hoog en neemt het percentage positieve hiv-testen toe. Ook in de landelijke hiv-registratie (Stichting HIV Monitoring) is in 2005 het aantal hiv-diagnoses opnieuw het hoogst bij MSM. Daarnaast is het aantal hiv-diagnoses bij autochtone heteroseksuelen de laatste jaren licht gestegen. Continue alertheid en innovatieve methoden in preventie en interventie zijn nodig om verdere verspreiding van soa en hiv te voorkomen.
Per juni 2006 zijn 11866 personen met hiv bij de SHM geregistreerd, waarvan 970 in 2005. MSM vormen hierin nog steeds de grootste groep (52%, n=501). Het aantal hiv-diagnoses bij allochtone heteroseksuelen daalde van 341 diagnoses in 2002 naar 258 in 2005. Het aantal hiv-diagnoses bij autochtone heteroseksuelen steeg van 86 in 2002 naar 116 in 2005.
In het soa-peilstation nam het absolute aantal gevallen van chlamydia en hiv toe in 2005 met 15% en 25%, maar ook het aantal testen steeg. Gonorroe en syfilis daalden licht met 2% en 7%. Vijftien procent van alle chlamydia, gonorroe en syfilis in MSM werd gezien bij hiv-positieve personen. In 2005 is de resistentie tegen ciprofloxacine bij gonorroe verder toegenomen tot 26%. In Nederland is het aantal nieuwe LGV-gevallen in 2005 sterk afgenomen en daarmee lijkt de epidemie over zijn hoogtepunt heen te zijn.
Abstract
HIV and Sexually Transmitted Infections in the Netherlands in 2005
The trend of increasing Sexually Transmitted Infections (STI) has partly stabilised in 2005 in the STI sentinel surveillance network. Among men having sex with men (MSM), the number of STI diagnoses remained high and the HIV positivity rate has increased. Moreover, in the national HIV registry (HIV Monitoring Foundation), the number of HIV diagnoses was again highest among MSM. The number of HIV diagnoses among Dutch heterosexuals also slightly increased the last few years. Permanent alertness and innovative prevention and intervention methods are required to prevent further spread of STI and HIV.
As of June 2006, a total of 11866 HIV cases were reported in the Netherlands; 970 diagnoses in 2005. MSM still accounted for the majority of the cases (52%, n=501). The number of HIV
diagnoses among heterosexual of non-Dutch origin declined from 341 diagnoses in 2002 to 258 in 2005. The number of diagnoses among Dutch heterosexuals slightly increased from 86 in 2002 to 116 in 2005.
In the STI sentinel surveillance network, the number of chlamydia and HIV cases increased by 15% and 25%, however the number of consultations increased as well. Gonorrhoea and syphilis slightly declined with 2% and 7%, respectively. Fifteen percent of all chlamydia, gonorrhoea, and syphilis cases among MSM were seen in HIV positives. Furthermore, in 2005 the percentage of
ciprofloxacin resistance in gonococci has further increased up to 26%. In 2005, the evolution of the LGV outbreak in the Netherlands appears to have slowed down.
Preface
This report presents the annual surveillance data and a review of the epidemiology of sexually transmitted infections (STI) and HIV/AIDS in the Netherlands.
In this report, we have aimed to produce an overview of recent trends and current developments in the field of STI and HIV/AIDS from the available sources. We do not pretend to cover STI and HIV/AIDS in great depth but focus on the issues relevant for the current status of HIV and STI in the Netherlands with commentaries and interpretation of the data. Detailed data supplements are provided in the appendices.
We hope that this report will contribute to a better understanding of the distribution and determinants of STI and HIV/AIDS in the Netherlands and also to improved effectiveness of prevention measures. The information is made accessible for policy makers, researchers in the HIV/AIDS field and anyone with an interest in HIV/AIDS and STI in the Netherlands. More information on HIV/AIDS and STI in the Netherlands is available at www.soahiv.nl and
www.hiv-monitoring.nl.
A copy of this report can also be downloaded in PDF format from www.soahiv.nl.
Acknowledgements
We gratefully acknowledge the collaboration with physicians, public health doctors and nurses, microbiologists, epidemiologists, dermatologists, behavioural scientists, prevention workers and other professionals working in the field of STI and HIV/AIDS. We would like to thank
organisations for their continuing collaboration: HIV Monitoring Foundation (HMF), STI sentinel surveillance network, STI clinics and municipal health services, SOA AIDS Nederland, GGD Nederland, Rutgers Nisso group, NIGZ, HIV Vereniging and Schorer.
Further information
Any comment or suggestions that would improve the usefulness of this report are appreciated and should be sent to soahiv@rivm.nl.
Contents
SAMENVATTING---9
SUMMARY---11
1. INTRODUCTION ---13
2. DIAGNOSED CASES OF HIV AND AIDS ---15
2.1 HIV CASES---15
2.2 NEW HIV DIAGNOSES IN 2005 ---22
2.3 AIDS CASES AND AIDS RELATED DEATHS---23
3. FOCUS ON RISK GROUPS ---25
3.1 YOUNG PEOPLE---25
3.2 MEN WHO HAVE SEX WITH MEN---26
3.3 MIGRANT POPULATIONS---27
3.4 INJECTING DRUG USERS---31
3.5 COMMERCIAL SEX WORKERS AND CLIENTS---32
3.6 STI CLINIC ATTENDEES AND OTHER TEST SITES---33
3.7 HIV CO-INFECTIONS IN TUBERCULOSIS PATIENTS---35
4. GENERAL POPULATION---37
4.1 BLOOD DONORS---37
4.2 PREGNANT WOMEN---38
5. HIV INCIDENCE---41
6. INTERNATIONAL TRENDS OF HIV/AIDS ---43
7. NATIONAL ESTIMATE OF PEOPLE LIVING WITH HIV/AIDS IN 2005 ---47
8. STI CLINIC ATTENDEES ---49
8.1 RECENT TRENDS---49
8.2 CHARACTERISTICS OF ATTENDEES---51
9. GENITAL CHLAMYDIAL INFECTION ---53
9.1 RECENT TRENDS---53
9.2 CHARACTERISTICS OF INFECTION---54
9.3 LABORATORY SURVEILLANCE---55
9.4 INTERNATIONAL TRENDS OF GENITAL CHLAMYDIAL INFECTION---57
10. GONORRHOEA ---59
10.1 RECENT TRENDS---59
10.2 CHARACTERISTICS OF INFECTION---60
10.3 LABORATORY SURVEILLANCE---61
10.4 GONOCOCCAL RESISTANCE IN THE NETHERLANDS---63
10.5 INTERNATIONAL TRENDS OF GONORRHOEA---64
11. SYPHILIS ---67
11.1 RECENT TRENDS---67
11.2 CHARACTERISTICS OF INFECTION---68
12. HEPATITIS B ---71
12.1 RECENT TRENDS---71
12.2 CHARACTERISTICS OF ACUTE HEPATITIS B ---72
12.3 CHRONIC HEPATITIS B ---72
12.4 MOLECULAR EPIDEMIOLOGY OF HBV ---74
12.5 INTERNATIONAL TRENDS OF HEPATITIS B ---75
13. GENITAL WARTS ---77
13.1 RECENT TRENDS---77
13.2 CHARACTERISTICS OF INFECTION---78
13.3 INTERNATIONAL TREND OF GENITAL WARTS---78
14. GENITAL HERPES ---81
14.1 RECENT TRENDS---81
14.2 CHARACTERISTICS OF INFECTION---82
14.3 INTERNATIONAL TREND OF GENITAL HERPES---82
15. LYMPHOGRANULOMA VENEREUM---85
15.1 OUTBREAK OF LGV ---85
15.2 CURRENT STATUS OF THE LGV OUTBREAK---86
16. CONCURRENT STI AND HIV ---89
16.1 KNOWN HIV INFECTED INDIVIDUALS---89
16.2 NEWLY DIAGNOSED HIV INFECTIONS---90
17. FOCUS ON YOUNG PEOPLE, MIGRANT POPULATIONS, MSM ---93
17.1 YOUNG PEOPLE (16-24 YEARS)---93
17.2 MIGRANT POPULATIONS---95
17.3 MEN WHO HAVE SEX WITH MEN---96
18. GENERAL CONCLUSION AND RECOMMENDATIONS ---99
REFERENCES ---105
APPENDIX A: SOURCES OF STI AND HIV/AIDS SURVEILLANCE IN THE NETHERLANDS---113
APPENDIX B: METHODS OF SURVEILLANCE---114
APPENDIX C: TABLES AND FIGURES HIV/AIDS SURVEILLANCE--- 120
APPENDIX D: TABLES AND FIGURES STI SURVEILLANCE--- 132
APPENDIX E: METHODS OF THE NATIONAL ESTIMATE OF PLWHA IN 2005--- 148
APPENDIX F: HIV MONITORING FOUNDATION--- 154
APPENDIX G: STI SENTINEL SURVEILLANCE NETWORK---160
Samenvatting
Hiv/aidsHet aantal volwassenen (15-49 jaar) met hiv/aids in leven is voor 2005 geschat op 18500. In juni 2006 waren in totaal 11866 personen met hiv in Nederland geregistreerd. In 2005 zijn 970 nieuwe hiv-diagnoses gesteld, waarvan 52% bij mannen die seks hebben met mannen (MSM). Vanaf 2002 neemt het aandeel MSM toe. Het aandeel van heteroseksueel geïnfecteerden bleef in 2005 gelijk (39%), maar binnen de groep heteroseksuelen zijn verschuivingen waargenomen. Het aantal hiv-diagnoses bij allochtone heteroseksuelen daalde van 341 hiv-diagnoses in 2002 naar 258 in 2005, terwijl het aantal diagnoses bij autochtone heteroseksuelen steeg van 86 in 2002 naar 116 in 2005. Het aandeel van injecterende druggebruikers is klein (1%).
Bij de soa-centra worden de hoogste percentages hiv-infecties gezien bij MSM (5-6%, 2005). Hiv bij heteroseksuelen varieert van 0,2% tot 0,4%. In de anonieme hiv-surveys onder risicogroepen zijn de hiv-prevalenties het hoogst bij druggebruikende- en transgender prostituees: 11-22%,
respectievelijk 17-20%. Bij migranten uit gebieden met een generaliseerde hiv-epidemie werden hiv-prevalenties van 0-2% waargenomen.
Seksueel overdraagbare aandoeningen
In het soa-peilstation nam het absolute aantal gevallen van chlamydia en hiv toe in 2005 met 15% en 25%, maar ook het aantal testen steeg. Gonorroe en syfilis daalden licht met 2% en 7%. De meeste gevallen van syfilis werden gevonden bij MSM (85% van de infecties bij mannen). Bij MSM nam het percentage positieve hiv-testen toe tussen 2003 en 2005.
Chlamydia blijkt nog steeds de meest voorkomende soa in het peilstation. Bij vrouwen worden de meeste chlamydia en gonorroe infecties gevonden bij vrouwen jonger dan 25 jaar (70%). Gonorroe werd, in vergelijking met chlamydia, vaker gezien bij MSM en bij patiënten die eerder een soa hebben gehad. Enkele etnische groepen (onder andere afkomstig uit Suriname, de Nederlandse Antillen en Aruba) hebben relatief vaker een positieve testuitslag voor chlamydia en gonorroe. In 2005 bleek dat de resistentie tegen ciprofloxacine bij gonorroe verder is toegenomen tot 26%. Het beeld van de virale soa is in 2005 niet erg veranderd. Het aantal genitale wratten - de meest voorkomende virale soa binnen het peilstation - bleef gelijk, evenals hepatitis B, maar het aantal gevallen van genitale herpes steeg. De incidentie van acute hepatitis B in de aangifte is ongeveer gelijk gebleven; er werd alleen een lichte stijging in het aandeel besmettingen door heteroseksueel contact gezien.
De epidemie van LGV bij - overwegend hiv-positieve - MSM heeft tot intensivering van de surveillance geleid en tot eind 2005 zijn 179 gevallen gerapporteerd. In Nederland is het aantal nieuwe LGV-gevallen in 2005 sterk afgenomen en daarmee lijkt de epidemie over zijn hoogtepunt heen te zijn.
Soa bij bekend hiv-positieve personen
Bekend hiv-positieve personen nemen een belangrijk deel van de soa voor hun rekening: 15% van alle gonorroe, chlamydia en syfilis in MSM werd gevonden bij bekend hiv-positieven. In 60%, respectievelijk 51% van de chlamydia en gonorroe gevallen betrof dit een anorectale infectie. Het seksuele risicogedrag bij MSM lijkt onverminderd hoog met een reëel risico op verdere verspreiding van soa en hiv. Continue alertheid en innovatieve methoden in preventie en interventie zijn nodig om verdere verspreiding van soa en hiv te voorkomen.
Summary
HIV/AIDSBy the end of 2005, an estimated 18500 adults (15-49 years) were living with HIV/AIDS in the Netherlands. As of June 2005, a cumulative total of 11866 HIV cases had been reported in the Netherlands. Of the 970 new HIV diagnoses in 2005, MSM accounted for 52%. The proportion of heterosexually acquired infections remains the same in 2005, although within the group of
heterosexuals different trends were observed. The number of HIV diagnoses among non-Dutch heterosexuals declined from 341 diagnoses in 2002 to 258 in 2005, while the number of diagnoses among Dutch heterosexuals increased from 86 in 2002 to 116 in 2005. The proportion of IDU remains fairly small (1%).
At the STI clinics, the highest HIV positivity rates were observed among MSM (5-6%, 2005). HIV positivity rates among heterosexuals varied from 0.2% to 0.4%. Anonymous unlinked HIV surveys showed high prevalence rates among drug using – and transgender CWS: 11-22%, respectively 17-20%. Among migrants from high prevalence countries, HIV prevalence varied between 0% and 2%.
Sexually Transmitted Infections
The increasing trend of STI has continued further in 2005 for chlamydial infections and HIV with 15% and 25% in the STI sentinel surveillance network. However, there was a rise in the number of consultations. Gonorrhoea and syphilis declined slightly with 2% and 7%. MSM accounted for 85% of diagnoses of syphilis in men. Women younger than 25 years had the highest positivity rate of genital chlamydial infection or gonorrhoea. Compared with genital chlamydial infection, gonorrhoea tended to be a more concentrated among MSM and individuals with a prior STI. Specific ethnic minorities (for instance from Surinam, the Netherlands Antilles and Aruba) had higher positivity ratesfor genital chlamydial infection and gonorrhoea.
In 2005, the percentage of ciprofloxacin resistance in gonococci further increased up to 26%. Diagnoses of viral STI did not change significantly in 2005. The number of diagnosed genital warts - the most common viral STI in the sentinel surveillance network - and hepatitis B infections remained stable, but the number of genital herpes slightly increased.
The incidence of notified cases of acute hepatitis B remained stable; only the proportion of transmission by heterosexual contact increased to some extent.
Enhanced surveillance of LGV was started in a response to an outbreak of LGV among predominantly HIV positive MSM. By the end of 2005, a total number of 179 cases had been reported. In the Netherlands, the number of LGV cases significantly declined in 2005, suggesting that the epidemic has already peaked.
Concurrent STI and HIV
Known HIV infected individuals accounted for an important part of STI: 15% of all cases of gonorrhoea, genital chlamydial infection and syphilis in MSM were seen in known HIV infected MSM. Among these, anorectal infections were seen in 60% of the chlamydial infections and in 51% of the gonorrhoea infections. Unsafe sex practices seem to be ongoing in MSM with a potential risk of a further spread of STI and HIV. Permanent alertness and innovative prevention and intervention methods will be needed to prevent a further spread of STI and HIV.
1.
Introduction
This report summarizes surveillance data for HIV/AIDS and STI in the Netherlands. In this report, we have aimed to monitor trends in STI and HIV in the Netherlands and to identify determinants of infection to provide insight in the occurrence of these diseases. It is prepared by the Centre for Infectious Disease Control (CIb) at the National Institute for Public Health and the Environment (RIVM). The CIb collaborates with numerous partners in the field of STI and HIV to collect data for surveillance, for instance STI clinics, municipal health services, the HIV Monitoring
Foundation (HMF), public health laboratories and other health care providers.
Available data on HIV and STI from surveys, national registries and cohort studies are compiled in this report and provide an overview of the current status of HIV and STI in the Netherlands. Preliminary data have been presented at the annual expert meeting on the surveillance of STI and HIV. The objective of the expert meeting is to review the current trends in STI and HIV in the Netherlands and to identify gaps in our knowledge. Based on this evaluation, modifications in current surveillance activities or new surveillance initiatives are suggested to the steering committee of STI and HIV/AIDS surveillance. The steering committee reviews the suggestions and advises the Ministry of VWS to improve the response to the actual HIV and STI situation in the Netherlands. Recommendations for 2006 included the implementation of a national
surveillance of resistance in gonococci as well as the design for behavioural surveillance among subgroups, for instance STI clinic attendees, men having sex with men (MSM), HIV infected persons, ethnic minorities, young people and hard drug users. Finally, a feasibility study was suggested to investigate the contribution of recently acquired HIV infections among newly diagnosed HIV infections.
The information is made accessible for policy makers, researchers in the HIV/AIDS field and anyone with an interest in HIV/AIDS and STI in the Netherlands. More information on
HIV/AIDS and STI in the Netherlands is available at www.soahiv.nl and www.hiv-monitoring.nl.
In chapter 2-7 the results of HIV surveillance are described and in chapter 8-17 the results of STI surveillance. Sources and methods of STI and HIV surveillance are described in Appendix A and B. In Appendix C and D detailed tables and figures are presented. Appendix E describes the methods used for estimating the number of people living with HIV/AIDS in the Netherlands. In Appendix F and G all collaborating partners were listed.
Limitations of data
The data from the STI sentinel surveillance network for 2005 are not completed yet, due to technical problems to extract data from the patient registry at the STI clinic in Amsterdam.
registration of STI consultations), but data on various parameters are still missing (prior STI, prior HIV test, ethnicity, intravenous drug use, client of CSW).
2.
Diagnosed cases of HIV and AIDS
Key points− The total number of adults (15-49 years) living with HIV/AIDS in the Netherlands in 2005 is estimated at 18500 [10000-28000]. The estimated adult prevalence rate was 0.23% [0.1-0.4%]. − A cumulative total of 11866 HIV cases had been reported up to June 2006. In 2005, 970 new
HIV cases were diagnosed (2.7 diagnoses/day).
− In 2005, the proportion of MSM of the annual number of diagnoses was highest (52%). − The number of diagnoses among heterosexuals of Dutch origin increased for both men and
women. Heterosexuals accounted for 39% of the new diagnoses in 2005 and IDU for 1%. − An increasing proportion of MSM and heterosexuals reported to have acquired the HIV
infection in the Netherlands.
− At of end 2005, a cumulative total of 6931 AIDS cases and 4398 deaths among HIV patients were reported.
− HIV prevalence was highest among MSM (0-32%) and IDU (1-26%). HIV prevalence among heterosexuals varied between 0–1.4%.
− Anonymous unlinked surveys showed HIV prevalence rates of 0-3% among female CSW, 11-22% among drug using CSW and 17-20% among transsexual CSW. HIV prevalence among migrant populations varied between 0-2%.
2.1
HIV cases
0 200 400 600 800 1000 1200 <1 98 5 19 85 19 86 19 87 19 88 19 89 19 90 19 91 19 92 19 93 19 94 19 95 19 96 19 97 19 98 19 99 20 00 20 01 20 02 20 03 20 04 20 05 20 06 0 2000 4000 6000 8000 10000 12000 14000Footnote: only HIV patients with a known date of diagnosis are included (ATHENA: 1996-2001, national registration from 2002 to date, 2006: patients registered by June 1st )
In June 2006, a cumulative total of 11866 HIV cases with a known year of diagnosis had been registered by the HIV treatment centres in the national database of the HIV Monitoring Foundation (HMF) [www.hiv-monitoring.nl].1 For 197 cases the year of diagnosis was unknown (excluded
from the analysis). In 2005, 970 new cases of HIV were diagnosed. Of all registered cases, 9170 (77%) were men and 2696 (23%) were women. 98.7% of the individuals were infected with HIV-1, 0.6% with HIV-2 and 0.7% with both HIV-1 and HIV-2.
Geographical differences
Forty two percent of all HIV infected individuals were seen in treatment centres in Amsterdam (Table C.1). Rates of HIV infections per 100000 inhabitants in 2005 are shown for each province in Figure 2.
The province of ‘Noord-Holland’ had the highest HIV rate (12.4/100000), followed by the province of ‘Zuid-Holland’ (7.6/100000). In 2005, the number of HIV diagnoses in Amsterdam remained stable around 300 diagnoses per year. The number of HIV diagnoses out of Amsterdam increased between 1999 and 2004 (in particular in Utrecht and Rotterdam) but seems to have levelled off in 2005 (incomplete due to reporting delay, Figure 3).
Figure 2: Number of HIV diagnoses in 2005 per 100000 inhabitants; calculations based on HIV infections diagnosed in the various HIV treatment centres in each province
0 100 200 300 400 500 600 700 800 <1 98 6 19 86 19 87 19 88 19 89 19 90 19 91 19 92 19 93 19 94 19 95 19 96 19 97 19 98 19 99 20 00 20 01 20 02 20 03 20 04 20 05 Amsterdam out of Amsterdam
Footnote: only HIV patients with a known date of diagnosis are included (ATHENA: 1996-2001, national registration from 2002 to date)
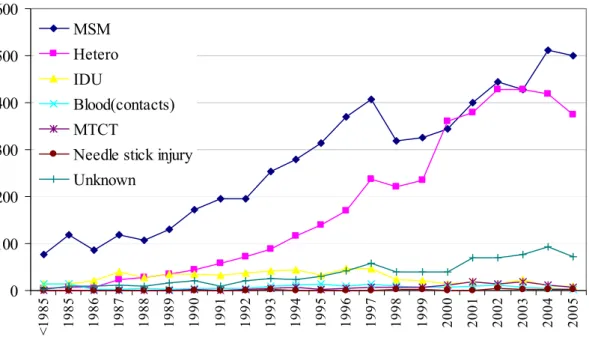
Figure 3: Number of new HIV diagnoses in Amsterdam and out of Amsterdam, by year of HIV diagnosis 0 100 200 300 400 500 600 <1985 1985 1986 1987 1988 1989 1990 1991 1992 1993 1994 1995 1996 1997 1998 1999 2000 2001 2002 2003 2004 2005 MSM Hetero IDU Blood(contacts) MTCT
Needle stick injury Unknown
Footnote: only HIV patients with a known date of diagnosis are included (ATHENA: 1996-2001, national registration from 2002 to date; MSM: men having sex with men, IDU: injecting drug use, MTCT: mother to child transmission
Transmission risk groups
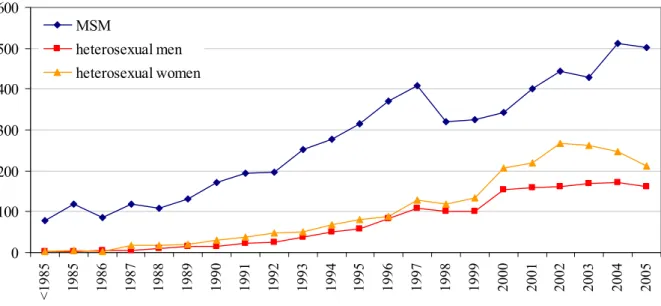
Until 2000, the most frequently reported transmission route for HIV infection was male-to-male sexual contact (Figure 4). Thereafter, the number of HIV diagnoses among heterosexuals increased up to the same level as MSM. In 2004, however, the absolute number of HIV diagnoses among MSM increased again and exceeded the number of diagnoses among heterosexuals (Table C.8, Figure 4). In 2004, HIV diagnoses only increased among MSM (up to 512, Figure 5). In 2005, 501 HIV infections were diagnosed among MSM, but this number may further increase due to the reporting delay. The total number of HIV diagnoses among heterosexual men remained stable since 2000. The total number of diagnoses among heterosexual women decreased slightly after 2002. Only five percent of the HIV infections were diagnosed in IDU. Mother-to-child transmission and risk through blood (products) both accounted for 1% of the infections (Table C.2). No likely route of transmission could be identified in 7% of the HIV cases.
0 100 200 300 400 500 600 <198 5 198 5 198 6 198 7 198 8 198 9 199 0 199 1 199 2 199 3 199 4 199 5 199 6 199 7 199 8 199 9 200 0 200 1 200 2 200 3 200 4 200 5 MSM heterosexual men heterosexual women
Footnote: only HIV patients with a known date of diagnosis are included (ATHENA: 1996-2001, national registration from 2002 to date).
Figure 5: Number of HIV cases by year of HIV diagnosis and sex and sexual preference
The relative contribution of each risk group to the annual number of diagnoses changed over time (Figure 6). The proportion of MSM declined from 58% of the new diagnoses in 1996 to 44% in 2000, and increased thereafter to 52% in 2005. The proportion of heterosexuals increased from 26% in 1996 to 47% in 2000 (particularly among women), and declined again to 39% in 2005
0 10 20 30 40 50 60 70 1996 1997 1998 1999 2000 2001 2002 2003 2004 2005 proport ion (% ) MSM hetero (M) hetero (F) other/unknown
Figure 6: Proportion of annual diagnoses per transmission group, by year of diagnosis Region of origin
Overall, more than half (56%) of the HIV infected individuals originated from the Netherlands. The largest non-Dutch group consisted of sub-Saharan Africans (SSA), 18% of the HIV cases. The second largest non-Dutch group (11%) comprised individuals from the Caribbean and Latin
America, predominantly Surinamese and Antilleans (67%). Most HIV infected men originated from the Netherlands (65%), whereas the largest group among women were those from sub-Saharan Africa (45%, Figure 7).
Figure 7: Geographic distribution of HIV cases, by sex (men: left, women: right)
The majority of MSM originated from the Netherlands (74%, Table 1). Other frequently reported regions were Western Europe (8%), Latin America (6%), the Caribbean (3%) and South (East) Asia (3%). Most IDU were from the Netherlands (67%), other Western European countries (17%), and
Caribbean 3,2% Eastern Europe 0,5% Western Europe 6,9% North America 1,8% Middle East &
North Africa 1,2% Netherlands 64,7% NK 0,7%
South East Asia 2,7% sub-Sahara Africa 9,7% Central Europe 1,5% Australia & NZ 0,3% South America 6,8% South America 8,3% Australia&NZ 0,0% Central Europe 1,0% sub-Sahara Africa 44,7%
South East Asia 4,9%
NK 0,3%
Netherlands 28,3%
Middle East & North Africa 1,0% North America 0,3% Western Europ 5,4% Eastern Europe 0,5% Caribbean 5,1%
Latin America (4%). The majority of the heterosexuals originated from sub-Saharan Africa (44%) and the Netherlands (30%, Table 1).
Table 1: Number of HIV cases, by transmission risk group and region of origin
Region of origin MSM (%) Heterosexual (%) IDU (%)
The Netherlands Western Europe Central Europe Eastern Europe Sub-Saharan Africa Caribbean Latin America North America
North Africa & Middle East Australia & Pacific
South (East) Asia
Not reported/not known
4593 (74%) 474 (8%) 69 (1%) 22 (0.4%) 82 (1%) 174 (3%) 389 (6%) 145 (2%) 32 (0.5%) 20 (0.3%) 176 (3%) 39 (0.6%) 1179 (30%) 132 (3%) 63 (2%) 15 (0.4%) 1759 (44%) 217 (5%) 375 (9%) 6 (0.2%) 61 (2%) 1 (0%) 163 (4%) 9 (0.2%) 403 (67%) 101 (17%) 9 (1%) 15 (2%) 7 (1%) 9 (1%) 23 (4%) 6 (1%) 13 (2%) 1 (0.2%) 12 (2%) 8 (1%) Total 6235 3989 607
Footnote: MSM: men having sex with men; IDU: injecting drug user
The proportion of Dutch HIV infected individuals gradually decreased from 71% in 1992 to 46% in 2002. After 2002, the proportion of Dutch individuals increased again up to 55% in 2005 (Figure 8). 0 100 200 300 400 500 600 1986 1987 1988 1989 1990 1991 1992 1993 1994 1995 1996 1997 1998 1999 2000 2001 2002 2003 2004 2005 Dutch non-Dutch
Footnote: only HIV patients with a known date of diagnosis are included (ATHENA: 1996-2001, national registration from 2002 to date)
Most HIV infected individuals were between 25 and 49 years of age at diagnosis (66%). Men had a median age of 36 years, whereas women were younger: 30 years. In general, non-Dutch individuals were younger than Dutch (Table C.6).
After 2002, the number of HIV diagnoses among heterosexual men of Dutch origin started to rise from approximately 40 HIV diagnoses to 60 cases per year (p<0.001). After 2004, a similar pattern was observed for women of Dutch origin. An opposite trend during that same period was observed for heterosexual men and women originating from SSA (p<0.001) (Figure 9).
Of the heterosexual men of Dutch origin diagnosed after 2002, the majority was ≥ 30 years (90%) at time of diagnosis and 54% was ≥ 40 years. Seventy three percent of these men reported to have acquired the infection in the Netherlands. Another country frequently reported as country of infection was Thailand (12%). Of the Dutch heterosexual women who were recently diagnosed (2004 or thereafter), 67% was ≥ 30 years and 42% was ≥ 40 years. Of these women, 89% reported the Netherlands as most likely country of HIV infection and 11% reported risk abroad.
Footnote: only HIV patients with a known date of diagnosis are included (ATHENA: 1996-2001, national registration from 2002 to date)
Figure 9: Number of HIV cases among heterosexual men and women, by region of origin (left: the Netherlands, right: sub-Saharan Africa) and year of HIV diagnosis
0 10 20 30 40 50 60 70 19 90 19 91 19 92 19 93 19 94 19 95 19 96 19 97 19 98 19 99 20 00 20 01 20 02 20 03 20 04 20 05 Men Women 0 20 40 60 80 100 120 140 160 180 199 0 199 1 199 2 199 3 199 4 199 5 199 6 199 7 199 8 199 9 200 0 200 1 200 2 200 3 200 4 200 5 Men Women
2.2
New HIV diagnoses in 2005
Of the 970 new HIV diagnose in 2005, 746 (77%) were male and 224 (23%) were female. Of those, 90% were infected sexually: 39% through heterosexual contact and 52% through MSM. Of all men, 67% acquired the infection through sex with men. Of all women, 95% acquired the infection
through heterosexual contact. Of all heterosexual cases, 57% were female. Injecting drug use accounted for 1% (n=10) of the new diagnoses and risk through blood (products) for 0.3% (n=3). For 8%, the transmission risk group was undetermined (Table 2).
In 2005, 35% of the cases were diagnosed in Amsterdam (2004: 31%) and 38% (2003: 42%) in Rotterdam, The Hague and Utrecht (Table C.11). Of the newly diagnosed cases, 55% came from the Netherlands, 18% from sub-Saharan Africa, 11% from Latin America and the Caribbean
(Table C.12). Seventy six percent of the cases diagnosed in 2005 were between 25 and 49 years of age. Eighteen cases (1%) were identified among young people (0-19 years). The median age at diagnosis in 2005 was 38 years and differed per risk group: the median age in MSM was 40 years, in heterosexuals 35 years and in IDU 39 years (Table C.13-16).
Table 2: Number of HIV cases diagnosed in 2005, by sex and transmission risk group
Transmission risk group Men (%) Women (%) Total (%) MSM
Heterosexual contact IDU
Blood (products) Mother to child Needle stick injury Other/NK 501 (67%) 162 (21%) 8 (1%) 1 (0.1%) 4 (0.5%) 1 (0.1%) 69 (9%) 0 (0%) 212 (95%) 2 (0.9%) 2 (0.9%) 4 (0.5%) 2 (0.9%) 4 (2%) 501 (52%) 374 (39%) 10 (1%) 3 (0.3%) 6 (0.6%) 3 (0.3%) 73 (8%) Total 746 224 970 NK: not known
2.3
AIDS cases and AIDS related deaths
0 100 200 300 400 500 600 1983 1984 1985 1986 1987 1988 1989 1990 1991 1992 1993 1994 1995 1996 1997 1998 1999 2000 2001 2002 2003 2004 2005 Deaths AIDS casesFootnote: the low value in 1999 is caused by the change in data sources of AIDS cases (sources AIDS cases: AIDS registration Health Inspectorate <2000, HMF ≥2000. Sources deaths: CBS <2002, HMF ≥2002)
Figure 10: Number of AIDS cases and AIDS related deaths
By the end of 2005, a cumulative total of 6931 AIDS cases was registered in the Netherlands (Table C.17-18). The number of new AIDS cases peaked in 1995, and declined sharply over the subsequent four years (Figure 10). Since 1999, the rate of decline had slowed and the curve stabilised around 280 cases per year. The decline of AIDS cases is mainly due to the availability of highly active antiretroviral therapy (HAART), which slowed progression to AIDS.2
The proportion of MSM among reported AIDS cases declined from 77% in 1988 to 43% in 2005. Conversely, the proportion of AIDS cases among heterosexuals increased from 6% in 1988 to 40% in 2005. The proportion of IDU with AIDS fluctuated over the years between 2% and 14%. Overall, in 4% of the AIDS cases the route of transmission remained unknown (Table C.18). The median age at AIDS diagnosis in 2005 was 41 years; men were older than women, respectively 42 and 35 years. On average, Dutch individuals were older at AIDS diagnosis than individuals of African origin: 44 and 32 years (Table C.19-20).
The number of AIDS related deaths showed a similar trend (Figure 10). Between 1983 and 2005, a cumulative total of 4398 HIV infected individuals died of whom 122 died in 2005. HAART had a major effect on AIDS related deaths3 and, as a consequence, the number of people living with HIV and AIDS increased. The estimated numbers of registered HIV- and AIDS patients alive are 10.600 and 2.500, respectively (Figure 11, Figure 12).
0 2000 4000 6000 8000 10000 12000 14000 < 1988 1988 1989 1990 1991 1992 1993 1994 1995 1996 1997 1998 1999 2000 2001 2002 2003 2004 2005
HIV cases, cumulative deaths, registered at HMF HIV patients, alive
* based on individuals with a known year of HIV diagnosis (see also: national report HMF 20061).
Figure 11: Cumulative number of HIV cases, deaths, and HIV patients alive, by calendar year
0 1000 2000 3000 4000 5000 6000 7000 8000 < 1987 1988 1989 1990 1991 1992 1993 1994 1995 1996 1997 1998 1999 2000 2001 2002 2003 2004 2005
AIDS cases, cumulative AIDS deaths, cumulative AIDS patients, alive
Figure 12: Cumulative number of AIDS cases, AIDS deaths, and AIDS patients alive, by calendar year
3.
Focus on risk groups
3.1
Young people
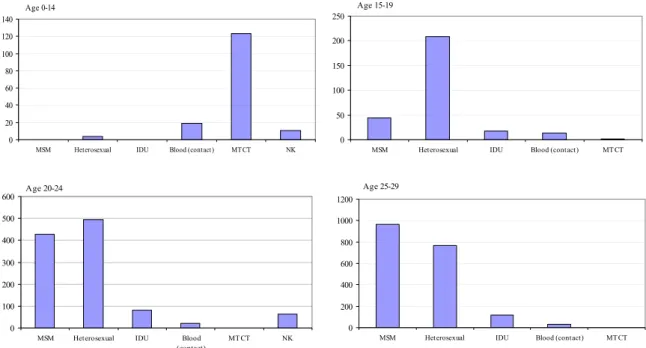
Of all registered HIV cases, 157 are children between 0 and 14 years (1%), 313 (3%) were teenagers between 15 and 19 years, 1088 (9%) were young adults (20-24 years) and 1997 (17%) were
individuals aged 25-29 years. The distribution of the transmission risk groups differed per age group. Children aged 0-14 most often acquired the infection from their mother. Among teenagers aged 15-19, the majority was infected through heterosexual contact; whereas among individuals above 20 years sex between men became increasingly important (Figure 13).
Footnote: MTCT=mother to child transmission, blood(contact): blood(products/needle stick injury); NK: not known/ other Figure 13: Number of HIV infected individuals, by age group and transmission risk group Sixty one percent of the children <15 years were Dutch and 29% were from sub-Saharan Africa. Of children aged 15-19, 58% were from sub-Saharan Africa. Young adults (20-29 years) were from the Netherlands (39%), sub-Saharan Africa (29%) and Latin America/Caribbean (14%).
Age 0-14 0 20 40 60 80 100 120 140
MSM Heterosexual IDU Blood (contact) MT CT NK
Age 15-19 0 50 100 150 200 250
MSM Heterosexual IDU Blood (contact) MT CT
Age 20-24 0 100 200 300 400 500 600
MSM Heterosexual IDU Blood
(contact) MT CT NK Age 25-29 0 200 400 600 800 1000 1200
3.2
Men who have sex with men
The majority of HIV infected MSM was Dutch (74%, Table 1). The absolute number of Dutch MSM increased since 1999 from 228 to 376 in 2005 (Figure 14). The number of MSM from Latin America/Caribbean also showed a slightly increasing trend, despite the
fluctuations.
For 71% of the MSM, the country of infection was known (Table C.23). The majority of the MSM (89%) were infected in the Netherlands (Figure 15); 96% among Dutch MSM and 60% among non-Dutch.
Footnote: only HIV patients with a known date of diagnosis are included (ATHENA: 1996-2001, national registration from 2002 to date; NL=Netherlands, EUW=Western Europe, Car=Caribbean, SSA=sub-Saharan Africa, Zaz=South East Asia) Figure 14: Numbers of HIV diagnoses among MSM from the Netherlands (left) and other geographic regions (right), by year of diagnosis
0 50 100 150 200 250 300 350 400 450 1996 1997 1998 1999 2000 2001 2002 2003 2004 2005 numb er o f d ia g no se s Netherlands abroad unknown
Figure 15: Reported country of infection MSM, by year of diagnosis 0 50 100 150 200 250 300 350 400 450 1990 1991 1992 1993 1994 1995 1996 1997 1998 1999 2000 2001 2002 2003 2004 2005 NL 0 10 20 30 40 50 60 1990 1991 1992 1993 1994 1995 1996 1997 1998 1999 2000 2001 2002 2003 2004 2005 EUW Car SSA Zaz
Of all MSM, 8% was younger than 25 years at HIV diagnosis (Table C.5). Ten percent was 50 years or older. MSM were, on average, younger at HIV diagnosis than heterosexual men (Table 3, Table 4). MSM from the Caribbean and Latin-America were the youngest: 32 years. The oldest were MSM from the Netherlands: 38 years. Over time, age at HIV diagnosis has increased considerably (Figure C.6). For Dutch MSM, the age increased from 32 in 1987 to 41 years in 2005. In 2000, 31% of the MSM were diagnosed at age ≥40. In 2005, this percentage increased up to 47% (Table C.13).
Table 3: Median age (years) of MSM population, by region of origin
Region of origin Age (IQR)
The Netherlands Western Europe Sub-Saharan Africa Caribbean
Latin America South (East) Asia
37.5 (31.5-44.4) 33.3 (28.5-40.0) 32.1 (27.5-38.4) 31.7 (26.9-37.1) 31.8 (27.0-37.3) 34.1 (28.6-40.0)
Footnote: IQR= interquartile range
3.3
Migrant populations
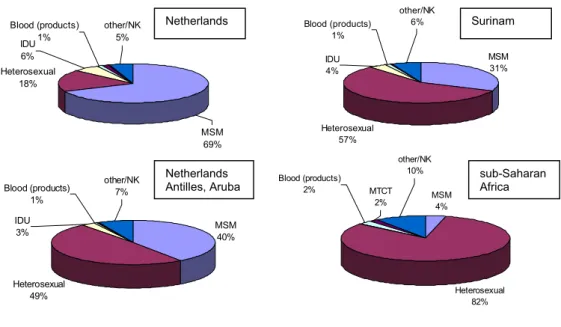
Of all registered HIV patients, 43% were born abroad. The majority (41%) of the migrants originated from sub-Saharan Africa, 25% from Latin America/Caribbean, 15% from Western Europe and 7% from South (East) Asia.
Figure 16 shows the distribution of transmission risk groups among HIV patients for different regions of origin. The largest risk group among the Dutch population was MSM (68%), while MSM only accounted for 4% of the infections among sub-Saharan Africans. The proportions of MSM among individuals from Surinam and the Netherlands Antilles were 32% and 40%, respectively.
Heterosexual 18% Blood (products) 1% IDU 6% other/NK 5% MSM 69% MSM 31% Heterosexual 57% other/NK 6% IDU 4% Blood (products) 1% MSM 40% Heterosexual 49% other/NK 7% Blood (products) 1% IDU 3% MSM 4% Heterosexual 82% Blood (products) 2% other/NK 10% MTCT 2% Netherlands Surinam Netherlands
Antilles, Aruba sub-Saharan Africa
Footnote MTCT: mother to child transmission; IDU: injecting drug use; MSM: men having sex with men; NK: not known Figure 16: HIV infected individuals, by transmission risk group and region of origin Seventy-seven percent of the individuals from sub-Saharan Africa, for whom the country of infection was known (71%), were infected in sub-Saharan Africa. Among Surinamese individuals (country of infection known: 61%), only 25% were infected in Surinam and 73% in the Netherlands (Figure 17). Thirty-eight percent of the individuals from the Netherlands Antilles/Aruba were infected in their region of origin. Most people from Turkey and Morocco reported to have been infected in the Netherlands.
For HIV patients from Surinam or the Netherlands Antilles, the country of infection differed between risk groups: MSM from Surinam or the Netherlands Antilles and heterosexuals from Surinam more often acquired the infection in the Netherlands; whereas heterosexuals from The Netherlands Antilles/ Aruba more often became infected in the country of origin (Figure 18).
Figure 17: HIV patients, by country of birth (textbox) and country of infection (pie)
Figure 18: HIV infected persons from Surinam (left) and the Netherlands Antilles/Aruba (right), by transmission risk group and country of infection
0% 10% 20% 30% 40% 50% 60% 70% 80% 90% 100% MSM Heterosexual country of origin Netherlands Else 0% 10% 20% 30% 40% 50% 60% 70% 80% MSM Heterosexual country of origin Netherlands Else Netherlands 70% Morocco 20% else 10% abroad 7% Netherlands 93% Netherlands 73% Surinam 25% else 2% Netherlands 55% Netherlands Antilles 38% else 7% Netherlands 12% SSA 86% else 2% Netherlands 89% Turkey 8% else 3% Netherlands Surinam sub-Saharan Africa Netherlands Antilles, Aruba Morocco Turkey
0 50 100 150 200 250 1996 1997 1998 1999 2000 2001 2002 2003 2004 2005 n u mber of dia g n oses Netherlands abroad unknown
Figure 19: Reported country of infection heterosexuals, by year of diagnosis Age at diagnosis
Among heterosexual women, African women were the youngest at diagnosis (median age: 28.7 years). Dutch and Western European women were the oldest: 32 and 33 years. Among heterosexual men, Asian men were the oldest (42 years), and African the youngest (34 years) (Table 4). The median age at diagnosis showed no clear trend over time between 2000-2005 for heterosexuals from sub-Saharan Africa, Latin America/Caribbean and the Netherlands (Figure C.5). The median age of MSM clearly increased over time, from 32 years in 1987 to 41 years in 2005 for Dutch men and from 28 years in 1987 to 36 years in 2005 for non-Dutch MSM (Figure C.6).
Table 4: Median age (years) of heterosexual population, by region of origin and sex
Region of origin Men (age/IQR) Women (age/IQR) Total (age/IQR) The Netherlands
Western Europe Sub-Saharan Africa Caribbean
Latin America South (East) Asia
40.4 (33.1-48.9) 35.9 (32.5-45.6) 33.7 (28.3-38.5) 36.4 (30.4-42.9) 37.5 (32.1-46.5) 42.1 (35.3-48.9) 32.3 (26.2-42.2) 32.7 (28.2-40.5) 28.7 (24.0-34.1) 30.9 (24.7-39.0) 30.9 (26.8-37.9) 30.5 (27.4-34.9) 36.5 (29.2-46.0) 35.1 (29.9-42.8) 30.6 (25.0-35.8) 33.2 (26.9-40.1) 34.1 (28.5-41.5) 32.4 (28.1-39.7)
Footnote: IQR= interquartile range
Anonymous unlinked HIV surveys
Sub-Saharan Africans, Surinamese and Antilleans form relatively large migrant populations in the Netherlands. However, little is known about these groups and the determinants of risk
behaviour in the country of origin. To obtain more insight in risk behaviour, ‘intercultural mixing’ (sexual contact between various ethnic groups), and the potential to further spread of HIV, anonymous unlinked surveys were conducted among these populations.
In 2002, the RIVM started HIV surveys among Surinamese, Antilleans and sub-Saharan Africans. Inclusion criteria were as follows:
1. Participant or (at least) one parent is born in Surinam, the Netherlands Antilles or sub-Saharan Africa;
2. Currently living in the Netherlands; 3. Aged between 18-55 years.
Locations for recruitment (for instance festivals, churches, sports events, and community centres) were determined in the course of social mapping together with migrant organizations and the local municipal health service. Between 2002 and 2005, three surveys were conducted in Rotterdam, Amsterdam and The Hague, in collaboration with the local municipal health services.4-6 Results are summarized in Table 5.
Table 5: HIV prevalence and risk behaviour amongst migrants
Region Year of
survey
HIV prevalence Condom
use V steady partner Condom use V casual partner Condom use V casual partner in country of origin Rotterdam 2002/2003 0.0% 9% 43% 77% Amsterdam 2003/2004 0.7% [0.1-2.5%] 15% 53% 65% Surinamese The Hague 2005 0.7% [0.2-2.0%] 12% 46% 73% Rotterdam 2002/2003 0.0% 9% 36% 26% Amsterdam 2003/2004 0.0% 9% 44% 67% Antilleans/ Arubans The Hague 2005 0.6% [0.1-2.1%] 12% 53% 73%
Cape Verdeans Rotterdam 2002/2004 1.0% [0.1-3.8%] 12% 51% 81%
Amsterdam 2003/2004 0.6% [ 0-3.1%] 26% 57% 42%
Ghanaian
The Hague 2005 1.8% [0.6-4.3%] 12% 71% 75%
V Condom use: last 6 months always used condoms
3.4
Injecting drug users
Between 1994 and 2003, 16 surveys among IDU were conducted in the Netherlands. The primary objectives were to monitor HIV prevalence and risk behaviour to assess the potential for further spread of HIV. IDU were enlisted through health care institutions, supplemented by recruitment at street and detainment sites. The study population consists of IDU who use hard drugs regularly and ever injected drugs. Respondents were asked to give a saliva or blood sample for HIV antibody testing and a questionnaire on demographics and risk behaviours.7
Approximately, 3500 IDU participated in the surveys in various cities in the Netherlands. HIV prevalence ranged from 0.5% to 26% (Table 6). The highest prevalence rates were found in Amsterdam (26%) and Heerlen (‘Zuid-Limburg’, 22%). HIV prevalence remained stable in all cities except for Heerlen (1994: 11%, 1996; 16%, 1998/99: 22%).
In the six months preceding the survey, a considerable proportion of the IDU had borrowed syringes or needles from someone else (11-30% of current injectors) and not always used condoms with steady partners (76-96%), casual partners (39-73%) or clients (13-50%). The percentage of IDU reporting recent borrowing of drug equipment decreased in all cities where repeated surveys were conducted.No new surveys among IDU were conducted in the Netherlands after 2003.7
Table 6: HIV prevalence and risk behaviour amongst IDU
Region Year of survey HIV
prevalence Borrowing I Condom use V steady partner Condom use V casual partner Condom use V clients Amsterdam 1996 1998 26% 26% 18% 12% 24% 15% 60% 53% 70% 71% Rotterdam 1994 1997 2002/2003 12% 9% 10% 18% 10% 8% 9% 16% 15% 53% 46% 57% 80% 69% 68% Zuid-LimburgII 1994 1996 1999 10% 12% 14% 19% 17% 10% 14% 13% 11% 39% 61% 51% 87% 83% 75% Utrecht 1996 5% 17% 16% 55% 83% Arnhem 1991/1992 1995/1996 1997 2% 2% 1% 42% 39% 16% na 10% 4% na 49% 47% 60% 79% 78% Groningen 1997/1998 1% 11% 11% 43% 76% BrabantIII 1999 5% 17% 12% 39% 83% The Hague 2000 2% 21% 16% 27% 60% TwenteIV 2000 3% 30% 8% 32% 50%
Footnote: IDU: ever injected drugs and using hard drugs at least once a week (i.e. heroine, cocaine products, amphetamine or methadone) in the six months prior to recruitment I. Percentage of IDU that borrowed used syringes or needles in the last six months. II. Percentage of IDU infected with HIV in Maastricht: 8% (1994), 3% (1996), 5% (1999); in Heerlen: 11% (1994), 17% (1996) en 22% (1999). III. Eindhoven, Helmond, Den Bosch. IV. Almelo, Hengelo, Enschede. V. Condom use: last 6 months always used condoms. NA= not available
3.5
Commercial sex workers and clients
Commercial sex workers (CSW) have many sexual contacts, and their clients may form a bridge to the general population. The anonymous unlinked HIV surveys were also targeted at these potential risk groups. The main purpose was to investigate HIV prevalence, sexual risk behaviour with clients and non-commercial partners, and the mobility of CSW. Between 2002 and 2005, three surveys were conducted in Rotterdam, Amsterdam and The Hague, in
collaboration with the local municipal health services.4-6 CSW were recruited in street-based and establishment-based prostitution venues. Results show that condoms were frequently used with clients, although condom failure was often reported. Condom use with private partners was low (Table 7). In 2004, a pilot among 52 clients of CSW was conducted in Amsterdam to assess the feasibility of an HIV survey in this group. None of the clients were HIV infected
and clients regularly used condoms with CSW (82%). However, condom use with steady and casual partners was relatively low. The results from these surveys among CSW and their clients suggest a potential risk for transmission of HIV to the general population, in particular through drug using and transsexual CSW.
Table 7: HIV prevalence and risk behaviour amongst CSW in Rotterdam and Amsterdam
Region HIV prevalence Condom
use V clients Condom failure with clients* Condom use V steady partner Condom use V casual partner Rotterdam (2002/2003) Total population CSW 7.5% [2.5-12.5%] 88% 49% 15% 25% Street-based CSW 12.7% [3.9-21.5%] 84% 59% 15% 33% Establishment-based CSW 1.9% [0.0-10.3%] 92% 38% 15% 17% Amsterdam (2003/2004) Total population CSW 6.6% [3.5-9.7%] 79% 35% 10% 40% Female CSW 3.1% [1.0-7.2%] 94% 31% 10% 36% Drug using CSW 11.3% [2.8-19.9%] 40% 41% 0% 25% Transsexual CSW 17.2% [5.8-35.8%] 70% 45% 17% 64% The Hague (2005) Total population CSW 3.5% [1.5-6.8%] 79% 39% 11% 36% Female CSW 0.0% [0-1.8%] 80% 38% 11% 37% Drug using CSW 22.2% [3.9-56.2%] 78% 33% 0% 0% Transsexual CSW 20.0% [7.7-38.9%] 68% 44% 17% 40%
V Condom use: last 6 months always used condoms
* Regular condom failure with clients: last 6 months ‘sometimes’ or ‘often’ condom failure with clients
3.6
STI clinic attendees and other test sites
STI clinic attendees are, in general, at higher risk of HIV infection. HIV testing is
recommended whenever a person is examined for or diagnosed with an STI. Table 7 shows trends in HIV positive test results obtained from surveys at STI clinics in Amsterdam and Rotterdam, the STI sentinel surveillance network (since 2003) and Checkpoint, a one-hour HIV testing facility in Amsterdam that started in 2002 and focuses on MSM.8
(www.hivnet.org )
Among MSM, HIV prevalence rates varied between 0-32% (Table 8). HIV prevalence in the anonymous surveys was higher than that in regular HIV tests by name. In the anonymous survey among MSM in Amsterdam, an increase of HIV prevalence was observed over time. The increase, however, was mainly caused by known HIV positive MSM attending the STI clinic. At Checkpoint the HIV prevalence among MSM was 5.7% in 2005, which is
comparable to the prevalence at the regular screening at the STI clinic in Amsterdam and Rotterdam (6.0% and 6.3%, respectively). In total, 860 rapid HIV tests were done at Checkpoint in 2005; a decrease of 8% compared with 2004 and probably caused by the introduction of rapid HIV tests in regular STI clinics.9 HIV prevalence among heterosexual visitors of STI clinics was low (0.2-0.5%) and stable over time.
Table 8: HIV prevalence among STI clinic attendees and other test sites
Region and source 1998 1999 2000 2001 2002 2003 2004 2005
MSM
STI clinic Amsterdam
- Regular
- Anonymous* 4.1 % 9.5 % 12.7 %4.3 % 16.9 %5.7 % 14.6 %4.7 % 20.3 %3.8 % 20.1% 4.2% 18.8%#5.7% 19.4%6.0%
Alternative test site Amsterdam
3.8 % 3.5 % 3.7 % 8.0 % 7.2 % 3.5% 1.8% Ended
STI clinic Rotterdam
- Regular
- Anonymous* 4.4 % 0 % 4.3 %7.2 % 10.8 %1.6 % 12.0 %2.9 % 13.4 %6.2 % 22.4% 1.7% 32.1%4.5% 25.7%6.3%
STI sentinel surveillance network
- - - 3.3% 4.2% 5.0%
Checkpoint - - - - 6.8% 4.8% 4.6% 5.7%
Heterosexual risk groups
STI clinic Amsterdam
- Regular, men - Anonymous, men - Regular, women - Anonymous, women 0.4 % 0.3 % 0.3 % 1.1 % 0.2 % 0.3 % 0.5 % 0.7 % 0.3 % 0.9 % 0.2 % 0.6 % 0.6 % 0.4 % 0.3 % 0.3 % 0.5 % 0.4 % 0.4 % 0.8 % 0.3% 1.0% 0.3% 0.5% 0.2% 0.5%# 0.3% 0.2%# 0.3% 0.0% 0.4% 0.4%
Alternative test site Amsterdam
- Men
- Women 1.0 % 0 % 0.8 %0.6 % 0.4 %0.5 % 0.6 %0 % 0.5 %0.8 % 0% 0% 1.8%0% EndedEnded
STI clinic Rotterdam
- Regular, men - Anonymous, men - Regular, women - Anonymous, women 0.4 % 1.4 % 0.8 % 0.8 % 0.6 % 0.2 % 0 % 0.5 % 0.7 % 0.2 % 0.2 % 0.3 % 0.4 % 0.8 % 0.4 % 0.8 % 0.3 % 0.5 % 0.3 % 0.9 % 0.5% 1.0% 0.3% 1.0% 1.0% 0.9% 0.3% 0.7% 0.3% 0.4% 0.2% 0.5%
STI sentinel surveillance network - Men - Women - - -- -- -- -- 0.3% 0.3% 0.3%0.2% 0.3%0.2% Checkpoint - Men - Women - - -- -- -- 0.8%1.1% 0.3% 1.0% 0.4%0.5% 0.7%0.0% * Known HIV infected included, # based on 1 research period
3.7
HIV co-infections in Tuberculosis patients
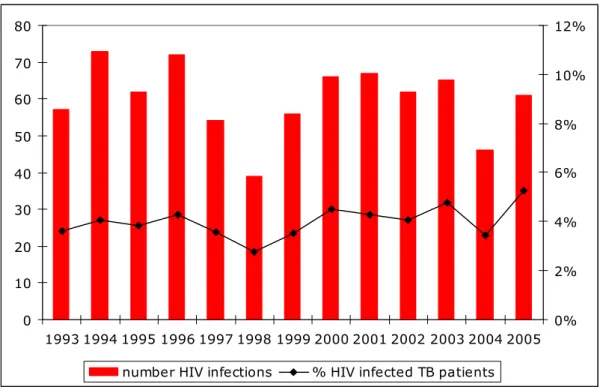
Infections with tuberculosis (TB) are notifiable by law in the Netherlands. Information on the epidemiology and surveillance of TB is collected by the KNCV Tuberculosis Foundation (www.tuberculose.nl). In 2005, 1157 cases diagnosed with TB were notified at the KNCV. Most TB cases were diagnosed among first generation migrants (2004: 65%), of whom the majority originates from African and Asian countries. Of the registered TB patients in 2005, 61 (5.3%) were co-infected with HIV (Figure 20).10 HIV prevalence among TB patients is relatively stable over time. Simultaneous infections of HIV and TB are important to monitor, since TB increases the HIV viral burden, accelerates the clinical course of infection and might interfere with treatment effectiveness. Newly diagnosed TB can therefore be an important event in the identification and treatment of HIV infected persons.
0 10 20 30 40 50 60 70 80 1993 1994 1995 1996 1997 1998 1999 2000 2001 2002 2003 2004 2005 0% 2% 4% 6% 8% 10% 12%
number HIV infections % HIV infected TB patients
Source: KNCV Tuberculosis Foundation
4.
General population
In the Netherlands, the only nationwide ongoing serosurveillance is that of blood donors and pregnant women. These populations are often studied to identify HIV trends in populations at low and moderate risk of HIV infection.
4.1
Blood donors
In 2005, 464138 blood donors were registered in the Netherlands. In total, three HIV infections were found, two in repeat donors and one in a new donor. The overall prevalence and incidence of HIV antibodies was low: new donors: 3.3 per 105 donors (prevalence), regular donors: 0.5 per 105 donor years (incidence). No marked trend over time was observed (Figure 21, Figure 22). 0 2 4 6 8 10 12 14 16 1989 1990 1991 1992 1993 1994 1995 1996 1997 1998 1999 2000 2001 2002 2003 2004 2005
Source: Sanquin Blood Supply Foundation, Amsterdam
0 0,2 0,4 0,6 0,8 1 1,2 1,4 1,6 1,8 1989 1990 1991 1992 1993 1994 1995 1996 1997 1998 1999 2000 2001 2002 2003 2004 2005
Source: Sanquin Blood Supply Foundation, Amsterdam
Figure 22: HIV incidence (per 105 donor years) among regular blood donors in the Netherlands
4.2
Pregnant women
Amsterdam
Since 1988, pregnant women in Amsterdam are tested for HIV in a sentinel surveillance study. Until 2002, HIV prevalence was slightly increasing; the last few years mainly due to an increase of known HIV positive women becoming pregnant (Figure 23). In 2005, HIV
prevalence in this sentinel surveillance was 1.5% (26/1701) which was slightly higher compared with 2004 (1.1%; 19/1752) and 2003 (1.2%; 24/1952).
Since 2003, all pregnant women in Amsterdam are offered an HIV test (opting out method). In 2005, 13239 women were offered an HIV test in Amsterdam (0.05% refused). The total HIV prevalence was 0.25% (33/13232). Of these 33 women, 21 knew their HIV positive status (64%); 27 had a non-Dutch origin (21 sub-Saharan Africa, 2 Surinam/the Netherlands Antilles, 1 Morocco, 1 South America, 1 Thailand and 1 England).11
0 500 1000 1500 2000 2500 1988 1989 1990 1991 1992 1993 1994 1995 1996 1997 1998 1999 2000 2001 2002 2003 2004 2005 0 0,2 0,4 0,6 0,8 1 1,2 1,4 1,6
number of HIV tests HIV prevalence HIV prevalence (new diagnoses)
Figure 23: HIV prevalence (%) and number of tests among pregnant women in Amsterdam (sentinel study)
The Netherlands
Since January 2004, standard screening for HIV is offered to all pregnant women in the Netherlands (opting out method). The HIV test is offered as part of the prenatal screening. The National Vaccination Administration Centre (Landelijke Vereniging Entadministratie) collects the information on HIV test results from the regional vaccination administration centres. Most recent data available is from the first six months of 2004 (published in report 2005).
Approximately 95000 women were tested for HIV. Of those women, 60 were HIV positive (HIV prevalence: 0.06%). The highest prevalence was observed in Amsterdam: 0.17% (9/5385) (Figure 24). New data are not available yet, due to difficulties in different reporting systems. Data will be completed in the next surveillance report in 2007.
0 0,02 0,04 0,06 0,08 0,1 0,12 0,14 0,16 0,18 Limburg Noord-Nederland Noord-Brabant Zeeland Zuid-Holland Amsterdam Rotterdam Gelderland Overijssel/Flevoland Utrecht/Noord-Holland
Source: preliminary data regional vaccination administration centres; M. Witteveen personal communication, CVZ
Figure 24: HIV prevalence (%) among pregnant women in the Netherlands (first 6 months 2004), by geographic region
5.
HIV incidence
The yearly HIV incidences among MSM and drug users are obtained from the Amsterdam Cohort Studies (ACS) on HIV/AIDS. The study population consists of MSM and drug users living in Amsterdam and surroundings. The first enrolment of MSM took place in 1984 including men aged 18-65 years. From June 1995, recruitment was focused on young MSM (≤30 years). However, since April 2006, participation is possible for MSM of all ages with at least one sexual partner in the preceding 6 months.12 For more details:
www.amsterdamcohortstudies.org.
MSM
The HIV incidence among MSM in the ACS in 2005 was estimated at 1.4 per 100 person-years (PY). The last decade, the HIV incidence was relatively stable in the range of 0-2 per 100 PY (Figure 25).12 0 1 2 3 4 5 6 7 1985 1986 1987 1988 1989 1990 1991 1992 1993 1994 1995 1996 1997 1998 1999 2000 2001 2002 2003 2004 2005 Source: Overview of the Amsterdam Cohort Studies among homosexual men and drug users, Health Service, Amsterdam, February 2006
Drug users
The first enrolment of IDU in the ACS took place between 1985 and 1990. From 1998, recruitment was focused on young drug users (≤30 years). No HIV infections were found among IDU from 1999 until 2004. In 2005, two IDU were tested positive (incidence 1.2 per 100 PY). No HIV infections were found among non-injecting drug users in 2005. Among all drug users (including non-injecting) the incidence was 0.7 PY (Figure 26).12
0 1 2 3 4 5 6 7 8 9 1985 1986 1987 1988 1989 1990 1991 1992 1993 1994 1995 1996 1997 1998 1999 2000 2001 2002 2003 2004 2005 Drug users, total Injecting drug users
Source: Overview of the Amsterdam Cohort Studies among homosexual men and drug users, Health Service, Amsterdam, February 2006
Figure 26: Yearly HIV incidence among IDU (30 years or younger at entry) in Amsterdam Cohort Studies
6.
International trends of HIV/AIDS
An estimated 38.6 million people worldwide were living with HIV at the end of 2005. An estimated 4.1 million became newly infected with HIV and an estimated 2.8 million died because of AIDS.13
Europe
In Europe, rates of new HIV diagnoses vary greatly between countries. In 2004, a total number of almost 75000 newly diagnosed cases of HIV were reported in the WHO European Region. The numbers of HIV cases reported in Western (n=23000) and central Europe (n=1600) were low compared to Eastern Europe (n=50000).14 In the Netherlands, HIV
prevalence among adults was estimated at 0.2%,15 which is comparable to the HIV prevalence in other Western and central European countries. The widespread use of HAART resulted in a substantial decline in numbers of AIDS cases and AIDS related deaths in Europe. As a
consequence, after 1998 the number of people living with HIV/AIDS continued to rise. While AIDS incidence has been declining in Europe as a whole, it has increased continuously in Eastern Europe and for the first time in 2004 has exceeded that of the west (27.4 versus 19.5 per million).16
In the European region, the majority of newly diagnosed HIV cases in 2004 from which the transmission route was reported (data missing for 23%) were infected through heterosexual contact (56%), 31% were in MSM and 12% in IDU. Since 2001, there has been an increase in the number of cases with a reported heterosexual transmission group, especially among individuals originating from countries with generalised epidemics and amongst MSM. Recent increases in HIV and AIDS in some Western European countries raise important concerns about the vulnerability of migrants, treatment adherence, weakening government commitment or ineffective prevention efforts.17
After a long period of continuing decline, the number of new HIV diagnoses among MSM has continued to increase since 2000. HIV prevalence studies suggest levels among specific populations of MSM are in the range of 10-20% in Western Europe, but much lower in Eastern Europe (< 5%).14 Increases in risky sexual behaviour in a highly prevalent HIV population, together with rising trends in STI, may have lead to an expansion of HIV transmission among MSM.
In most Western European countries, steady declines in HIV prevalence among injecting drug users (IDU) occurred throughout the 1990s, reflecting the success in past prevention
the number of new diagnoses is now declining. However, the situation in the east remains alarming due to the fast increasing number of people living with HIV, including large
numbers of young people. These people can potentially transmit HIV to their sex partners and indeed, the number of heterosexual infections is rising in Eastern Europe. Reporting rates were the highest in Estonia, Latvia, the Russian Federation and Ukraine.14 In Eastern Europe, the HIV prevalence among adults was estimated at 0.8%.18
Figure 27: Cumulative number of reported HIV, AIDS and AIDS deaths in all of WHO/Europe countries per year (source: WHO Europe, 2006)
Other regions
Sub-Saharan Africa remains the worst-affected region in the world (Figure 28). HIV
prevalence is highest in sub-Saharan Africa with an estimated prevalence in adults of 6.1%. In some (mainly southern) countries the estimated national HIV prevalence among adults is more than 30% (for instance Swaziland). An estimated 25 million people are living with HIV/AIDS in sub-Saharan Africa, which is almost 64% of all people worldwide living with HIV. Overall, HIV prevalence in this region appears to be levelling off, albeit at exceptionally high levels in southern Africa. Such apparent ‘stabilization’ of the epidemic reflects situations where the numbers of people being newly infected with HIV roughly match the numbers of people dying of AIDS related illnesses.13 The major transmission route in sub-Saharan Africa is heterosexual contact.
Latest estimates show some 8.3 million people were living with HIV in Asia at the end of 2005, more than two-thirds of them in one country, India. The epidemic in Asia remains largely concentrated in IDU, sex workers, their clients and (largely hidden) in MSM. The overlap between paid sex and injecting drug use has a significant impact on HIV spread. There is an urgent need for strategies that reduce needle-sharing and sexual risk-taking. Thailand has been successful in fighting HIV. However, Thailand’s prevention efforts appear not to be matching recent changes in its epidemic. New infections occur in women infected by their long-term partners and in MSM. Meanwhile, condom use during paid sex is levelling off.13
In the Caribbean, high HIV prevalence rates (>3%) were observed in the Bahamas, Haiti, and over 2% in Trinidad and Tobago. Overall, with a few exceptions, the Caribbean’s epidemics have stayed relatively stable in recent years. Unprotected heterosexual intercourse is the main mode of HIV transmission. Yet, one in ten of the reported HIV infections in this region is attributable to unprotected sex between men.13
Latin America’s biggest epidemics are in the countries with the largest populations, notably Brazil. The most intense epidemics, however, are underway in the smaller countries of Belize and Honduras. The epidemic in Latin America is concentrated among populations at high risk of HIV infection: IDU and MSM. HIV transmission between female sex workers and their clients is another significant, though less prominent factor in the spread of HIV.13
7.
National estimate of people living with HIV/AIDS in 2005
The Point Prevalence workbook, developed by UNAIDS/WHO, was used to estimate the number of people living with HIV and AIDS (PLWHA) in the Netherlands in 2005. The workbook program is useful for estimates and short term projections of HIV/AIDS in countries with low level and concentrated epidemics.19 Estimating the number anddistribution of PLWHA is important in deciding how prevention and surveillance resources should be allocated, as well as planning care and support needs on a national scale.
The workbook approach focuses on defining populations highly exposed to HIV and the spread of HIV to groups less exposed. Estimates of population sizes and HIV prevalence rates were used to calculate the number of PLWHA in the Netherlands.19 The total estimate of the number of PLWHA is the sum of the number of PLWHA among the high risk groups and among populations at lower risk.
For the estimate, we divided the Netherlands into two different geographical regions: Amsterdam and the remaining regions. The following high-risk groups were included: IDU, MSM, migrant populations from high prevalence countries, CSW, and STI clinic attendees. HIV prevalence in low-risk groups was calculated by using HIV data from pregnant women. For details on methods and results: Appendix E.
Table 9: Estimate of PLWHA in the Netherlands in 2005 and 2003
National Estimates for year: 2005 2003
Number of Adults (15-49) LWHA 18500 16400
Adult Prevalence (15-49) 0.23% 0.20%
Number of Women (15-49) LWHA 6400 5400
% of adults (15-49) who are women 35% 33%
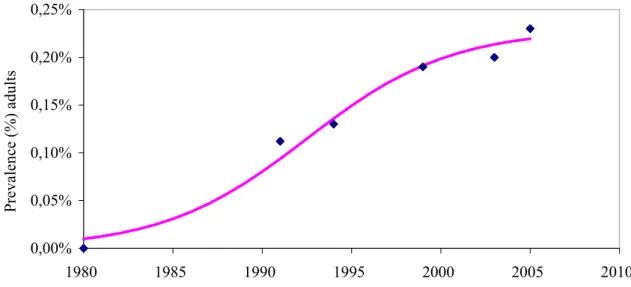
The total number of adults (15-49 years) living with HIV/AIDS in the Netherlands in 2005 was estimated at 18500 [10000 - 28000] (Table 9).15 The number of heterosexuals and MSM were estimated at respectively 9000 and 8500.
HIV prevalence among adults in 2005 was estimated at 0.23% [0.1%-0.4%] and slightly increased over time. In 2003, 1999 and 1991, HIV prevalence rates were estimated at respectively 0.20% (16400), 0.19% (15000) and 0.11% (7000) (Figure 29). HIV prevalence among IDU, MSM and CSW were estimated at 8.6%, 5.3% and 2.7%, respectively.15
0,00% 0,05% 0,10% 0,15% 0,20% 0,25% 1980 1985 1990 1995 2000 2005 2010 Pr evalence (%) adu lts
Figure 29: Epidemic curve based on the estimated HIV prevalence in adults (15-49 years) in the Netherlands
8.
STI clinic attendees
Key points− In 2005, 52278 new consultations were registered in the STI sentinel surveillance network. − In 2005, the number of consultations increased by 5% compared with 2004.
− Characteristics of clinic attendees were as follows: young age (39% below 25 years), Dutch origin (76%), MSM (29%) and commercial sex workers (9%), 18% had a history of STI and 64% was not previously tested for HIV.
NB. Limitations of data: data from the Amsterdam STI clinic are incomplete for 2004 en 2005. Data on clients of CSW, history of STI, prior HIV testing, injecting drug use and reason for consultation (among other presence of symptoms) and part of the data about ethnicity in 2004 are missing. For this reason, national comparison for these variables with preceding years is hampered.
NA Amsterdam = data not available for STI clinic Amsterdam.
8.1
Recent trends
In 2005, 52278 new consultations (increase of 5% compared to 2004 and 23% compared to 2003) were registered within the STI sentinel surveillance network; 27461 (53%) among men, 24795 (47%) among women and 22 (0.0%) among transsexuals (Table D.1). Forty-two percent of these were reported by the STI clinic in Amsterdam. Twenty three percent of the attendees had an STI examination, 57% had both an STI examination and an HIV test (2003: 43%; 2004: 53%) and 1% had only an HIV test (Figure 30).
HIV test STI examination Both
No test
No test and no diagnosis